Article

Positive Results of an Early Intervention Strategy to Suppress a Spruce Budworm Outbreak after Five Years of Trials

1
Faculty of Forestry and Environmental Management, University of New Brunswick, Fredericton, NB E3B 5A3, Canada
2
Forest Protection Limited, Lincoln, NB E3B 7E6, Canada
3
New Brunswick Department of Energy and Resource Development, Fredericton, NB E3B 5H1, Canada
4
Canadian Forest Service, Atlantic Forest Centre, Fredericton, NB E3B 5P7, Canada
5
Canadian Forest Service, Laurentian Forest Centre, Ste. Foy, QC G1V 4C7, Canada
*
Author to whom correspondence should be addressed.
Forests 2019, 10(5), 448; https://doi.org/10.3390/f10050448
Submission received: 24 April 2019 / Revised: 15 May 2019 / Accepted: 21 May 2019 / Published: 23 May 2019
(This article belongs to the Special Issue Protection Strategy against Spruce Budworm)

Abstract

:
Spruce budworm (Choristoneura fumiferana Clem.; SBW) outbreaks are one of the dominant natural disturbances in North America, having killed balsam fir (Abies balsamea (L.) Mill.) and spruce (Picea sp.) trees over tens of millions of hectares. Responses to past SBW outbreaks have included the aerial application of insecticides to limit defoliation and keep trees alive, salvage harvesting of dead and dying trees, or doing nothing and accepting the resulting timber losses. We tested a new ‘early intervention strategy’ (EIS) focused on suppressing rising SBW populations before major defoliation occurs, from 2014 to 2018 in New Brunswick, Canada. The EIS approach included: (1) intensive monitoring of overwintering SBW to detect ‘hot spots’ of low but rising populations; (2) targeted insecticide treatment to prevent spread; and (3) proactive public communications and engagement on project activities and results. This is the first attempt of area-wide (all areas within the jurisdiction of the province of New Brunswick) management of a native forest insect population. The project was conducted by a consortium of government, forest industry, researchers, and other partners. We developed a treatment priority and blocking model to optimize planning and efficacy of EIS SBW insecticide treatment programs. Following 5 years of over 420,000 ha of EIS treatments of low but increasing SBW populations, second instar larvae (L2) SBW levels across northern New Brunswick were found to be considerably lower than populations in adjacent Québec. Treatments increased from 4500 ha in 2014, to 56,600 ha in 2016, and to 199,000 ha in 2018. SBW populations in blocks treated with Bacillus thuringiensis or tebufenozide insecticide were consistently reduced, and generally did not require treatment in the subsequent year. Areas requiring treatment increased up to 2018, but SBW L2 populations showed over 90% reductions in that year. Although this may be a temporary annual decline in SBW population increases, it is counter to continued increases in Québec. Following 5 years of tests, the EIS appears to be effective in reducing the SBW outbreak.

1. Introduction

The spruce budworm (Choristoneura fumiferana Clem.; SBW) outbreak in eastern Canada and Maine from 1967 to 1993 was the dominant natural disturbance in the region, peaking at over 50 million hectares of defoliation [1]. Outbreaks (repeated annual defoliation typically lasting up to 10 years) results in growth reduction of up to 90% [2], tree mortality in balsam fir (Abies balsamea (L.) Mill.)-spruce (Picea sp.) forests often exceeding 85% [3,4], and changes in regeneration patterns [5]. SBW outbreaks also affect forest landscape structure (i.e., stand species composition and spatial configuration) with consequences for forest succession [6], timber production [7], and the risk of future disturbances such as fire [8]. Several papers have reviewed SBW and other insect outbreak effects on tree mortality [3], stand development and ecosystem responses [9,10], and ecological mechanisms of SBW population changes during outbreaks [11,12,13]. Defoliation associated with larval feeding caused timber volume losses estimated at up to 44 million m3 per year, or 30% of the total Canadian timber harvest in 2012. To limit timber supply shortfalls and the economic impact of SBW, at the peak of the last outbreak, 6.9 million hectares of forest was treated with insecticide in Canada in 1976, primarily in the provinces of Québec and New Brunswick [14]. In Québec, mortality losses during the 1967 to 1992 SBW outbreak were estimated at 238 million m3 of spruce and balsam fir, with an estimated similar additional amount of reduced growth [15]. The total losses from the SBW outbreak in Québec had an estimated commercial value of $12.5 billion [16].
Forest species composition affects SBW defoliation in several ways, and understanding these effects is important in setting criteria and prioritizing areas for SBW control treatments. SBW defoliation differs among host species [17], with balsam fir the most defoliated and white spruce (Picea glauca [Moench] Voss), red spruce (Picea rubens Sarg.), and black spruce (Picea mariana [Mill.] B.S.P.) having approximately 72%, 41%, and 28% as much defoliation as balsam fir, respectively [17]. In addition, several studies have reported lower SBW defoliation of balsam fir, and lower resulting growth reduction and mortality, in stands or landscapes with higher proportions of broadleaved, hardwood species [3,18,19]. In 25 plots in northern New Brunswick over a 5-year period in the last stages of the 1970s–1990s SBW outbreak, defoliation of balsam fir was <15% with >80% hardwood content, compared to 58%–71% when hardwood content was <40% [19]. Tree-ring analysis also showed that SBW-caused growth reductions were twice as high (40%) in stands with <50% hardwood content, compared to 20% in stands with >50% hardwood content [20]. Fir-hardwood stands (~30% hardwood content) also sustained 14%–30% less SBW-caused fir mortality than in fir-dominated stands [3,18].
Forests in New Brunswick are composed of 85% species susceptible to SBW [21] and have undergone defoliation of up to 3.6 million ha in 1975 [1]. As a result, there has been a strong commitment to insecticide treatment in this jurisdiction, with an average of 2.0 million hectares per year treated from 1970–1983, at an average cost of $4 per hectare or $7.7 million per year. Today, owing to inflation and increased pest control product and application costs (currently $40 or $80 per hectare, depending on whether one or two applications per year), a similar protection strategy on 2 million hectares would cost between $80–$160 million per year. In a 2007 survey of the New Brunswick public [22], 94% of respondents supported funding research and development on pest control, and 82% supported controlling future SBW outbreaks.
Two detailed studies have quantified the potential timber supply and economic impacts of SBW outbreak scenarios in New Brunswick, which provided much of the rationale for continued pest control research on the topic. Hennigar et al. [21] determined that timber harvest reductions, relative to a no defoliation case, for the 3.0 million ha of Crown land in New Brunswick were projected to reach 18% and 25% by 2052, under moderate and severe outbreak defoliation scenarios from 2012–2032. Up to 30% to 50% of these reductions were projected to be avoided through insecticide treatments, depending on the outbreak scenario. Peak wood supply reduction of 25% was projected during the period of defoliation, but impacts also greatly reduced the large increases in wood supply projected from 2042–2062 that would otherwise result from long-term silviculture. Chang et al. [7,23] estimated the costs of SBW outbreak scenarios and benefits of treatments based on the Hennigar et al. [21] timber supply projections. Under uncontrolled moderate and severe SBW outbreak scenarios, total output in the New Brunswick economy over the 2012–2041 period was projected to decline in present value terms by $3.3 billion (CAD) and $4.7 billion, respectively. SBW control was projected to reduce the negative impacts on economic output by up to 66% when protecting 40% of susceptible forests. Combining SBW control with re-scheduling harvests and a salvage strategy under moderate and severe outbreaks was projected to reduce the negative impacts on output by a further 1%–18%, depending on the level of control implemented [7].
Eastern North America is now undergoing another SBW outbreak that began in northern Québec in about 2005 [24]. In the past, SBW outbreaks have been managed through a reactive “foliage protection” approach focused on keeping trees alive, whereby areas are treated following some defoliation but before tree mortality occurs [25,26,27]. This approach usually has required that at least 2 years of moderate-severe current-year defoliation occur before allowing insecticide treatment, because it typically takes 4–5 years of defoliation to kill trees [3]. The main goal of SBW control programs in eastern Canada is to protect the trees’ current-year foliage (target 50% current foliage retained in Québec, 60% in New Brunswick) in order to ensure tree survival and limit wood losses during outbreaks [28]. Insecticide applications every 2 years in balsam fir and white spruce stands and every 3 years in black spruce-dominated stands provides an adequate level of protection to reduce growth losses (maintain the residual photosynthetic capacity above 39%), while reducing the number of required annual insecticide applications [28].
While a foliage protection strategy will reduce SBW-caused tree mortality, it cannot suppress the overall rise or spread of outbreaks. As an alternative to this long-standing approach, we are testing an Early Intervention Strategy (EIS) to suppress SBW populations in New Brunswick, which involves: (i) intensive monitoring and early detection of low-level increases of SBW populations, before substantial defoliation occurs; and (ii) small area, target-specific application of insecticides to locations with rising SBW populations. Recent advances in our understanding of SBW population dynamics [29] have prompted efforts to develop this new EIS approach to managing SBW. It is the first attempt of area-wide management (within the currently funded trial area of Atlantic Canada) of a native defoliating insect. EIS focuses on controlling relatively low-density populations along the leading edge of outbreaks as a way of containing outbreak spread. Important science considerations addressed include what SBW density to initiate an EIS; what insecticide products are effective; what are the consequences of treatments on natural enemy populations attacking SBW in subsequent years; what new decision-support tools and technology need to be developed to optimize treatments; and the assessment of costs and benefits.
The EIS program shares many characteristics with area-wide containment programs used to contain invasive species, such as the “Slow the Spread” program for gypsy moth (Lymantria dispar Linnaeus) in the United States [30,31]. Many practical and theoretical considerations underlie the development of a pest containment program, which in essence is a population control program. These include how to monitor and decide when and where to treat hot spots; what pest control products should be used; whether pest control treatments result in additive mortality (i.e., mortality in addition to what would otherwise occur naturally) and thereby drive population decline; and whether mass moth dispersal beyond the leading edge of the outbreak might offset treatment efficacy.
In addition, given that natural enemies (parasitoids in particular) are a major source of natural SBW control [32], evaluation of whether treatments adversely affect natural enemy populations and thereby reduce natural mortality rates of SBW is required. Most of the key parasitoids thought to control SBW are generalists that attack other herbivores when SBW densities are low and these may be adversely affected if a low-density population is treated [32,33]. Unwanted impacts of treatments on the general parasitoid community could promote SBW in years following treatment, if parasitoids are reduced by insecticide-induced SBW mortality or through alternative hosts mortality.
From 2014–2018, EIS research trials were conducted by a consortium termed the Healthy Forest Partnership, encompassing the Governments of Canada and New Brunswick, Natural Resources Canada, universities, and forest industry (www.healthyforestpartnership.ca). In addition to SBW monitoring and EIS control measures designed to suppress populations, the research included longer-term understanding of effects of natural enemies, factors affecting outbreak initiation, inoculation of seedlings with endophytic fungi to increase host resistance [34,35] and improving decision support capabilities to facilitate planning. The project engaged participation of the region’s leading forestry companies, universities, and federal and provincial research agencies. We put considerable effort into clear, timely communication of the details of the infestation, treatments, impacts to human health and ecosystems, and research results to the public and stakeholders.
We developed a new treatment priority and blocking model to optimize planning of annual EIS SBW insecticide treatment programs, by directing treatments to the highest priority areas to maximize reductions of SBW L2 populations. Herein we use the term ‘block’ to designate a contiguous area, typically rectangular in shape, designed for treatment with insecticide using a series of aircraft flight swaths. The model aims to minimize the cost and effort required to achieve a given pest control objective, optimizing use of Bacillus thuringiensis var. Kurstaki (Btk) or tebufenozide pest control products and application technologies. It was based upon elements of the SBW Decision Support System (DSS), which includes stand and forest-level models and a GIS that projects effects of SBW defoliation and management/treatment strategies on stand growth, timber supply, and economic indicators [29,36,37,38]. The DSS permits users to integrate forest harvest planning, protection using pesticides, and salvage, within a spatial optimization framework, to reduce losses to SBW [37]. The most recent version of the SBW DSS is termed the Accuair Forest Protection Optimization System (ForPRO) [39], which optimizes treatment schedules to reduce losses, prioritizes areas to be treated, determines impacts on harvest levels, and integrates salvage activities with protection.
In this paper, we will present and discuss 5-year interim results of EIS SBW monitoring and treatment trials conducted in New Brunswick from 2014–2018. Objectives are: (1) to develop and test an EIS SBW insecticide treatment priority and blocking model (where ‘blocks’ refer to typically rectangular areas defined for aircraft delivery of insecticide) to optimize planning and direct treatments to the highest priority areas and maximize SBW population reductions; and (2) evaluate the effectiveness of EIS control treatments conducted from 2014 to 2018 and their impacts on SBW population trends. Our underlying hypothesis is that intensive monitoring and treatment of rising SBW ‘hot spots’ with insecticide, before defoliation occurs, can delay, prevent, or reduce the severity of a native insect outbreak. If successful, an EIS approach has the potential to reduce or eliminate the high levels of defoliation that can only be reduced by a foliage protection approach.

2. Methods

2.1. Monitoring and Detection of SBW ‘Hot Spots’

Monitoring of SBW populations for EIS treatments was conducted using a combination of SBW pheromone trapping, intensive second-instar larval (L2) population surveys based on branch sampling, and aerial defoliation surveys. L2 population surveys were the primary data source to indicate rising SBW populations, because they directly measure the overwintering larvae that cause defoliation in the following summer. Pheromone traps were located in susceptible forests and were helpful for identifying areas where additional L2 monitoring plots might be needed. A large number of points (1136–1964 per year; Table 1) were sampled, with emphasis on northern New Brunswick due to its proximity to the Québec SBW outbreak (Figure 1). The L2 branch sampling was done in the fall/winter and thus years in Table 1 and Figure 1 relate to that period, but determine what was treated in the following summer. Each sample point consisted of sampling one mid-crown branch from each of three balsam fir or spruce trees. A key feature of the EIS sampling was that forest industry crews assisted New Brunswick Department of Energy and Resource Development (NB ERD) staff in collecting branches for L2 sampling, as part of their contribution to resources for the project. SBW overwinters as L2 in a hibernaculum spun under bark scales and lichen on the host tree, and the hibernaculum can be destroyed and larva washed from the foliage with a sodium hydroxide solution [40]. Sampled branches were bagged and transported to the NB ERD lab, where they underwent a sodium hydroxide wash, filtering, and counting under a microscope [40] to determine the number of overwintering L2 SBW per branch, as an estimate of populations in the subsequent season. The annual SBW L2 data are publicly available at www.healthyforestpartnership.ca. A threshold of 7 L2/branch (rounded; an actual mean of three branches >6.5 L2/branch) was proposed to plan treatments because above this threshold, populations were expected to increase. The threshold was estimated based on SBW population data collected in the Lower St-Lawrence region of Québec between 2012 and 2015, during the rise of the current outbreak in that area. It was calculated from the average L4 density that led to an annual population growth rate just under 1, given the observed density dependence of generation survival, an average apparent fecundity of 60 eggs per surviving adult, and average mortality from egg to L4 in the next generation. The threshold was then modified to translate from L4 to overwintering L2.

2.2. Incorporation of Effects of Forest Species Composition on SBW Dynamics

The results of two recent studies have helped focus use of tree species in our treatment priority algorithm. Zhang et al. [41] tested effects of hardwood composition on defoliation during the initiation phase (first 5 years) of a SBW outbreak in a gradient of 27 fir-hardwood plots selected to represent three percent hardwood basal area classes (0%–25%, 40%–65%, and 75%–95%). Fir defoliation was significantly lower (p < 0.001) as hardwood content increased, but the relationship varied with overall defoliation severity each year. Annual plot defoliation in fir-hardwood plots, estimated using Random Forests prediction incorporating 11 predictor variables, yielded a correlation of 0.92 compared to measured defoliation. Average defoliation severity in softwood plots and % hardwood content were the most influential variables. Bognounou et al. [42] compared stands dominated by highly vulnerable balsam fir, stands dominated by low vulnerability black spruce, and mixed composition stands (fir and black spruce). They found resource concentration effects on the primary host (balsam fir) during the increasing outbreak phase in fir-dominated and mixed stands. Balsam fir, the most susceptible species, depended more on immediate neighboring trees and thus associational effect, whereas black spruce, the less preferred host, showed a greater resource dilution effect from neighboring trees [42]. A stand spruce-fir content threshold of above 20% was selected for use in our treatment priority algorithm and fir-spruce differences could potentially be incorporated.

2.3. Development of the Optimum Pest Control Treatment Priority Model

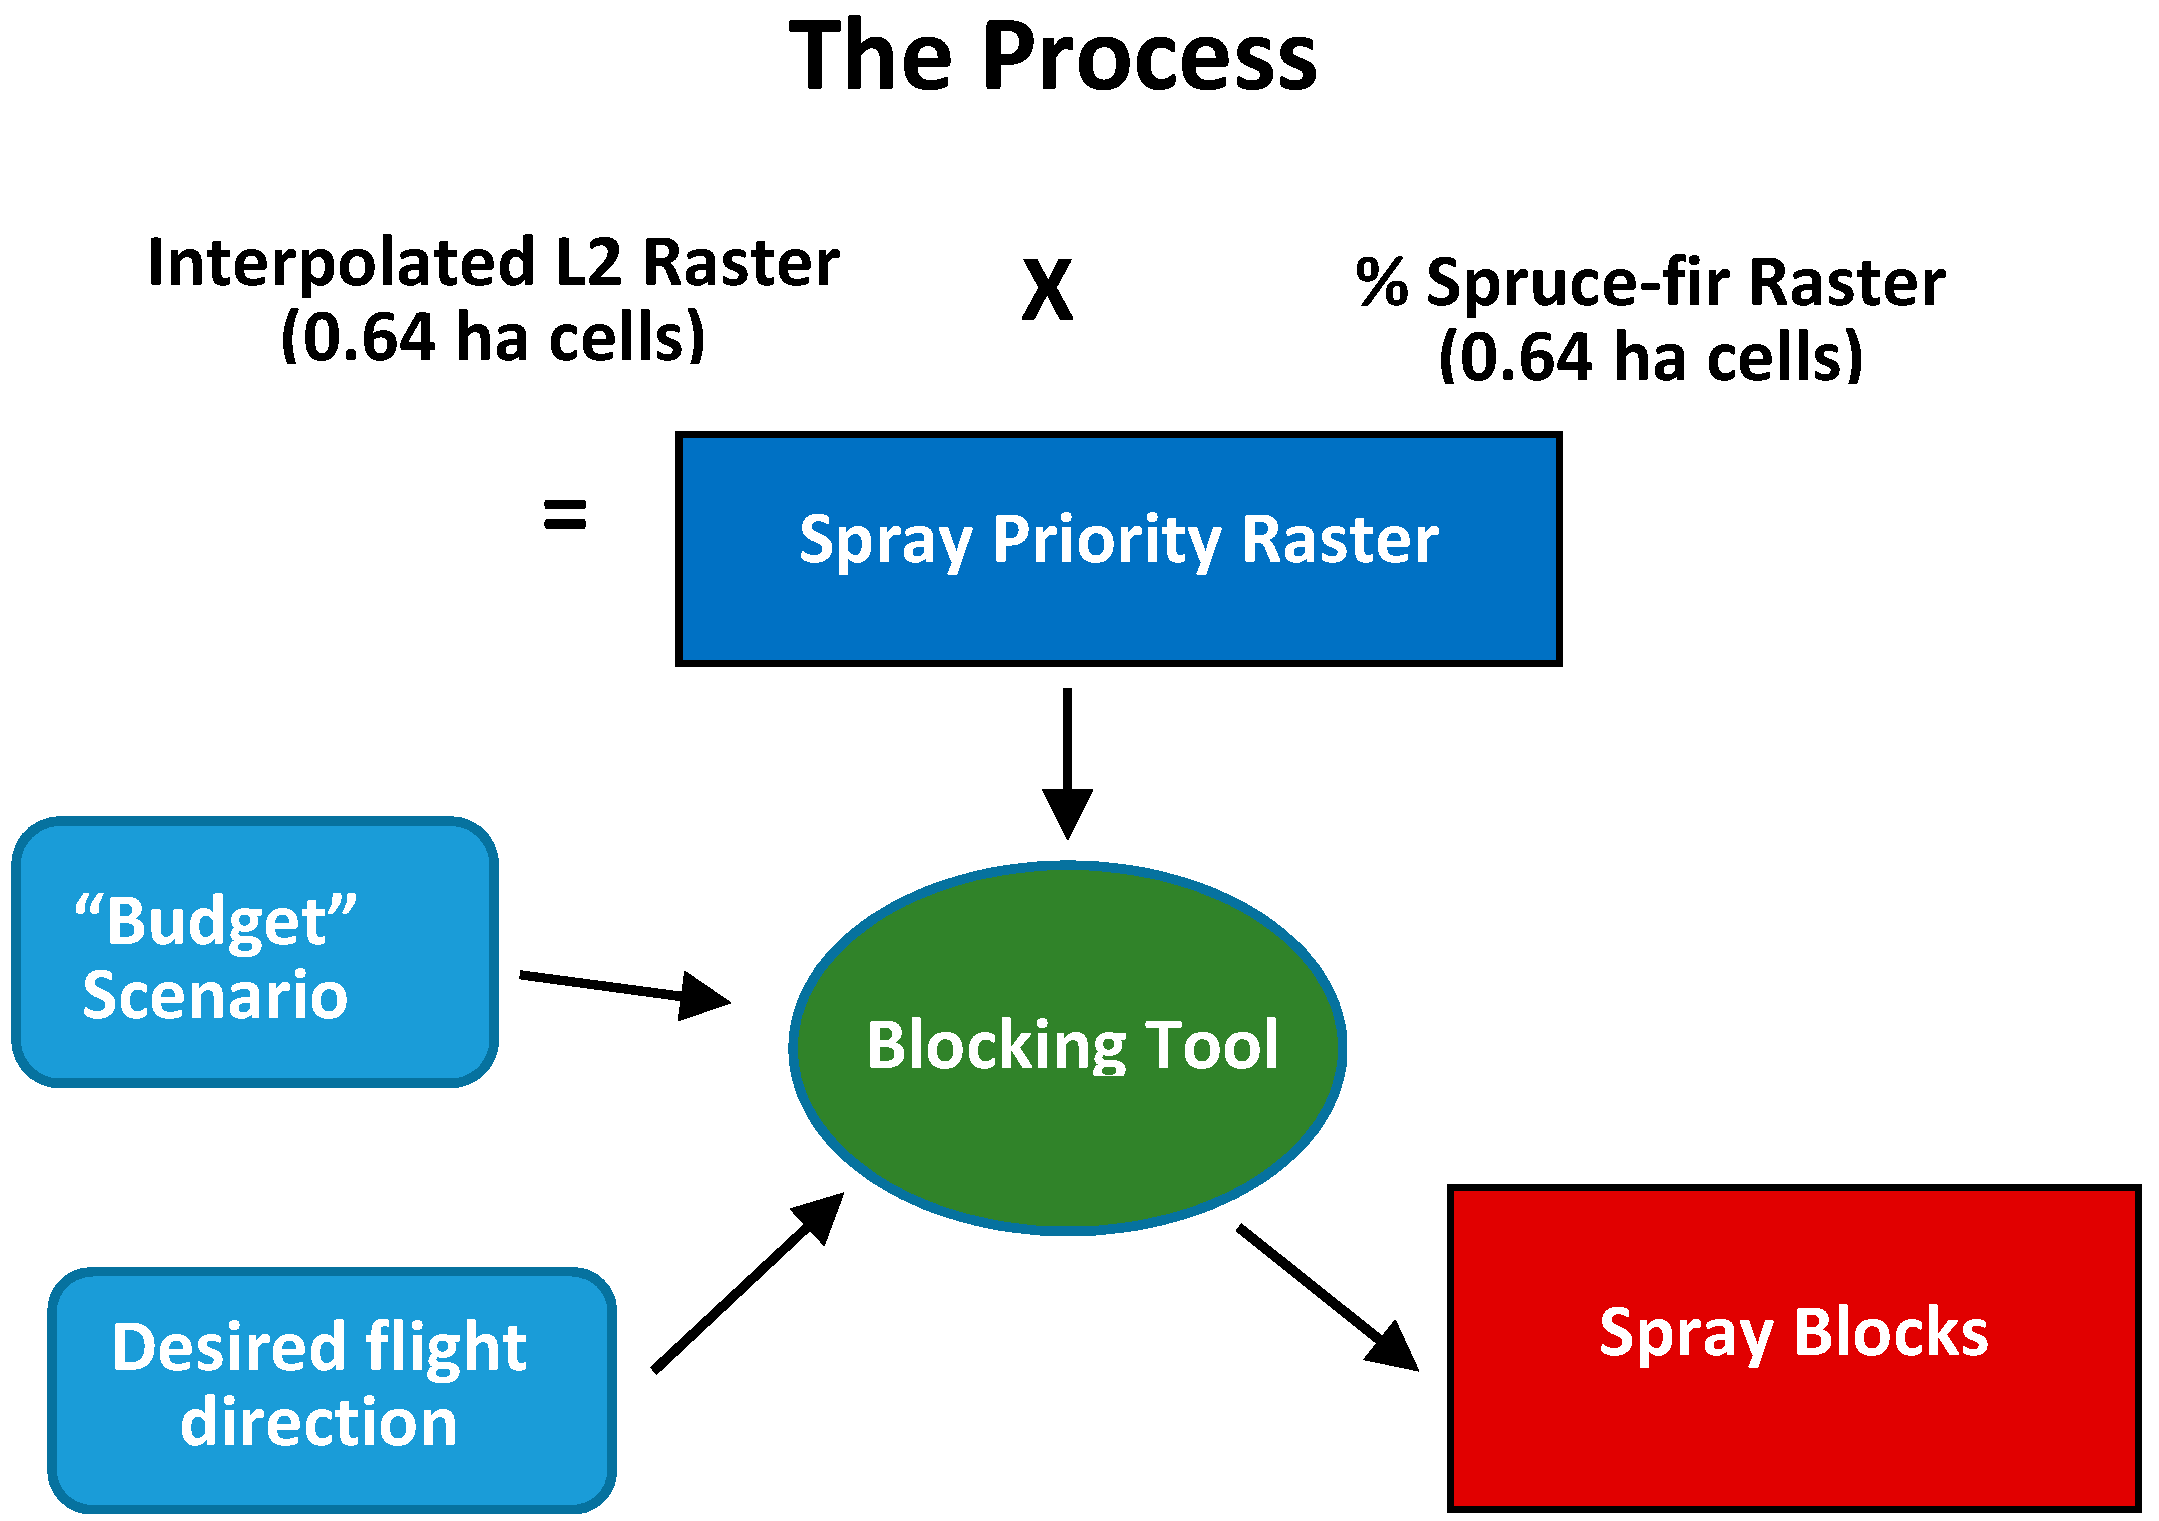
The biggest difference between our new treatment priority and blocking model and the current ForPRO [39] was that ForPRO and past SBW DSS iterations have been based on estimated timber supply or harvest level impacts (m3 losses) of defoliation, whereas EIS planning is based on SBW population levels. Our model used spatial heuristic algorithms to estimate effects of alternative EIS control strategies, specifically determining the most cost-effective application of insecticide to minimize SBW L2 levels. The spray treatment priority raster combines an interpolated SBW L2 sample with a % spruce-fir forest composition layer, as inputs into the blocking tool (Figure 2), which analyzes cells (originally 1 ha 100 × 100 m, but changed to 80 × 80 m in 2018, to coincide with aircraft application swath width), along with tests of alternative desired treatment flight directions, to produce an optimal treatment area.
The blocking tool uses information about aircraft speed, turn times, insecticide hopper and fuel capacities, and treatment swath width to constrain treatment area and determine whether the aircraft should turn or continue to fly to the next high priority area when passing over excluded or low priority treatment areas. The objective is to maximize cumulative treatment priority score over the entire program, with penalties assigned for simulated product deposition losses and high ratios of aircraft flight-time to boom-on-time. Limits on total area blocked are determined externally by the program budget (area to be treated or funding and treatment cost per hectare). Spatial treatment priority score can be determined based on minimizing the expected volume losses, or in the case of EIS, an interpolated and scaled SBW L2 raster layer (described below). Simulated deposition losses result when: (1) boom-on-off events occur (a penalty at the beginning or end of the treatment line, because of application lag); and (2) a flight line is not flanked by adjacent lines (a penalty for increasing likelihood of incomplete line deposition from product drift). The combination of these penalties acts to spatially aggregate areas targeted for treatment to make blocks operationally realistic; e.g., isolated high L2 areas will be less likely to be included compared to aggregated high L2 areas.
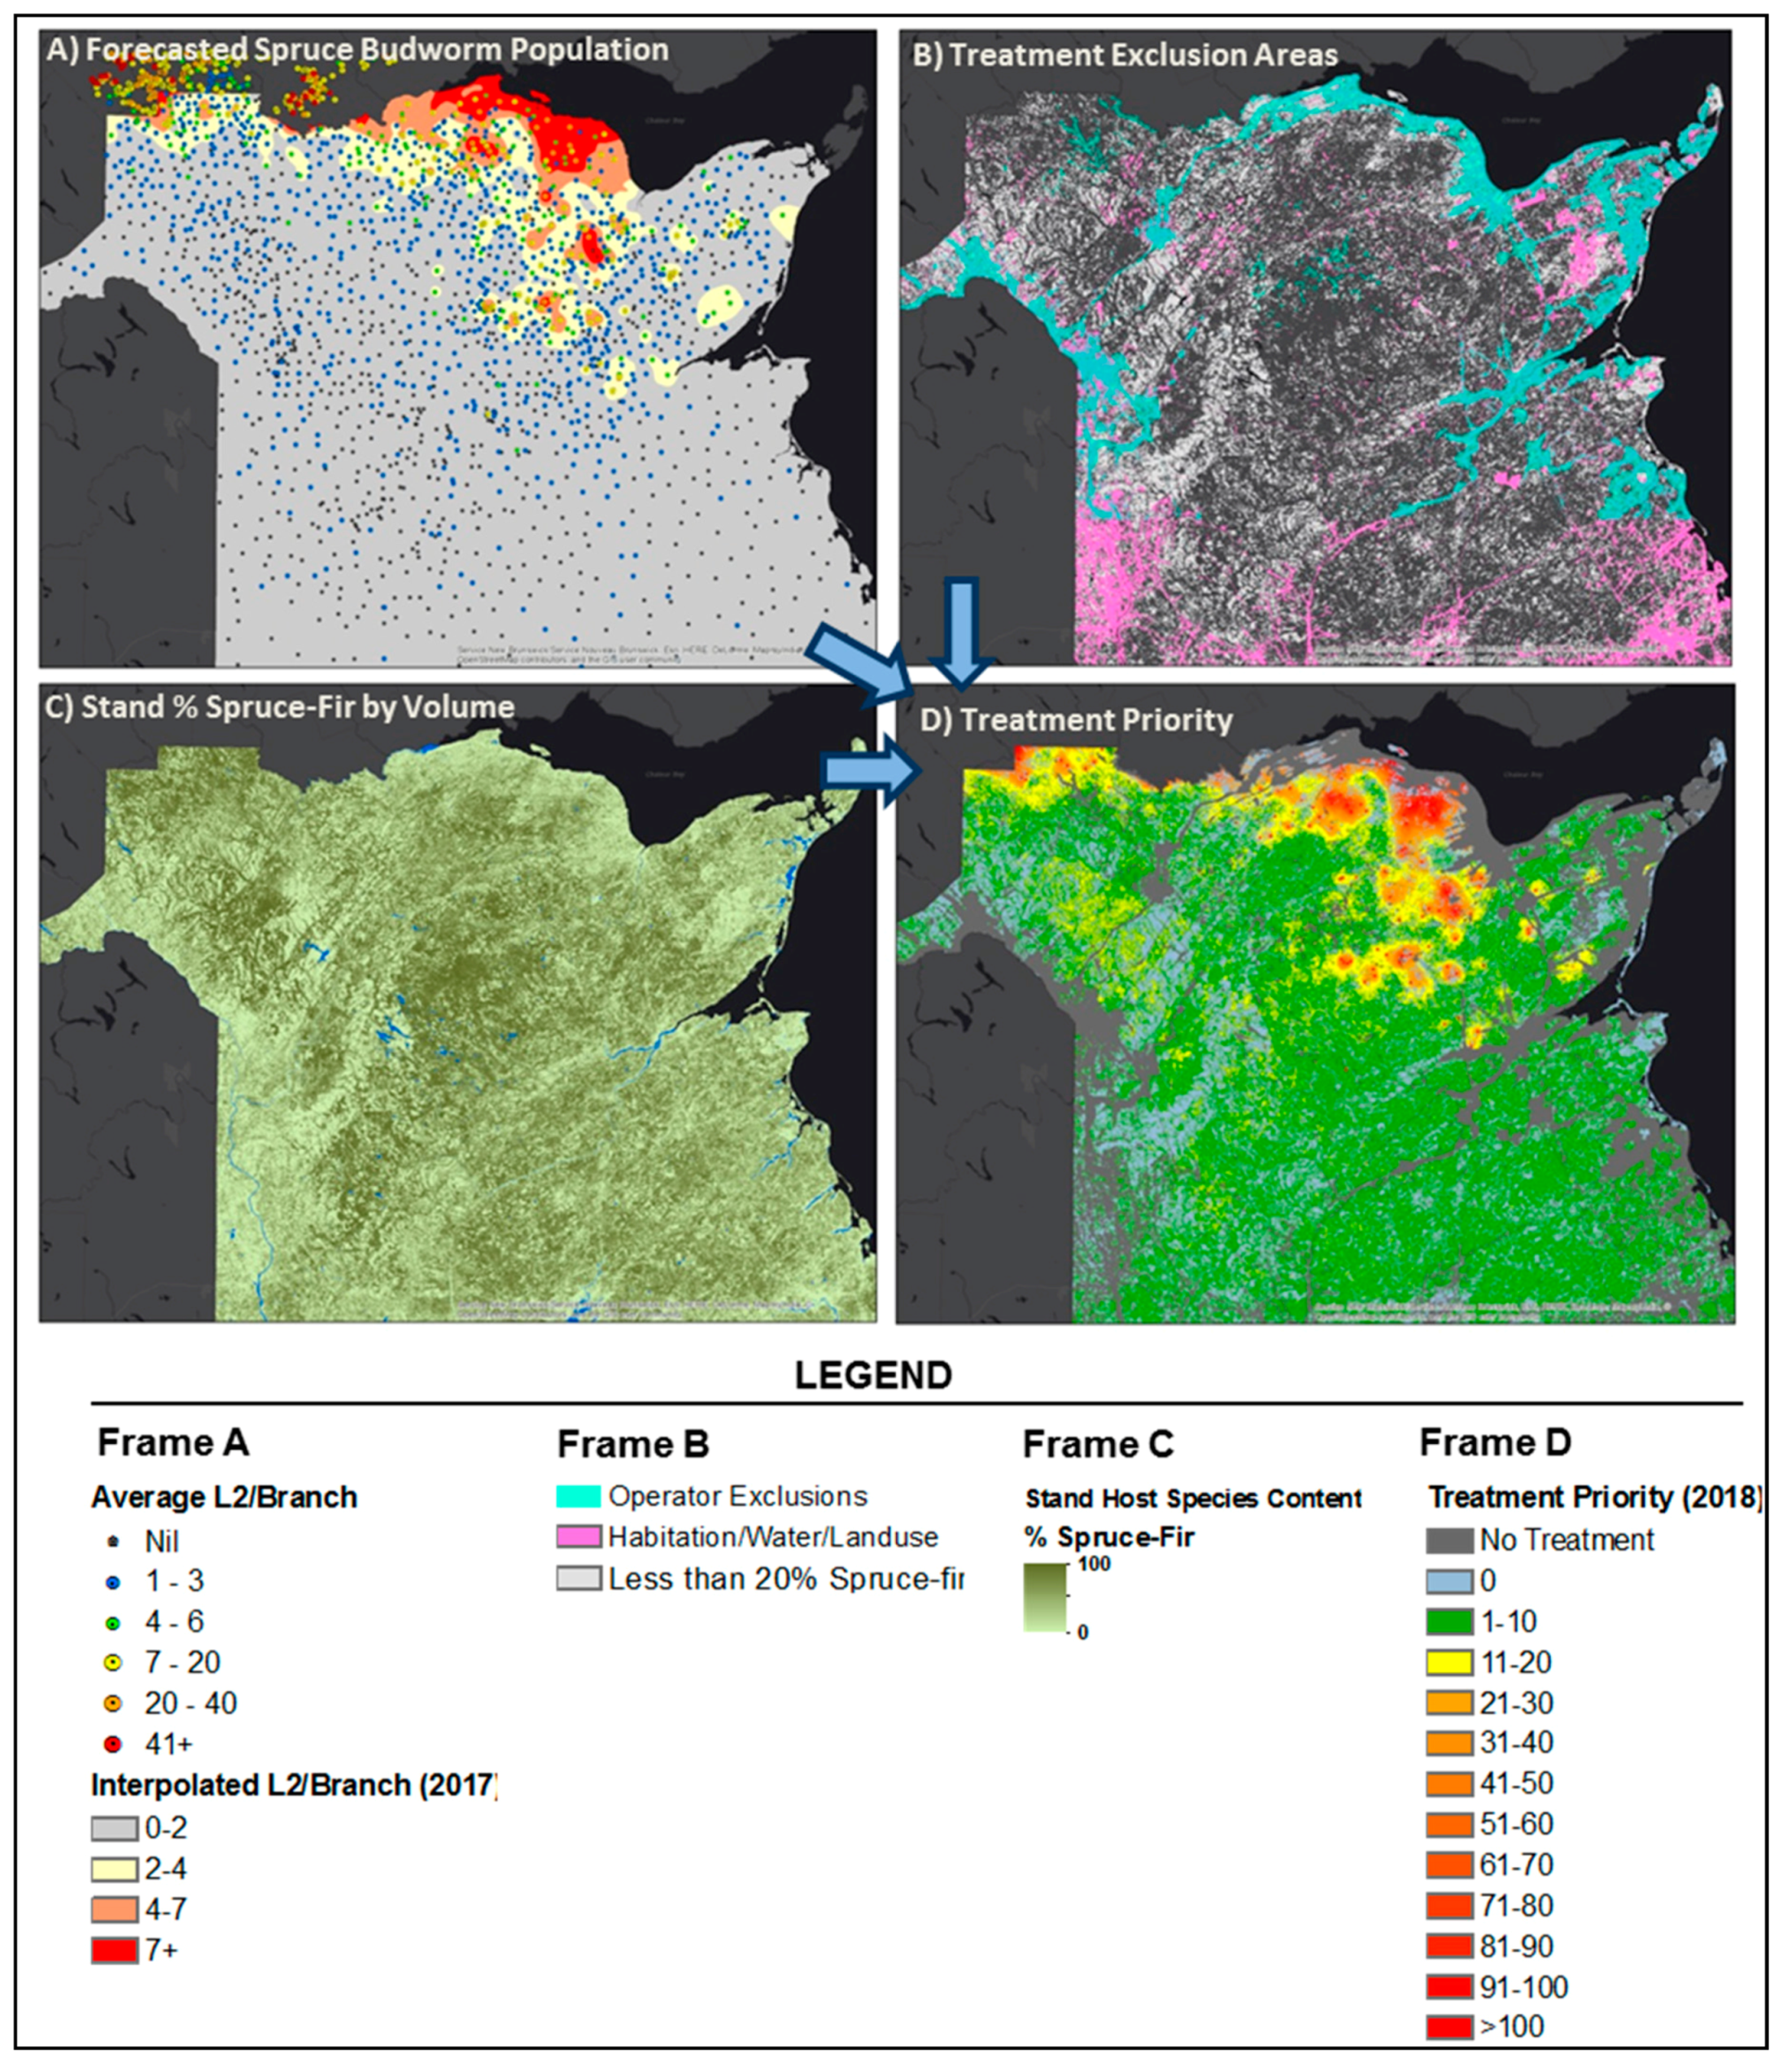
Several spatial interpolation methods were evaluated to produce a continuous population model from the L2 point data, and we selected averaging the output of four interpolation methods: empirical Bayesian kriging, inverse distance weighting, radial basis function, and kernel smoothing (Figure 3A). Raster cell size was set equal to the most common aircraft swath width (80 m) used so each cell becomes a ‘yes’ or ‘no’ treatment decision in the blocking tool. The interpolated L2 layer was transformed and scaled (1–100) to put more emphasis on moderate-high L2 populations and then added to the % spruce and fir (scaled from 1–10). Transformation of interpolated L2 was performed using the TfLarge object method available as part of the Spatial Analyst extension in the ArcPy Python site package; transformed L2 = 1/(1 + (L2/midpoint)−spread), where midpoint = 7 and spread = 3. Alternative transformation methods were tested to identify what objective function would result in a treatment block solution similar to that expected if created manually by NB ERD experts. The objective was to target treatment of high L2 areas, but not waste insecticide on high hardwood content stands where L2 survival on non-host species is low. The resulting algorithm was based on consensus from expert panel reviews by researchers and NB ERD staff of alternate spray priority weighting rules. The % spruce-fir represents the proportion of merchantable volume in mature stands and relative abundance based on density, stocking and canopy closure for the immature forest. Areas with higher spruce-fir content were expected to yield more L2 per unit area compared to low spruce-fir content areas (Figure 3C). All areas with moderate or higher SBW L2 populations (≥7 L2/branch) were set to high priority to ensure that they were treated. Areas with <20% spruce-fir had spray priority value set to zero, based on results of Zhang et al. [41]. Habitation and other operational setbacks were excluded from treatment in all scenarios (Figure 3B). Together, these methods define the treatment priority model used by the blocking algorithm (Figure 3D).
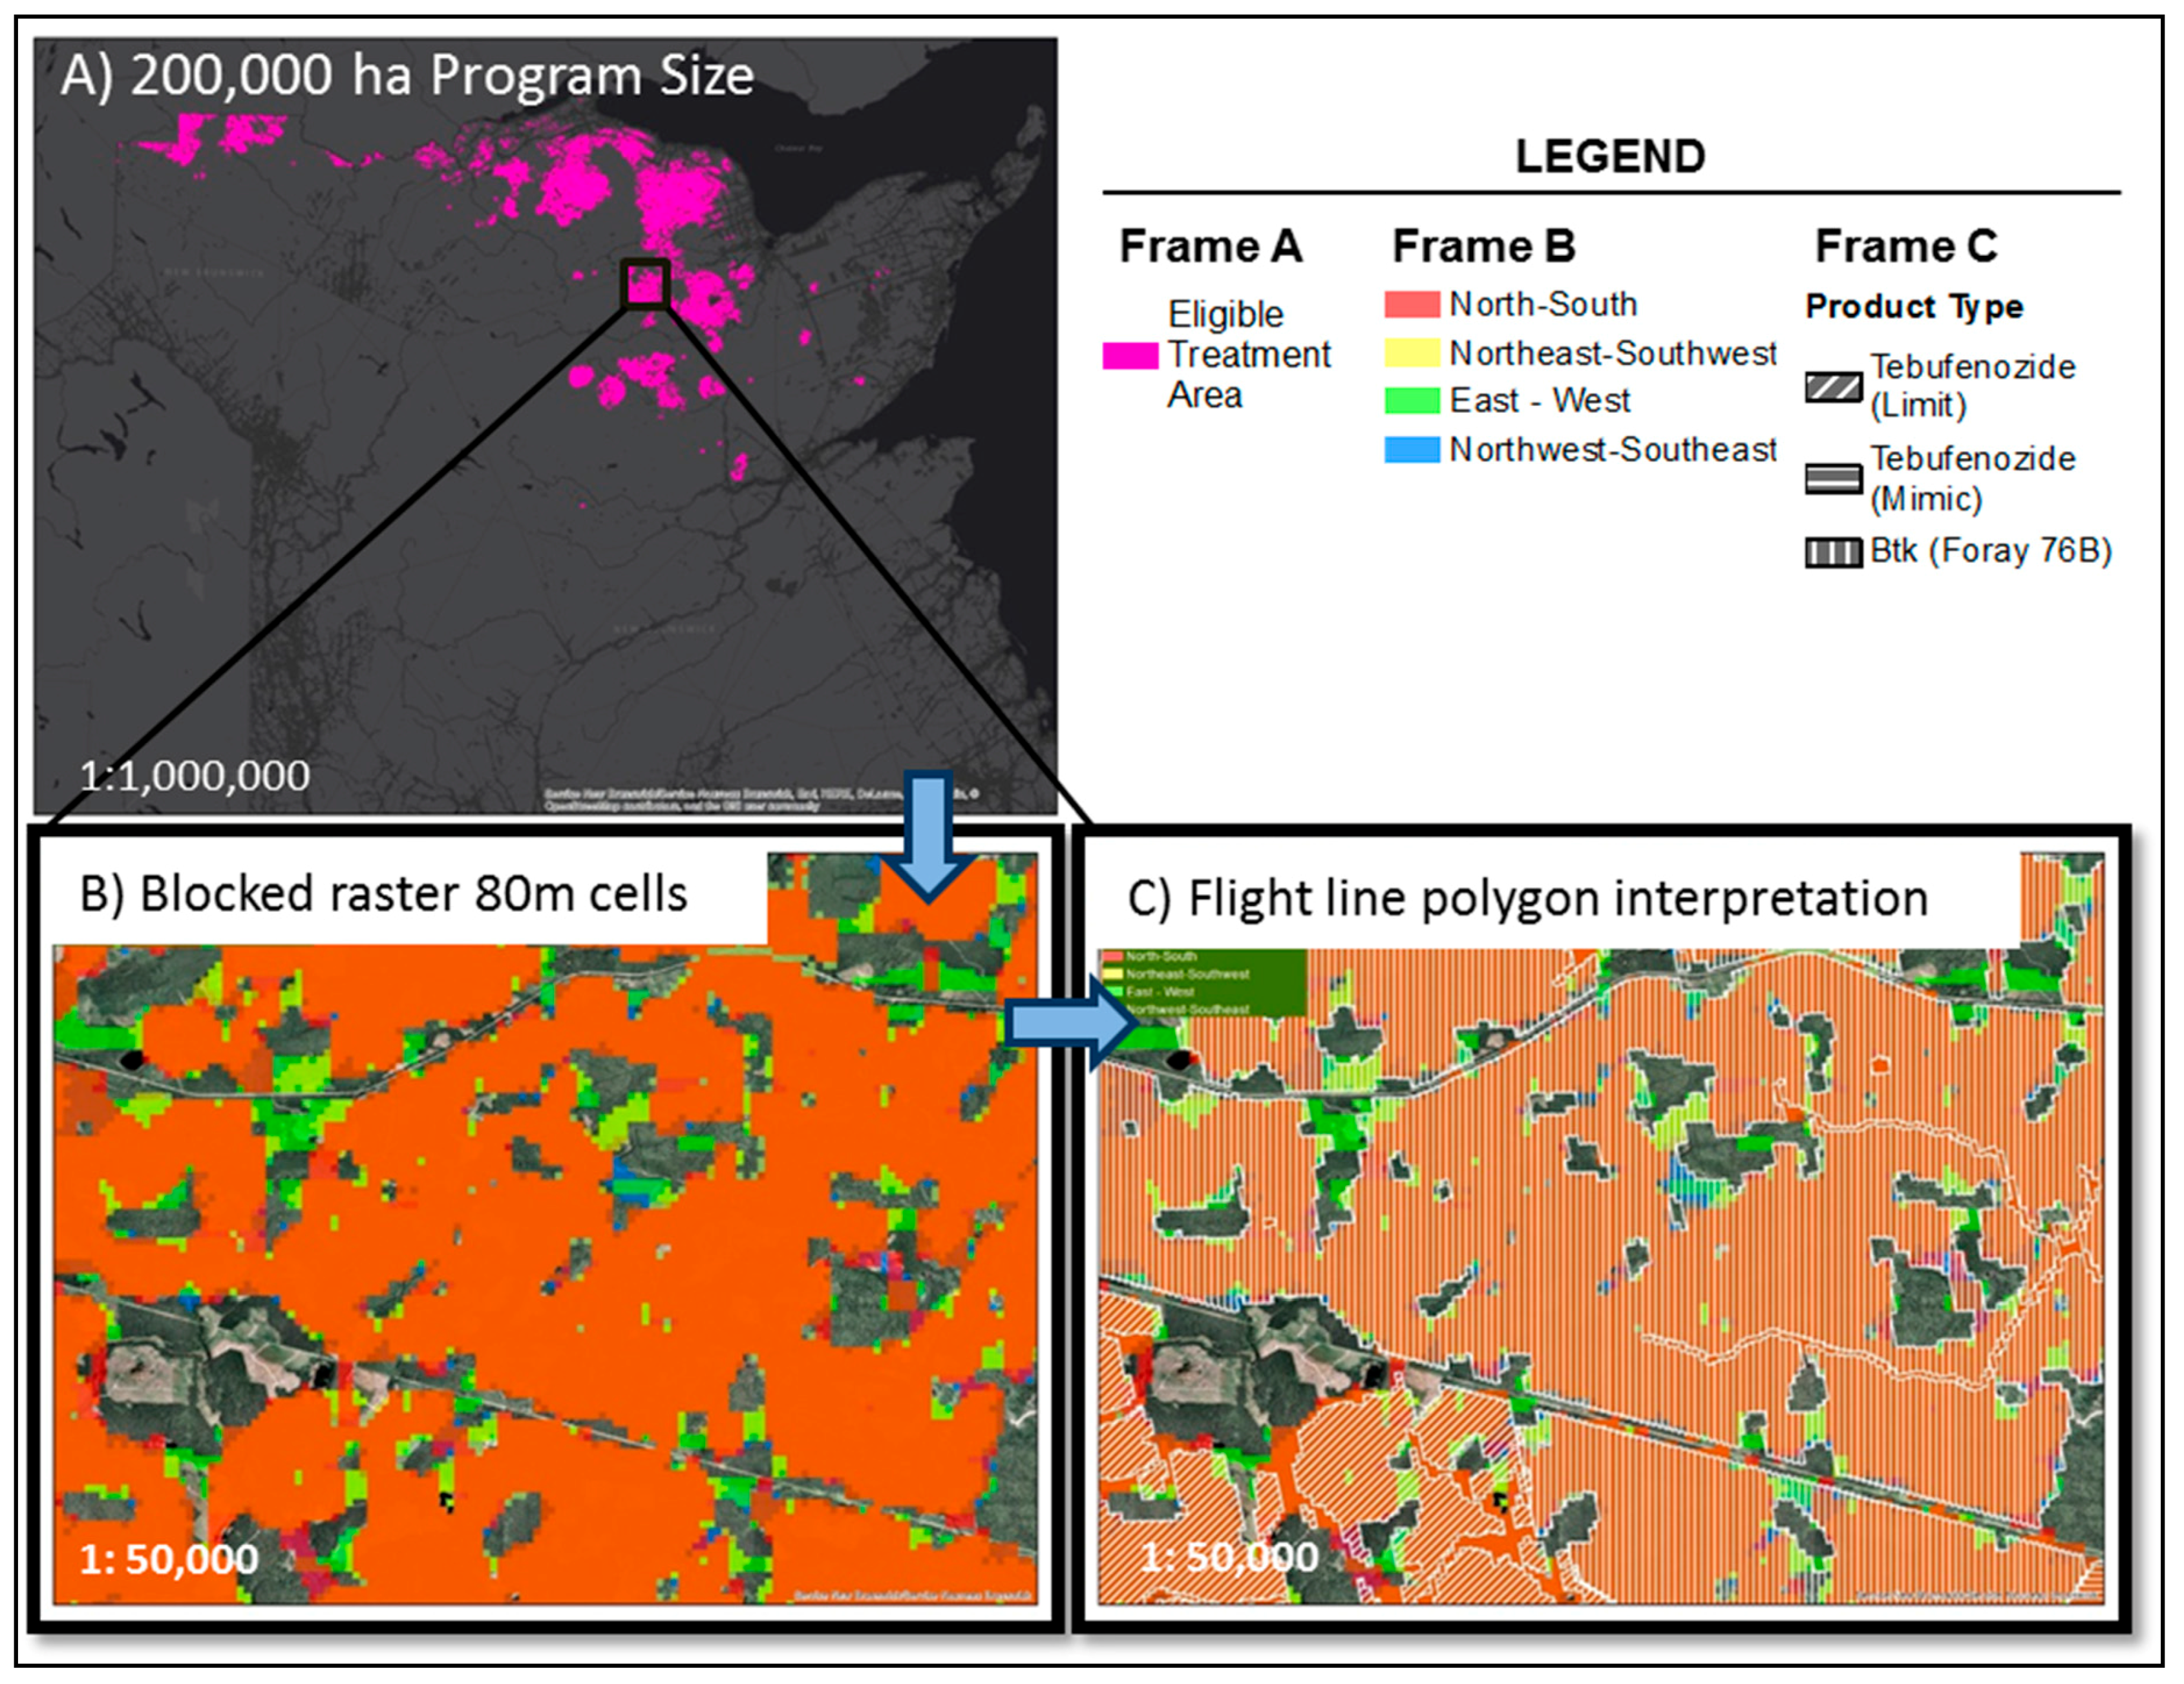
The optimum treatment priority blocking tool was used by Forest Protection Limited (FPL) and NB ERD staff in designing the EIS protection trials from 2016 to 2018. The blocking algorithm was run on the treatment priority model with flight lines oriented north-south and east-west. Treatment priority input layers were then rotated 45 degrees and the composite priority layer was rebuilt to allow the blocking algorithm to build blocks for northeast-southwest and northwest-southeast flight directions. In total, four different spatial blocking solutions from the different flight orientations were produced, and these four layers were combined to yield areas eligible for treatment. Areas selected for treatment four times were more likely to be good treatment candidates (four ‘votes’) than areas selected less often. This composite treatment area (Figure 4A,B) was reviewed by NB ERD staff and sent to FPL for development of the final treatment blocks (Figure 4C). FPL staff converted the identified treatment solutions into digitized flight lines in a process that selected the solution from the composite treatment area that best matched the desired flight direction, which is largely determined by proximity to residential areas, infrastructure, and topography. Final treatment blocks were edited to respect exclusion areas in accordance with environmental permits, and to remove areas that were not operationally feasible due to anticipated flight line orientation. The final operational blocks and flight lines closely resembled the eligible treatment area (Figure 4B versus Figure 4C).

2.4. Insecticide Treatments for EIS against SBW

Given that EIS is area-wide SBW population management, we attempted to treat all SBW area with L2 ≥ 7, regardless of land ownership. The New Brunswick Crown Lands and Forests Act contains provisions allowing landowners to opt out of planned provincial pest management programs, if desired, and all potentially affected landowners (several hundred per year in 2017 and 2018) were notified and given an opportunity to opt out. Fewer than 5% of landowners opted out of treatments, largely owing to extensive communication efforts to inform media, politicians, landowners, and other stakeholders of objectives and results of the EIS research.
In total, three bases of operation, namely Charlo, Miramichi, and Boston Brook, were used as staging areas for application flights. Treatments targeted later larval instars (3.5 or later), initially based on locally-calibrated degree-day models of SBW larval development, but confirmed for individual treatment blocks by SBW larval sampling to monitor insect development (or bud development as a proxy for insect stage). Insecticide applications therefore were optimally timed with insect development, commencing once the appropriate development stage was reached, during periods of favorable meteorological conditions (low wind, no rain, etc.). Costs of the Btk and tebufenozide treatments have averaged about $40 per hectare per application, or over $17 million of direct treatment costs for the 425,000 ha treated from 2014 to 2018 (Table 2). Costs will vary by jurisdiction and are lower than usual in New Brunswick because Forest Protection Limited owns aircraft, rather than having to contract them.
Population surveys carried out in treated versus untreated areas [43] provided estimates of spring-feeding larval density estimates (i.e., L4), which allowed us to assess how efficient L2 estimates from the previous year were for determining the treatment layer. In brief, we selected sites within treated and untreated areas in 2017 (53 sites) and 2018 (96 sites) and collected 15 branches per site during the L4 stage (~mid June).
Treatment efficacy was assessed using the annual L2 survey data used to identify hotspots (described above in Section 2.1). These L2 density data were separated by ‘time’ (i.e., pre-spray and post-spray) and by ‘treatment’ where we compared density in treated areas with those in untreated areas within 3 km of blocks or within 3–6 km from blocks. All statistical analyses on these data were conducted in R version 3.4.0 [44]. To determine the effect of treatments on population growth, for each year, we carried out a linear model assessing the effects on L2 density of ‘time’ (i.e., pre vs. post treatment) and treatment (treated areas vs. untreated areas < 3 km vs. untreated 3–6 km), as well as their interaction. Prior to analysis, measures of L2 density were transformed based on Tukey’s ladder of power using the transformTukey function from the rcompanion package [45]. Because of significant time x treatment interactions, we did not try to interpret the main effects from these models and instead have focussed on how they interacted with one another. For each year we reported the difference in L2 density from the start to end of year for each treatment to indicate the direction of change (+ or −) and conducted a post-hoc interaction contrast using the testInteractions function from the phia package [46], to determine if these differences were significant.

3. Results

3.1. EIS Insecticide Treatments from 2014 to 2018

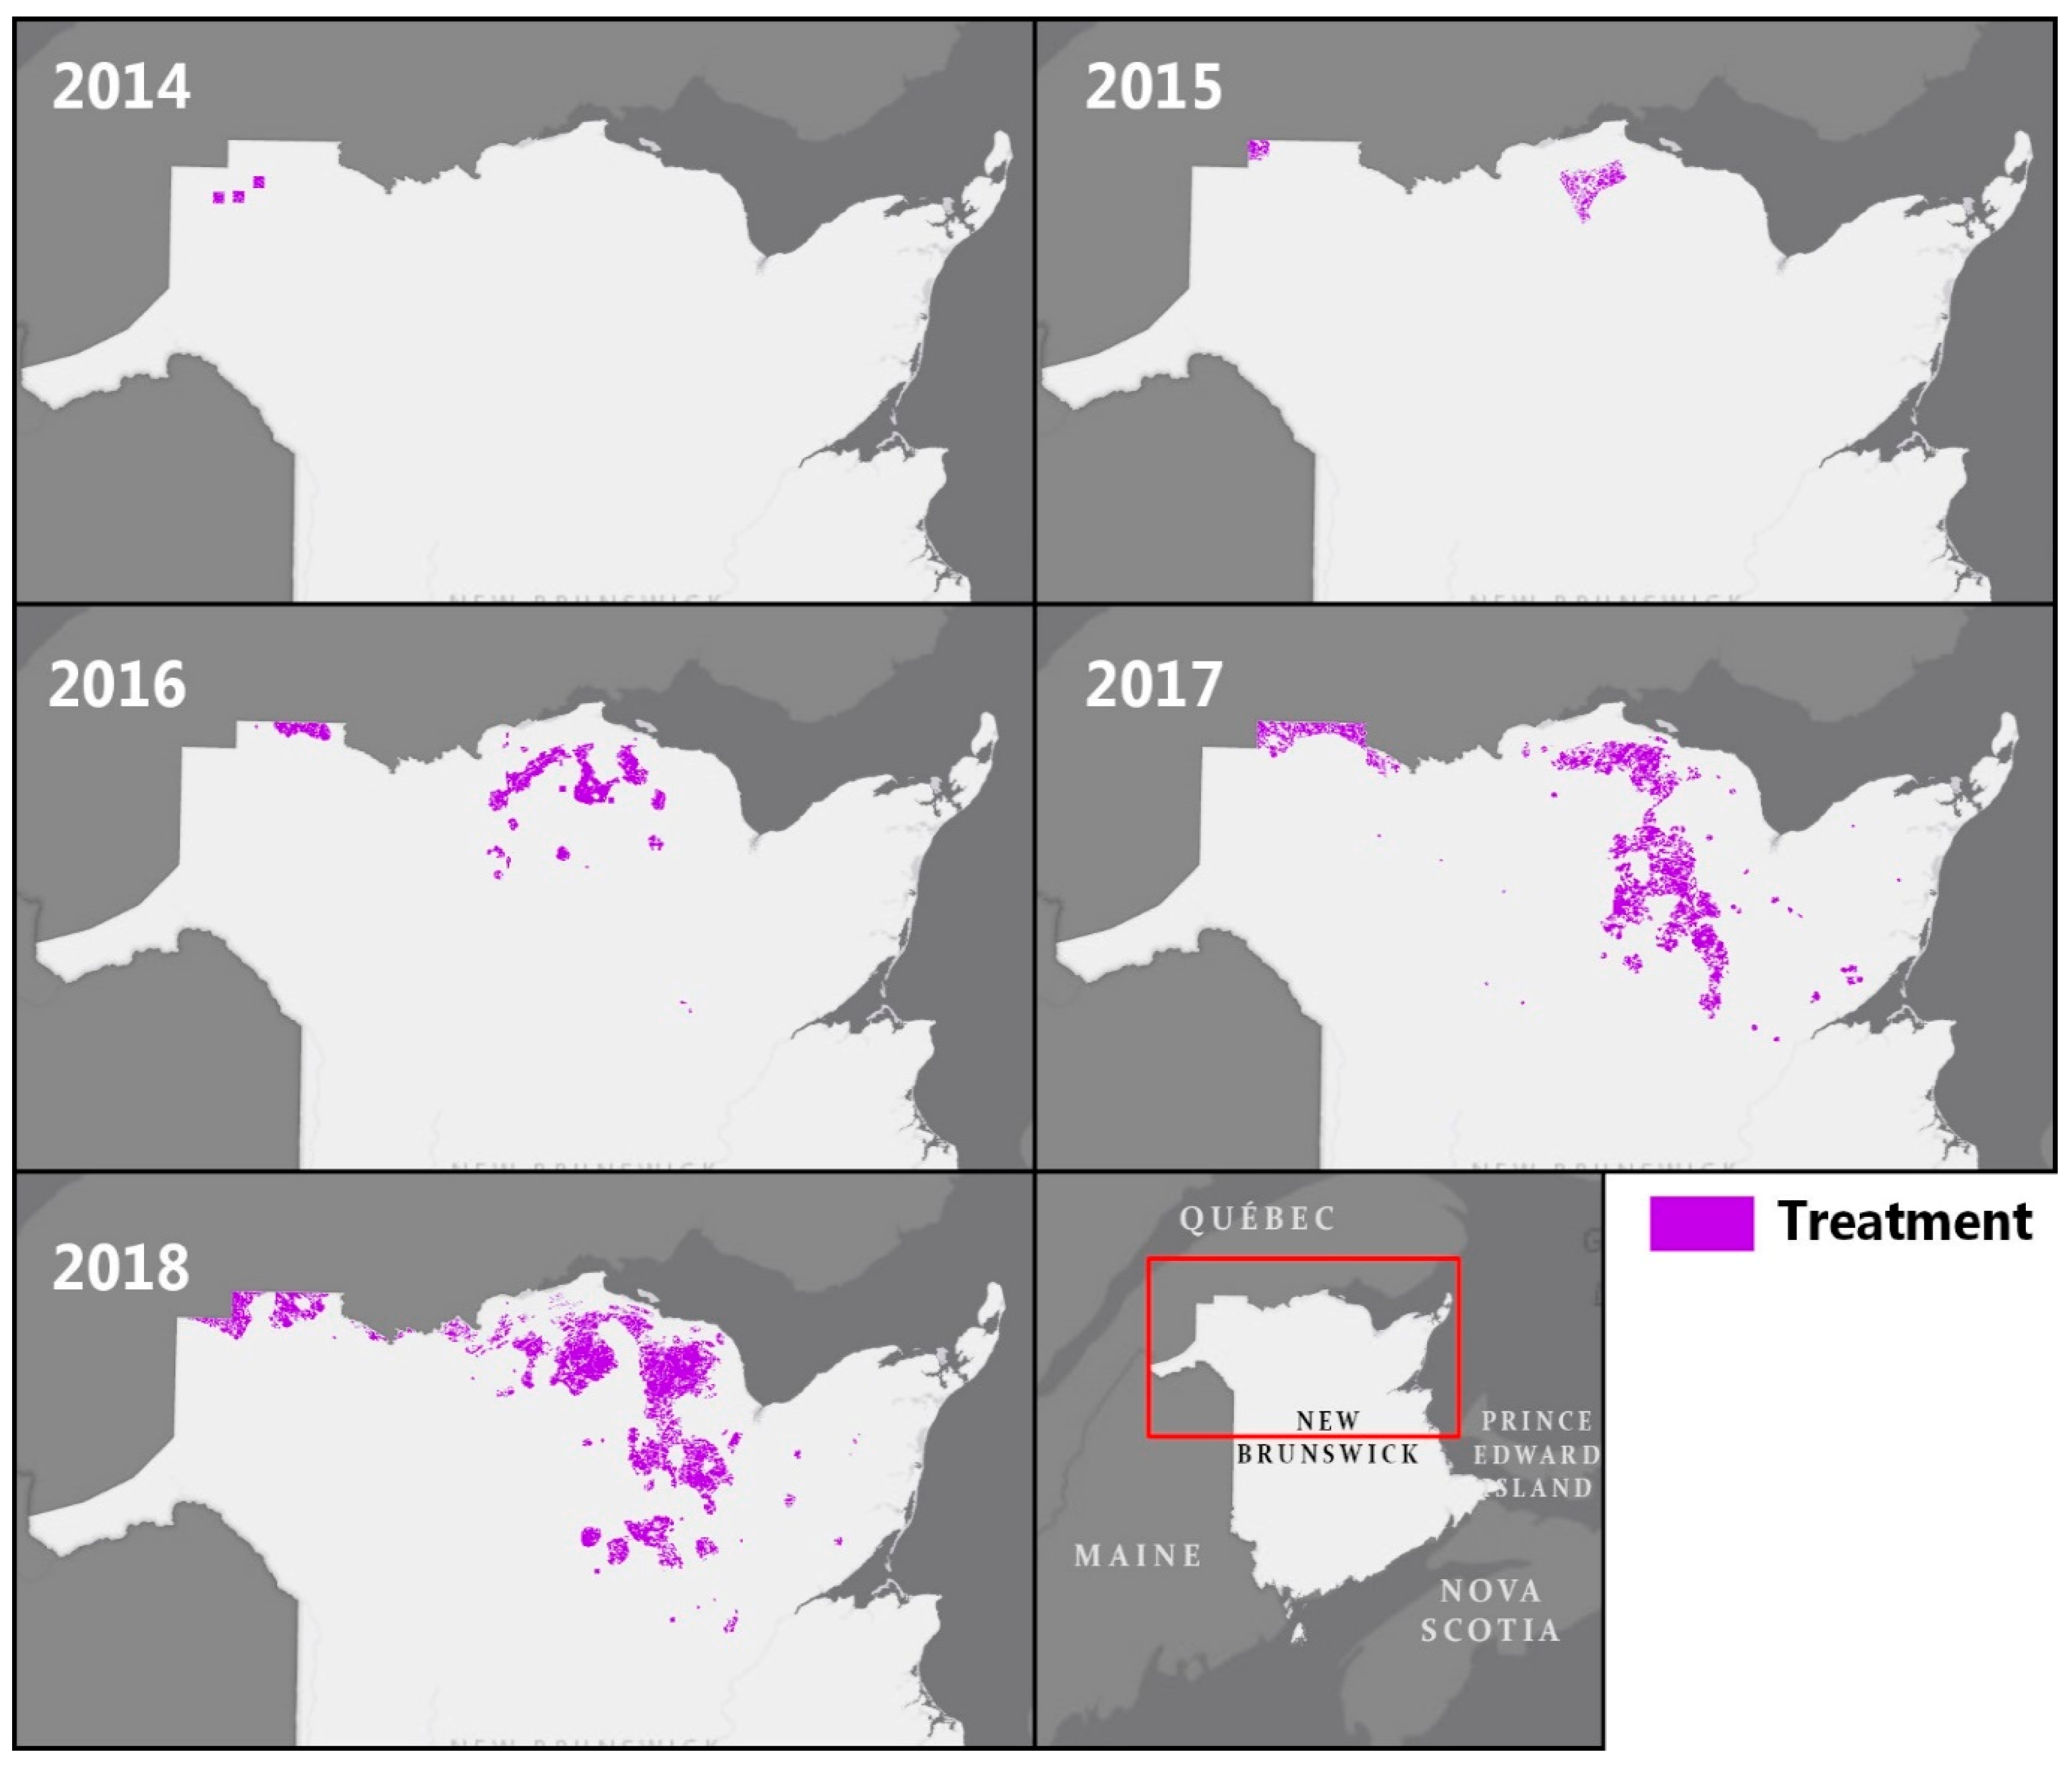
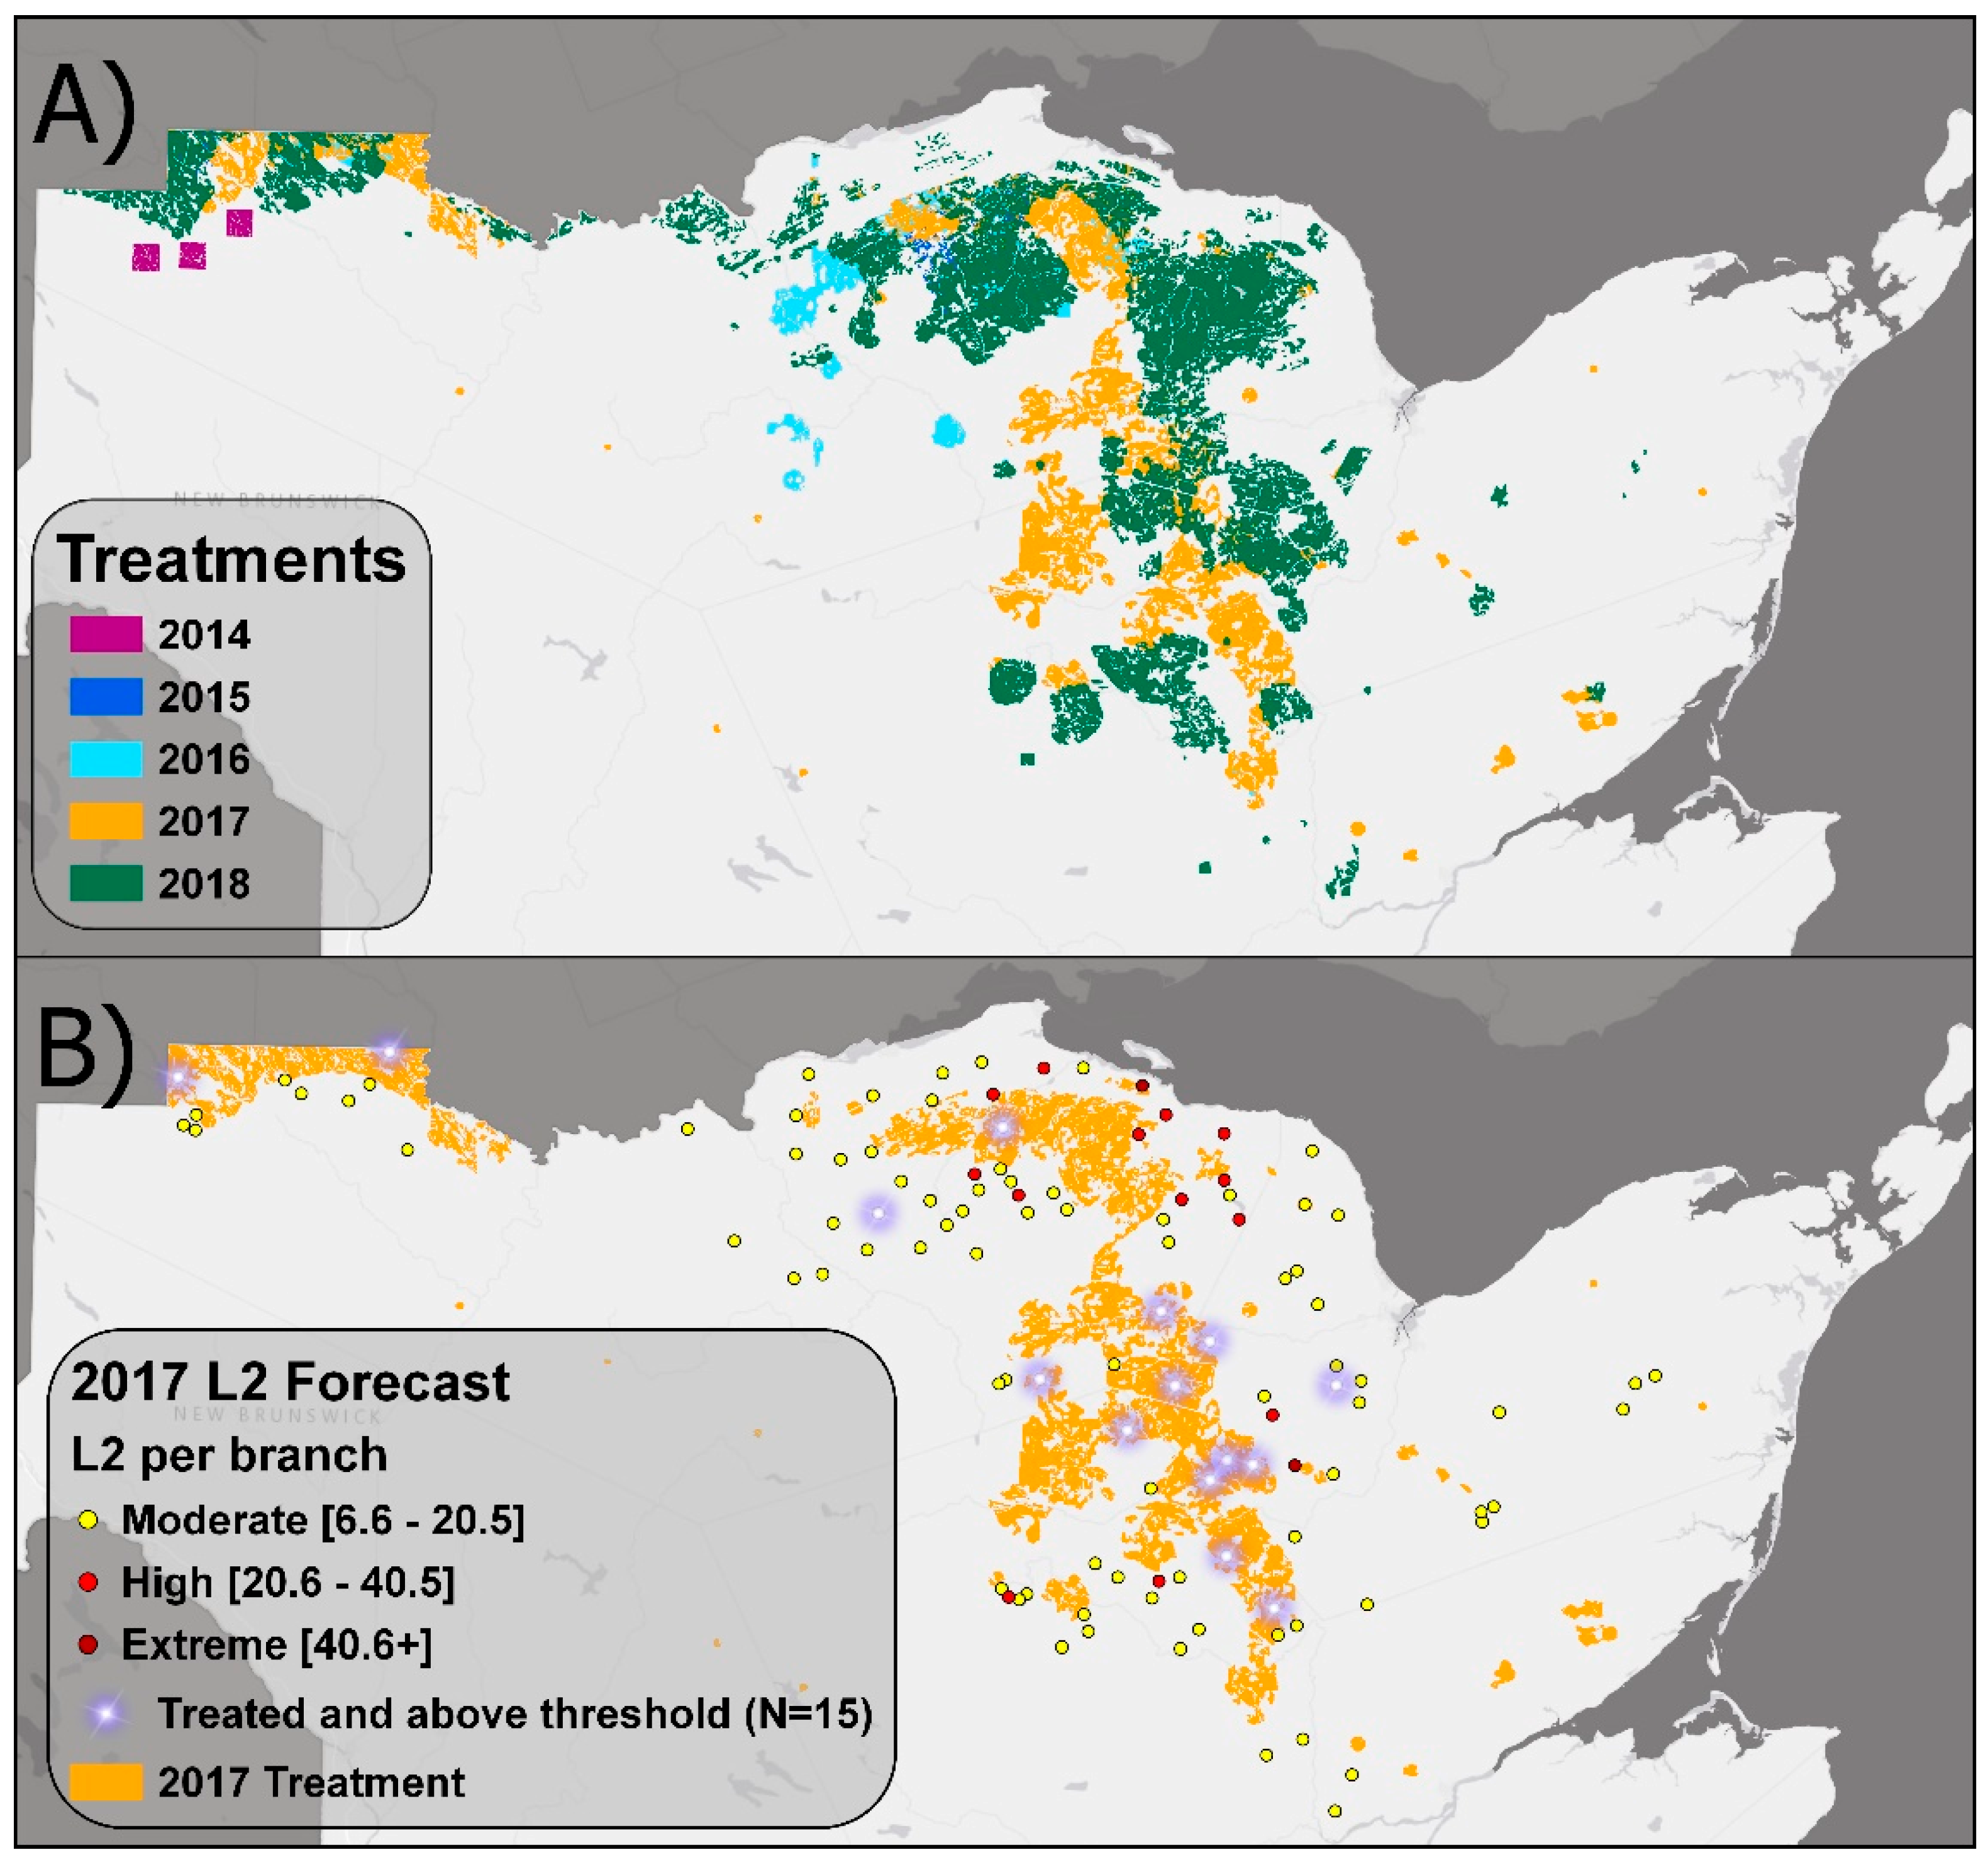
The area treated with insecticides increased steadily over the 5 years tested, from less than 5000 ha in 2014 to nearly 200,000 ha in 2018 (Figure 5, Table 2). Treatments in 2018 included about 23,000 ha of trial double or triple applications of Btk in the highest population areas (L2 > 20/branch; Table 2). Initial results after one year indicated that one application of Btk was as effective as two applications and that three applications were unnecessary, but this needs to be tested further. The 2018 treatment size was decided based on simulations of a range of potential treatment program size and budget scenarios ranging from 150,000 ha ($6 million cost) to 300,000 ha ($12 million) and resulting projected L2 reduction efficiencies. In total, treatments were 55% Btk, 45% tebufenozide, and 0.6% trials of SBW pheromone (Table 2). The pheromone trials were experimental, and have not yet achieved sufficiently satisfactory results for use. The geographic extent of treatment areas was primarily in northwest and north-central New Brunswick, and expanded southward over the years (Figure 5). In general, areas were not treated in successive years (Figure 6A). Areas treated that overlapped areas treated in the preceding year were 0%, 6.7%, 14.6%, and 26.3% from 2015 to 2018, respectively. The main areas that required repeated treatments were close to the Québec border, where the major SBW outbreak expanded from 4.3 million ha in 2014 to 8.2 million ha in 2018 [24]. Of the total of 112 L2 points that had ≥ 7 L2/branch in autumn 2017, only 12% of those fell within areas that had been treated with insecticide in summer 2017 (Figure 6B), and none of the 10 points in 2018 that will require treatment in 2019 occurred in areas treated in 2018.

3.2. Efficacy of L2 Monitoring and Blocking Approach

Results from SBW population surveys carried out on 15 branches per site during the L4 stage within treated and untreated areas in 2017 (53 sites) and 2018 (96 sites) [43] were used to assess how efficient L2 estimates from the previous year were for determining the treatment layer. Treatment areas for 2017 and 2018 included 75% and 76% of the sites sampled with L4 densities above the >6.5 L2/branch treatment threshold. In almost all instances, the other 24%–25% of sites that were above the treatment threshold but not included in the spray area were intentionally excluded due to buffer restrictions for waterways or residences.

3.3. Efficacy of Treatments for Suppressing Population Growth

For each year, there was a significant time x treatment interaction (Table 3), which was attributed to differences in both the magnitude and direction of changes between pre- and post-spray L2 densities among treatments. In general, mean L2 densities from pre-treatment to post-treatment periods, comparing L2 points within treated blocks, untreated points within 3 km of blocks, and untreated points 3–6 km from blocks showed that mean L2 values within treated blocks declined by 38%–39% in 2015–2016, by 60% in 2017, and by 96% in 2018 (Table 3). In contrast, mean L2 of samples outside but within 3 km of treatment blocks increased by 75%–105% and those 3–6 km from blocks increased by 146%–300% from 2015–2017. The year 2018 differed, however, in that L2 samples outside treated blocks declined by 43%–63%, whereas treated samples declined by 96% (Table 3). SBW survival in 2018 was clearly low in untreated as well as treated samples. Overall, these results indicate that treatments were effective in reducing populations in all years and that moth immigration did not appear to offset treatment mortality (i.e., treatments resulted in additive mortality). Ongoing life table studies in treated and untreated areas of the EIS program have offered further support for this contention [43]. These results also indicate that successful containment may be possible even when some areas with densities above the action threshold are necessarily excluded from spray areas (e.g., see Section 3.2 above).

3.4. Comparison with SBW Populations and Defoliation in Adjacent Québec

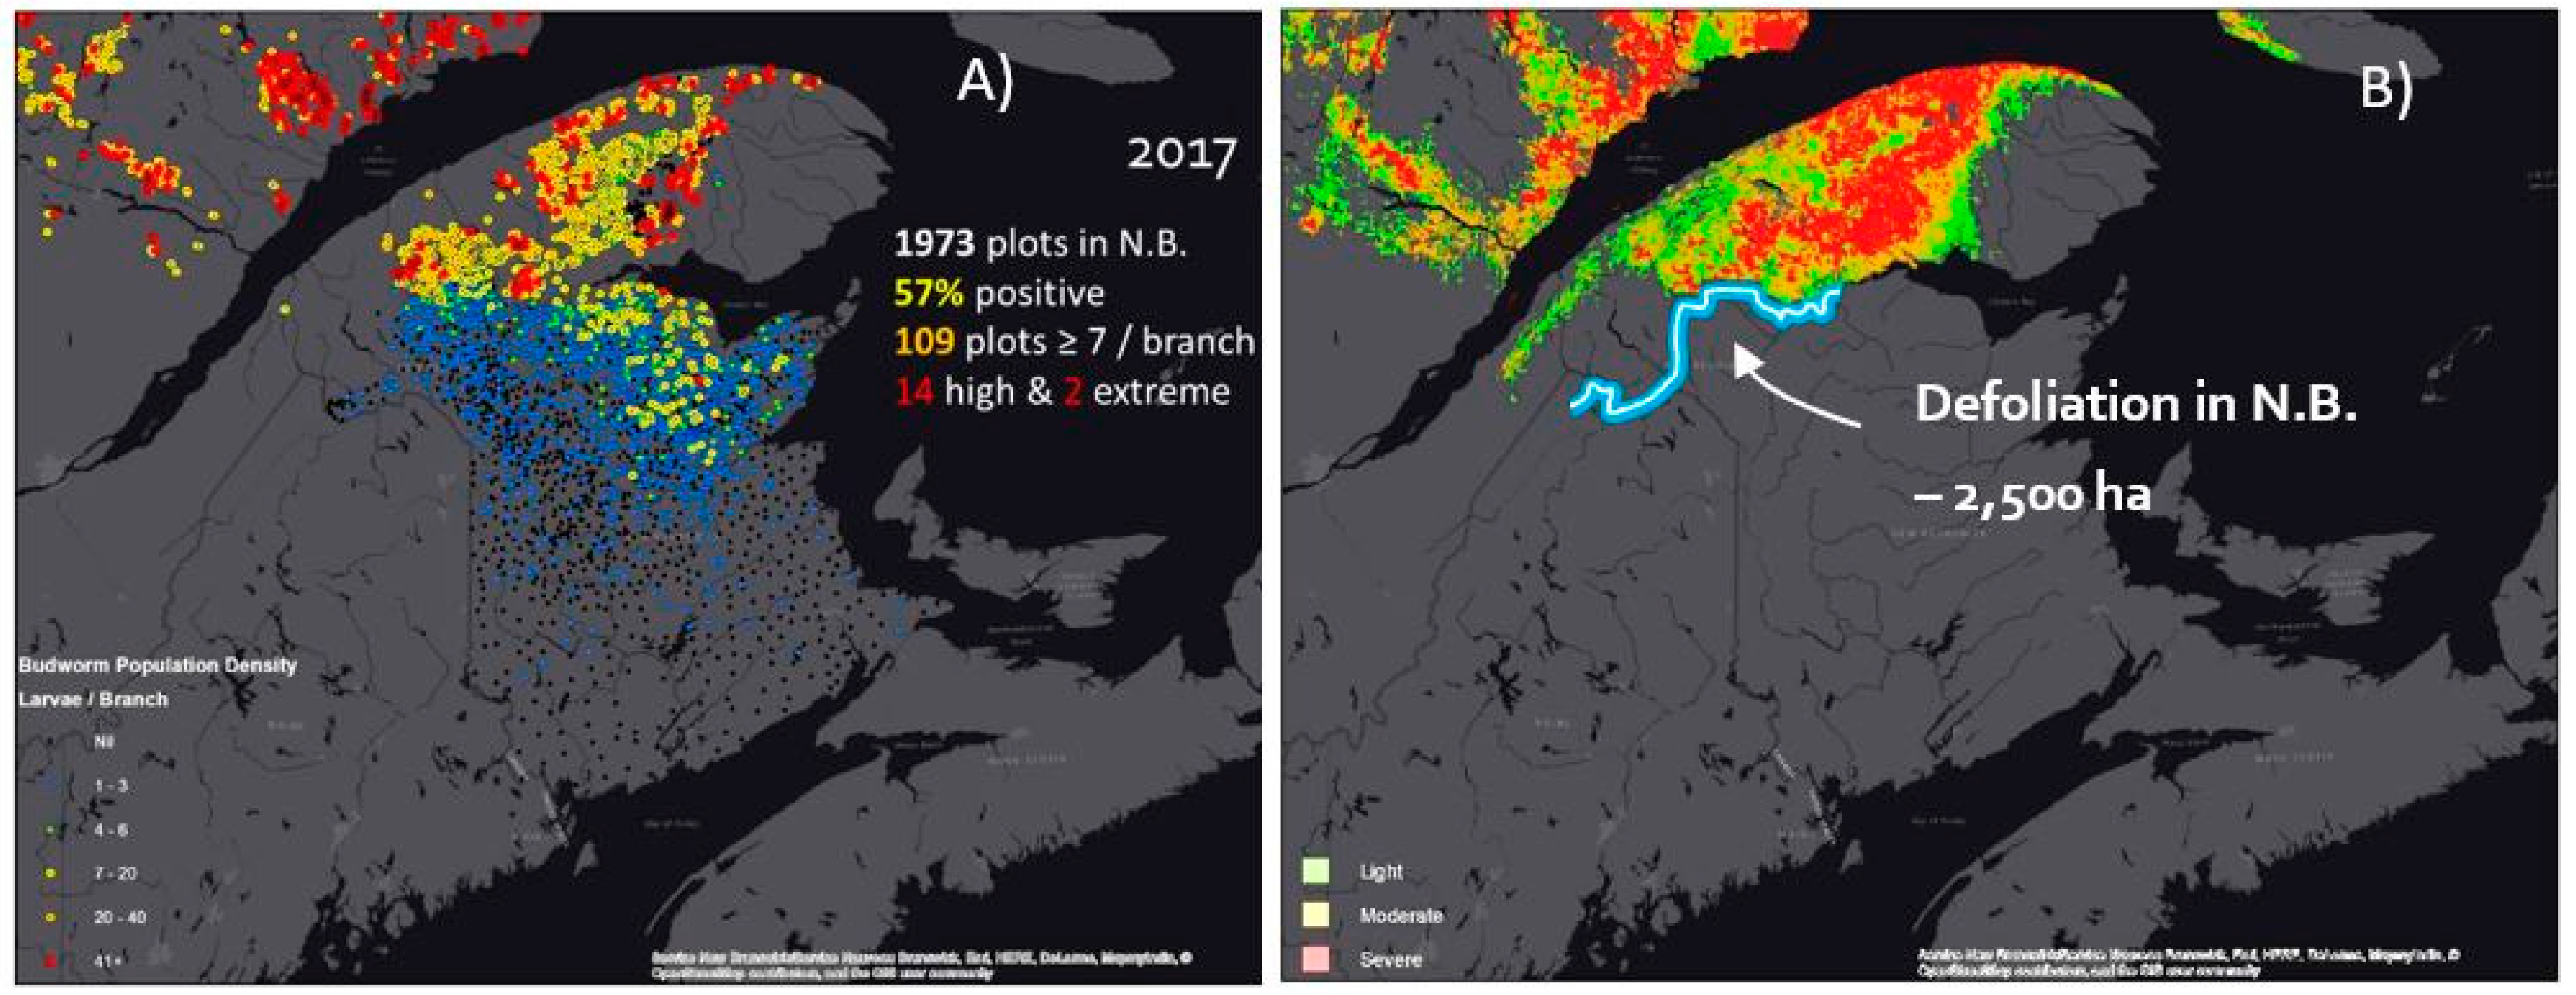
Following 5 years of EIS treatments of low but increasing SBW, L2 levels across northern New Brunswick were considerably lower than adjacent SBW populations across the provincial border in Québec (Figure 7A). The SBW outbreak (defined in terms of area of aerially-detected defoliation) began in about 2004 in Québec, when 33,700 ha of defoliation were detected. This increased to 133,600 ha by 2008, 1,643,000 ha by 2011, 4,275,000 ha by 2014, and 8,181,000 ha in 2018 [24]. SBW control treatments in Québec over this time period covered a maximum of several hundred thousand hectares per year, because of cost. The huge scale of the outbreak in Québec renders an EIS approach impossible. Québec is much larger than New Brunswick (1,668,000 km2 versus 72,908 km2), but the regions of Québec that are closest to New Brunswick (south of the St. Lawrence River in Figure 7; Bas-Saint-Laurent and Gaspésie regions, 42,337 km2) are generally similar in size and environmental conditions to northern New Brunswick. Aerial surveys of defoliation in New Brunswick detected only ~2500 ha of defoliation in 2017 and 500 ha in 2018, the third and fourth years of the outbreak, in comparison with 2,183,400 ha of defoliation in 2017 and 2,509,650 ha in 2018 [24] in the adjacent Bas-Saint-Laurent-Gaspésie regions of Québec (Figure 7B). Although there are some differences in methods, resolution, and mapping procedures between the defoliation aerial surveys in New Brunswick and Québec, there are orders of magnitude differences in observed defoliated area. Following 4 and 5 years of EIS treatments in New Brunswick, the Québec-New Brunswick border was evident from the air by defoliation on the Québec side versus none visible in New Brunswick. We should note that this is not a critique of the foliage protection approach being used in Québec, where ongoing foliage protection efforts have been successful in keeping treated areas below economic injury thresholds (50% defoliation) [28], but only a small proportion of the outbreak area is treated each year. However, with over ~8 million ha of defoliation in Québec, SBW populations are well beyond levels where an EIS approach would be feasible.

4. Discussion

Over 5 years of development, testing, and refinement, the treatment priority and blocking tool has proven effective in directing insecticide treatments to reduce L2 populations and to facilitate determining costs and benefits of alternative size treatment programs. We tested a wide range of possible treatment program sizes (for example, in 2018 we tested five program sizes treating 100,000 to 300,000 ha, in 50,000 ha increments, which would equate to $4 million to $12 million treatment costs) and selected the 200,000 ha solution as covering nearly all L2 > 7 per branch and high spray priority areas. Advantages of using our blocking tool are (1) it is an objective, optimal solution, and (2) it can be rerun in hours to incorporate any desired changes, such as differing budgets and program sizes, alternative methods of L2 interpolation or scaling, changes to rules for including low spruce-fir areas, or updates of exclusion area.
How safe for the environment are the Btk, tebufenozide, and pheromone treatments? All products are federally registered and approved as safe for use by Health Canada. The research project is regulated by requirements of the Federal Pest Control Products Act and New Brunswick’s Pesticides Control Act and Regulation. Any provincial permit and product label conditions were observed to ensure safe and responsible use. Btk is a naturally occurring soil bacteria and is not harmful to humans or other mammals, bees, birds, or fish when used according to label conditions. Btk has been used for the last 20 years to control SBW defoliation [47]. Tebufenozide is an insect growth regulator that larvae eat, which imitates a natural insect hormone that causes the developing caterpillars to molt prematurely as the larvae go through their growth stages. The caterpillars then quickly stop feeding and die. It is harmless to humans or other mammals, bees, birds, or fish when used according to strict label conditions. Pheromones occur naturally, are unique to each insect, and trigger behavioral changes in members of the same species. Pheromones pose no risk to humans or other animals. They are used to lure or attract insects to traps, and they can be used to disrupt mating cycles. SBW pheromones do not kill insects.
Tebufenozide is used on forestry, ornamentals, and a variety of crops. It is added to water and aerially applied at a rate of 1 to 2 liters per hectare, with the tebufenozide portion fixed at 290 mL per hectare. Nozzles on the aircraft break the liquid mixture into small droplets (atomize) so that when the drops land on foliage they are small enough to be eaten by SBW. Because the forest canopy acts as a filter, 90%–95% of the spray is deposited in the forest canopy [48]. The portion that reaches the ground stays in the upper 5 cm of the soil and leafy debris, does not leach away, and is broken down over time by soil microbes, sunlight, and moisture [49,50]. Tebufenozide deposited in the canopy is relatively rainfast and is not easily washed off by rainfall [51] and tebufenozide that reaches the ground is not harmful to soil invertebrates [52], Water bodies are identified on maps and are excluded from all treatment areas during the planning phase, so there is no targeting of visible water bodies. Tebufenozide that lands on water has no noticeable environmental impact; research showed that there were no significant harmful effects on most organisms at concentrations expected after aerial spraying, even if a water body were to be unintentionally sprayed [48,53,54]. The most recent review of tebufenozide states that ‘No adverse effects on birds, mammals or aquatic species are likely to occur from exposure to tebufenozide’ [55].
In the EIS trials conducted from 2014 to 2018, SBW populations in blocks treated with Btk or tebufenozide were consistently reduced and generally did not require treatment in the subsequent years. Based on intensive L2 sampling, SBW populations in northern New Brunswick continued to increase from 2015 to 2017, but at a relatively slow pace (Table 1). There are no other studies of similar area-wide insect population early intervention strategies for comparison.
In 2018, SBW populations declined such that only 10 L2 points with ≥ 7/branch were detected, compared to 112 such points in 2017 (0.5% versus 5.5%; Table 1). This SBW population decline was unexpected and is not currently understood, but thought to perhaps result from parasitoids, other natural enemies, or weather factors, possibly in combination with the EIS treatments. Analyses of parasitoids and diseases in collected SBW samples are ongoing. There are numerous examples of rapid year-to-year 10- or 100-fold magnitude increases or decreases of SBW populations, e.g., [56], so we view the 2018 SBW population decline as likely a temporary reprieve rather than a continuing population trend. However, in 2018, the area of SBW defoliation detected by aerial surveys in adjacent Bas St. Laurent-Gaspésie, Québec, increased from 2,257,000 ha in 2017 to 2,728,000 ha, while only 550–2500 ha of defoliation was detected under EIS treatments in New Brunswick in 2017–2018 (Figure 7B).
There are several requirements for conducting a study such as this. The first is buy-in from a large number of stakeholders: the provincial forest management agency, regional forest industry, private woodlot owners, researchers, and the community at large. To achieve this, a huge effort has gone into communication and outreach, under the auspices of the Healthy Forest Partnership (see www.healthyforestpartnership.ca). The second requirement is a large amount of funding, because area-wide application of insecticide treatments on a trial basis is very expensive given the large areas involved. Over $17 million was spent on project insecticide treatments from 2014–2018. Funding for the first 4 years was jointly provided through proposals to the Governments of Canada and New Brunswick, forest industry, and Natural Resources Canada. A third requirement is the involvement of a large research effort, including over 30 scientists from Natural Resources Canada and five universities. Our ability to assemble these project requirements was strengthened by the DSS tools to estimate impacts of the alternative, what would happen to timber supply, direct and indirect effects on the regional economy, and employment of a large-scale uncontrolled SBW outbreak, e.g., [7,9,10]. These impacts represent billions of dollars [7].
The positive and promising results from EIS from 2015 to 2017 resulted in the Healthy Forest Partnership submitting proposals to the Canadian federal government and all four Atlantic Canada provincial governments for funding to continue the EIS SBW project. This funding request was approved, with an additional $75 million of funding for continuation from 2018 to 2023. As a result, we are able to continue the trials, and to expand the research into several new areas including assessment of the ecological benefits of an EIS on watersheds, remote sensing of low-level defoliation, and assessment of climate change effects on SBW populations. Natural Resources Canada, all four Atlantic Canada provinces, and forest industry are supportive and contributing to the required investment. A strong coalition of researchers, landowners, forestry companies, governments, forest protection experts, communities, and citizens is committed to testing this strategy.
Recent timber supply projections conducted by NB ERD for Crown land in New Brunswick have indicated that at best, the foliage protection strategy would result in a 10%–15% long-term (in 50 years) reduction in spruce-fir harvest level, and would cost more than EIS. Timber supply projections were based on uncontrolled moderate and severe SBW outbreak scenarios as used in [21], foliage protection of 20%–40% of susceptible forest area, and economic impacts of the resulting harvest reductions [7]. Extrapolation of these results for a severe SBW outbreak scenario to all four Atlantic Canada provinces, based on the per hectare detailed New Brunswick estimates, projected that an uncontrolled outbreak would cause 96 million m3 of timber harvest losses and economic cost of $15 billion over 50 years; that a foliage protection strategy on 20% of susceptible forest would reduce the harvest losses to 43 million m3 and economic cost of $5 billion, but with a treatment cost of $2 billion; whereas EIS, if successful, was projected to cost $300 million from 2014 to 2026 and result in minimal harvest and economic impacts. Therefore, the Early Intervention Strategy, if it continues to work, has been termed a $300 million (potential) solution to a $15 billion problem. These values were based on the estimated cost of continued EIS treatments for all of Atlantic Canada to 2026, the projected end of the SBW outbreak, compared to timber supply and economic impacts if SBW was uncontrolled, extrapolated from previous studies in New Brunswick [7,21].

5. Conclusions

Following 5 years of EIS treatments of low but increasing SBW populations, L2 populations across northern New Brunswick are considerably lower than SBW populations across the border in adjacent Québec. SBW populations in blocks treated with Btk or tebufenozide were consistently reduced and generally did not require treatment in the subsequent year. The differences in defoliation and SBW outbreak patterns between New Brunswick and the immediately adjacent areas of Québec are probably due to EIS, as the forest types, weather, and site conditions are similar to northern New Brunswick. SBW defoliation detected from aerial surveys was less than 2500 ha in 2017 and 550 ha in 2018 in New Brunswick, compared to over 2.5 million ha in adjacent Bas St. Laurent-Gaspésie areas of Québec. Unexpectedly, SBW populations across northern New Brunswick, based on intensive L2 sampling, showed over 90% reductions in 2018. We expect that SBW populations may well rebound after this decline, but the first 5 years of EIS trials in New Brunswick are showing overall positive results. We do not know if the EIS approach will continue to work, but after 5 years of treatments, there are dramatic differences between New Brunswick and the SBW outbreak in adjacent Québec. Research into EIS and considerations that underlie the development of a pest containment program are being addressed in an ongoing manner in the overall EIS project, which is continuing to 2023 or beyond, and includes 10 projects conducted by over 30 scientists.

Author Contributions

Project conceptualization was led by D.A.M., J.R., and R.J.; SBW population sampling by D.C. and R.J.; data analyses by L.A.-B., C.H., and R.J.; project administration by D.A.M. and P.A.; SBW treatments by P.A., L.A.-B., D.C.; funding acquisition by D.A.M. and R.J.; initial draft manuscript preparation by D.A.M.; manuscript revisions and editing by D.A.M., R.J., C.H., P.A., L.A.-B., D.C. and J.R.

Funding

This research was funded by Atlantic Canada Opportunities Agency, Natural Resources Canada, Government of New Brunswick, and forest industry in New Brunswick.

Acknowledgments

This research was overseen by the Healthy Forest Partnership, a consortium of researchers, landowners, forestry companies, governments, and forest protection experts. Many scientists and staff of industry and government agencies have made important contributions, without which the project could not have proceeded. We thank the Québec Ministère des Forêts, de la Faune et des Parcs for permission to use their SBW L2 data.

Conflicts of Interest

The authors declare no conflict of interest.

References

  1. Kettela, E.G. A Cartographic History of Spruce Budworm Defoliation 1967 to 1981 in Eastern North America; Canadian Forest Service: Ottawa, ON, Canada, 1983; p. 9.
  2. Ostaff, D.P.; MacLean, D.A. Patterns of balsam fir foliar production and growth in relation to defoliation by spruce budworm. Can. J. For. Res. 1995, 25, 1128–1136. [Google Scholar] [CrossRef]
  3. MacLean, D.A. Vulnerability of fir-spruce stands during uncontrolled spruce budworm outbreaks: A review and discussion. For. Chron. 1980, 56, 213–221. [Google Scholar] [CrossRef]
  4. Ostaff, D.P.; MacLean, D.A. Patterns of balsam fir mortality caused by an uncontrolled spruce budworm outbreak. Can. J. For Res. 1989, 19, 1087–1095. [Google Scholar]
  5. Virgin, G.V.; MacLean, D.A. Five decades of balsam fir stand development after spruce budworm-related mortality. For. Ecol. Manag. 2017, 400, 129–138. [Google Scholar] [CrossRef]
  6. Baskerville, G.L. Spruce budworm: Super silviculturist. For. Chron. 1975, 51, 138–140. [Google Scholar] [CrossRef]
  7. Chang, W.-Y.; Lantz, V.A.; Hennigar, C.R.; MacLean, D.A. Economic impacts of spruce budworm (Choristoneura fumiferana Clem.) outbreaks and control in New Brunswick, Canada. Can. J. For. Res. 2012, 42, 490–505. [Google Scholar]
  8. James, P.M.A.; Robert, L.-E.; Wotton, B.M.; Martell, D.L.; Fleming, R.A.; Robert, L. Lagged cumulative spruce budworm defoliation affects the risk of fire ignition in Ontario, Canada. Ecol. Appl. 2017, 27, 532–544. [Google Scholar] [CrossRef] [PubMed]
  9. Kneeshaw, D.; Sturtevant, B.R.; Cooke, B.; Work, T.; Pureswaran, D.; DeGrandpre, L.; MacLean, D.A. Insect disturbances in forest ecosystems. Chapter 7. In Routledge Handbook of Forest Ecology; Peh, K.S.-H., Corlett, R.T., Bergeron, Y., Eds.; Routledge: Oxon, UK, 2015; pp. 93–113. [Google Scholar]
  10. MacLean, D.A. Impacts of insect outbreaks on tree mortality, productivity, and stand development. Can. Entomol. 2016, 148, S138–S159. [Google Scholar] [CrossRef]
  11. Régnière, J.; Nealis, V.G. Ecological mechanisms of population change during outbreaks of the spruce budworm. Ecol. Entomol. 2007, 32, 461–477. [Google Scholar] [CrossRef]
  12. Johns, R.C.; Flaherty, L.; Carleton, D.; Edwards, S.; Morrison, A.; Owens, E. Population studies of tree-defoliating insects in Canada: A century in review. Can. Entomol. 2016, 148, S58–S81. [Google Scholar] [CrossRef]
  13. Royama, T.; Eveleigh, E.S.; Morin, J.R.B.; Pollock, S.J.; McCarthy, P.C.; McDougall, G.A.; Lucarotti, C.J. Mechanisms underlying spruce budworm outbreak processes as elucidated by a 14-year study in New Brunswick, Canada. Ecol. Monogr. 2017, 87, 600–631. [Google Scholar] [CrossRef]
  14. Armstrong, J.A.; Cook, C.A. Aerial Spray Applications on Canadian Forests: 1945 to 1990; Forestry Canada: Ottawa, ON, Canada, 1993; p. 274. [Google Scholar]
  15. Coulombe Commission (Commission d’étude sur la gestion de la forêt publique québécoise). Chapitre 4: Protection, conservation et gestion multiressource: Des axes de changement. In Commission d’étude sur la gestion de la forêt publique québécoise, Rapport final; Ministère des Forêts, de la Faune et des Parcs: Quebec, QC, Canada, 2004; pp. 47–92. [Google Scholar]
  16. Lévesque, R.C.; Cusson, M.; Lucarotti, C. BEGAB: Budworm Eco-Genomics: Applications & Biotechnology (BEGAB); Institut de biologie intégrative et des systèmes, Université Laval: Québec City, QC, Canada, 2010. [Google Scholar]
  17. Hennigar, C.R.; MacLean, D.A.; Quiring, D.T.; Kershaw, J.A. Differences in spruce budworm defoliation among balsam fir and white, red, and black spruce. For. Sci. 2008, 54, 158–166. [Google Scholar]
  18. LeDuc, A.; Joyal, C.; Bergeron, Y.; Morin, H. Balsam fir mortality following the last spruce budworm outbreak in northwestern Quebec. Can. J. For. Res. 1995, 25, 1375–1384. [Google Scholar]
  19. Su, Q.; Needham, T.D.; MacLean, D.A. The influence of hardwood content on balsam fir defoliation by spruce budworm. Can. J. For. Res. 1996, 26, 1620–1628. [Google Scholar] [CrossRef]
  20. Campbell, E.M.; MacLean, D.A.; Bergeron, Y. The severity of budworm-caused growth reductions in balsam fir/spruce stands varies with the hardwood content of surrounding forest landscapes. For. Sci. 2008, 54, 195–205. [Google Scholar]
  21. Hennigar, C.; Erdle, T.; Gullison, J.; MacLean, D. Re-examining wood supply in light of future spruce budworm outbreaks: A case study in New Brunswick. For. Chron. 2013, 89, 42–53. [Google Scholar] [CrossRef] [Green Version]
  22. Chang, W.-Y.; Lantz, V.A.; MacLean, D.A. Public attitudes about forest pest outbreaks and control: Case studies in two Canadian provinces. For. Ecol. Manag. 2009, 257, 1333–1343. [Google Scholar] [CrossRef]
  23. Chang, W.-Y.; Lantz, V.A.; Hennigar, C.R.; MacLean, D.A. Benefit-cost analysis of spruce budworm (Choristoneura fumiferana Clem.) control: Incorporating market and non-market values. J. Environ. Manag. 2012, 93, 104–112. [Google Scholar] [CrossRef]
  24. QMFFP: Québec Ministère des Forêts, de la Faune et des Parcs. Aires infestées par la tordeuse des bourgeons de l’épinette au Québec en 2018; Gouvernement du Québec, Direction de la protection des forêts: Québec City, QC, Canada, 2018; 20p.
  25. Miller, C.A.; Kettela, E.G. Aerial control operations against the spruce budworm in New Brunswick, 1952–1973. In Aerial Control of Forest Insects in Canada; Prebble, M.L., Ed.; Department of the Environment: Ottawa, ON, Canada, 1975; pp. 94–112. [Google Scholar]
  26. Irving, H.J.; Webb, F.E. Forest protection against spruce budworm in New Brunswick—An aerial applicator’s perspective. Pulp Pap. Can. 1981, 82, 23–31. [Google Scholar]
  27. Kline, A.W.; Lavigne, D.R.; MacLean, D.A. Effectiveness of spruce budworm spraying in New Brunswick in protecting the spruce component of spruce–fir stands. Can. J. For. Res. 1984, 14, 163–176. [Google Scholar]
  28. Fuentealba, A.; Dupont, A.; Hébert, C.; Berthiaume, R.; Quezada-García, R.; Bauce, É. Comparing the efficacy of various aerial spraying scenarios using Bacillus thuringiensis to protect trees from spruce budworm defoliation. For. Ecol. Manag. 2019, 432, 1013–1021. [Google Scholar] [CrossRef]
  29. Régnière, J.; Delisle, J.; Pureswaran, D.S.; Trudel, R. Mate-finding allee effect in spruce budworm population dynamics. Entomol. Exp. Appl. 2013, 146, 112–122. [Google Scholar]
  30. Sharov, A.A.; Liebhold, A.M.; Roberts, A.E. Optimizing the use of barrier zones to slow the spread of gypsy moth (Lepidoptera: Lymantriidae) in North America. J. Econ. Entomol. 1998, 91, 165–174. [Google Scholar]
  31. Sharov, A.A.; Leonard, D.; Liebhold, A.M.; Roberts, E.A.; Dickerson, W. “Slow the spread”: A national program to contain the gypsy moth. J. For. 2002, 100, 30–36. [Google Scholar]
  32. Eveleigh, E.S.; McCann, K.S.; McCarthy, P.C.; Pollock, S.J.; Lucarotti, C.J.; Morin, B.; McDougall, G.A.; Strongman, D.B.; Huber, J.T.; Umbanhowar, J.; et al. Fluctuations in density of an outbreak species drive diversity cascades in food webs. Proc. Natl. Acad. Sci. USA 2007, 104, 16976–16981. [Google Scholar] [CrossRef] [Green Version]
  33. Huber, J.; Eveleigh, E.; Pollock, S.; McCarthy, P. The Chalcidoid parasitoids and hyperparasitoids (Hymenoptera: Chalcidoidea) of Choristoneura species (Lepidoptera: Tortricidae) in America north of Mexico. Can. Entomol. 1996, 128, 1167–1220. [Google Scholar]
  34. Miller, J.D.; MacKenzie, S.; Foto, M.; Adams, G.W.; Findlay, J.A. Needles of white spruce inoculated with rugulosin-producing endophytes contain rugulosin reducing spruce budworm growth rate. Mycol. Res. 2002, 106, 471–479. [Google Scholar] [CrossRef]
  35. Frasz, S.L.; Walker, A.K.; Nsiama, T.K.; Adams, G.W.; Miller, J.D. Distribution of the foliar fungal endophyte Phialocephala scopiformis and its toxin in the crown of a mature white spruce tree as revealed by chemical and qPCR analyses. Can. J. For. Res. 2014, 44, 1138–1143. [Google Scholar] [CrossRef]
  36. MacLean, D.A.; Erdle, T.A.; MacKinnon, W.E.; Porter, K.B.; Beaton, K.P.; Cormier, G.; Morehouse, S.; Budd, M. The Spruce Budworm Decision Support System: Forest protection planning to sustain long-term wood supplies. Can. J. For. Res. 2001, 31, 1742–1757. [Google Scholar] [CrossRef]
  37. Hennigar, C.R.; MacLean, D.A.; Porter, K.B.; Quiring, D.T. Optimized harvest planning under alternative foliage-protection scenarios to reduce volume losses to spruce budworm. Can. J. For. Res. 2007, 37, 1755–1769. [Google Scholar] [CrossRef]
  38. Hennigar, C.R.; Wilson, J.S.; MacLean, D.A.; Wagner, R.G. Applying a spruce budworm decision support system to Maine: Projecting spruce-fir volume impacts under alternative management and outbreak scenarios. J. For. 2011, 109, 332–342. [Google Scholar]
  39. McLeod, I.M.; Lucarotti, C.J.; Hennigar, C.R.; MacLean, D.A.; Holloway, A.G.L.; Cormier, G.A.; Davies, D.C. Advances in aerial application technologies and decision support for integrated pest management. In Integrated Pest Management and Pest Control; Soloneski, S., Larramendy, M.L., Eds.; InTech Open Access Publisher: Rijeka, Croatia, 2012; pp. 651–668. ISBN 978-953-307-926-4. [Google Scholar]
  40. Miller, C.A.; Kettela, E.G.; McDougall, G.A. A Sampling Technique for Overwintering Spruce Budworm and Its Applicability to Population Surveys; Canadian Forestry Service: Fredericton, NB, Canada, 1971; p. 11.
  41. Zhang, B.; MacLean, D.A.; Johns, R.C.; Eveleigh, E.S. Effects of hardwood content on balsam fir defoliation during the building phase of a spruce budworm outbreak. Forests 2018, 9, 530. [Google Scholar] [CrossRef]
  42. Bognounou, F.; De Grandpré, L.; Pureswaran, D.S.; Kneeshaw, D. Temporal variation in plant neighborhood effects on the defoliation of primary and secondary hosts by an insect pest. Ecosphere 2017, 8, e01759. [Google Scholar] [CrossRef]
  43. Martel, V.; Johns, R.C.; Eveleigh, E.; McCann, K.; Pureswaran, D.; Sylvain, Z.; Morrison, A.; Morin, B.; Owens, E.; Hébert, C. Landscape level impacts of EIS on SBW, other herbivores and associated natural enemies (ACOA RD100 2.2.2). In Proceedings of the SERG-I Workshop, Fredericton, NB, Canada, 2–5 February 2017; pp. 112–118. [Google Scholar]
  44. R Core Team. R: A Language and Environment for Statistical Computing; R Foundation for Statistical Computing: Vienna, Austria, 2017; Available online: https://www.R-project.org (accessed on 23 April 2019).
  45. Mangiafico, S. Rcompanion: Functions to Support. Extension Education Program. Evaluation, Package Version 2.1.7; 2019. Available online: https://CRAN.R-project.org/package=rcompanion (accessed on 23 April 2019).
  46. De Rosario-Martinez, H. Phia: Post-Hoc Interaction Analysis, R Package Version 0.2-1; 2015. Available online: https://CRAN.R-project.org/package=phia (accessed on 23 April 2019).
  47. Van Frankenhuyzen, K. Development and current status of Bacillus thuringiensis for control of defoliating forest insects. In Forest Insect Pests in Canada; Armstrong, J.A., Ives, W.G.H., Eds.; Canadian Forest Service: Ottawa, ON, Canada, 1995; pp. 315–325. [Google Scholar]
  48. Kreutzweiser, D.; Nicholson, C. A simple empirical model to predict forest insecticide ground-level deposition from a compendium of field data. J. Environ. Sci. Health Part B 2007, 42, 107–113. [Google Scholar] [CrossRef]
  49. Sundaram, K.M.S. Persistence and mobility of tebufenozide in forest litter and soil ecosystems under field and laboratory conditions. Pestic. Sci. 1997, 51, 115–130. [Google Scholar] [CrossRef]
  50. Thompson, D.; Kreutzweiser, D. A review of the environmental fate and effects of natural ‘reduced risk’ pesticides in Canada. In Crop Protection Products for Organic Agriculture: Environmental, Health, and Efficacy Assessment; Racke, K.D., Felsot, A., Eds.; ACS Books, American Chemical Society: Washington, DC, USA, 2007; pp. 245–274. [Google Scholar]
  51. Sundaram, K.M.S. Photostability and rainfastness of tebufenozide deposits of fir foliage. In Biorational Pest Control Agents; American Chemical Society: Washington, DC, USA, 1995; pp. 134–152. [Google Scholar]
  52. Addison, J.A. Safety testing of tebufenozide, a new molt-inducing insecticide for effects on non-target forest soil invertebrates. Ecotoxicol. Environ. Saf. 1996, 33, 55–61. [Google Scholar] [CrossRef]
  53. Kreutzweiser, D.; Capell, S.; Wainio-Keizer, K.; Eichenberg, D. Toxicity of new molt inducing insecticide (RH-5992) to aquatic macroinvertebrates. Ecotoxicol. Environ. Saf. 1994, 28, 14–24. [Google Scholar] [CrossRef]
  54. Kreutzweiser, D.P.; Gunn, J.M.; Thompson, D.G.; Pollard, H.G.; Faber, M.J. Zooplankton community responses to a novel forest insecticide, tebufenozide (RH-5992), in littoral lake enclosures. Can. J. Fish. Aquat. Sci. 1998, 55, 639–648. [Google Scholar] [CrossRef]
  55. US Department of Agriculture, Forest Service. Gypsy Moth Management in the United States: A Cooperative Approach: Final Supplementary Environmental Impact Statement; US Department of Agriculture Forest Service: Newtown Square, PA, USA, 2012; Volume 1, p. 11.
  56. Royama, T.; MacKinnon, W.E.; Kettela, E.G.; Carter, N.E.; Hartling, L.K. Analysis of spruce budworm outbreak cycles in New Brunswick, Canada, since 1952. Ecology 2005, 86, 1212–1224. [Google Scholar] [CrossRef]
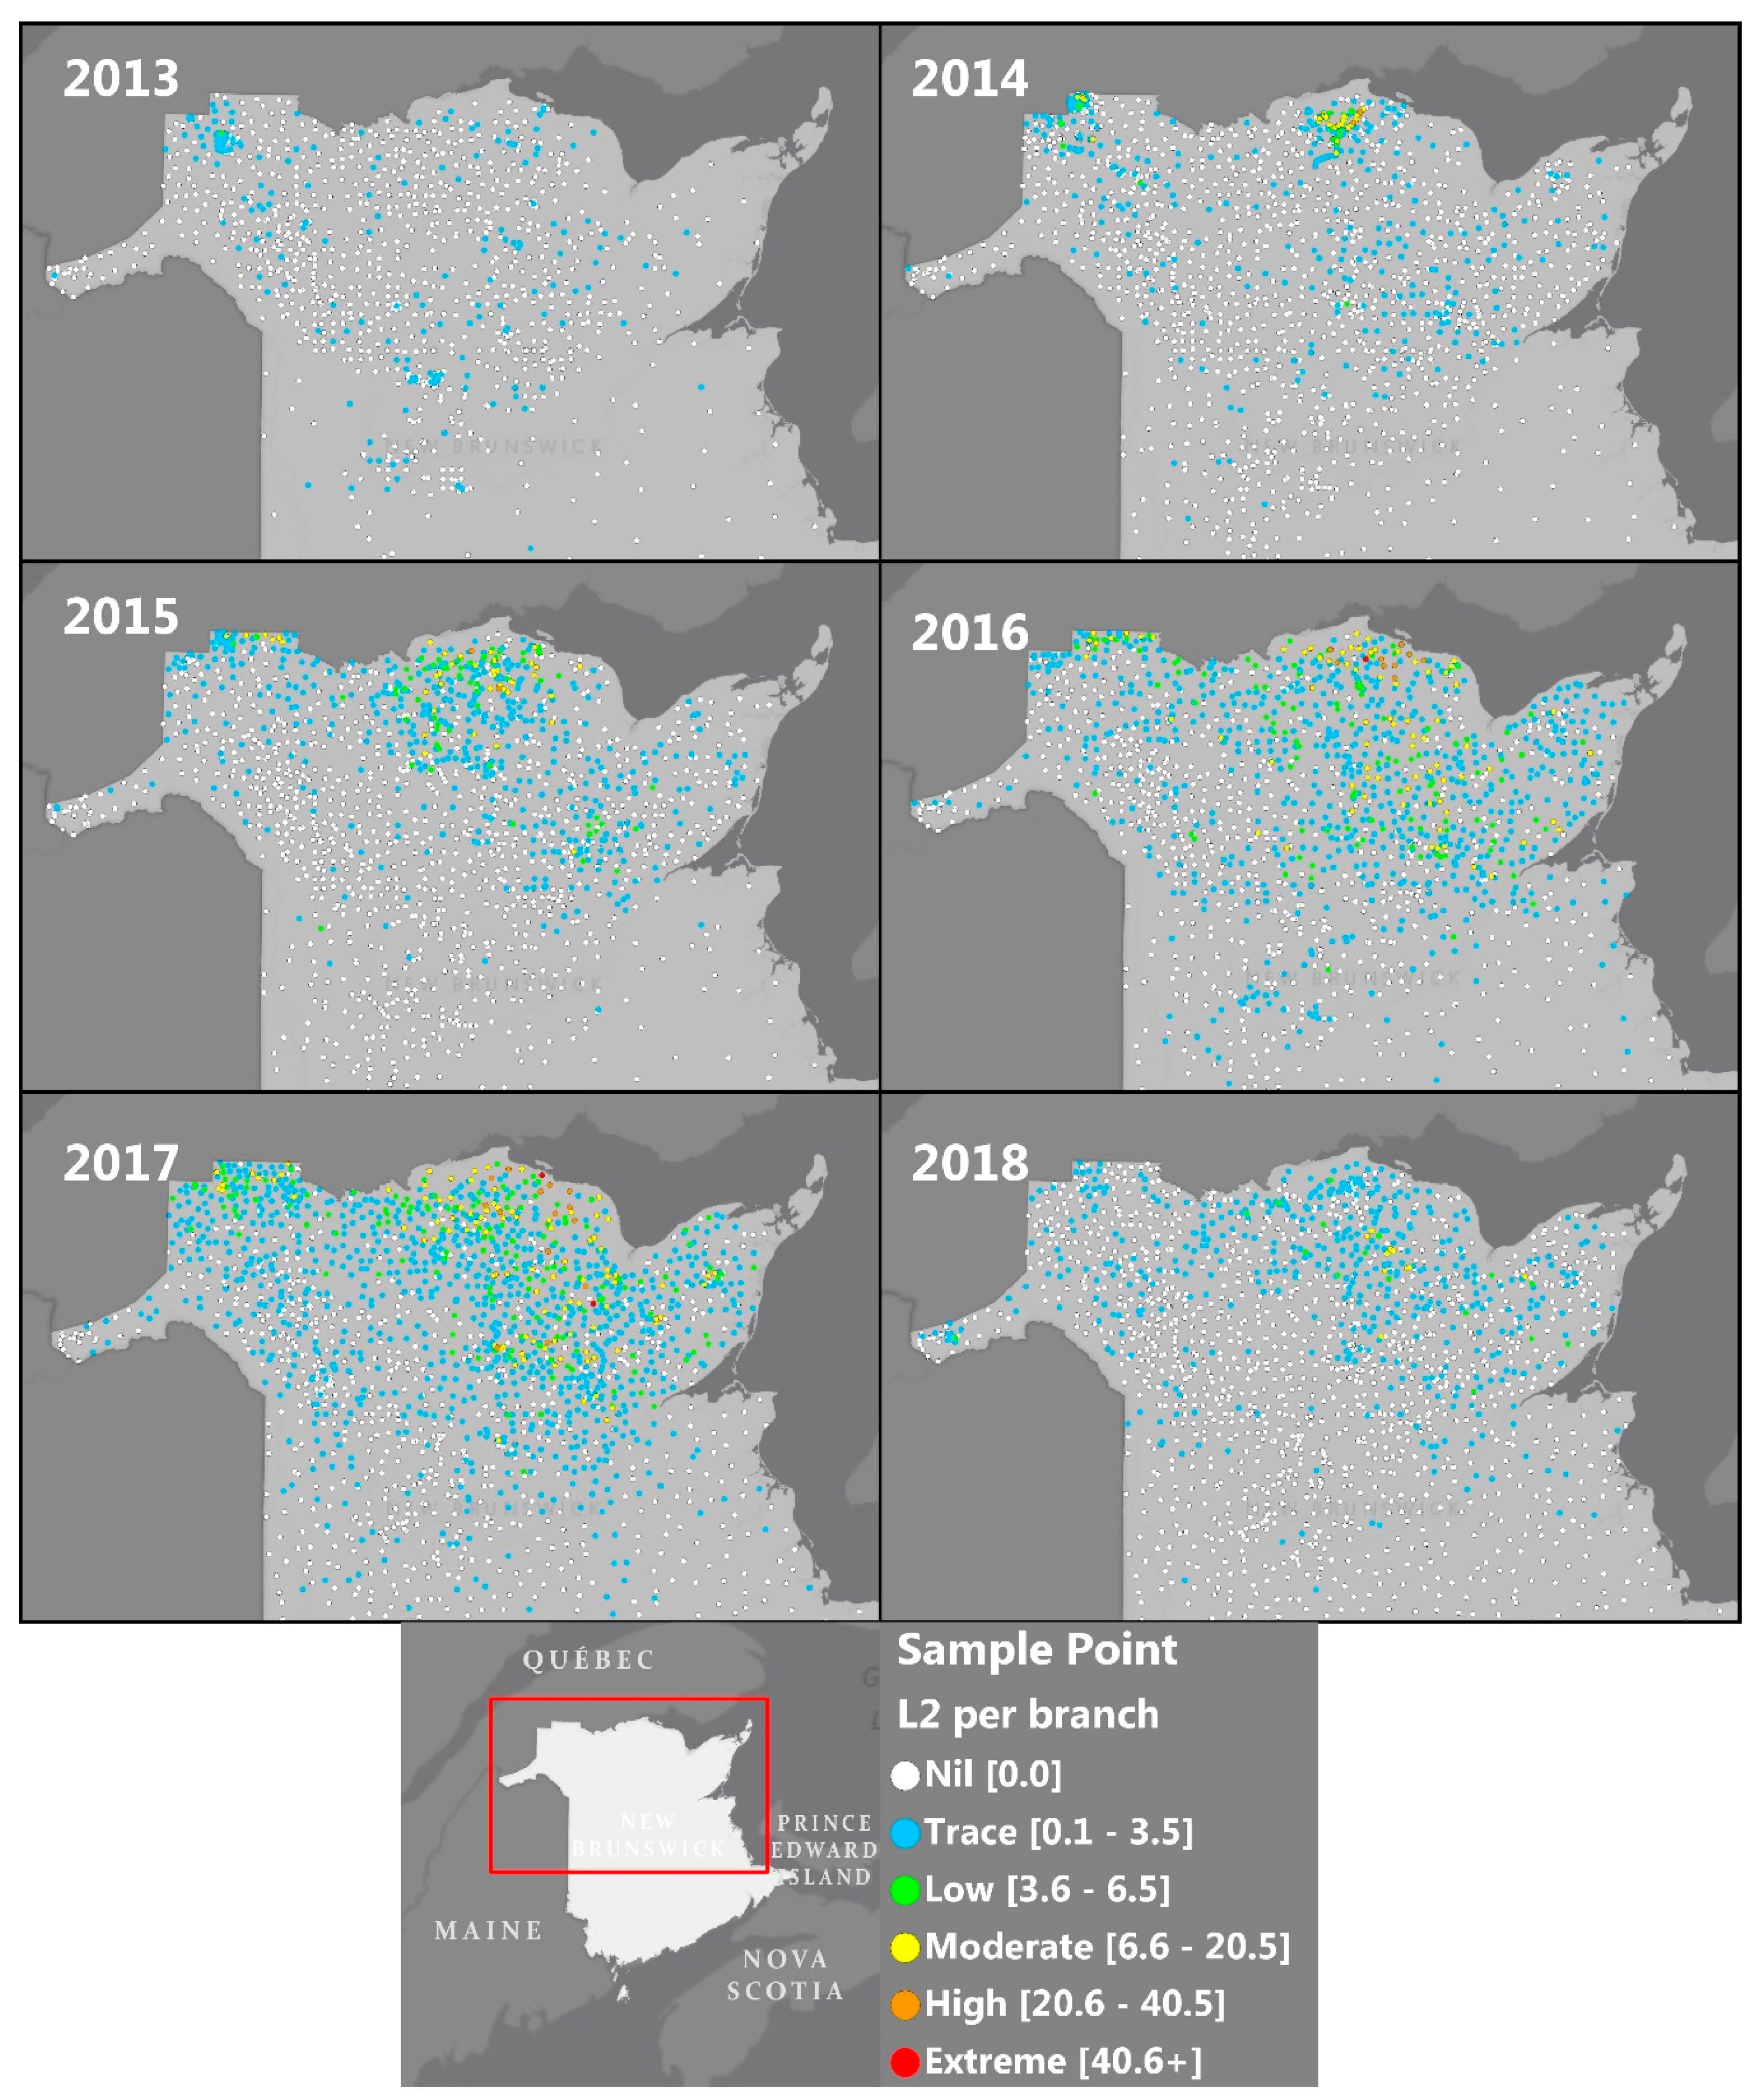
Figure 1. SBW L2 sample points in New Brunswick from 2013 to 2018. These L2 point data were spatially interpolated and used to plan treatment areas (generally ≥ 7 L2/branch), using an optimized blocking algorithm described in Section 2.3.
Forests 10 00448 g001
Figure 2. The EIS SBW treatment priority and blocking tool process.
Forests 10 00448 g002
Figure 3. Inputs required for developing the 2018 treatment priority raster map, including: (A) interpolated L2 population, (B) treatment exclusion areas, (C) stand percent spruce-fir, and (D) the final treatment priority map as a function of scaled L2 plus percent spruce-fir content with treatment exclusion areas removed.
Forests 10 00448 g003
Figure 4. Optimum blocked raster solution (A,B) generated by ForPRO II for the 2018 EIS SBW treatment priority layer (Figure 3D) and (C) adjusted final polygon blocks digitized by FPL analysts.
Forests 10 00448 g004
Figure 5. Areas treated with insecticides (Btk or tebufenozide), or pheromone in EIS SBW trials each year from 2014 to 2018 in New Brunswick.
Forests 10 00448 g005
Figure 6. (A) Successive areas treated with Btk or tebufenozide insecticides each year from 2014 to 2018. (B) Comparison of 2017 treatment areas and autumn 2017 L2 samples with ≥ 7 L2/branch.
Forests 10 00448 g006
Figure 7. SBW L2 population (A) and aerial survey defoliation (B) in 2017, after 4 years of EIS treatments in northern New Brunswick and adjacent Québec (the border between the two provinces is indicated by the blue line in (B)).
Forests 10 00448 g007
Table 1. Percentage of SBW L2 samples in New Brunswick in six second instar larvae (L2) classes, each year from 2013–2018. Three mid-crown branches were sampled at each sample point each year. Locations of sample points are shown in Figure 1.
Year% of L2 Samples by L2/Branch Class (in Parentheses)No. Sample Points
Nil
(0)
Trace
(0.1–3.5)
Low
(3.6–6.5)
Moderate
(6.6–20.5)
High
(20.6–40.5)
Extreme
(>40.5)
201383170.00.00.00.01136
201482170.50.50.00.01503
201568263.42.20.10.01561
201648406.44.50.60.11649
201743447.14.70.70.11964
201874250.90.50.00.01851
Table 2. Area treated by active ingredient during the EIS-SBW Project (2014–2018).
YearArea Treated by Active Ingredient (ha)
Bacillus thuringiensis K.TebufenozidePheromoneTotal
201416944724905131
2015 112,093326327115,627
2016 236,88919,719100057,608
201779,08868,1420147,230
2018 3104,66094,403633199,696
Total232,899189,9992394 4425,292
1 Consisted of 12,093 ha of double application of Btk. 2 Included 5000 ha of double application of Btk. 3 Included 22,220 ha of double application and 734 ha of triple application of Btk. 4 Pheromone trials were experimental and have not yet had sufficient efficacy for more widespread use.
Table 3. Mean and standard error (SEM) number of SBW second instar larvae (L2) per branch from samples taken before and after budworm protection treatment, each year from 2015–2018, comparing treated samples with untreated samples within 3 km and 3–6 km adjacent to treated blocks. Treated values are shown in bold and % difference from pre- to post-treatment is shown.
YearTreatment 1Pre-Treatment 2
L2/Branch
Post-Treatment 2
L2/Branch
Difference (Pre-Post Treatment) 4F 5
N 3MeanSEMN 3MeanSEM
2015Treated (0 km)2012.90.31651.80.32−1.13.4 *
Untreated < 3 km1162.00.30463.50.74+1.48.9 ***
Untreated 3–6 km330.470.14302.00.44+1.66.6 *
2016Treated (0 km)776.20.63843.80.70−2.415 ***
Untreated < 3 km1561.80.231213.70.63+1.910 ***
Untreated 3–6 km951.10.15733.80.91+2.712 ***
2017Treated (0 km)1497.50.681583.00.48−4.565 ***
Untreated < 3 km1712.40.351954.60.48+2.225 ***
Untreated 3–6 km1491.30.171923.20.34+1.820 ***
2018Treated (0 km)2097.30.532090.340.05−7.0619 ***
Untreated < 3 km2622.40.241910.880.14−1.575 ***
Untreated 3–6 km1851.40.121420.800.15−0.6248 ***
1 Treated = Btk or tebufenozide treatment; Untreated = surrounding area within 3 km or 3–6 km. 2 Pre-treatment L2 were sampled in the previous autumn, and post-treatment L2 were sampled in the autumn of the year after treatment. 3 Total N = 3309 points sampled over 4 years, each consisting of 3 branch samples per point. 4 Pre-treatment mean L2/branch minus post-treatment mean, so decreases are negative and increases are positive. 5 * p < 0.05, ** p < 0.01, *** p < 0.001