Abstract
We investigated the potential economic impacts of future spruce budworm (Choristoneura fumiferana Clem.) (SBW) outbreaks on 2.8 million ha of Crown land in New Brunswick, Canada and compared an early intervention strategy (EIS) with foliage protection approaches. We coupled the Spruce Budworm Decision Support System (SBW DSS) with a Computable General Equilibrium (CGE) model to assess the impacts of EIS and foliage protection on 0%, 5%, 10%, and 20% of susceptible Crown (publicly owned) forest, under moderate and severe SBW outbreak scenarios. Cumulative available harvest supply from 2017 to 2067 was projected to be reduced by 29 to 43 million m3, depending upon SBW outbreak severity, and a successful EIS approach would prevent this loss. These harvest reductions were projected to reduce total economic output by $25 billion (CAD) to $35 billion. Scenarios using biological insecticide foliage protection over 20% of susceptible Crown forest area were projected to reduce losses to 6–17 million m3 and $0.5–4.1 billion. Depending upon SBW outbreak severity, EIS was projected to have benefit/cost ratios of 3.8 to 6.4 and net present values of $186 million to $353 million, both higher than foliage protection strategies. Sensitivity analysis scenarios of ‘what if’ EIS partially works (80% or 90%) showed that these produced superior timber harvest savings than the best foliage protection scenario under severe SBW outbreak conditions and generally superior results under moderate outbreak scenarios. Overall, results support the continued use of EIS as the preferred strategy on economic grounds to protect against SBW outbreaks on Crown land in New Brunswick.
1. Introduction
The forest sector is one of the most significant components of the Canadian economy, and contributed 8% to 10% of the manufacturing gross domestic product (GDP) from 2010 to 2015 [1]. Approximately $38 billion CAD of annual total economic output was generated by the forest sector in 2014, accounting for almost 6% of all Canadian exports, worth $30.7 billion CAD [1]. However, economic value of the forest sector is vulnerable to natural disturbances that reduce timber supply and cause large-scale economic losses. Pest outbreaks and forest fires are the dominant natural disturbances that affect the forest sector in Canada [2,3,4,5]. In eastern Canada, spruce budworm (Choristoneura fumiferana Clem.) (SBW) outbreaks have impacted millions of hectares of spruce-fir forests every 30–40 years, and the outbreaks that generally last about 10–15 years have destroyed hundreds of millions of cubic meters of timber [6,7,8].
To protect against forest pest outbreaks, various forest management/protection strategies have been used to reduce timber supply loss and tree mortality caused by forest pest outbreaks. These include (1) foliage protection using biological pesticides (i.e., Bacillus thuringiensis Kurstaki (Btk) or tebufenozide) on SBW infested stands to keep trees alive [4,9]; (2) salvage harvesting of dying or dead trees while they were still usable [10,11]; (3) re-planning harvest schedules to retain less vulnerable stand types or ages [12]; or (4) planting less vulnerable tree species [13]. Foliage protection using chemical pesticides in past decades [14] or biological pesticides today, salvage, or planting less susceptible spruce (Picea sp.) plantations to replace balsam fir (Abies balsamea (L.) Mill.) are the primary strategies used. During the last SBW outbreak in New Brunswick (NB), over 1.5 million ha of spruce-fir forest was treated with insecticides annually from 1970 to 1983 [15], which effectively prevented extensive spruce-fir mortality, unlike that which occurred in Cape Breton, Nova Scotia, where SBW-caused mortality exceeded 85% of the forest [8].
An alternative to a foliage protection strategy could be an ‘early intervention strategy’ (EIS) focused on altering SBW population dynamics before a full outbreak occurs [16,17,18]. The concept of a SBW EIS suggests that identification of low but rising SBW populations in ‘hot spots’ could be targeted for treatment with pesticide before defoliation occurs (i.e., much earlier in the SBW outbreak development than in past treatments [17]) and that this could either slow or prevent the progression of the SBW population rise in the treated area. Recent research in Québec has demonstrated low mating success of female SBW moths when populations are at low levels [19], and the EIS aims to use this feature by detecting low but rising SBW population hot spots and treating these with biological insecticides Btk or tebufenozide [16].
Chang et al. [2] evaluated market and non-market benefits and costs of controlling a future SBW outbreak on all Crown (publicly-owned) forest in NB. They used a timber supply model to estimate the potential timber harvest revenue benefits and the costs of pest control efforts [4], and a contingent valuation method [20] to estimate the non-market benefits of forest protection against SBW. Results showed that a pest control program protecting 10%–20% of the susceptible Crown forest had the highest benefit-cost ratio of 3.2–4.0 and net present value of $59–111 million, with the ranges of values for moderate and severe SBW outbreak scenarios [2].
Chang et al. [3] also used a recursive dynamic Computable General Equilibrium (CGE) model and timber supply losses projected using the SBW Decision Support System (DSS; [21]) to investigate the potential economic impacts of foliage protection, salvage and re-planning harvest scheduling. A total of 16 forest protection scenarios were examined: two SBW outbreak severities (moderate vs. severe), four SBW control program levels (0%, 10%, 20%, and 40% protection of susceptible Crown forest area), and two pest management strategies (with or without re-planning scheduling and salvage). They found that a total of $3.3 and $4.7 billion (CAD) in present value lost output would result from uncontrolled moderate and severe SBW outbreak scenarios, respectively, over the 2012–2041 period in NB [3]. Total output value loss was projected to decrease by 40%, 56%, and 66% when spraying biological pesticides on 10%, 20%, and 40% of susceptible Crown forest areas, respectively [3]. Combining SBW control with re-planning scheduling and salvage strategy was projected to reduce the negative impacts of SBW outbreak by a further 1%–18% of output value depending on the level of control implemented.
In this paper, we used methods generally similar to those of Chang et al. [2,3] to evaluate the potential economic costs, benefits and economy-wide impacts of EIS compared to foliage protection strategies on NB Crown forest. Since EIS effectiveness is still being investigated [17], our analysis used past SBW outbreak scenarios (e.g., [4]) and results to date of EIS trials conducted on over 425,000 ha of NB forest from 2014 to 2018 [18]. Chang et al. [3] used a relatively simple CGE model, and we developed a more detailed CGE model to evaluate effects of SBW outbreak, foliage protection, and EIS, on the regional economy in NB. Objectives of this study were to (1) assess the potential timber volume savings associated with implementing a SBW EIS (assuming that EIS works), under moderate and severe SBW outbreak scenarios, compared to impacts under foliage protection on 0%, 10%, 20%, and 40% of susceptible Crown forest; (2) evaluate costs, benefits, and economy-wide impacts of EIS and foliage protection strategies on Crown forest under moderate and severe outbreak scenarios; and (3) test two sensitivity analyses, of costs/benefits if EIS partially works, resulting in saving 80% or 90% of the harvest volume reductions resulting from an uncontrolled outbreak scenario.
2. Methods
2.1. Study Area
The study area was all Crown land in NB, one of three Maritime Provinces in eastern Canada. NB is 85% forested [22] and approximately 50% (3.4 million ha) is Crown land owned by the provincial government and managed by forest industry. Generally, the NB Crown forest is spread across the province, but much of it lies in large, consolidated blocks in the central, northcentral, and northwest regions. For management purposes, the NB Crown land is divided into 10 Crown Licenses and leased to six forest companies [22].
The forest sector in NB includes more than 200 company locations and directly employs approximately 10,600 workforce [23]. Another 3400 people are indirectly employed by the forest sector, which builds on close to 500 forestry and logging operation locations (2011). The forest sector directly contributes about 4.4% of annual gross domestic production (i.e., $969 million CAD during 2011), and accounts for over 10% of total merchandise exports (i.e., $1.522 billion) [23]. Moreover, there is a significant indirect economic impact given the industry’s strong linkages with other sectors of the economy such as metal fabrication, transportation and distribution, and professional and technical services [23]. Overall, NB is the most forest-dependent economy of any province in Canada [24].
Historically, SBW outbreaks have been the most devastating factor that causes large-scale defoliation and mortality on balsam fir and spruce stands in NB. For example, approximately 3.5 and 2.0 million ha of forestlands were moderately-severely defoliated (30%–100% of current year foliage) in the peak years of 1975 and 1983 during the 1970s–1980s SBW outbreak in the province [25]. SBW outbreaks in NB have recurred every 30–40 years [26], and a severe SBW outbreak is underway in Québec and beginning in the adjacent areas of northern NB [27]. With the first defoliation detected in NB in 2015, it is widely believed that a new provincial-scale SBW outbreak is beginning [18].
To protect against a potential SBW outbreak and test the impact of EIS, a SBW EIS research program was conducted in NB from 2014 to 2018 in an $18 million project [16,17,18]. As part of this, the ongoing SBW monitoring program was approximately doubled, with much of the additional annual SBW overwintering larvae sampling on mid-crown branches contributed by forest industry crews. Based on positive results to date, the EIS research trial is being continued from 2018 to 2022, with an additional $75 million of funding from the Government of Canada. The EIS trials on increasing SBW populations in northern NB resulted in insecticide treatment of hotspots covering 15,300, 56,800, 150,000, and 200,000 ha in 2015, 2016, 2017, and 2018, respectively [18]. Continuation of these SBW EIS test results will determine the effectiveness of EIS, but results have been positive to date [18].
2.2. SBW DSS Model
The timber supply impacts of potential SBW outbreak scenarios on Crown forest in NB were assessed using Accuair ForPRO, the most recent version of the SBW DSS [4,28]. This system consists of three components: (1) a SBW pre-defined tree defoliation-damage multiplier file [29], which alters stand dynamics in terms of tree growth and survival; (2) a stand impact matrix [21], which estimates relative stand volume reductions over time in different forest types as a function of stand dynamics with and without defoliation and insecticide treatment scenarios; and (3) a timber supply model [30], specifically a model developed by NB Department of Energy and Resource Development (NB ERD) for NB Crown land, which optimizes the schedule of stand interventions and harvest treatments over time to maximize the sustainable supply of forest values (e.g., timber, habitat, water quality) from 2017 to 2097. Overall, the ForPRO system links these three components to quantify the timber harvest volume impacts of SBW outbreak scenarios (defined as annual defoliation over each year of an outbreak) and benefits of insecticide treatments during the simulation period.
Each Crown License was assumed to re-plan their original timber harvest schedule and to implement salvage activities to harvest dead and dying trees, when feasible, in response to the potential SBW outbreak, since re-planning harvest scheduling and salvage can substantially reduce SBW impacts [3,31]. Salvage harvesting to capture defoliation-caused mortality and re-planning to modify the harvest schedule in light of defoliation-caused stand development changes can partially mitigate wood supply impact of an SBW outbreak [4]. For Crown land in NB, Hennigar et al. [4] showed that salvage and re-planning reduced wood supply impacts that accumulated over the 15 years after outbreak onset by about 20% for moderate and severe outbreak scenarios. Additionally, linear programming was used to minimize the SBW impacts on spruce-fir-jack pine (Pinus banksiana) harvest and total timber volume harvest and also to optimally prioritize areas for foliage protection treatments. More details of Accuair ForPRO DSS implementation are given in [4,28].
2.3. SBW Outbreak and Control Scenarios
To simulate SBW impacts in the Accuair ForPRO system, effects of 5-year cumulative defoliation levels were calculated and analyzed. Current-year defoliation patterns for balsam fir under moderate and severe outbreak scenarios [21] were used to estimate the annual SBW population (overwintering second-instar larvae (L2) per branch) using a linear relationship between balsam fir defoliation and SBW L2 population calculated by NB ERD. The SBW L2 population patterns were input into the Accuair ForPRO System, which calculated 5-year cumulative defoliation patterns for each host tree species. To reflect differing defoliation patterns among SBW host tree species, defoliation of white spruce (Picea glauca (Moench) Voss), red spruce (Picea rubens Sarg.), and black spruce (Picea mariana (Mill.) B.S.P.) were scaled to 72%, 41%, and 28% that of balsam fir [32]. However, these relative differences between fir and other host tree species were assumed to not occur at very high SBW population levels, when balsam fir defoliation was 90%–100%; i.e., if balsam fir defoliation was very high, spruce defoliation also would be higher.
To evaluate the impacts of future SBW outbreaks and effectiveness of alternative forest protection strategies, a scenario planning approach [33] was used. Overall, a total of 12 future SBW outbreak and forest protection scenarios were analyzed using the Accuair ForPRO system over an 80-year (2012–2092) period. Scenarios included two future SBW outbreak patterns (moderate and severe), each for EIS, no protection, re-planning only, and three foliage protection strategies (5%, 10%, or 20% of the area protected each year) scenarios.
The no protection scenario assumed no insecticide treatments to control a future SBW outbreak, and the resulting projected available harvest supply losses were used as the baseline for comparison with the defoliation control scenarios, to determine the marginal available harvest supply benefits of protection. The EIS scenario assumed that biological insecticide (i.e., Btk or tebufenozide) would be applied in all years in SBW hotspots [18]. The insecticide spray treatment varied based on the number of detected overwintering SBW L2 larvae per branch that were detected: (1) no protection with ≤6 L2/branch; (2) applying one Btk or tebufenozide application in all SBW hotspots with 7–20 L2/branch; and (3) applying two Btk applications in SBW hotspots when >20 L2/branch were detected. The objective of these EIS treatments was to keep SBW population levels low and maintain SBW defoliation below 10%. Additionally, the L2 sample point data (1500–2000 points sampled each year from 2014 to 2018 [18]) was converted to a spatial layer using spatial interpolation (80 × 80 m cells). Then EIS treatments were prioritized based upon the interpolated L2 raster and the percentage of spruce-fir. Overall, higher spray priority values occurred with larger number of L2/branch and with higher percentage of host species located in those areas. More details of the actual pest control treatment blocking and treatments are described in [18].
The foliage protection scenarios tested assumed that biological insecticides were applied to protect foliage in all years of the simulated moderate or severe SBW outbreaks. Insecticide treatment was simulated to be applied to 5%, 10%, or 20% of susceptible Crown forest area by spraying Btk or tebufenozide in all years when balsam fir defoliation exceeds 40%. In addition, re-planning of harvesting was combined with insecticide spray treatments in simulations, to minimize the defoliation-caused impact on NB timber volume harvest. The overall objective of foliage protection was to reduce defoliation to the NB ERD foliage protection target of 50% for balsam fir.
In previous analyses [34], we tested a combined EIS and foliage protection scenario, which assumed that the initial EIS treatments failed to slow or prevent the progression of SBW outbreak rise, and a moderate or severe SBW outbreak would occur. Results of these combined EIS + foliage protection scenarios were largely indistinguishable, in terms of pattern of timber supply reductions over time, from the comparable foliage protection scenario, slightly higher and somewhat later in time [34]. Therefore, we decided not to include such analyses in the current paper, partly because after 5 years of trials EIS appears to be working [18] and because results were so similar to the comparable foliage protection scenario [34]. Instead, we tested two ‘what if’ sensitivity analysis scenarios, assuming that EIS worked partially, resulting in saving 80% or 90% of the harvest volume reductions resulting from an uncontrolled outbreak scenario. Our rationale here was to test ‘what if’ EIS generally works in keeping SBW population levels low, but that some defoliation occurs, which results in low impacts (10% or 20% of the full outbreak scenario).
There are divergent views about the processes involved in the early stages of an SBW outbreak, as described by Johns et al. [17]. Areas to be treated with insecticide under the foliage protection scenarios were calculated based on the moderate or severe SBW outbreak scenario duration [9], area of susceptible forest in NB [4], and 5%, 10%, or 20% of susceptible forest to be protected. Areas to be treated annually under the EIS scenario were estimated based on several assumptions: (1) the SBW hotspot dynamic determining treatment areas would follow a similar pattern to the SBW population dynamic, spreading from existing hotspots to a larger geographical area; (2) actual measured growth rate of SBW hotspot areas was used from 2015 to 2017; (3) SBW population increases would last 10 years, 2016 to 2026; (4) SBW populations would begin to decrease in northern NB in 2021–2024; (5) there is less spruce-fir area to treat in southern NB than in northern NB; and (6) if EIS treatments are effective and moth in-flights from Québec decline after 2020, the growth rate and duration of SBW hotspot area also would decline. Overall, the total SBW hotspot area requiring EIS treatments was predicted to increase from 15,900 ha in 2015 to 562,500 ha from 2020 to 2022, and then decline to 161,370 ha by 2026. MacLean et al. [18] describe positive results of the first 5 years of EIS treatments in NB, corroborating the initial years of the simulation scenarios.
2.4. CGE Model
A CGE model was used to estimate the regional economic impacts of SBW outbreak and forest protection scenarios on the NB economy. This CGE model, which comprised a series of simultaneous linear and non-linear equations (described in Appendix A Table A1, Table A2 and Table A3), was similar in structure to those of [35,36,37,38].
In the model, the NB economy was defined as a single region that is recursive dynamic and deterministic in nature, with the assumption of a small-open-economy and constant returns to scale technology. The model was calibrated to the regional economy of NB in 2010 (the latest year for which data were available) using NB input-output data from Statistics Canada [39]. Following the Canadian System of National Accounts [40], the NB economy consisted of 32 sectors, but for ease of presentation, we aggregated 12 sectors that were least impacted by a potential SBW outbreak. Overall, 20 sectors were defined: crop and animal; forestry and logging; fishing, hunting, and trapping; support activities for agriculture and forestry; mining and oil and gas extraction; utilities; construction; manufacturing; wholesale trade; retail trade; transportation and warehousing; information and cultural industries; finance, insurance, real estate, rental and leasing, and holding companies; professional, scientific, and technical services; administrative and support, waste management, and remediation services; educational services; health care and social assistance; arts, entertainment and recreation; accommodation and food services; and other services (except public administration) sectors. In addition, we assumed that producers from each sector produce intermediate and primary goods or provide services.
Three primary factors were considered in this study: (1) labor, (2) capital, and (3) stumpage, which is the market value of standing trees that must be paid by firms for the right to harvest timber, measured in $/cubic meter. Several assumptions were made in association with these primary factors. First, we assumed that labor was mobile and employed across all sectors, and the labor supply was fixed without the effect of interprovincial/international labor movement. Thus, the labor market followed the neoclassical economic theory of labor market, suggesting that labor was only affected by adjustment of the wage rate [41,42]. As a result, labor input could be calculated by aggregating wages and salaries, supplementary labor income, and mixed income from the input-output table [39]. Capital was assumed to be mobile and used in production across all sectors. Therefore, capital could freely move from one industry to another in the economy, but with a different rental rate [42]. Capital input was defined as the summation of taxes on products and production, subsidies on products and production, and gross operating surplus (except stumpage expenditures, as described below) from the 2010 NB input-output table [39]. Stumpage, the third primary factor, was defined only for the forestry and logging sector. While stumpage expenditures were included in gross operating surplus in the Statistics Canada input-output table, Statistics Canada does not report separately on this expenditure. Therefore, we followed Chang et al. [3] by using stumpage revenue data from the National Forestry Database [43] as input in the forestry and logging sector. We subtracted this value from gross operating surplus to appropriately adjust the capital input described above.
With regard to model structure, simultaneous linear and non-linear equations (Appendix A Table A3) were used to describe: (1) the behavior of economic agents; (2) market conditions; (3) macroeconomic balances; and (4) growth projections for primary inputs between periods. Overall, these equations were designed to operate recursively for each year over 50 years.
Regarding the behavior of economic agents, producers were assumed to simultaneously maximize their profit and minimize their production cost. To explain the behavior of producers, a constant elasticity of substitution (CES) production technology was assumed. Through the CES function, producers could make their choice between primary factors and thereby could substitute primary factors freely in response to the change of factor prices to produce a most efficient final value-added composite. Once the fraction of primary factors was determined, a Leontief-type technology was adopted to combine value-added composite with a fixed-share of intermediate demands. Specifically, the fixed-share of intermediate demands was assumed since the proportion of intermediate demands was only determined by existing technology rather than producers’ decisions on primary factors [35]. Overall, the final output price would be derived from the combined costs of value-added composite and intermediate demands.
A CES Armington function [44] was established to explain producers’ behavior in selecting intermediate inputs; producers were assumed to have choice to purchase intermediate inputs from either domestic or international markets. Since the relative prices of domestic goods and imports (including the rate of tariff) were essential to producers’ production cost, the final ratio of imports to domestic goods was determined by producers’ cost minimizing decision-making on domestic or foreign goods. Moreover, a constant elasticity of transformation (CET) function was used to distinguish producers’ behavior for selling their products; to maximize profit, producers were assumed to have choice to sell their products to the market with the highest returns (where these returns were determined by multiplying the world price to the exchange rate adjusted for any taxes or subsidies). Overall, the final composite goods, including imported and domestic goods, were assumed to fulfill demands for both intermediate goods and final goods. Specifically, the intermediate goods, which were consumed by producers, were determined by technology and the composition of sectoral production; while the final goods, which were consumed by households, were determined by household income and the composite of aggregate demand.
Households, as the second economic agent, were assumed to maximize their utilities subject to their received income, including returns from supplying factors of production (capital, labor, and stumpage), and domestic government transfers (i.e., unemployment benefits, pensions, and other transfers from their domestic governments). The supplies of capital and labor were assumed to be fixed within a given time and mobile among all 20 sectors. Households were assumed to spend a proportion of their total income, and invest/save the remainder. All households were assumed to have identical consumption preferences, with consumption of each commodity affected by prices and incomes. Households make their consumption decisions by maximizing their utility subject to their household budget constraint. A Stone–Geary utility function was specified to model households’ consumption preferences.
Government, as the final economic agent, was assumed to maximize its utility subject to the received tax revenue, levied on (1) capital and labor use (i.e., capital and labor tax revenues); (2) income of households (i.e., income tax revenue); (3) consumption by households (i.e., consumption tax revenue); and (4) importing (i.e., tariff revenue). A proportion of tax revenue was transferred from government to households (i.e., unemployment payments, pension, etc.), and the rest was spent on government’s expenditures on capital, labor, and other commodities. A Cobb–Douglas utility function [45] was specified when the government was maximizing its utility.
We assumed that market equilibriums were achieved in the CGE model in the goods market and in the factor market. Specifically, equilibrium in the goods market consisted of aggregate demand for each commodity (from household and government consumption) equaling aggregate supply from domestic production and imported goods. To achieve equilibrium in the current account, the value of imports was required to equal the sum of value of exports and government savings. Since government savings and exchange rates were defined to be fixed, the change in value of imports would equal that of exports. Regarding the factor market, it was assumed that there was an equilibrium between the factors’ demand and supply. Factor prices on production would simultaneously adjust to ensure that factor demand was equal to supply. Additionally, an equilibrium was also defined between household saving and investment; since the household saving rate was assumed to be fixed, household saving would passively adjust until it was equivalent to the investment spending.
To estimate the growth projection of primary inputs over time, it was assumed that, without any SBW outbreaks, the NB economy would operate on the historical, steady-state growth path over the next 50 years (2010–2060). Specifically, the annual growth rate of the labor force was exogenously set at 2% to approximately sustain a 2% annual GDP growth rate. Following Chang et al. [3] and Ochuodho and Lantz [46], the capital stock was endogenously determined through a capital accumulation equation that was influenced by the previous period’s capital stock and household total savings (see Appendix A Table A1, Table A2 and Table A3 for details).
To assess the economic impacts of SBW outbreak and forest protection scenarios, the CGE model was designed to re-run annually with the additional exogenous stumpage input changes based on the timber volume harvest results from the SBW DSS. To incorporate the SBW DSS output into the CGE model, stumpage was implemented as a primary input in the forestry and logging sector. Timber volume harvest results from each SBW outbreak and forest protection scenario estimated from the SBW DSS were converted into stumpage values by multiplying the 5-year periodic growth rate of total timber volume harvest from Crown land to the initial stumpage value in 2010 [43]. These stumpage values were used to shock the stumpage input in the CGE model. General Algebraic Modeling System (GAMS) software [47] and the CONOPT 3 solver were used to solve the CGE model. Economic impact assessment was performed in the CGE model to evaluate the impacts of each SBW outbreak and protection scenario on several major economic variables: total stumpage revenue; value of regional outputs; and value of provincial trade (i.e., net exports). Additionally, following Chang et al. [3], a 4% discount rate was adopted to estimate the present-value of these economic variables.
2.5. Benefit-Cost Analysis
We used a benefit-cost analysis (BCA) to compare market and non-market benefits and costs associated with each SBW defoliation control scenario. Market benefits included the value of timber harvest volume, and market costs included the aerial spraying costs per hectare multiplied by the number of hectares treated. Non-market benefits of each SBW defoliation control scenario were evaluated by aggregating use and non-use values including recreational, wildlife habitat, and other environmental service values. Market benefits, derived from the SBW DSS, were measured by comparing differences between the per-period (i.e., 5 year) values of timber harvest volume reduction (i.e., all harvest tree species) for each defoliation control scenario compared to the no protection scenario. Per-period values of timber harvest volume reduction were calculated by multiplying the wood product harvest volume losses (i.e., pulpwood, sawlogs) with wood product values determined based on: stumpage values (estimated using prices of pulp and sawlog materials on NB private land (NB ERD 2016 Crown model)), producer surplus in timber and wood products markets (assumed to be approximately 20% of stumpage prices [2]), a Crown timber License management fee (i.e., estimated at $3/m3 (NB ERD 2016 Crown model)), and a social adjustment cost (i.e., costs of job searching, assumed to be 10% of stumpage prices (from [2], based on Van Kooten and Wang [48])). Overall, wood product values were estimated at $10/m3 for pulpwood and $27/m3 for sawlogs.
Market costs of each SBW defoliation control scenario were calculated by multiplying treatment area per year by spray program costs: one application of Btk or tebufenozide costs $40/ha; and two applications of Btk costs $80/ha (personal communication, Forest Protection Limited, 2018). Average costs for logistical, monitoring, and other costs specific to each strategy were estimated through consultation with experts in the field.
Non-market benefits of each SBW control effort were adopted from the Chang et al. [20] willingness to pay (WTP) estimation of the public’s benefit from controlling future SBW outbreaks in NB. A contingent valuation method (CVM) analysis determined that average WTP was $86.19 (CAD 2007) per household per year for 5 years (2007–2011), including timber value, which was considered a market benefit, or $53.87 for the non-market benefit [20]. The associated value for a moderate SBW outbreak was estimated in proportion to the volume lost. All values were assessed in current value (undiscounted) and present value (discounted) terms, with the latter using a 4% discount rate.
Benefit-cost ratio (BCR; present value benefits divided by present value costs) and net present value (NPV; present value benefits minus present value costs) measures were compared among forest protection strategies to determine the preferred strategy on economic grounds. The strategy with the highest BCR would be selected if the objective was to maximize protection benefits per unit of control cost, as a cost-effectiveness measure. The strategy with the highest NPV would be preferred if the primary goal was to maximize net returns of SBW control efforts, as an economic efficiency measure.
3. Results
3.1. Projected Cumulative Timber Harvest Volume Impacts
The projected relative timber volume harvest levels for Crown land in NB from 2012 to 2066 under different SBW outbreak patterns and forest protection scenarios are presented in Figure 1. In this analysis, we assumed that the EIS works scenario was the same as the no SBW outbreak scenario, for both moderate and severe outbreak analyses (Figure 1). Without any forest protection, future SBW outbreaks were forecast to significantly reduce NB available harvest supply from Crown land over the next 50 years. The NB available harvest supply was projected to substantially decline until it reached the nadir during the 2032–2046 period, and then to start to recover after defoliation was simulated to end in 2026. SBW defoliation impact on NB available harvest supply under a moderate outbreak scenario (Figure 1a) was projected to be more gradual than for a severe outbreak (Figure 1b). Relative to the baseline no outbreak scenario, projected timber volume harvest levels without any forest protection were projected to be reduced by up to 13% and 27% under moderate and severe outbreak patterns, respectively. Overall, the NB projected available harvest supply (or harvest level) was projected to be reduced by 28 and 43 million m3 under moderate and severe outbreaks, respectively, over the 50-year period (Table 1).
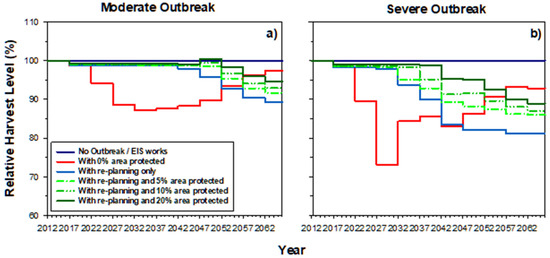
Figure 1.
Projected relative total timber volume harvest for all Crown land in New Brunswick from 2012 to 2066 under (a) moderate and (b) severe spruce budworm (Choristoneura fumiferana Clem.) (SBW) outbreak and protection scenarios.

Table 1.
Summary of available harvest volume impact (cumulative from 2017 to 2067) on Crown land in New Brunswick from moderate and severe spruce budworm outbreak scenarios.
Since we assumed that a future SBW outbreak would be prevented if the EIS treatment worked, the projected NB available harvest supply was assumed to be not affected over the next 50 years. Consequently, the projected relative timber volume harvest level under the EIS scenario would remain at the baseline level of 100% (Figure 1). As a result, the 28 and 44 million m3 of cumulative available harvest volume losses estimated above were anticipated to be saved by EIS treatments under moderate and severe outbreak patterns, respectively (Table 1). Empirical results from EIS trials from 2014 to 2018 support the assumption that, thus far, EIS works [18].
Under the foliage protection scenarios, available harvest supply savings were also substantial (Figure 1a,b). Re-planning of harvest scheduling alone was projected to save 12.5 million m3 of cumulative available harvest volume from loss over the next 50 years (Table 1). By combining foliage protection with re-planning of harvesting, SBW outbreak impacts on NB available harvest supply were projected to be reduced further, increasing with the area of Crown forest protected (Figure 1a,b). Under the moderate outbreak scenario, foliage protection with re-planning of harvesting was projected to save 17, 19, and 22 million m3 of cumulative available harvest volume from loss when protecting 5%, 10%, and 20% of total susceptible Crown forest, respectively (Table 1). Under a severe outbreak scenario, a projected 27 million m3 of NB available harvest supply loss was saved when 20% of susceptible Crown forest was protected (Table 1). We also tested two sensitivity analysis scenarios considering that EIS partly worked, assuming that it would reduce 80% or 90% of the harvest volume impact. This amounted to saving 22–25 or 35–39 million m3 under moderate and severe SBW outbreaks, respectively (Table 1). Both of these would exceed the cumulative timber volume saving of the re-planning and 20% area protected scenarios (Table 1).
3.2. CGE Model Results
3.2.1. Current Value Stumpage Revenue Impacts
Figure 2 presents the projected relative stumpage revenues for Crown land in NB under different SBW outbreak and forest protection scenarios over the 50-year period. Since stumpage revenue values were calculated based on the timber volume harvest results, percentage reductions in stumpage revenue values were similar to reductions in available harvest supply. Relative stumpage revenues without SBW control declined by at most by 13% (moderate outbreak) and 27% (severe outbreak). Overall, cumulative current value stumpage revenue losses without forest protection were estimated at $178 million and $273 million under moderate and severe outbreak patterns, respectively. Under the EIS scenario, stumpage revenue savings would equal potential outbreak reductions, because timber supplies were assumed to remain at their baseline levels over the 50-year period, i.e., no outbreak (Figure 2). The foliage protection scenarios were projected to save $124–150 million (moderate outbreak) and $115–188 million (severe outbreak) of stumpage revenue over 50 years, when protecting 5%–20% of total susceptible Crown forest area, respectively.
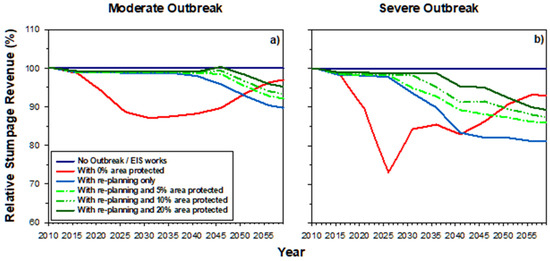
Figure 2.
Projected relative stumpage revenue from all Crown land harvest in New Brunswick from 2010 to 2060 under (a) moderate and (b) severe SBW outbreak and protection scenarios.
3.2.2. Current Value Domestic Output Impacts
Simulations showed that uncontrolled moderate and severe outbreaks would significantly impact NB’s domestic economic output over the next 50 years, with losses projected to be $24.6 billion and $35.3 billion with no SBW protection (Table 2). Under the EIS scenario (assuming EIS treatments worked), the negative impacts of SBW outbreaks on NB domestic output were eliminated over the 50-year period, so cumulative current value total domestic output savings would also be $24.6 billion (moderate) and $35.3 billion (severe) (Table 2). The foliage protection scenarios were projected to reduce the impacts of future SBW outbreaks on NB domestic output over the 50 year period by $23–24 billion (moderate outbreak) and $18–31 billion (severe outbreak) when protecting 5%–20% of total susceptible Crown forest, respectively (Table 2).
Table 2.
Current value a output and net export impacts, cumulative from 2010 to 2060, for moderate and severe spruce budworm outbreak scenarios on Crown land in New Brunswick.
3.2.3. Current Value Net Export Impacts
Projected current value net export losses in NB, compared to the EIS works/no outbreak baseline scenario, were predicted to be $19.6 billion and $27.8 billion over the next 50 years under uncontrolled moderate and severe SBW outbreak scenarios (Table 2). Under the EIS works assumption of no future outbreak, all of this loss would be prevented. Re-planning alone was projected to reduce losses by $17.8 billion (moderate outbreak scenario) or $7.8 billion (severe outbreak scenario). Foliage protection applied over 20% of susceptible Crown forest would reduce net export losses up to $19.4 billion (moderate outbreak scenario) or $25.0 billion (severe outbreak) (Table 2). The large differences of $6.7–8.5 billion in output and net export savings between the re-planning only versus re-planning with 5% area protected (severe SBW outbreak—Table 2) occur because the SBW DSS is very effective in selecting stands that will sustain the highest timber harvest volume losses and directing insecticide protection to prevent those losses [21,31]. Therefore, the model initially selects stands with the largest marginal timber supply benefit of protection, and the biggest benefit occurs in the initial 5%–10% of protection [21,31]. In contrast, the re-planning only scenario has no insecticide protection of stands.
3.2.4. Present Value Stumpage Revenue, Domestic Output, and Net Export Impacts
Table 3 describes the present value stumpage revenue, domestic output, and net export impacts of future SBW outbreaks and forest protection scenarios on the NB economy and forest-based industries over the 2010–2060 period. Present values were smaller than the current values presented in Table 1 and Table 2 because they were discounted at a 4% market rate of interest. An uncontrolled future
Table 3.
Present value a cumulative (2010–2060) stumpage revenue, output ($ million CAD) and net export ($ billion CAD) impacts, by sector, of spruce budworm outbreak and protection scenarios on Crown Land in New Brunswick.
SBW outbreak was forecast to cause $63.6 and $101.2 million of present value stumpage revenue losses under the moderate and severe outbreak scenarios, respectively (Table 3). The available harvest supply reductions reflected in these present value stumpage revenue reductions were forecast to cause $6.1–9.6 billion (moderate and severe outbreak scenarios) of domestic output reductions and $4.7–7.3 billion (moderate and severe outbreak) of net export losses (Table 3). If the EIS is successful, it would prevent these reductions.
An uncontrolled SBW outbreak was projected to cause large-scale sectoral output and net export reductions in NB (Table 3). The manufacturing, forestry and logging, and support activities for agriculture and forestry sectors were the sectors projected to be most affected by a future SBW outbreak (Table 3). Under a severe SBW outbreak scenario, total economic output was projected to be reduced from $9.6 billion over 50 years with no outbreak or EIS, to $4.0 billion with no re-planning or foliage protection to reduce losses (Table 3). This would result in a reduction of net exports from $7.3 billion to $3.0 billion (Table 3).
3.3. Benefit-Cost Analysis Results
Table 4 presents the present value market and non-market benefits, market costs, BCR and NPV results under SBW outbreak and forest protection scenarios. Market benefits, based on the NB Crown SBW DSS model (for timber supply volume savings and market prices), were projected to increase significantly with more forest protection. Under the EIS scenario (Works 100% column in Table 4), the cumulative present value market benefits were projected to be $162 million and $319 million under moderate and severe outbreak patterns, respectively (Table 4). The cumulative present value market benefits under the foliage protection strategy scenarios were projected to be $118–131 million (moderate outbreak) and $147–210 million (severe outbreak) when protecting 5%–20% of susceptible Crown forest (Table 4).
Table 4.
Projected present valuea benefits and costs of spruce budworm control programs on Crown land in New Brunswick over 50 years from 2010 to 2060.
Present value cumulative market costs increased with more Crown forest protected (Table 4). Present value market cost for the EIS scenarios was $65.5 million, based on treating a cumulative total of 2,040,000 ha (Figure 3). The foliage protection scenario costs ranged from $35 million to $133 million (moderate) and $43 million to $164 million (severe) when protecting 5%–20% of total susceptible Crown forest (Table 4). These costs were from treating 1,136,000 ha (5% of susceptible Crown forest scenario), 2,273,000 ha (10% scenario), or 4,546,000 ha (20% scenario) for moderate outbreak scenarios (Table 4, Figure 3). These were cumulative amounts over the period from 2017 to 2028 (Figure 3). Areas treated under the severe outbreak scenario were 280,000–1,136,000 ha higher than for the moderate outbreak, because defoliation under the severe scenario lasted 2 years longer (Figure 3). This resulted in about 23% higher costs for protection under the severe outbreak scenario, ranging from $7.9 million to $30.7 million higher depending upon the area protected (Table 4).
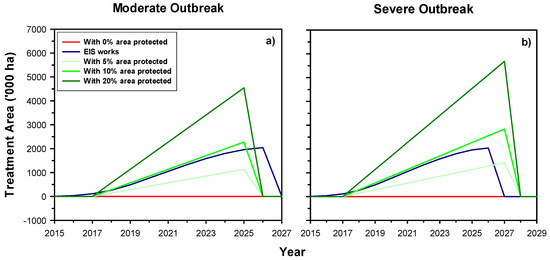
Figure 3.
Projected total treatment area for Crown land in New Brunswick under (a) moderate and (b) severe SBW outbreak and protection scenarios.
For non-market benefits, the public’s WTP in NB was highest under the EIS scenario, where NB households were estimated to be willing to pay up to $90 million and $99 million (present value) over the next 50 years to prevent future moderate or severe outbreaks, respectively (Table 4). However, the public’s WTP was significantly lower if future SBW outbreaks were not be prevented. Under the foliage protection strategy scenarios, present value non-market benefits ranged from $4.5–18 million (moderate outbreak) and $4.9–20 million (severe outbreak), with 5%–20% of area protected (Table 4).
Regarding efficiency of forest protection scenarios, the NPV analysis indicated that the EIS scenario was the most economically efficient (i.e., highest NPV) strategy for both market and total (i.e., market and non-market) values (Table 4). The market NPV of the EIS scenario was projected to be $96 million (moderate outbreak) and $254 million (severe outbreak). Including non-market values, total NPV of the EIS scenario increased to $186 million (moderate outbreak) and $353 million (severe outbreak) (Table 4). The foliage protection scenarios were forecast to provide the least efficient forest protection. The market and total NPV of the foliage protection strategy under a moderate outbreak scenario were estimated to range from $82 million and $87 million with 5% of Crown forest protected, to $–2 million and $16 million with 20% of Crown forest protected. The NPV estimates were substantially higher under a severe outbreak scenario, with values of $104–109 million (market and total NPV, respectively) with 5% area protected and $46–66 million with 20% of total susceptible Crown forest protected (Table 4).
With regard to cost-effectiveness, BCR analysis revealed that the EIS was the most cost-effective (i.e., highest BCR) forest protection strategy, with a BCR of 3.8 (moderate outbreak) and 6.4 (severe outbreak), including both market and non-market values. Only considering market values, the EIS scenario had the highest BCR of 4.9 under a severe outbreak, but the foliage protection strategy with 5% of Crown forest protected scenario had the highest BCR of 3.3 under a moderate outbreak. Similar to the NPV estimates, higher forest protection levels generally led to lower BCRs. For example, market BCRs for the foliage protection strategy scenarios declined from 3.3 to 1.0 when forest protection area increased from 5% to 20% of total susceptible Crown forest (Table 4).
The sensitivity analysis (‘what if’ EIS works 90% or 80%) showed that under a severe SBW outbreak scenario, EIS works 90% and EIS works 80% always ranked second and third, after EIS works 100% and with the foliage protection strategies ranked numbers 4–6 (Table 4). Under a moderate SBW outbreak, the EIS works 90% scenario ranked second for market and non-market benefits, BCR and NPV (market + non-market), but third for BCR and NPV (market benefits only) (Table 4). The EIS works 80% resulted in third or fourth ranks, behind foliage protection 20% for market benefits and behind the foliage protection 5% for BCR and NPV (market) (Table 4). Therefore, it is likely that even if the EIS only partially works (saving 80%–90% of the uncontrolled outbreak timber harvest losses), it will be economically superior to foliage protection scenarios.
4. Discussion
We coupled an advanced SBW DSS model with a dynamic CGE model to assess the impacts of future SBW outbreaks and forest protection strategies on available timber harvest from Crown land in NB and the provincial economy. Several key findings resulted from this research. First, the SBW DSS and CGE model results showed that unprotected future moderate or severe SBW outbreaks would have very large impacts on the available timber harvest from Crown land in NB and the regional economy. Sectoral economic outputs and net exports from forest-related industries in NB would be severely reduced. Approximately 50% of the NB provincial wood supply is from Crown land [22], so overall impacts from all land in NB would be roughly double what is reported here, but developing a timber supply model for private land was beyond the scope of this study. Our results were consistent with, but relatively higher than, previous economic impact research on SBW outbreaks in NB conducted by Chang et al. [3]. We utilized a revised SBW DSS model [4,28], applied to more recent (2017) NB forest inventory than in [3], as well as more refined modelling of the economic structure in CGE model. Our results were also for a longer study horizon, 50 years instead of 30 years, which is the main explanation of the larger impacts relative to previous results from [3].
Results from this study are applicable to other locations, countries, or different insect pests in several ways. First, SBW outbreaks occur across Canada and north-eastern United States, and the general level of timber harvest reductions and resulting economic and cost/benefit effects are applicable in other regions. Secondly, the SBW DSS tool has already been applied in several other jurisdictions: Maine, USA [49], Quebec [50], and four other provinces in Canada [28]. Thus, existing SBW DSS installations in these areas could be used with regional CGE or other economic models to estimate regional economic effects of SBW outbreaks. Third, the general approach of using a scenario planning approach to evaluate effects of defoliation on timber harvest volumes and resulting economic effects is applicable for other insects and countries, but would require local calibration of models. Finally, if the EIS approach continues to work, our cost/benefit results are useful in providing rationale for conducting other early intervention trials.
The EIS and foliage protection strategy both significantly mitigated SBW outbreak impacts on the regional economy. By definition, because it was assumed to result in no outbreak, the EIS scenario saved the most total domestic output and net exports over the 50-year period. Sensitivity analysis if EIS works 80% or 90% scenarios were superior to the best foliage protection scenario for all economic indicators under a severe outbreak, but were less cost effective than the 5% area protected for BCR and NPV of market values. It is impossible to know without a longer-term test whether EIS will continue to work, as the EIS research is less than one-half of the way through the current trial in NB, but thus far, results have been very positive [18]. Following 5 years of EIS treatments of low but increasing SBW populations, L2 populations across northern NB were much lower than SBW populations in adjacent Québec [18]. SBW populations in areas treated with Btk or tebufenozide were consistently reduced, and defoliation detected from aerial surveys in 2017–2018 in NB was only 550–2500 ha, compared to over 2.5 million ha in adjacent Bas St. Laurent-Gaspésie areas of Québec [50]. The foliage protection strategy also substantially reduced impacts of SBW outbreaks on the NB economy, but under the severe outbreak scenario, would still result in $4.1 billion lower economic output over 50 years than no outbreak or the EIS works scenario, at 2.5 times higher cost for the 20% area protected, severe SBW outbreak scenario.
Although larger foliage protection areas were consistently associated with higher available harvest supply and larger sectoral/economy-wide savings, they were generally not more cost-effective or efficient. BCA and NPV analyses revealed that treating 5% of susceptible Crown forest with insecticides was often the most cost effective and efficient due largely to the rate at which treatment costs increased with the area treated. This finding is consistent with previous results [2] except the market costs in our study were comparatively higher than those estimated by Chang et al. [2], because they assumed that foliage protection was applied only in peak defoliation years, when current balsam fir defoliation was higher than 70%, whereas we assumed foliage protection whenever defoliation exceeded 40%. The Chang et al. [2] approach would apply foliage protection only when required to keep trees alive, whereas our approach would limit defoliation sufficiently to prevent growth reduction. Overall, this finding suggests that it is essential for forest policy makers to consider BCR and NPV economic criteria when making informed foliage protection strategy.
Results also showed that re-planning of harvesting alone was forecast to significantly reduce SBW outbreak impacts on NB gross domestic output and net exports, particularly if the outbreak severity was only moderate. Combining re-planning of harvesting with foliage protection led to further substantial output and net export savings, similar to results of Chang et al. [3].
A final, and possibly most important, finding was that the EIS scenario was the most cost-effective and efficient forest protection strategy with the highest BCR of protection of 3.8–6.4 (moderate-severe outbreak scenarios). This largely had to do with the significant available harvest supply and market/non-market savings associated with the assumption that EIS treatments would be effective in preventing an SBW outbreak. Even the most aggressive foliage protection strategy still resulted in billions of dollars of economic impact over a 50-year period. Foliage protection on 20% of susceptible Crown forest cost 2.5 times more than the EIS scenario. Although market benefits and available harvest supply increased with area of foliage protection, due to high treatment cost, foliage protection of 20% of susceptible Crown forest was neither the most cost-effective nor economically efficient strategy, and in fact resulted in a negative market NPV of $–2.03 million of protection over 50 years.
While interesting findings emerged from this research, there were still several limitations. We used a single regional CGE model, whereas a multi-regional CGE model would better reflect reality by allowing for more detailed accounting of import/export substitution by region of origin and destination [35]. This was beyond the scope of the current study, but it is the authors’ intent to attempt a multi-regional CGE model for more in-depth economic impact analysis in future. Our projection only addressed available harvest from Crown land, about 50% of timber supply in NB [22]. Another limitation, particularly with regard to the BCA and NPV analysis, was the lack of data on costs associated with the re-planning harvests. Better estimates might change the cost-effectiveness and efficiency ranking of forest protection strategies. Further, the non-market benefit estimates in this study, from Chang et al. [20], only included recreation and wildlife values. These values may have changed over time, and other non-market values such as carbon and water quality, which were not valued, may be important to the NB population. Including updated and more robust non-market values might lead to even stronger economic support for forest protection scenarios with high forest protection levels.
5. Conclusions
Our results have shed important light on potential biophysical and economic consequences of future SBW outbreaks and forest protection strategies. The findings confirmed that an EIS, assuming that it continues to work, was predicted to best mitigate negative economic impacts of SBW and was the most cost-effective and economically efficient forest protection strategy. This indicates that it is justified on economics grounds to continue recent efforts to utilize EIS to control future SBW outbreaks in NB. Following 5 years of EIS treatments of low but increasing SBW populations, SBW across northern NB are considerably lower than populations across the border in adjacent Québec [18]. These positive results from 2014 to 2018 trials have resulted in the Healthy Forest Partnership EIS team being approved for $75 million of additional funding from Natural Resources Canada to continue EIS trials from 2018 to 2022.
Author Contributions
Project conceptualization was led by D.A.M. and V.A.L.; timber supply analyses by C.H.; CGE modeling by E.Y.L. and V.A.L.; data analyses by E.Y.L.; project administration by D.A.M. and V.A.L.; funding acquisition by D.A.M.; initial draft manuscript preparation by E.Y.L.; manuscript revisions and editing by D.A.M., V.A.L., C.H., and E.Y.L.
Funding
This research was funded by Atlantic Canada Opportunities Agency, Natural Resources Canada, Government of New Brunswick, and forest industry in New Brunswick.
Acknowledgments
This research was overseen by the Healthy Forest Partnership, a consortium of researchers, landowners, forestry companies, governments, and forest protection experts. Many scientists and staff of industry and government agencies have made important contributions to the overall EIS research, without which the project could not have proceeded.
Conflicts of Interest
The authors declare no conflict of interest.
Appendix A
Table A1.
Computable General Equilibrium (CGE) model variables.
Table A1.
Computable General Equilibrium (CGE) model variables.
| Variables | Description | Variables | Description |
|---|---|---|---|
| Production Block | Household Block | ||
| FADif | Factor input demand | INC | Household total gross income |
| FASif | Factor supply | SAH | Household savings |
| VADi | Value-added input demand | CBUD | Household disposable income (budget) after saving |
| IDEi | Composite intermediate input demand | SBUD | Household discretionary (supernumerary budget) |
| PVAi | Value-added input price | CONi | Household consumption demand of commodities |
| PIDi | Intermediate input price | SAT | Household savings |
| PFf | Factor price | INVi | Household investment demand for commodities |
| Pi | Price of composite commodities demand (input) | ||
| PDi | Price of composite domestic production supply (output) | Government Block | |
| PDDi | Price of domestic output delivered to home markets | KG | Government capital demand |
| Xi | Domestic sales of composite commodities | LG | Government labor demand |
| XDi | Domestic production (output) | CGi | Public demand for commodities |
| XDDi | Domestic output delivered to home markets | SAG | Government savings |
| TAXR | Total tax revenues | ||
| TRMT | Total import tariff revenues | ||
| Foreign Trade Block | TRF | Total government transfer | |
| Mi | Composite import | TRO | Other government transfer |
| Ei | Composite export | UNEMP | Unemployment level (Philips curve) |
| PMi | Domestic import price | CPI | Consumer price index |
| PEi | Domestic export price | tci | Tax rate on consumer commodities |
| SAF | Foreign savings | tki | Tax rate on capital use |
| ER | Exchange rate | tli | Tax rate on labor use |
| OBJ | Dummy objective variable | tyi | Tax rate on income |
* Subscript i is a set that denote sectors of the economy (i.e., 1, 2, 3, …, 23); subscript f is a set that denotes input factors (i.e., capital, labor, and stumpage).
Table A2.
CGE model parameters.
Table A2.
CGE model parameters.
| Parameters | Description |
|---|---|
| Elasticities of substitution | |
| σVi | Substitution in the composite value-added function |
| σPi | Substitution between the composite value-added input and the composite intermediate input |
| σAi | Armington substitution between imports and domestic commodities |
| σTi | CET substitution between domestic and export markets |
| σYi | Income elasticities of demand for commodities |
| Share parameters | |
| γVif | Share parameter in composite value-added input function |
| γpi | Share parameter in total cost (production) function |
| γAi | CES share parameter in Armington function |
| γTi | CET share parameter in transformation function |
| Efficiency (shift) parameters | |
| ØVi | Shift parameter in the composite value-added input function |
| ØPi | Shift parameter in total cost (production) function |
| ØAi | Shift parameter in Armington function |
| ØTi | Shift parameter in transformation function |
| Other parameters | |
| αCGi | Cobb–Douglas power of commodities bought by government |
| αKG | Cobb–Douglas power of capital use by government |
| αLG | Cobb–Douglas power of labor use by government |
| αIi | Cobb–Douglas power share parameter for investment goods |
| trep | Replacement rate |
| IOi | Technical coefficients of intermediate input |
| η | Philips curve parameter |
| Ψi | Budget shares in nested-LES household utility function |
| μHi | Household subsistence consumption level |
| λi | Marginal propensity to save |
| Dynamic Growth Path | |
| GRW | Initial steady-state labor growth rate |
| RRR | Real rate of return on capital |
| Timet | Time period into future from base year 2010 |
| GrowthTSt | Annual stumpage revenue growth rate |
* Subscript i is a set that denote sectors of the economy (i.e., 1, 2, 3, …, 23); subscript f is a set that denotes input factors (i.e., capital, labor, and stumpage); subscript t is a set that denotes time period in years from base year 2010 (i.e., 1, 2, 3, …, 50).
Table A3.
CGE model equations.
Table A3.
CGE model equations.
| Equation | Description | |
|---|---|---|
| Production Block | ||
| where f denotes labor, capital for all sectors, and stumpage for forestry sector only. | Eq.(A.1) | Factor demand by firm |
| Eq.(A.2) | Value-added demand | |
| Eq.(A.3) | Composite intermediate input | |
| Eq.(A.4) | Zero profit condition for the firm | |
| Household Block | ||
| Eq.(A.5) | Household total gross income | |
| Eq.(A.6) | Household savings | |
| Eq.(A.7) | Household disposable income after tax and savings | |
| Eq.(A.8) | Household discretionary budget | |
| Eq.(A.9) | Household consumption demand of commodities | |
| Eq.(A.10) | Household total savings | |
| Eq.(A.11) | Investment demand for commodities | |
| where subscript f denotes labor | Eq.(A.12) | Unemployment level (Philips curve) |
| Eq.(A.13) | Consumer price index | |
| Government Block | ||
| . | Eq.(A.14) | Government demand for commodities |
| where f denotes capital | Eq.(A.15) | Government capital demand function |
| where f denotes labor | Eq.(A.16) | Government labor demand function |
| . | Eq.(A.17) | Total tax revenues |
| where f denotes labor | Eq.(A.18) | Total transfers |
| Eq.(A.19) | Total tariff revenue | |
| Market Clearing Block | ||
| where f denotes labor | Eq.(A.20) | Market clearing for labor |
| where f denotes capital | Eq.(A.21) | Market clearing for capital |
| where f denotes stumpage and I denotes forestry and logging sector | Eq.(A.22) | Market clearing for stumpage |
| Eq.(A.23) | Market clearing for commodities | |
| Eq.(A.24) | Trade Balance of payments | |
| Trade Block | ||
| a) Export side | ||
| Eq.(A.25) | Domestic supply of domestic output (supply side) | |
| Eq.(A.26) | Export demand for domestic output | |
| Eq.(A.27) | CET zero profit condition (profit maximization) | |
| b) Import side | ||
| Eq.(A.28) | Domestic demand for domestically produced goods (demand side) | |
| Eq.(A.29) | Domestic demand for composite imported goods | |
| Eq.(A.30) | Armington CES zero profit condition (cost minimization) | |
| Macroeconomic Closures | ||
| Eq.(A.31) | Exogenously fix factor endowments | |
| Eq.(A.32) | Exogenously fix foreign savings | |
| Eq.(A.33) | Exogenously fix government savings | |
| Eq.(A.34) | Exogenously fix government other transfer | |
| Artificial Objective Function | ||
| Eq.(A.35) | Dummy objective variable | |
| Dynamic Growth Path | ||
| where f denotes capital factor | Eq.(A.36) | Real rate of return on capital |
| where f denotes capital factor input | Eq.(A.37) | Growth path for each time period recursive loop run |
| where f denotes capital factor input | Eq.(A.38) | Exogenously fixing capital growth path dynamic loop |
| where f denotes labor factor input | Eq.(A.39) | Exogenously fixing labor growth path dynamic loop |
| where f denotes stumpage in forestry and logging sector | Eq.(A.40) | Exogenously fixing stumpage growth path dynamic loop |
* Subscript i is a set that denote sectors of the economy (i.e., 1, 2, 3, …, 23); subscript f is a set that denotes input factors (i.e., capital, labor, and stumpage); subscript t is a set that denotes time period in years from base year 2010 (i.e., 1, 2, 3, …, 50).
References
- Natural Resources Canada. Overview of Canada’s Forest Industry. The official website of the Government of Canada, 2015. Available online: http://www.nrcan.gc.ca/forests/industry/overview/13311 (accessed on 19 January 2016).
- Chang, W.-Y.; Lantz, V.A.; Hennigar, C.R.; MacLean, D.A. Benefit-cost analysis of spruce budworm (Choristoneura fumiferana Clem.) control: Incorporating market and non-market values. J. Environ. Manag. 2012, 93, 104–112. [Google Scholar] [CrossRef] [PubMed]
- Chang, W.-Y.; Lantz, V.A.; Hennigar, C.R.; MacLean, D.A. Economic impacts of spruce budworm (Choristoneura fumiferana Clem.) outbreaks and control in New Brunswick, Canada. Can. J. For. Res. 2012, 42, 490–505. [Google Scholar] [CrossRef]
- Hennigar, C.R.; Erdle, T.A.; Gullison, J.J.; MacLean, D.A. Reexamining wood supply in light of future spruce budworm outbreaks: A case study in New Brunswick. For. Chron. 2013, 89, 42–53. [Google Scholar] [CrossRef]
- Niquidet, K.; Tang, J.; Peter, B. Economic analysis of forest insect pests in Canada. Can. Ent. 2016, 148, 357–366. [Google Scholar] [CrossRef]
- Sterner, T.E.; Davidson, A.G. Forest Insect and Disease Conditions in Canada 1981; Canadian Forest Service: Ottawa, ON, Canada, 1982. [Google Scholar]
- Blais, J.R. Trends in the frequency, extent, and severity of spruce budworm outbreaks in eastern Canada. Can. J. For. Res. 1983, 13, 539–547. [Google Scholar] [CrossRef]
- MacLean, D.A.; Ostaff, D.P. Patterns of balsam fir mortality caused by an uncontrolled spruce budworm outbreak. Can. J. For. Res. 1989, 19, 1087–1095. [Google Scholar] [CrossRef]
- MacLean, D.A.; Beaton, K.P.; Porter, K.B.; MacKinnon, W.E.; Budd, M.G. Potential wood supply losses to spruce budworm in New Brunswick estimated using the spruce budworm decision support system. For. Chron. 2002, 78, 739–750. [Google Scholar] [CrossRef]
- Blum, B.M.; MacLean, D.A. Potential silviculture, harvesting and salvage practices in eastern North America. In Recent Advances in Spruce Budworms Research: Proceedings of the CANUSA Spruce Budworms Research Symposium; Canadian Forestry Service: Ottawa, ON, Canada, 1985; pp. 264–280. [Google Scholar]
- Spence, C.E.; MacLean, D.A. Regeneration and stand development following a spruce budworm outbreak, spruce budworm inspired harvest, and salvage harvest. Can. J. For. Res. 2012, 42, 1759–1770. [Google Scholar] [CrossRef]
- Sainte-Marie, G.B.; Kneeshaw, D.D.; MacLean, D.A.; Hennigar, C.R. Estimating forest vulnerability to the next spruce budworm outbreak: Will past silvicultural efforts pay dividends? Can. J. For. Res. 2014, 45, 314–324. [Google Scholar] [CrossRef]
- Etheridge, D.A.; MacLean, D.A.; Wagner, R.G.; Wilson, J.S. Effects of intensive forest management on stand and landscape characteristics in northern New Brunswick, Canada (1945–2027). Landsc. Ecol. 2006, 21, 509–524. [Google Scholar] [CrossRef]
- Kettela, E.G. Insect control in New Brunswick, 1974–1989. In Forest Insect Pests in Canada; Armstrong, J.A., Ives, W.G.H., Eds.; Natural Resources Canada, Canadian Forest Service: Ottawa, ON, Canada, 1995; pp. 655–665. [Google Scholar]
- Miller, C.A.; Kettela, E.G. Aerial control operations against the spruce budworm in New Brunswick, 1952–1973. In Aerial Control of Forest Insects in Canada; Prebble, M.L., Ed.; Department of the Environment: Ottawa, ON, Canada, 1975; pp. 94–112. [Google Scholar]
- Healthy Forest Partnership. Research Area Map. Healthy Forest Partnership, 2017. Available online: http://www.healthyforestpartnership.ca/en/research/what-where-and-when (accessed on 12 June 2017).
- Johns, R.C.; Régnière, J.; MacLean, D.A.; James, P.; Martel, V.; Pureswaran, D.; Stastny, M. A conceptual framework for the spruce budworm Early Intervention Strategy: Can outbreaks be contained? Forests 2019. submitted for publication. [Google Scholar]
- MacLean, D.A.; Amirault, P.; Amos-Binks, L.; Carleton, D.; Hennigar, C.; Johns, R.; Régnière, J. Positive results of an early intervention strategy to suppress a spruce budworm outbreak after five years of trials. Forests 2019, 10, 448. [Google Scholar] [CrossRef]
- Régnière, J.; Delisle, J.; Pureswaran, D.S.; Trudel, R. Mate-finding allee effect in spruce budworm population dynamics. Entomol. Exper. Applic. 2013, 146, 112–122. [Google Scholar] [CrossRef]
- Chang, W.Y.; Lantz, V.A.; MacLean, D.A. Social benefits of controlling forest insect outbreaks: A contingent valuation analysis in two Canadian provinces. Can. J. Agric. Econ. 2011, 59, 383–404. [Google Scholar] [CrossRef]
- MacLean, D.A.; Erdle, T.A.; MacKinnon, W.E.; Porter, K.B.; Beaton, K.P.; Cormier, G.; Morehouse, S.; Budd, M. The Spruce Budworm Decision Support System: Forest protection planning to sustain long-term wood supplies. Can. J. For. Res. 2001, 31, 1742–1757. [Google Scholar] [CrossRef]
- Erdle, T.A.; Ward, C. Management alternatives for New Brunswick’s public forest: Report of the New Brunswick Task Force on Forest Diversity and Wood Supply: Summary; New Brunswick Department of Natural Resources: Fredericton, NB, Canada, 2008. [Google Scholar]
- New Brunswick Department of Economic Development. Rebuilding New Brunswick: New Brunswick Value-Added Wood Sector Strategy 2012–2016. Government of New Brunswick. Available online: http://www2.gnb.ca/content/dam/gnb/Corporate/pdf/EcDevEc/Wood.pdf (accessed on 20 August 2017).
- Atlantic Provinces Economic Council. The New Brunswick Forest Industry: The Potential Economic Impact of Proposals to Increase the Wood Supply; Atlantic Provinces Economic Council: Halifax, NS, Canada, 2003. [Google Scholar]
- National Forestry Database. Forest Insects - Quick Facts. Canadian Council of Forest Ministers, 2016. Available online: http://www.nfdp.ccfm.org/en/data/insects.php (accessed on 10 January 2016).
- Royama, T.; MacKinnon, W.E.; Kettela, E.G.; Carter, N.E.; Hartling, L.K. Analysis of spruce budworm outbreak cycles in New Brunswick, Canada, since 1952. Ecology 2005, 86, 1212–1224. [Google Scholar] [CrossRef]
- Healthy Forest Partnership. Spruce Budworm L2 and Defoliation, 2018; Healthy Forest Partnership, 2018. Available online: http://forestprotectionlimited.maps.arcgis.com/apps/Viewer/ index.html?appid=1c6e488b56864964a917b06861382929 (accessed on 15 January 2018).
- McLeod, I.M.; Lucarotti, C.J.; Hennigar, C.R.; MacLean, D.A.; Holloway, A.G.L.; Cormier, G.A.; Davies, D.C. Advances in aerial application technologies and decision support for integrated pest management. In Integrated Pest Management and Pest Control; Soloneski, S., Larramendy, M.L., Eds.; InTech Open Access Publisher: Rijeka, Croatia, 2012; pp. 651–668. ISBN 978-953-307-926-4. [Google Scholar]
- Erdle, T.A.; MacLean, D.A. Stand growth model calibration for use in forest pest impact assessment. For. Chron. 1999, 75, 141–152. [Google Scholar] [CrossRef]
- Remsoft Inc. Spatial Woodstock 2008.12 User Guide; Remsoft Inc.: Fredericton, NB, Canada, 2008. [Google Scholar]
- Hennigar, C.R.; MacLean, D.A.; Porter, K.B.; Quiring, D.T. Optimized harvest planning under alternative foliage-protection scenarios to reduce volume losses to spruce budworm. Can. J. For. Res. 2007, 37, 1755–1769. [Google Scholar] [CrossRef]
- Hennigar, C.R.; MacLean, D.A.; Quiring, D.T.; Kershaw, J.A. Differences in spruce budworm defoliation among balsam fir and white, red, and black spruce. For. Sci. 2008, 54, 158–166. [Google Scholar]
- Schoemaker, P.J.H. Scenario planning: A tool for strategic thinking. Sloan Manag. Rev. 1995, 36, 25–40. [Google Scholar]
- Liu, E.Y. Economics of early intervention to suppress a potential spruce budworm outbreak in New Brunswick, Canada. Master’s Thesis, University of New Brunswick, Fredericton, NB, Canada, 2018. [Google Scholar]
- Ochuodho, T.O.; Lantz, V.A.; Lloyd-Smith, P.; Benitez, P. Regional economic impacts of climate change and adaptation in Canadian forests: A CGE modeling analysis. For. Pol. Econ. 2014, 25, 100–112. [Google Scholar] [CrossRef]
- Das, G.G.; Alavalapati, J.R.R.; Carter, D.R.; Tsigas, M.E. Regional Impacts of environmental regulations and technical change in the US forestry sector: A multiregional CGE analysis. For. Pol. Econ. 2005, 7, 25–38. [Google Scholar] [CrossRef]
- Lofgren, H.; Harris, R.L.; Robinson, S. A Standard Computable General Equilibrium (CGE) Model in GAMS; International Food Policy Research Institute: Washington, DC, USA, 2002. [Google Scholar]
- Zhang, J.; Alavalapati, J.R.R.; Shrestha, R.K.; Hodges, A.W. Economic impacts of closing national forests for commercial timber production in Florida and Liberty County. J. For. Econ. 2005, 10, 207–223. [Google Scholar] [CrossRef]
- Statistics Canada. Provincial Input-Output Tables, Inputs and Outputs, Summary Level, Basic Price, Annual (Dollars), CANSIM (Database). Statistics Canada, 2014. Available online: http://www5.statcan.gc.ca/cansim/a26?lang=eng&retrLang=eng&id=3810028&&pattern=&stByVal= 1&p1=1&p2=-1&tabMode=dataTable&csid= (accessed on 18 August 2016).
- Statistics Canada. Canadian System of National Accounts (CSNA) 2012-Canada. 2012. Available online: https://www.statcan.gc.ca/eng/nea/classification/io_ind/cat (accessed on 5 August 2017).
- Alavalapati, J.; White, W.; Jagger, P.; Wellstead, A. Effect of land use restrictions on the economy of Alberta: A computable general equilibrium analysis. Can. J. Reg. Sci. 1996, 19, 349–365. [Google Scholar]
- Alavalapati, J.; Adamowicz, W.; White, W. A comparison of economic impact assessment methods: The case of forestry developments in Alberta. Can. J. For. Res. 1998, 28, 711–719. [Google Scholar] [CrossRef]
- Canadian Council of Forest Ministers. Statement of Revenues from the Sale of Timber from Provincial Crown Land; National Forestry Database, 2016. Available online: http://www.nfdp.ccfm.org/en/data/revenues.php (accessed on 2 October 2016).
- Armington, P.S. A theory of demand for products distinguished by place of production. In International Monetary Fund Staff Papers; Palgrave Macmillan: London, UK, 1969; Volume 16, pp. 244–252. [Google Scholar]
- Cobb, C.W.; Douglas, P.H. A theory of production. Amer. Econ. Rev. 1928, 18, 139–165. [Google Scholar]
- Ochuodho, T.O.; Lantz, V. Economic impacts of climate change in the forest sector: A comparison of single-region and multiregional CGE modeling frameworks. Can. J. For. Res. 2014, 44, 449–464. [Google Scholar] [CrossRef]
- Rosenthal, R. GAMS: A User’s Guide; GAMS Development Corporation: Washington, DC, USA, 2010. [Google Scholar]
- Van Kooten, G.C.; Wang, S. Estimating economic costs of nature protection: British Columbia’s forest regulations. Can. Public Pol. 1998, 24, 63–71. [Google Scholar] [CrossRef]
- Hennigar, C.R.; Wilson, J.S.; MacLean, D.A.; Wagner, R.G. Applying a spruce budworm decision support system to Maine: Projecting spruce-fir volume impacts under alternative management and outbreak scenarios. J. Forestry 2011, 109, 332–342. [Google Scholar]
- Québec Ministère des Forêts de la Faune et des Parcs. Aires Infestées Par la Tordeuse des Bourgeons de L’épinette au Québec en 2018-Version 1.0; Gouvernement du Québec, Direction de la Protection des Forêts: Québec, QC, Canada, 2018; pp. 1–17. ISBN 978-2-550-82373-5. [Google Scholar]


© 2019 by the authors. Licensee MDPI, Basel, Switzerland. This article is an open access article distributed under the terms and conditions of the Creative Commons Attribution (CC BY) license (http://creativecommons.org/licenses/by/4.0/).