Article

Inversion and Effect Research on Dust Distribution of Urban Forests in Beijing

Beijing Key Laboratory for Precision Forestry, Beijing Forestry University, Beijing 100083, China
*
Author to whom correspondence should be addressed.
Forests 2019, 10(5), 418; https://doi.org/10.3390/f10050418
Submission received: 17 April 2019 / Revised: 7 May 2019 / Accepted: 13 May 2019 / Published: 15 May 2019
(This article belongs to the Special Issue Responses of Trees to Pollutants)

Abstract

:
Urban forests affect the filtration and absorption of airborne particulate matter, which can minimize the harmful effects to human health caused by airborne particulate pollution. Evergreen plants in urban forests play a major role in absorbing dust and purifying the air, especially in winter. Studying the spatial distribution of leaf dust and exploring the dust retention effect of evergreen shrubs are important for scientifically guiding urban forest construction and improving the living environment of cities in winter. The purpose of this study was to establish a dust inversion model by correlation analysis of spectral reflectance and the amount of dust absorption (ADA) of vegetation, using Sentinel-2 satellite remote-sensing images to obtain the dust distribution of the evergreen vegetation (mainly Euonymus japonicus Thunb.) in the Beijing urban area, and to determine the effect of the spatial pattern of E. japonicus woodland on ADA intensity. The result showed that the red band and near-infrared band are most sensitive to dust. The normalized difference phenology index (NDPI) is more suitable for building an inversion model, where the determination coefficient (R2) of the inversion model constructed by the ratio of the NDPI (RNDPI) was 0.879. The inversion results show that the mean ADA in the enclosed area is smaller than that in semi-enclosed and open areas, and the regional distribution of high ADA in the urban area of Beijing was higher in the south with a tendency of the ADA to decrease from city center to the surrounding area. The size, shape, and percentage of landscape (PLAND) of E. japonicus woodland have a significant effect on ADA intensity. We found that, in the study area, when the PLAND of E. japonicus woodland is higher than 40%, its ADA intensity remains basically unchanged. When the vegetation coverage is fixed, the landscape shape index is negatively correlated with ADA intensity, and reduction of the overall shape complexity of forestland can enhance its dust retention effect and improve the air environment of the surrounding areas. The results of this study can be used as a reference for urban planners and landscape architects when building urban forests, providing a scientific basis for controlling and reducing air particulate pollution in Beijing’s winter and improving the living environment.

1. Introduction

With the rapid development of urbanization, the increase in dust emissions from construction sites, roads, and vehicles is a cause of serious air particulate pollution [1]. Air particulate pollution is a primary environmental problem in many regions [2]. Generally, particulate matter with diameter less than 10 μm (PM10), which is called falling dust, settles to the ground under gravity [3]. Heavy metals in falling dust, especially those with high levels of toxicity that are easily deposited in plants, soil, and water, cause tremendous damage to the ecological environment and human health through transmission and accumulation in the food chain [4]. According to statistics, the increase in the concentration of airborne particulates matter can lead to an increase in the number of patients with upper respiratory tract infections, pneumonia, and bronchitis. A study in Boston showed that the daily average concentration of particulate matter with diameter less than 2.5 μm (PM2.5) increased by 17.1 μg/m3, and the hospital admission rate for pneumonia increased by 6.5% [5]. A study in the city of Sorocaba, Brazil showed that the daily average concentration of PM10 increased by 10 μg/m3, and the rate of children entering the hospital due to pneumonia increased by 9% [6]. There is a strong correlation between the number of people suffering from respiratory diseases and the concentration of airborne particulate matter [7]. Living in such an environment for a long time poses a considerable threat to human health [8].
Urban forests were proven to play an important role in beautifying the environment, purifying air, absorbing dust, regulating microclimate, and promoting human physical and mental health [9]. Among these roles, dust absorption is one of the important functions of urban forests in improving the urban environment [10]. Urban forests promote the settlement of air particulate due to the dusty airflow being blocked by the canopy. Since the surface of plant leaves (such as pubescence and waxy epidermis) can block and absorb fine particles, plant leaves exposed to the air can cause airborne particles to be adsorbed and retained on the surface of plant leaves, called the foliar detaining of dust [11]. Compared with urban forests, non-biological materials, such as building surfaces, are characterized by a large surface area but low roughness, and are, therefore, far less capable of retaining dust [12]. With a special canopy and foliar structure, urban forests provide a large space for retarding and absorbing air particulates, becoming an essential filter for curtailing urban atmospheric pollution, which would generate huge dust retention benefits [13]. Qiu et al. found that the annual amount of dust absorption (ADA) of vegetation in the built-up area of Huizhou was 4430.7 t [14]. Tallis et al. discovered urban vegetation in London could reduce the PM10 content in the air by 0.7% to 2.6% [15]. The ADA of plants is positively correlated with the concentration of air particulates; the greater the concentration is, the higher the ADA is. For example, Prusty et al. found a positive correlation between ADA of shelter forests alongside the road and vehicle flow [16]. Many studies demonstrated some correlation between dust absorption of plants and concentration of PM10 in the air [17].
Many studies on urban forest dust retention, which mainly focused on the comparison of dust retention capacity on the surface of plant leaves [18], mechanism of plant dust retention [19,20], and analysis of the dust-detaining component [21], yielded abundant results. Studies showed that, by increasing the greening coverage, it is possible to improve the microclimate environment and enhance the ability of woodland to retain dust [9]. However, scientific data are lacking regarding how woodland plays a role in improving dust environment, how to reasonably green a city, and how to better organize the green space to reduce the concentration of fine particles. The mechanism through which urban forest vegetation spatial pattern influences ADA intensity is not fully understood. Only sporadic recommendations can be used to guide urban forest and land-use planning to improve urban habitats [22]. Most of the existing studies focused on the distribution of dust retention on a small scale, with few on the regional scale, and even fewer on the distribution and effect of dust retention of urban evergreen vegetation in winter.
In autumn and winter, the climate is dry and less rainy, the leaves that can absorb dust are falling off, and it is impossible for these leaves to continue to play the role of adsorbing dust to improve the air. In winter, the evergreen plants in urban forests can absorb dust and purify air. The dust-retaining ability of coniferous plants is higher than that of broad-leaved species [23]. In Beijing, there are fewer evergreen coniferous plants, such as Oriental arborvitae, Chinese pine, and so on, which are planted in a relatively concentrated manner in individual areas. According to statistics, the greening use of shrubs in Beijing is 3.23 times that of trees, whereas the use of Euonymus japonicus Thunb. accounts for 78.03% of the total use of evergreen shrubs [24]. Therefore, we selected E. japonicus as representative of evergreen plants in Beijing in winter to retrieve the dust retention distribution of leaves and analyze the dust retention effect.
In this study, spectral band sensitivities to dust were screened by correlation analysis between the spectral reflectance of plant leaves and dust retention of plant leaves. The spectral response function was used to transform narrow-band spectral reflectance data collected from the ground into broad-band spectral reflectance data from the Sentinel-2 satellite for inversion of vegetation dust retention distribution in the Beijing urban area. By studying the influence of the spatial pattern of E. japonicus on dust intensity, the relationship between size, landscape shape index, percentage of landscape, and ADA intensity was revealed. The goals of this study were (1) to find a quick and comprehensive method for estimating ADA in winter evergreen plants, (2) to study the main patch characteristics that affect the ADA intensity of winter evergreen plants, and (3) to explore the vegetation proportions of winter evergreen plants to effectively improve regional dust environments.

2. Methods and Materials
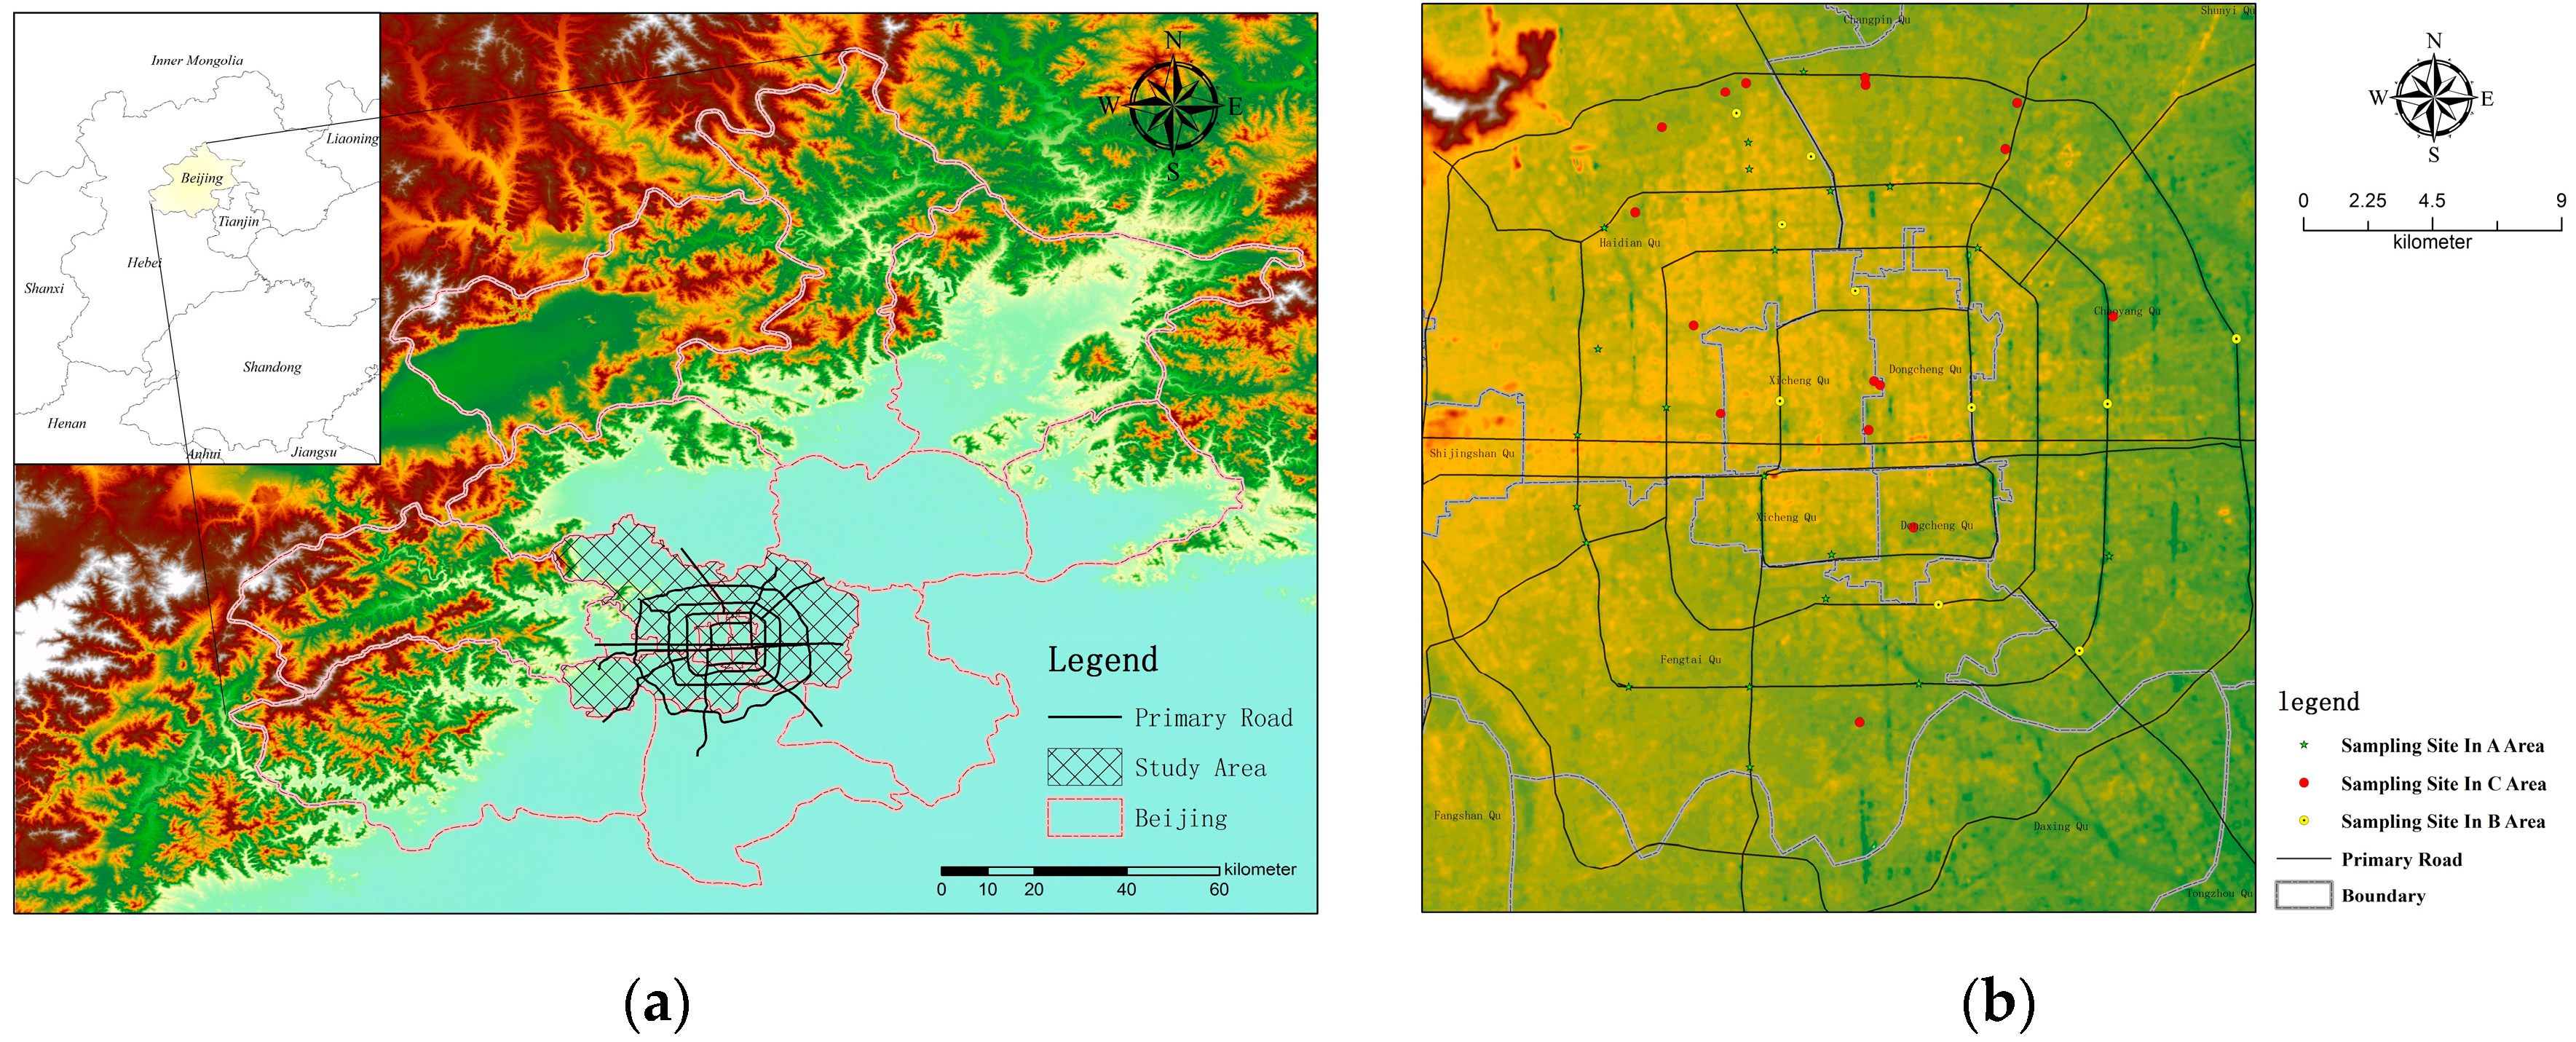
2.1. Study Area

Beijing, the capital of China, is located on the northern edge of the North China Plain. From west to east, it transitions from mountains to plains, and its altitude gradually decreases. It is dry and rainless in winter. Beijing has a temperate continental monsoon climate with a mean annual temperature of 12 °C and a mean annual precipitation of 626 mm. The resident population of Beijing in 2018 was about 21.54 million and motor vehicle population was 6.08 million. As of 2018, the forest coverage of the whole city was 43.5%, and the green area of the parks was 16.3 m2 per person. The location of the study area is shown in Figure 1a.
There were several reasons for choosing this area as the study area. Firstly, the center area of Beijing (areas within the fourth ring road of the city) is highly urbanized with intensive and concentrated urban human activities. The various human activities have many ecological and environmental impacts, such as urban heat islands and airborne particulate pollution. Therefore, it is crucial and urgent to formulate strategies to alleviate urban ecological environment problems, especially dust pollution in winter. Secondly, the landscape pattern of the central urban area is highly heterogeneous, and the vegetation areas are distributed in some areas or scattered in other areas, which is conducive to the study of the impact of different spatial patterns of vegetation areas on the dust retention effect.

2.2. Experimental Design

Euonymus japonicus, a common evergreen plant species in Beijing, was selected as an experimental plant. It is characterized by great shade tolerance and cold resistance, dense branch leaves, and high survival rate, and it has enormous capacity for absorbing harmful substances in the environment. Its use accounts for 78.03% of the total use of evergreen shrubs in Beijing. Therefore, we assumed that the dust retention distribution of vegetation leaves obtained by Sentinel-2 inversion was the dust retention distribution of leaves of E. japonicus. The spatial distribution of the sampling points is shown in Figure 1b. There are three types of space in the sampling area: A represents open space (such as blocks, roads), B represents enclosed space (such as parks), and C represents semi-enclosed space (such as schools). The sampling points were arranged at different locations in the urban area, whose spatial distribution follows the principles of extensiveness, uniformity, and regularity. The same number of leaves was collected at each sampling point, ensuring that an identical number of plant leaves were obtained from each environment. The ratio of the surface reflectance data of the vegetation cover area on 22 November 2018 to that of the vegetation cover area on 14 January 2019 represents the ratio of the spectral reflectance of the leaves before and after cleaning. Based on the correlation between ADA and spectral reflectance of ground acquisition, an inversion model of dust retention was established. The spatial distribution of the dust-retaining content in the vegetation coverage area was obtained using satellite remote-sensing data from two periods, and then the landscape factors affecting the effect of vegetation dust retention were studied. The main process of this study is shown in Figure 2.

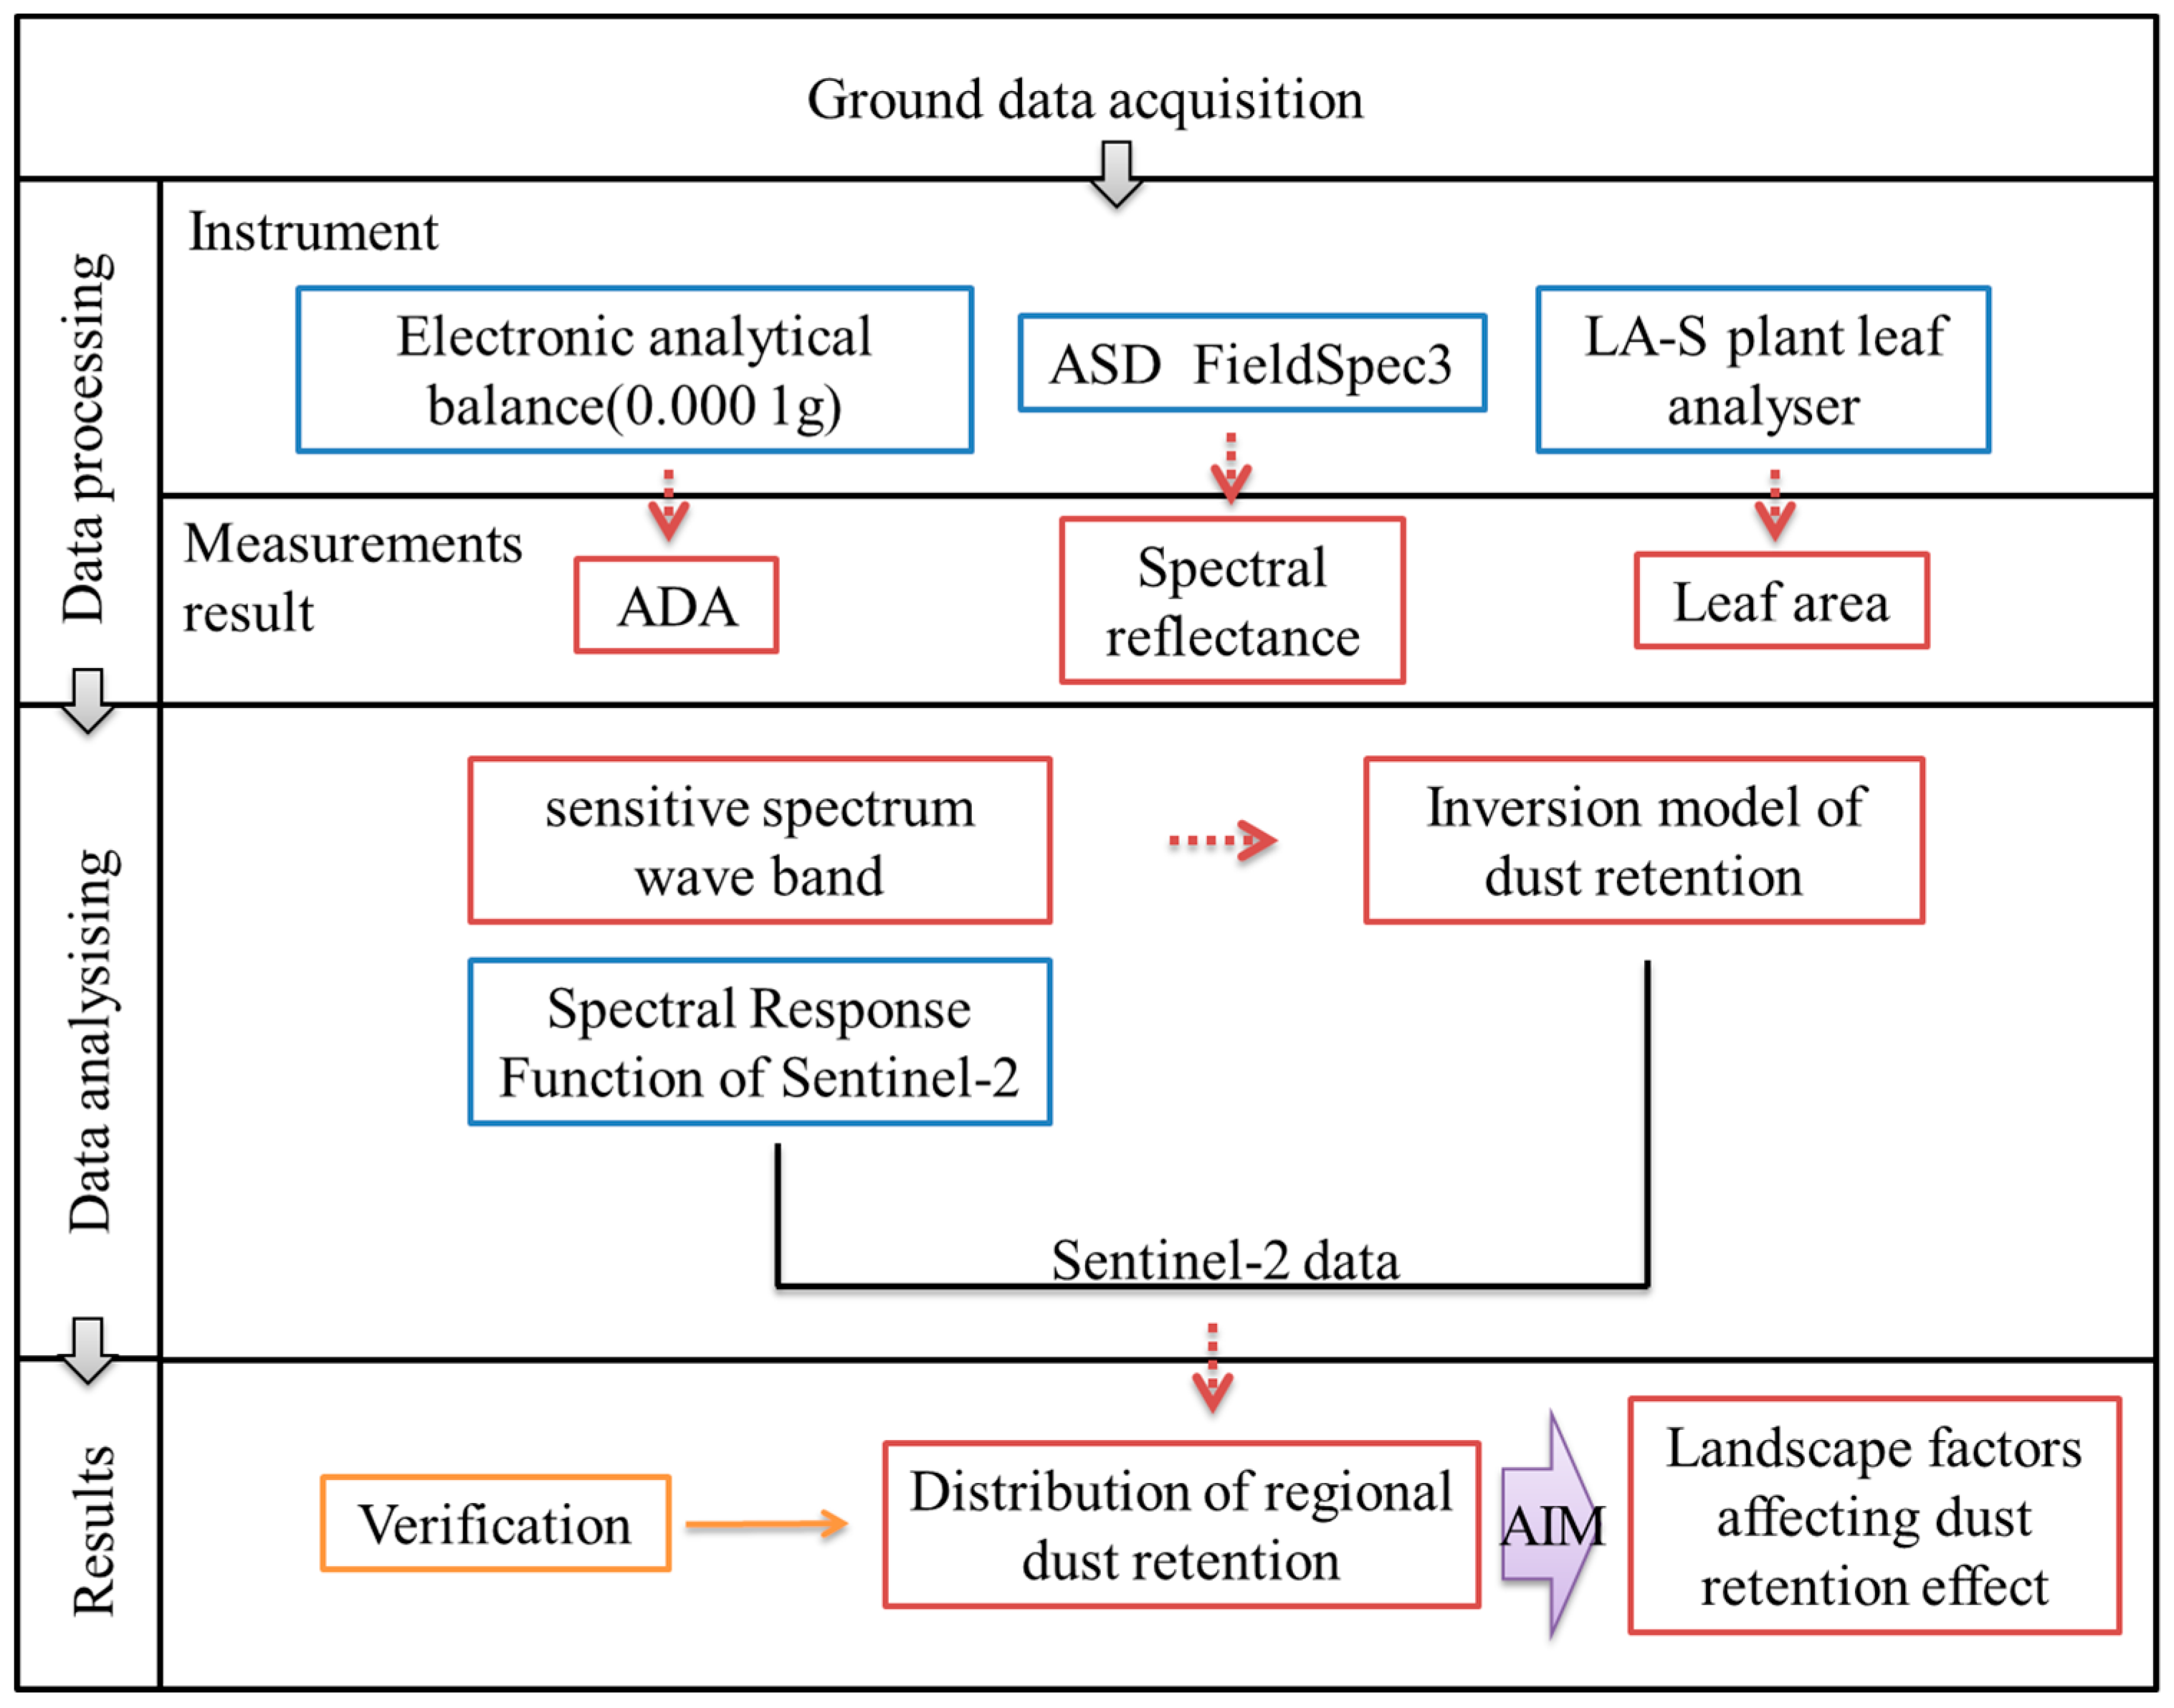
2.3. Data Processing

2.3.1. Processing of Remote-Sensing Data

The Sentinel-2 images have 13 spectral bands, including four bands with a spatial resolution of 10 m, six bands with a spatial resolution of 20 m, and three bands with a spatial resolution of 60 m. This satellite can be used to monitor land environment and provide information on terrestrial vegetation growth, soil cover, inland rivers, and coastal environments, which is important for agroforestry improvement, food production forecast, and food security, and for the monitoring of natural disasters such as floods, volcanic eruptions, and landslides, thus assisting with humanitarian relief. Sentinel-2 data are the only data with three bands in the red-edge range, which are extremely effective for monitoring vegetation health. The Sentinel-2 satellites data band parameters are shown in Table 1.
It was a cold winter in Beijing from 22 November 2018 to 14 January 2019. The leaves of deciduous plants in urban forests fell off, but the evergreen plants did not change much. Only evergreen plants can purify the air and absorb dust during this season. It is generally thought that, when the rainfall reaches 15 mm or the wind speed reaches 17 m/s, the dust accumulated on the leaves of the plants can be completely washed away [25]. However, the temperature is low, precipitation is low, and wind speed is high in winter in Beijing. According to the meteorological monitoring data from the Beijing Meteorological Observatory, on 14 January 2019, the wind speed was 8.0–10.7 m/s, and the gales reached wind speeds of 17.2–20.7 m/s for a period of time. Therefore, the Sentinel-2 image on 15 January 2019 was selected as the dust-free image of the vegetation leaf surface, and the Sentinel-2 image on 22 November 2018 was selected as the image of vegetation with dust.
As the image information is acquired, it is affected by factors such as moisture and aerosol in the atmosphere, which cause noise in the band to increase and the information to blur. Therefore, the images were subjected to radiometric calibration, atmospheric correction, and geometric correction to eliminate the noise and reduce the radiation interference between adjacent pixels. It is also possible to adjust the smoothing of the spectrum caused by artificial suppression, and finally obtain an image that is similar to the real reflectance of the surface.

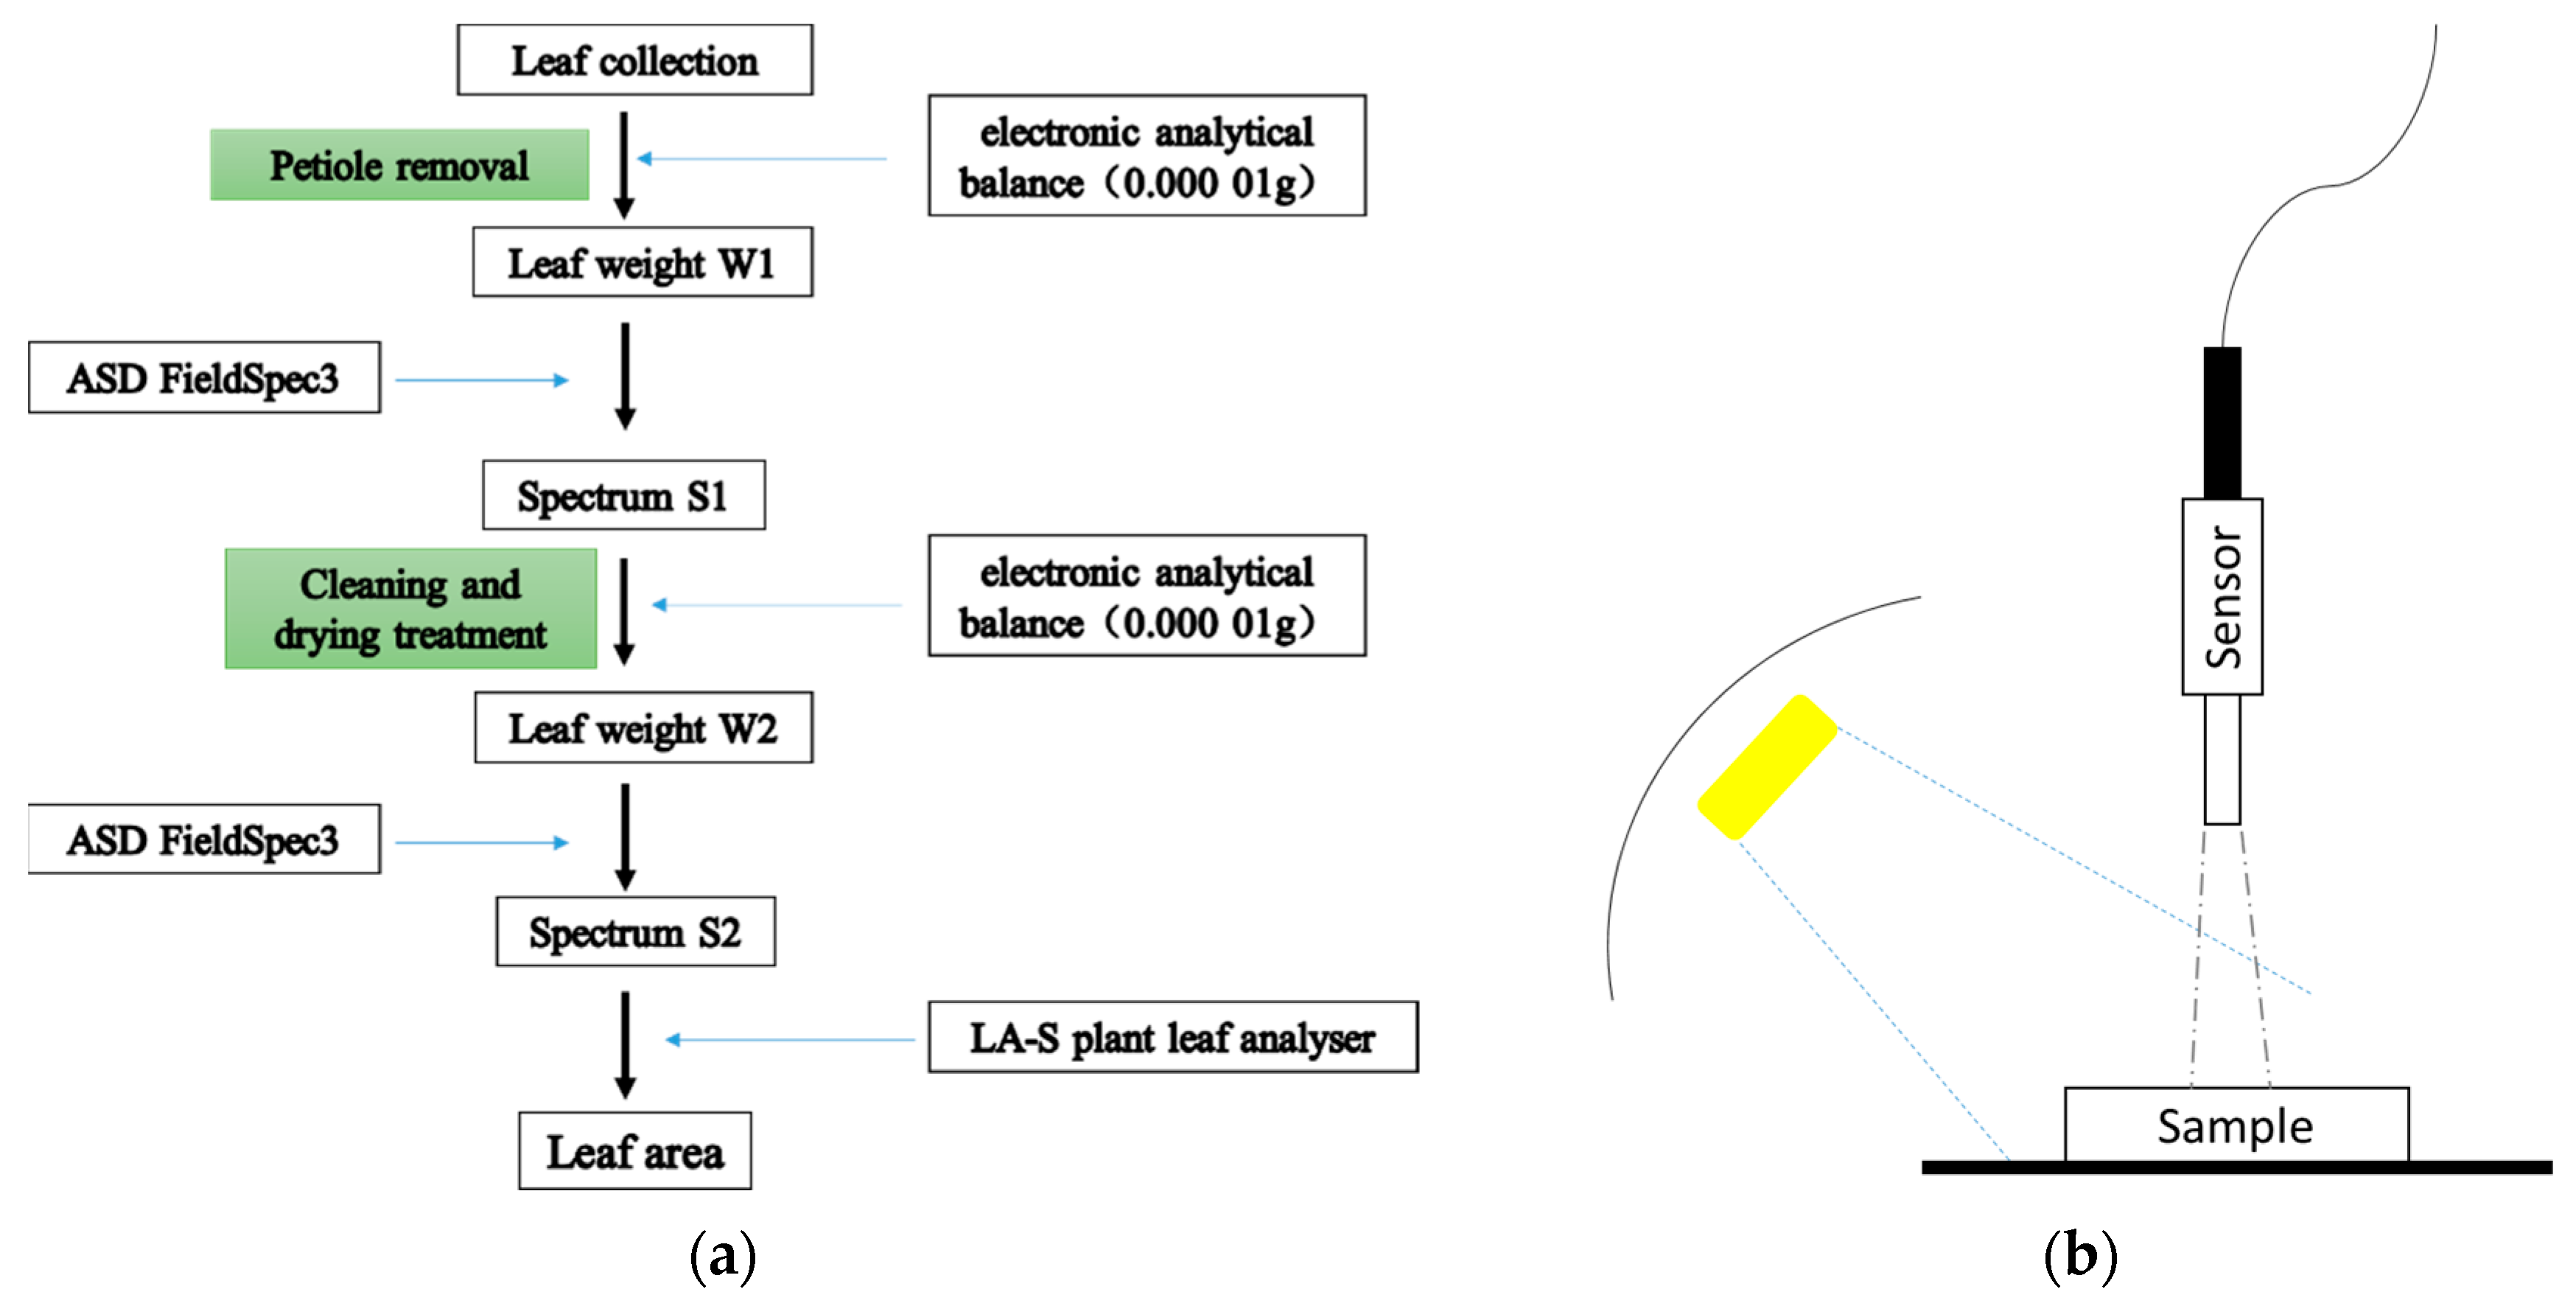
2.3.2. Spectrum Collection and Dust Measurement on Leaf Surface

Figure 3a shows the main steps of spectrum collection and dust measurement on leaf surface. The ASD FieldSpec 3 multifunctional spectral radiometer (Malvern Panalytical, Malvern, Worcestershire, UK) was used for spectral determination, with a band value of 350 to 2500 nm, a spectral fraction of 3 nm, and a spectral sampling interval of 1.4 nm. While collecting the leaves’ hyperspectral curves, the acquisition of hyperspectral experiment data was subject to some interference due to dark current, light-source fluctuations, and other environment factors. To eliminate the error caused by these factors, spectral correction was performed every 15 min when collecting the leaves’ hyperspectral curves. The correction formula is as follows:
I = I 0     D   R   D ,
where I, I0, D, and R represent the corrected image, sampling image, full blackboard image, and full whiteboard image, respectively.
During measurement, the leaf was placed on a black cotton cloth 5 cm from the vertically downward probe. Three sampling points were taken from each leaf and the average value was taken as the spectral reflectance of the leaf. Then, the measured spectral data were subjected to first-order differential processing. Figure 3b shows the schematic diagram of spectral reflectance.
To obtain a wide range of ADA distributions from satellite remote-sensing images, the spectral response function (SRF) was used to convert the spectral reflectance of the leaves collected by ASD into the broad-band reflectance of the Sentinel-2 satellite. The following is the specific calculation formula:
R S A T ( λ ) = λ m i n λ m a x R l e a f ( λ ) f ( λ ) d λ λ m i n λ m a x f ( λ ) d λ ,
where R S A T ( λ ) represents the satellite band reflectance, R l e a f represents leaf reflectance, f ( λ ) represents the spectral response function of satellite, λ m a x and λ m i n represent the minimum and maximum wavelengths for each band of satellite, respectively, and λ represents the intermediate band in each band.
The collected leaves were placed in the numbered envelopes and brought to the laboratory. The petiole-cut leaves were weighed using an electronic analytical balance one by one with the weight denoted by W1i. Then, the dust of the leaf was washed with a soft brush, rinsed with distilled water, and wiped with a clean cotton swab. We then weighed the leaf a second time, designated W2i. The leaf area was measured by a plant leaf analyzer and recorded as Si. The formula for calculating ADA on the leaf surface ( g · m 2 ) is
ADA   ( g · m 2 )   =   ( W 1 i     W 2 i )   ÷   S i   ×   10,000 .

2.3.3. Vegetation Index

Previous studies showed that the normalized difference vegetation index (NDVI) [26], the normalized difference phenology index (NDPI), the environmental vegetation index (EVI) [27], and the soil-regulated vegetation index (SAVI) [28] can characterize the vegetation status. Therefore, we used these four indices for research.
NDVI is frequently used to detect vegetation growth state and vegetation coverage.
NDVI = R N I R     R R E D R N I R   +   R R E D ,
where R N I R and R R E D are the reflectance of the near-infrared band and red band, respectively.
NDPI, a new index, performs better in detecting vegetation growth state and water-bearing state and responds more quickly to moisture compared with NDVI, SAVI, EVI, and other indices [29]. The index is less affected by the impact of dust and can reflect vegetation status distinctly and precisely.
NDPI = R N I R     ( α R R E D   +   β R S W I R ) R N I R   +   ( α R R E D   +   β R S W I R ) ,
where   R N I R , R R E D , and R S W I R respectively represent the reflectance of the near-infrared band, red band, and short-wave infrared band. Generally, α is 0.74 and β is 0.26.
EVI = R N I R R R E D ,
where R N I R and R R E D are the reflectance of near-infrared band and red band, respectively.
SAVI = ( R N I R R R E D ) ( 1 + α ) R N I R R R E D + α ,
where R N I R and R R E D are the reflectance of the near-infrared band and red band, respectively, and α represents the coefficient of soil regulation.

2.3.4. Urban Landscape Pattern Indices

Three landscape indices (Table 2), including patch area (PA), the landscape shape index (LSI), and percentage of landscape (PLAND), were selected to quantify the spatial pattern of urban vegetation regions and to analyze the relationship between these patterns and in corresponding ADA reductions.

2.3.5. Calculation of ADA Intensity

In this study, the mean ADA d m ¯ (g/m2) of Euonymus japonicus in study area was treated as the reference amount of the dust absorption of vegetation. Hence, we defined the ADA intensity of woodland of E. japonicus at the patch level as Δ d i = d i d m ¯ , where d i denotes the mean ADA of a E. japonicus woodland patch. The ADA intensity of vegetated areas to the surrounding urban area was calculated as Δ d = d j d m ¯ , where d j denotes the mean ADA in a certain area. Pearson correlation analysis was conducted to examine the relationship between PLAND and ADA reduction. Sample analyses were conducted to investigate the impact of LSI on the ADA intensity. Linear regression analysis was used to further reveal the effects of LSI and PLAND on ADA intensity.

3. Results

3.1. Effect of Absorbed Dust on Leaf Spectrum

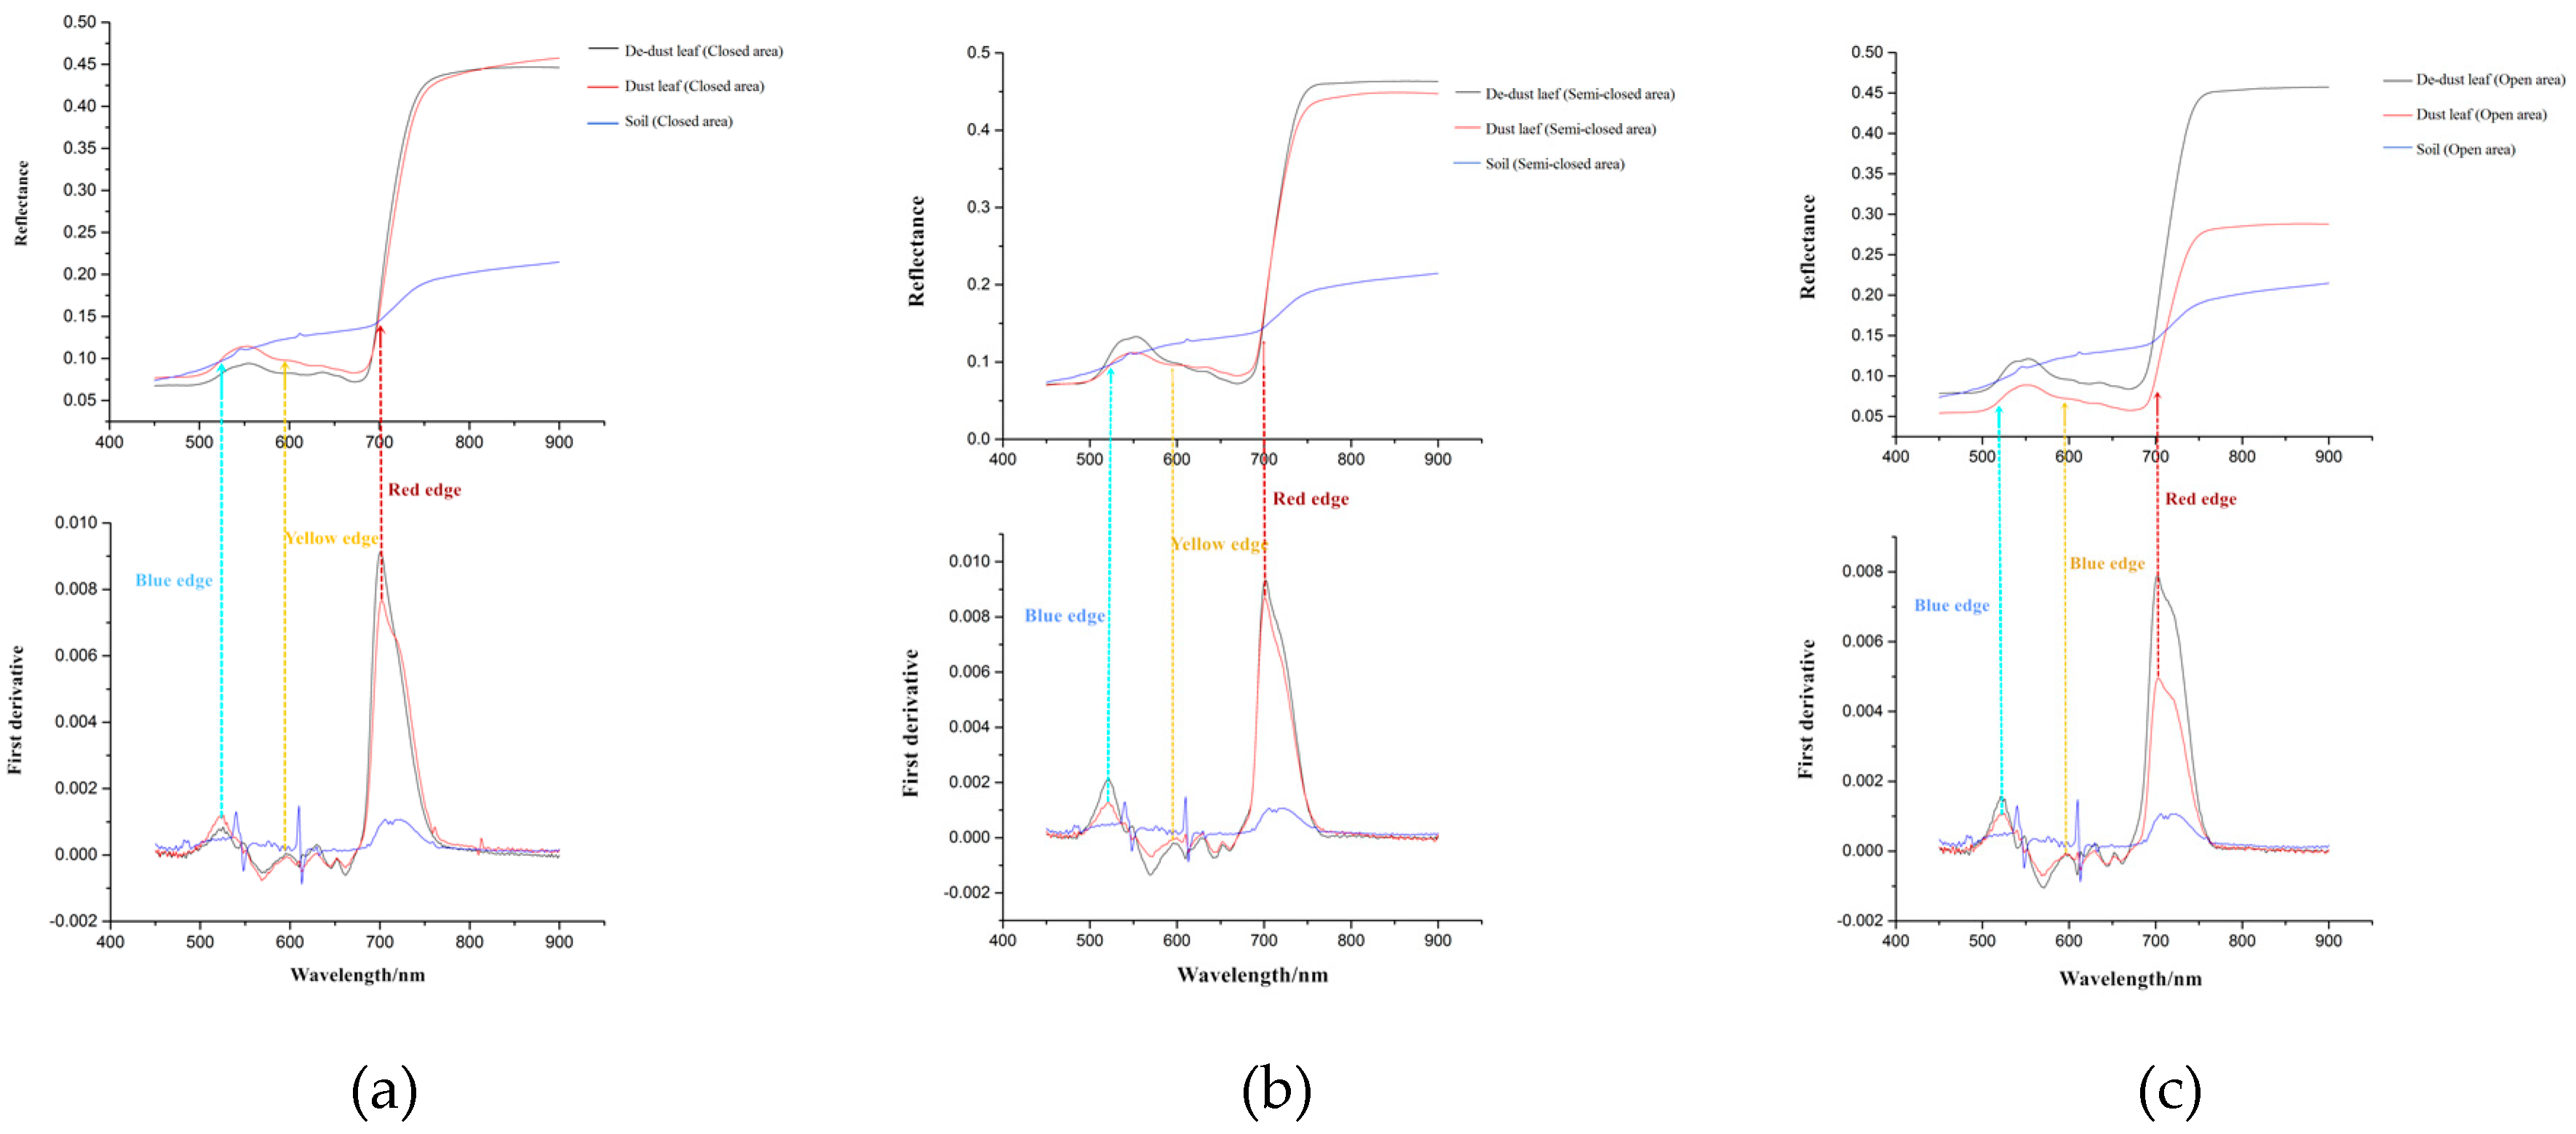
3.1.1. Effect of Absorbed Dust on Leaf Spectral Reflectance

Figure 4a–c show the change in the mean spectral reflectance curves of the leaves of Euonymus japonicus before and after cleaning in different areas. The morphologies of the curves appear similar before and after cleaning, but significant changes occur in some areas. For example, the mean spectral reflectance of the leaves before dust removal was smaller than that of clean leaves in the range of 510 to 700 nm and 758 to 1480 nm. The changes in reflectivity in other bands seem to be less obvious, especially for 700–724 nm, 1375–1418 nm, and 1863–1889 nm. Changes in the mean spectral reflectance before and after cleaning in the closed areas were smaller than that in the semi-closed areas, whereas changes in the open area were the greatest mainly because, in the open area, there are many cars and the dust retention ability of the road is weak. The vehicles cause the dust to be lifted up and suspended in the air, and the dust is adsorbed by the vegetation or re-settles on the road surface due to gravity.
The red edge, yellow edge, and blue edge are feature points and regions of the vegetation spectral curve, and trilateral parameters were obtained by calculating the first derivative of the reflectance spectra. The first derivative processing of spectral data is able to eliminate some background noise [30]. For the red edge, the maximum of the first derivative of the reflectance in the range of 680 to 750 nm was extracted as the slope of the red edge, and the wavelength corresponding to the maximum value represents the red edge position. The definitions of the blue edge (490–530 nm) and yellow edge (550–580 nm) are similar to those of the red edge.
Figure 5a–c show the change in the mean spectral reflectance curves of the leaves through the first derivative treatment before and after cleaning in different areas. As can be seen from the graphs, the positions of the red, yellow, and blue edges of the leaves did not move significantly before and after cleaning, with the red edge at 702 nm, blue edge at 525 nm, and yellow edge at 550 nm, indicating foliar dust was insensitive to the interference of the three parameters. However, the areas of the blue edge and red edge decreased from closed areas to open areas, whereas the areas of yellow edge increased from closed areas to open areas.

3.1.2. Correlation between Amount of Foliar Dust and Spectral Data

Figure 6 displays a correlation curve between the spectral reflectance ratio (dusty and clean) and the amount of dust per unit area of the leaves before and after cleaning. Figure 6 shows that the correlation curve can be divided into two parts. One lies in the range of 350 to 722 nm, exhibiting a positive correlation. The correlation within 350–706 nm was significant, and the correlation reached a maximum of 0.786 at 672 nm. The curve appears to be obviously concave at 510–580 nm, which is located in the green wave range, indicating that the green band is less sensitive to dust than the other bands. The other part shows a negative correlation at 720–1050 nm, in which the negative correlation decreases rapidly within 720–801 nm and the negative correlation reaches the minimum of −0.35 at 802 nm. In the range of 801 to 1050 nm, the negative correlation slowly varies. According to the analysis of the correlation curve, the red band and near-infrared band have a higher sensitivity to dust.

3.2. Response of Vegetation Indices to ADA

The results of correlation analysis showed that red and near-infrared bands are sensitive to dust. Therefore, these two bands were chosen to construct the vegetation indices (NDVI, NDPI, EVI, and SAVI). Taking the ratio of vegetation index before and after cleaning (RNDVI, RNDPI, REVI, and RSAVI) as the independent variable and the ADA of leaves as the dependent variable, the regression model of foliar absorbed dust inversion was constructed. The effect of the model was investigated by fitting precision ( R c 2 ), prediction precision ( R p 2 ), predicted root-mean-square error ( R M S E p ), and the ratio of sample standard deviation and R M S E p (RPD). The results are shown in Table 3.
The RPD of the regression models was established for each vegetation index; the RPDs of the models established by REVI and RSAVI were less than 1.4, which indicates that the two models do not have the ability to predict samples. The RPDs of the models established by RNDVI and RNDPI vegetation index were more than 2, which indicates that the regression models established by RNDVI and RNDPI may have predictive ability. The R c 2 and R p 2 models of the RNDVI and RNDPI in the three regions were superior to those of the models established by the REVI and RSAVI, reaching extremely significant levels. Among them, R c 2 , R p 2 , R M S E p , and RPD were the largest when modeling with RNDPI in the three regions. The numerical approximation of R c 2 and R p 2 indicated that the regression model established by RNDPI has better stability. Although the model constructed by RNDVI is less accurate than RNDPI for all indicators, its R c 2 and R p 2 reached a very significant level. Therefore, RNDVI and RNDPI were selected for the construction of the foliar ADA inversion model.

3.3. Construction and Verification of Foliar ADA Inversion Model

3.3.1. Establishment of Foliar ADA Inversion Model

From the above studies, it is known that the spectral changes in the red band and near-infrared band are most sensitive to dust, and RNDVI and RNDPI have a high correlation with ADA. Therefore, using the images of Sentinel-2 satellite, the NDVI and NDPI on 22 November 2018 and 14 January 2019 were obtained. The ratio of vegetation indexes (RNDVI and RNDPI) in the two periods was taken as the independent variable, and the ADA of leaves was taken as the dependent variable. Table 4 shows the foliar absorbed dust inversion model established by RNDVI and RNDPI, respectively. Then, the regression model of foliar absorbed dust inversion was constructed, as shown in Figure 7a. A regression model of RNDVI and ADA was established, as shown in Figure 7b.
The determination coefficients of the regression models established by RNDVI and RNDPI were 0.879 and 0.840, respectively, which indicates that the regression model of RNDPI was well fitted; thus, RNDPI was more suitable for the construction of inversion model. The dust-reversed inversion model constructed by NDPI vegetation index could accurately reflect the spatial distribution of vegetation dust content in the Beijing urban area.

3.3.2. Inversion and Verification of Spatial Distribution of ADA

The NDPI dust-reversed inversion model was used to determine the leaf dust distribution in the vegetation area in the Beijing urban area on 22 November 2018, as shown in Figure 8a. The dust retention distribution of leaves in the vegetated urban area obtained by inversion was analyzed using the nuclear density method, as shown in Figure 8b.
Figure 8a shows that the closed area is still affected by dust when ADA in this area is less than that of semi-closed and open areas. The strip-shaped woodland on both sides of the road is the area with the most dust retention; the farther away it is from the road, the lower the ADA is. The larger the closed area is, the less the impact of the dust is, i.e., the lower the ADA.
Figure 8b shows that, on 22 November 2018, the regional distribution of high ADA in the urban area of Beijing was higher in the south with a tendency to decrease from city center to the surrounding area. Specifically, the ADA in alleys inside the second ring of Beijing remained high because the area is densely populated with many narrow roads. In comparison, Jingshan Park near the Forbidden City and the Temple of Heaven Park have a low ADA due to the planting of a large area of evergreen vegetation, Euonymus japonicus. The reason for the high ADA in the southwest corner of the third ring is that the Beijingxi Railway Station is near the area.
In this study, we selected the inversion simulation values and measured data of 200 sets, and the root-mean-square error (RMSE) was used to evaluate the model’s ADA inversion accuracy. The results are shown in Figure 9a, which shows that the simulation of the dust inversion model constructed by NDPI has a high fitting degree with the measured data. The RMSE was 5.93, indicating that the model accurately reflects the spatial distribution of ADA of the vegetation in Beijing urban area.
Ram et al. showed that the distribution of dust on the surface of leaves has a strong correlation with the air pollution index [31]. The concentration of PM10 in the air also has a significant correlation with dust retention of the leaves [18]. In this paper, The PM10 monitoring data provided by the atmospheric monitoring stations (n = 27) set up by the Environmental Protection Department in the main urban area of Beijing and the temporary monitoring stations (n = 4) of some universities were used to verify the urban dust distribution results obtained in this study. The PM10 concentration monitoring data ranged from 1 November to 11 December in 2018, and the air monitoring station provides real-time monitoring values of PM10 concentration each day. We processed the real-time data provided by the monitoring points as the daily mean of the PM10 concentration per day, and then obtained the mean concentration of PM10 from 1 November to 11 December. The mean concentration was acquired to avoid the abrupt drop in particulate concentration caused by short-term gales, which in turn lead to data instability. The spatial distribution of PM10 concentration in the main urban area of Beijing was obtained using co-Kriging interpolation with the PM10 concentration of monitoring stations as the main interpolation variable and PM2.5, air pollution index (API), vegetation cover, and digital elevation model (DEM) as the auxiliary interpolation variables. As shown in Figure 9b, the distribution of PM10 concentration was characterized by a lower concentration in the north than in the south and a higher concentration in the east than in the west. It tended to decrease from city center to the surroundings. These findings are roughly consistent with the spatial distribution of ADA from the inversion. This indicates that the inversion of vegetation distribution in the urban area of Beijing is reasonable.

3.4. Urban Forest Landscape Pattern and Dust Retention Effect

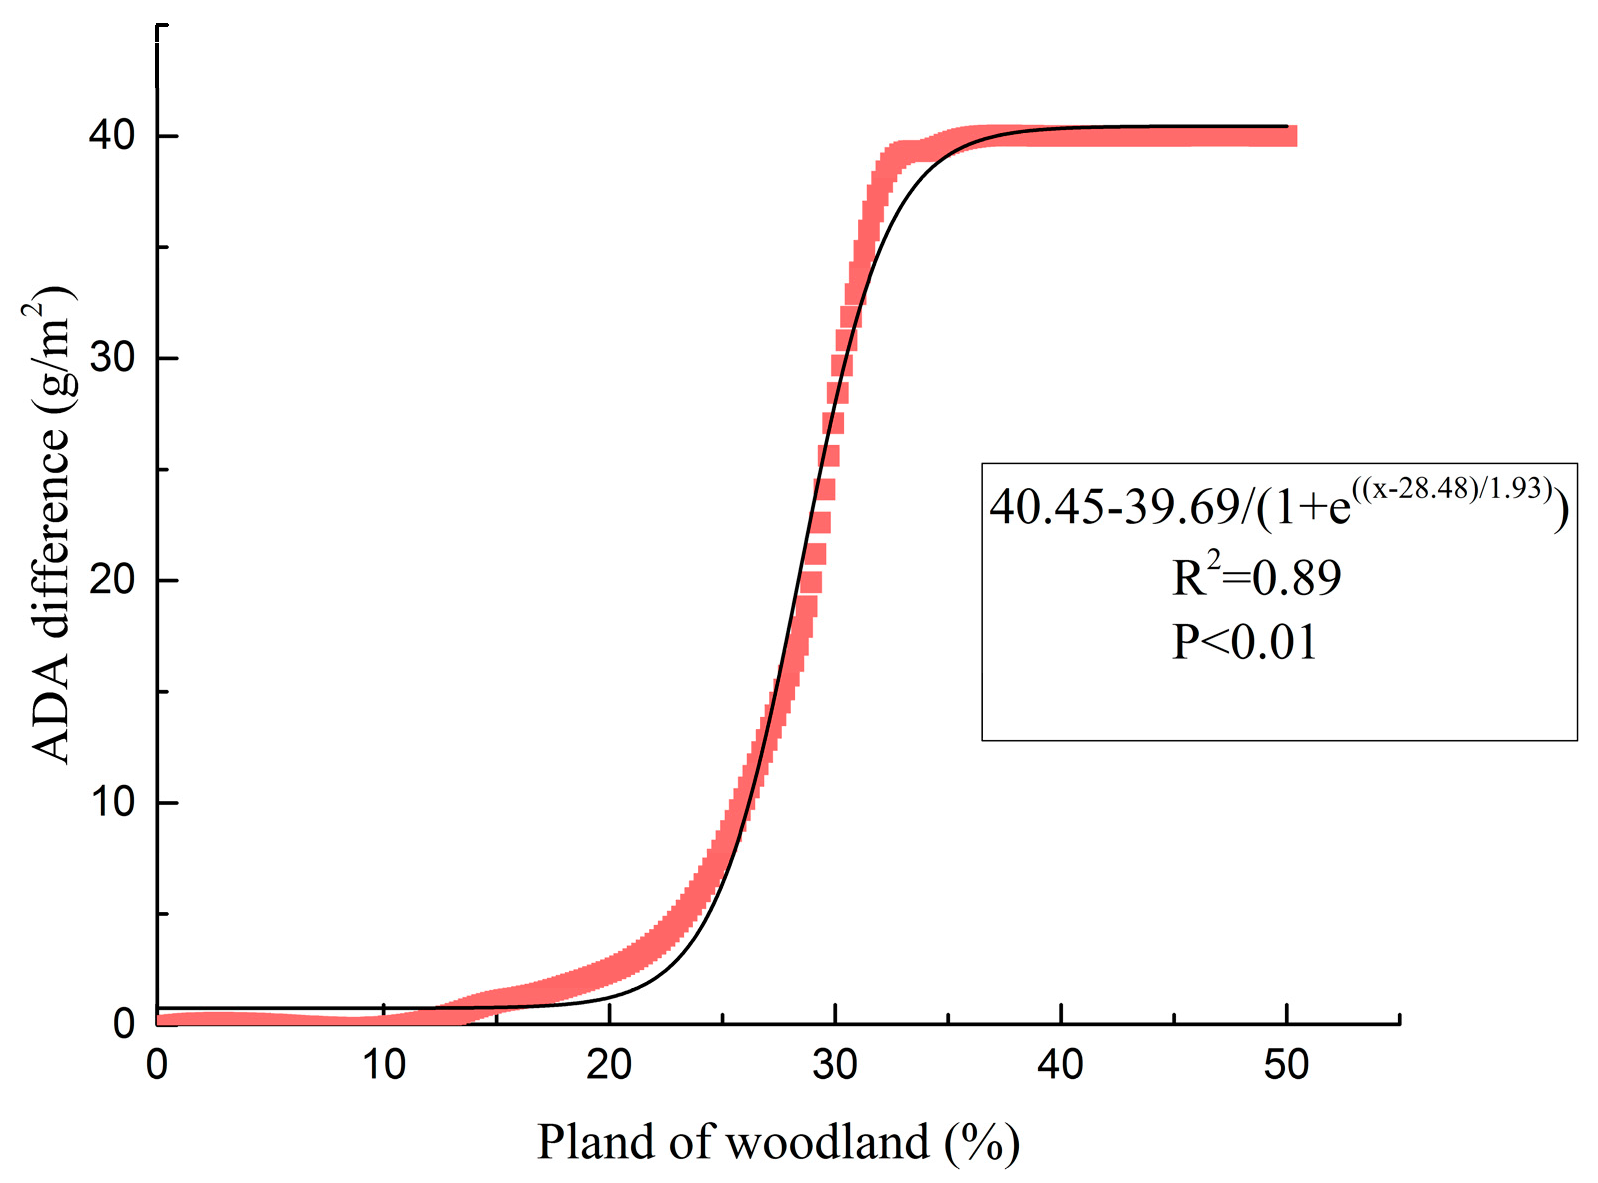
3.4.1. Influence of Urban Forest Landscape Percentage on Dust Intensity

The percentage of landscape (PLAND) of Euonymus japonicus woodland was calculated using the moving window method, and then the influence of PLAND on the dust intensity was studied, as shown in Figure 10. PLAND is significantly correlated with the ADA intensity (R2 = 0.89, p < 0.01).
The results indicate that, within the study area, when the PLAND of E. japonicus in woodland is less than 20%, there is no dust-blocking benefit, which means that the environment cannot be improved. The results also indicate that there may be a maximum dust detention threshold for the ADA intensity of E. japonicus woodland; the ADA intensity does not continue to increase with the increase in PLAND. In this study, the ADA intensity of woodland remained stable when PLAND was greater than 40%, and the dust-blocking benefit of E. japonicus exhibited no augmentation.

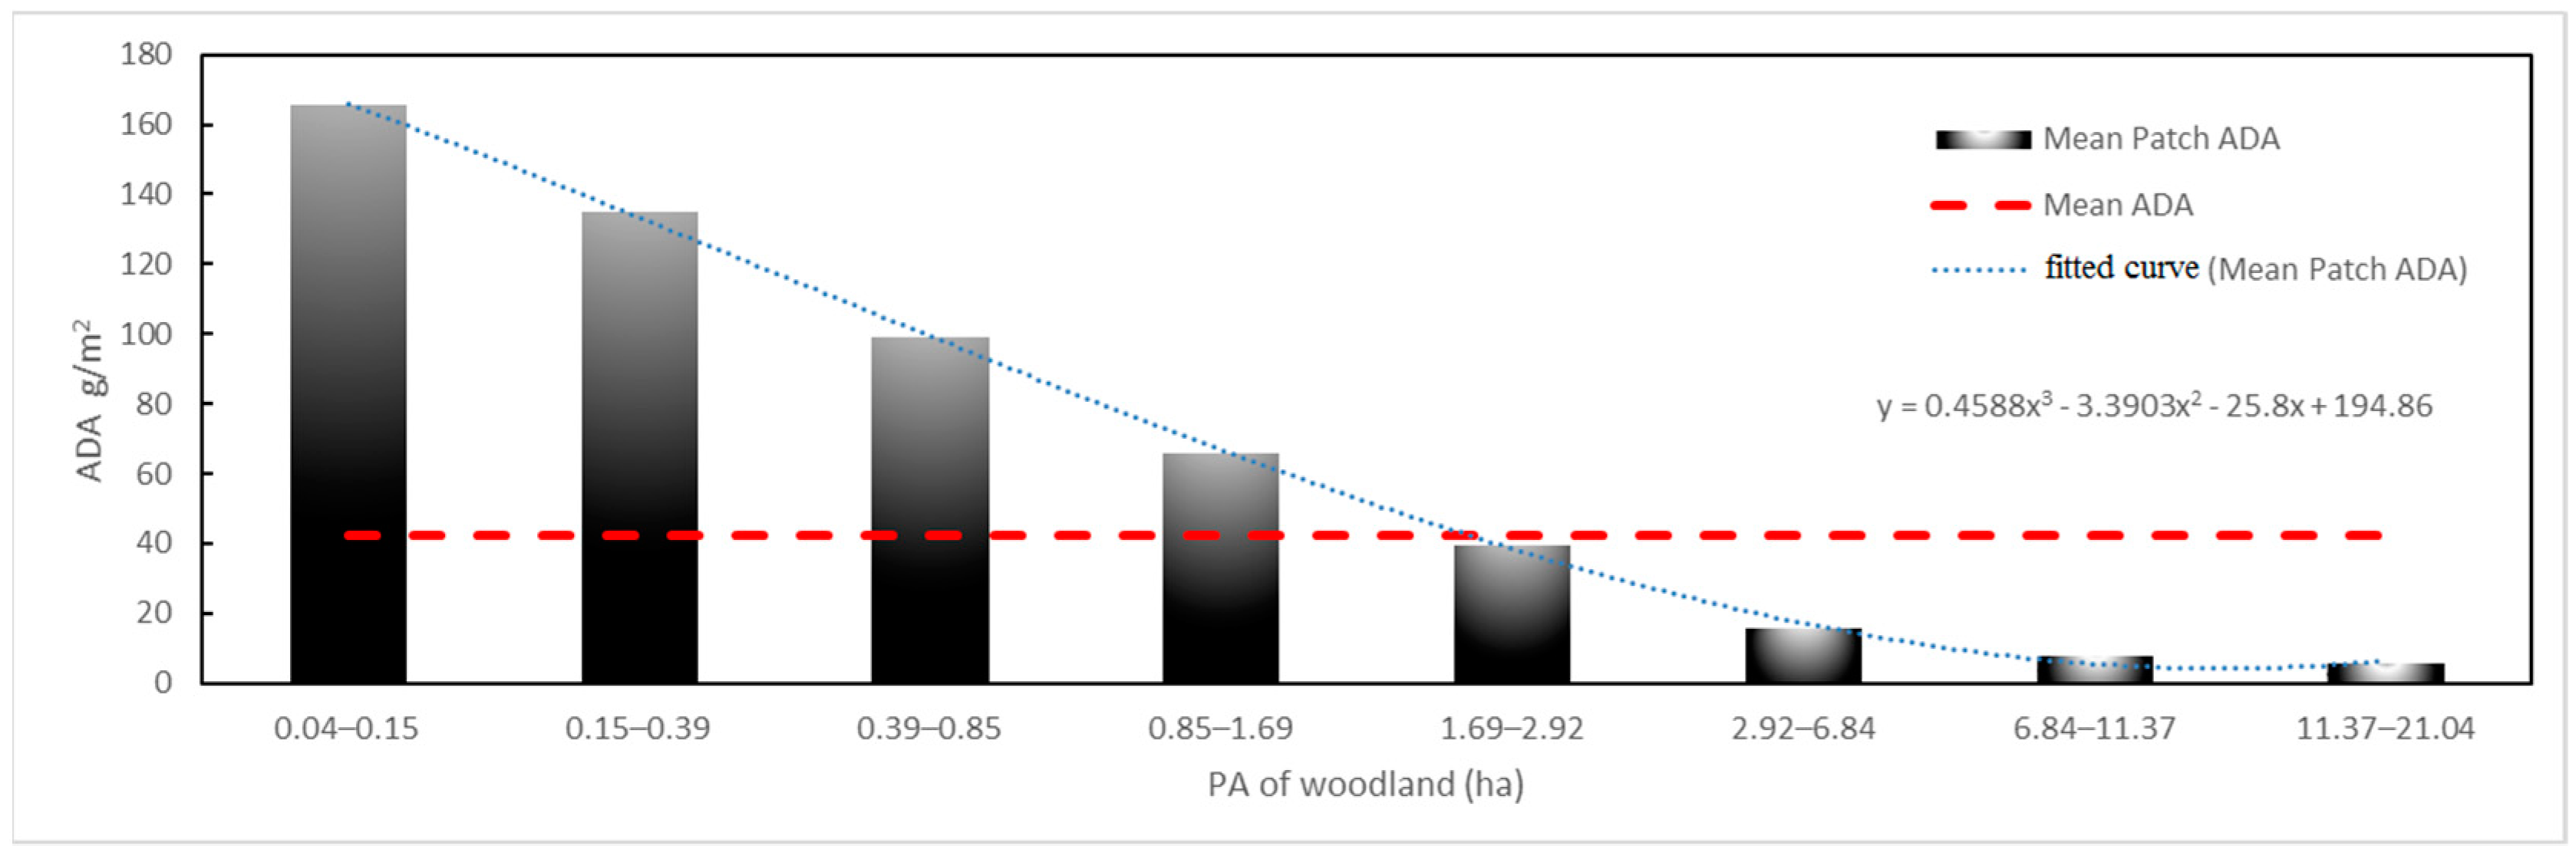
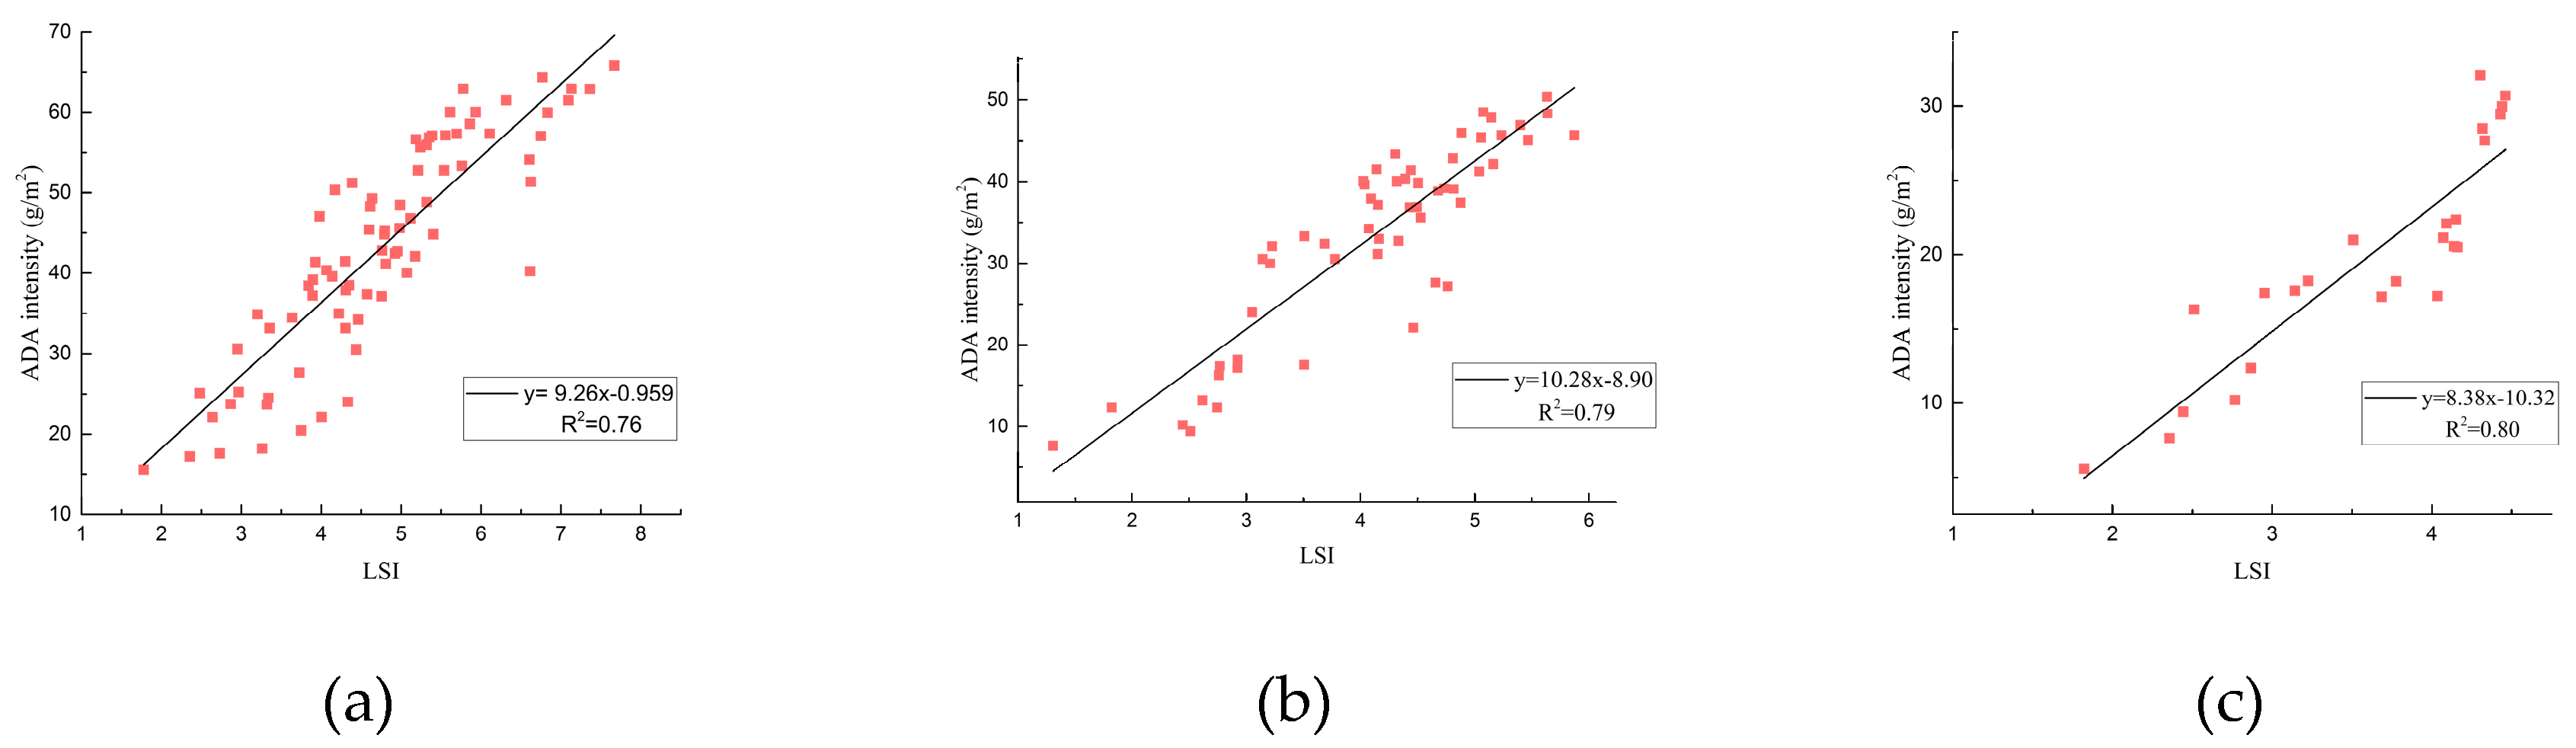
3.4.2. Influence of Urban Forest Patch Area and Shape on ADA Intensity

When the patch size is smaller than the pixel size (20 × 20 m) of the dust distribution map, the ADA represents the number of mixed pixels. Thus, all patches with an area less than 0.04 ha were excluded for analysis, and 1844 E. japonicus woodlands were selected as samples for analysis. The mean ADAs of woodland patches are represented by eight PA categories, as shown in Figure 11: 0.04–0.15 ha (n = 403), 0.15–0.39 ha (n = 355), 0.39–0.85 ha (n = 332), 0.85–1.69 ha (n = 286), 1.69–2.92 ha (n = 204), 2.92–6.84 ha (n = 146), 6.84–11.37 ha (n = 83), and 11.37–21.04 ha (n = 35). Then, Pearson correlation analysis was conducted on the PA of the woodlands and their ADA intensities. The results showed that PA is significantly correlated with ADA intensity (r = 0.73*, p < 0.05), indicating the PA of woodlands can be regarded as an important factor affecting ADA intensity. When the PA of E. japonicus patch is greater than 1.96 ha, the patch has dust retention benefits, which can significantly reduce the amount of dust in the environment. The ADA intensity in patches with a larger area would be stronger and more stable than in small patches. The maximum ADA intensity of E. japonicus patch was 38 g/m2. The results also indicate that a maximum dust detention threshold may exist for woodland patches.
To better understand the influence of patch shape on ADA intensity, we selected E. japonicus patches with a PA of 3 ha (n = 78), 7 ha (n = 57), and 12 ha (n = 24) for further analysis. The results showed that the effect of the shape index on ADA intensity was statistically significant when PA = 3 ha (R2 = 0.76, p < 0.01), PA = 7 ha (R2 = 0.79, p < 0.01), and PA = 12 ha (R2 = 0.80, p < 0.01), and all showed an obvious linear relationships, as shown in Figure 12. In this study, the landscape shape index of E. japonicus woodland was negatively correlated with ADA intensity.

4. Discussion

Dust significantly affects the spectral reflectance of leaves, and the spectral reflectance of a dusty leaf is significantly lower than that of a clean leaf. In this paper, the spectral reflectance of the leaves of the main evergreen plant (E. japonicus) in Beijing was measured. The results showed that the spectral reflectance is positively correlated with the amount of dust within 350–722 nm, with a maximum correlation at 672 nm. The range of green band from 510 to 580 nm appears concave, which indicates that the sensitivity of the green band to dust is weaker than that of the other bands. A negative correlation was observed for 722–1050 nm, where the negative correlation at 722–801 nm decreases rapidly, and the negative correlation reaches a minimum at 802 nm. Studies showed that red and near-infrared bands are sensitive to dust, and dust inversion studies can be performed using these two bands. Similar to previous studies, Yan et al. found a significant change in the near-infrared band before and after cleaning of the leaves, and used the band to estimate the distribution of foliar dust [32]. Luo et al. found that the spectral reflectance of clean leaves of E. japonicus was much higher than that of dust retention leaves at 780–1300 nm [33].
A variety of vegetation indices were used by many scholars to study dust inversion. Yan et al. used the near-infrared band to estimate the distribution of foliar dust, which showed relatively high precision [32]. After comparing the correlation between the band of Landsat8, SPOT 6, HJ-1B, moderate-resolution imaging spectroradiometer (MODIS), and ZY-3, and the amount of dust (ADA), Wang et al. discovered that, in theory, Landsat8, SPOT 6, MODIS, and ZY-3 are all suitable for inversion. Among them, the green band of Landsat8 and NDVI were more correlated with the amount of dust (ADA) [34]. Peng et al. constructed indices, such as foliar dustfall content difference index (FDCDI), foliar dustfall content ratio index (FDCRI) and foliar dustfall content normalization index (FDCNI), to invert the dust retention of the leaf. He found that FDCNI was the best index amongst the three indices for inversion of dust retention [35]. However, the constructed indices were all based on hyperspectral data, having little significance for the inversion of vegetation dust distribution at the regional scale. We compared the correlation between the ADA and RNDVI, RNDPI, REVI, and RSAVI, and found the R c 2 and R p 2 of the model constructed by RNDVI and RNDPI were better than those constructed by REVI and RSAVI, and reached a very significant level. R c 2 , R p 2 , R M S E p , and RPD of NDPI modeling all reached the highest values.
Similar to previous studies, the mean ADA in enclosed areas was less than that of semi-closed and open areas. The ADA intensity near the loop and at road junctions is higher because these areas are dominated by impervious surfaces with less vegetation or nearby train stations and subway stations. Based on spectral reflectance, Wang et al. studied the dust retention distribution of vegetation in urban areas from September to October [34]. Despite determining the spatial distribution of vegetation dust retention in the Beijing urban area, the dust retention during the inversion period was not validated, and the method used was insufficient to validate the rationality of the results. In this study, the NDPI inversion model was established by correlation analysis between spectral reflectance and ADA of vegetation leaves. The Sentinel-2 satellite remote-sensing data were used to obtain the distribution of the foliar dust of the evergreen vegetation (mainly from E. japonicus) in the Beijing urban area in winter. The PM10 concentration data were provided by the air monitoring stations set up by the Environmental Protection Department in the main urban area of Beijing and the temporary air monitoring stations of some universities, as well as the measured data of leaf dust detention. These data were used to verify the results of plant dust detention distribution obtained in this study. The results obtained in this study are closer to the true values.
In the past, most research on urban forest dust detention focused on the comparison of dust retention capacity of different types of woodlands or plant leaves, the mechanism of plant dust retention, dust composition analysis, and distribution law. The use of satellite remote-sensing images to monitor the distribution of dust in urban forest vegetation in winter is relatively rare, with few studies on the ecological effects of the spatial pattern of vegetation to improve the dust environment of cities. With the continuous increase in urbanization, a large amount of land was transformed into artificial buildings, such as roads and buildings. Urban forest areas are being continually squeezed, and the ability of urban forests to improve the environment was gradually reduced, which led to urban problems such as air pollution and the heat island effect. However, it is impractical to stop building and to dismantle these artificial buildings.
The research findings in this paper could provide some theoretical and scientific basis for urban managers and planners in urban construction and planning. In urban construction and planning, small woodlands should be protected and used. Yang, Bacci, and Train et al. all reported that small-scale forest land had little effect on improving the regional environment [9,36,37]. However, the results of this study indicate that small forests effectively improve the dust environment. For example, in this study, woodlands of E. japonicus larger than 1.69–2.92 ha could have dust retention effects on the surrounding environment; however, for woodland with areas less than 1.69 ha, its area is too small to improve the surrounding environment. We recommend building green spaces with more regular and compact shapes. When the vegetation coverage is fixed, woodlands of E. japonicus with a small shape index could have large dust retention ability. That is, relatively regularly shaped and compact woodland performs better in terms of dust retention strength than irregular, slender woodland in the process of improving the urban dust environment. We also found that, when the PLAND of E. japonicus was higher than 40%, the ADA intensity of E. japonicus woodland would be saturated. The urban forest area should be expanded as much as possible, and the ADA intensity of larger woodland patches can be stronger and more stable than that of smaller patches, which is the same as the conclusion reported by Freersmith et al. [20]. In addition to absorbing dust, woodland has other ecological benefits, such as maintaining biodiversity [38,39], purifying the air [40], and mitigating urban heat island effects [41,42].
The results of this study provide urban planners and natural resource managers with some theoretical and practical information on how urban forest vegetation should be planned and managed to better contradict the airborne particulate pollution. Previous studies found that the various ecological service functions of green areas are scale-dependent, and the dust retention benefits of green areas are also related to scale. However, this study is a preliminary study on dust retention benefits of evergreen vegetation in winter and only one plant was studied; the uncertainty of data caused by downscaling and upscaling remains to be studied. The effects of planting structure, composition, and spatial configuration of vegetation on the dust retention effect will be further researched to explore the best pattern of dust retention vegetation in highly urbanized areas, and the dust retention benefits of vegetation will be studied from multiple scales and different seasons.

5. Conclusions

Based on the leaf spectrum and ADA of Euonymus japonicus, the main evergreen vegetation in winter in Beijing, we transformed narrow-band spectral data collected on the ground into satellite broad-band data, established a dust inversion model, and used satellite images to determine the dust distribution of the evergreen vegetation in an urban area in winter. The relationship between the spatial pattern of Euonymus japonicus woodland and ADA intensity was studied through correlation analysis and a regression model. The results are as follows:
(1)
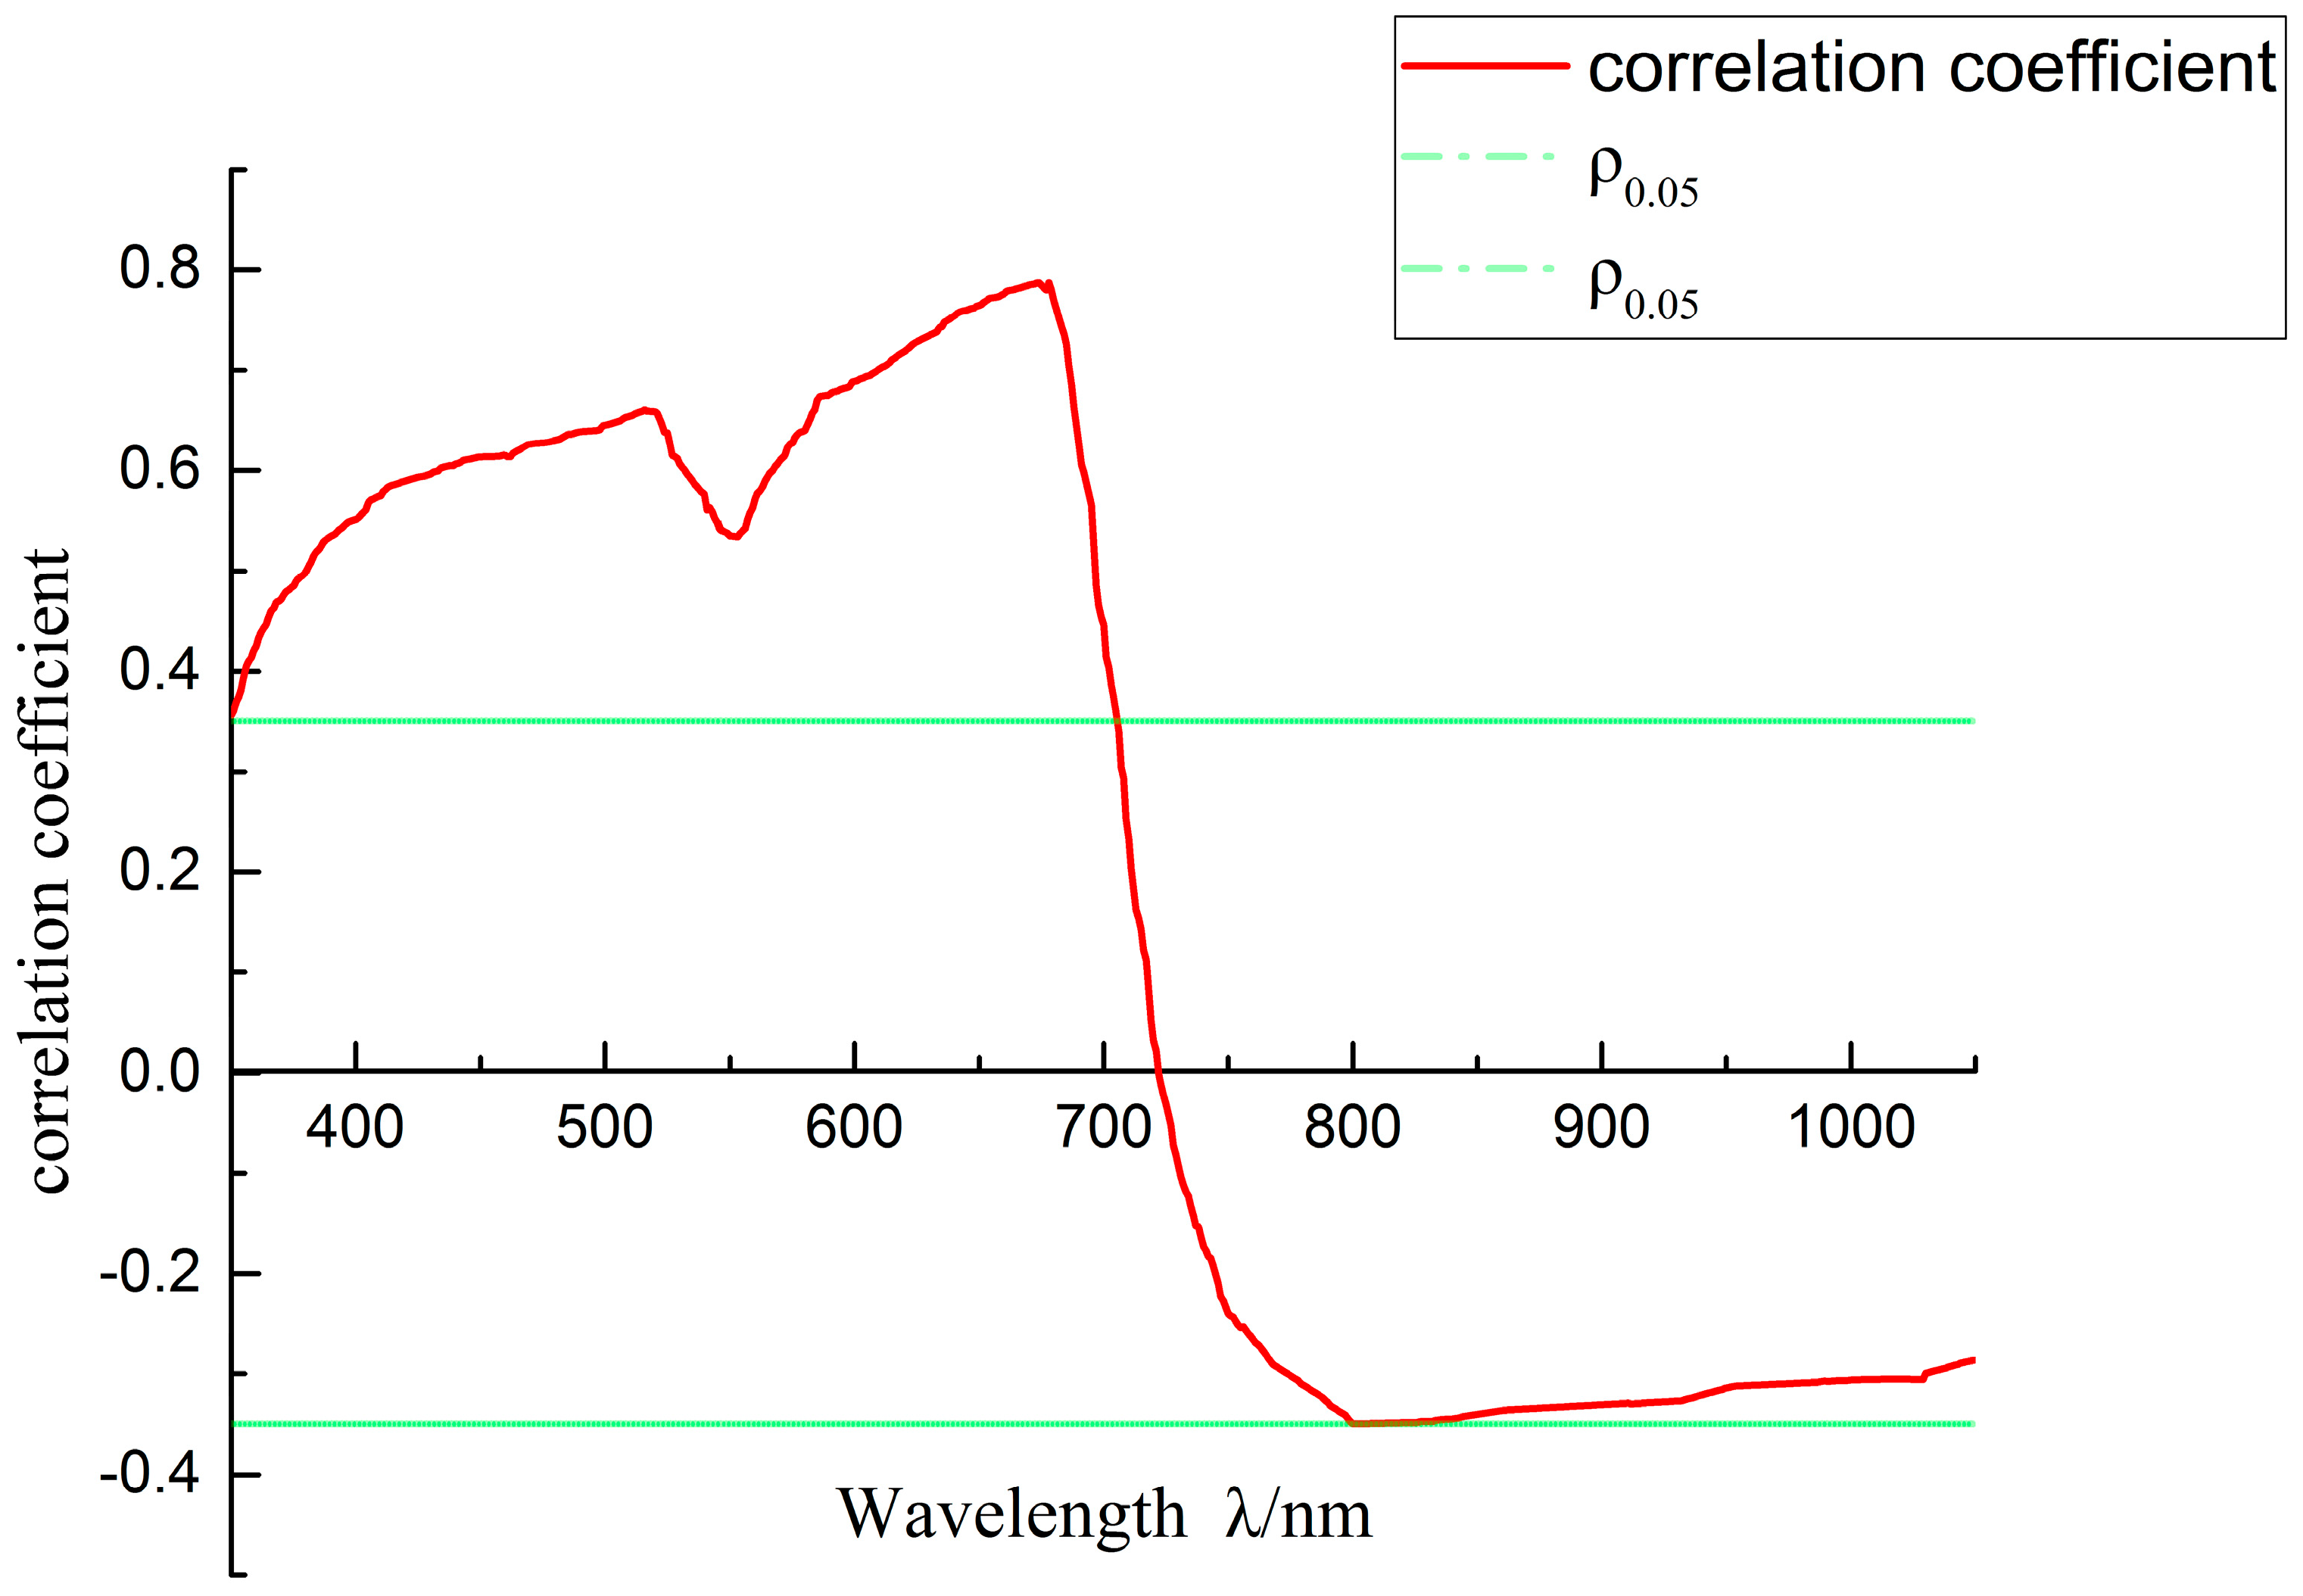
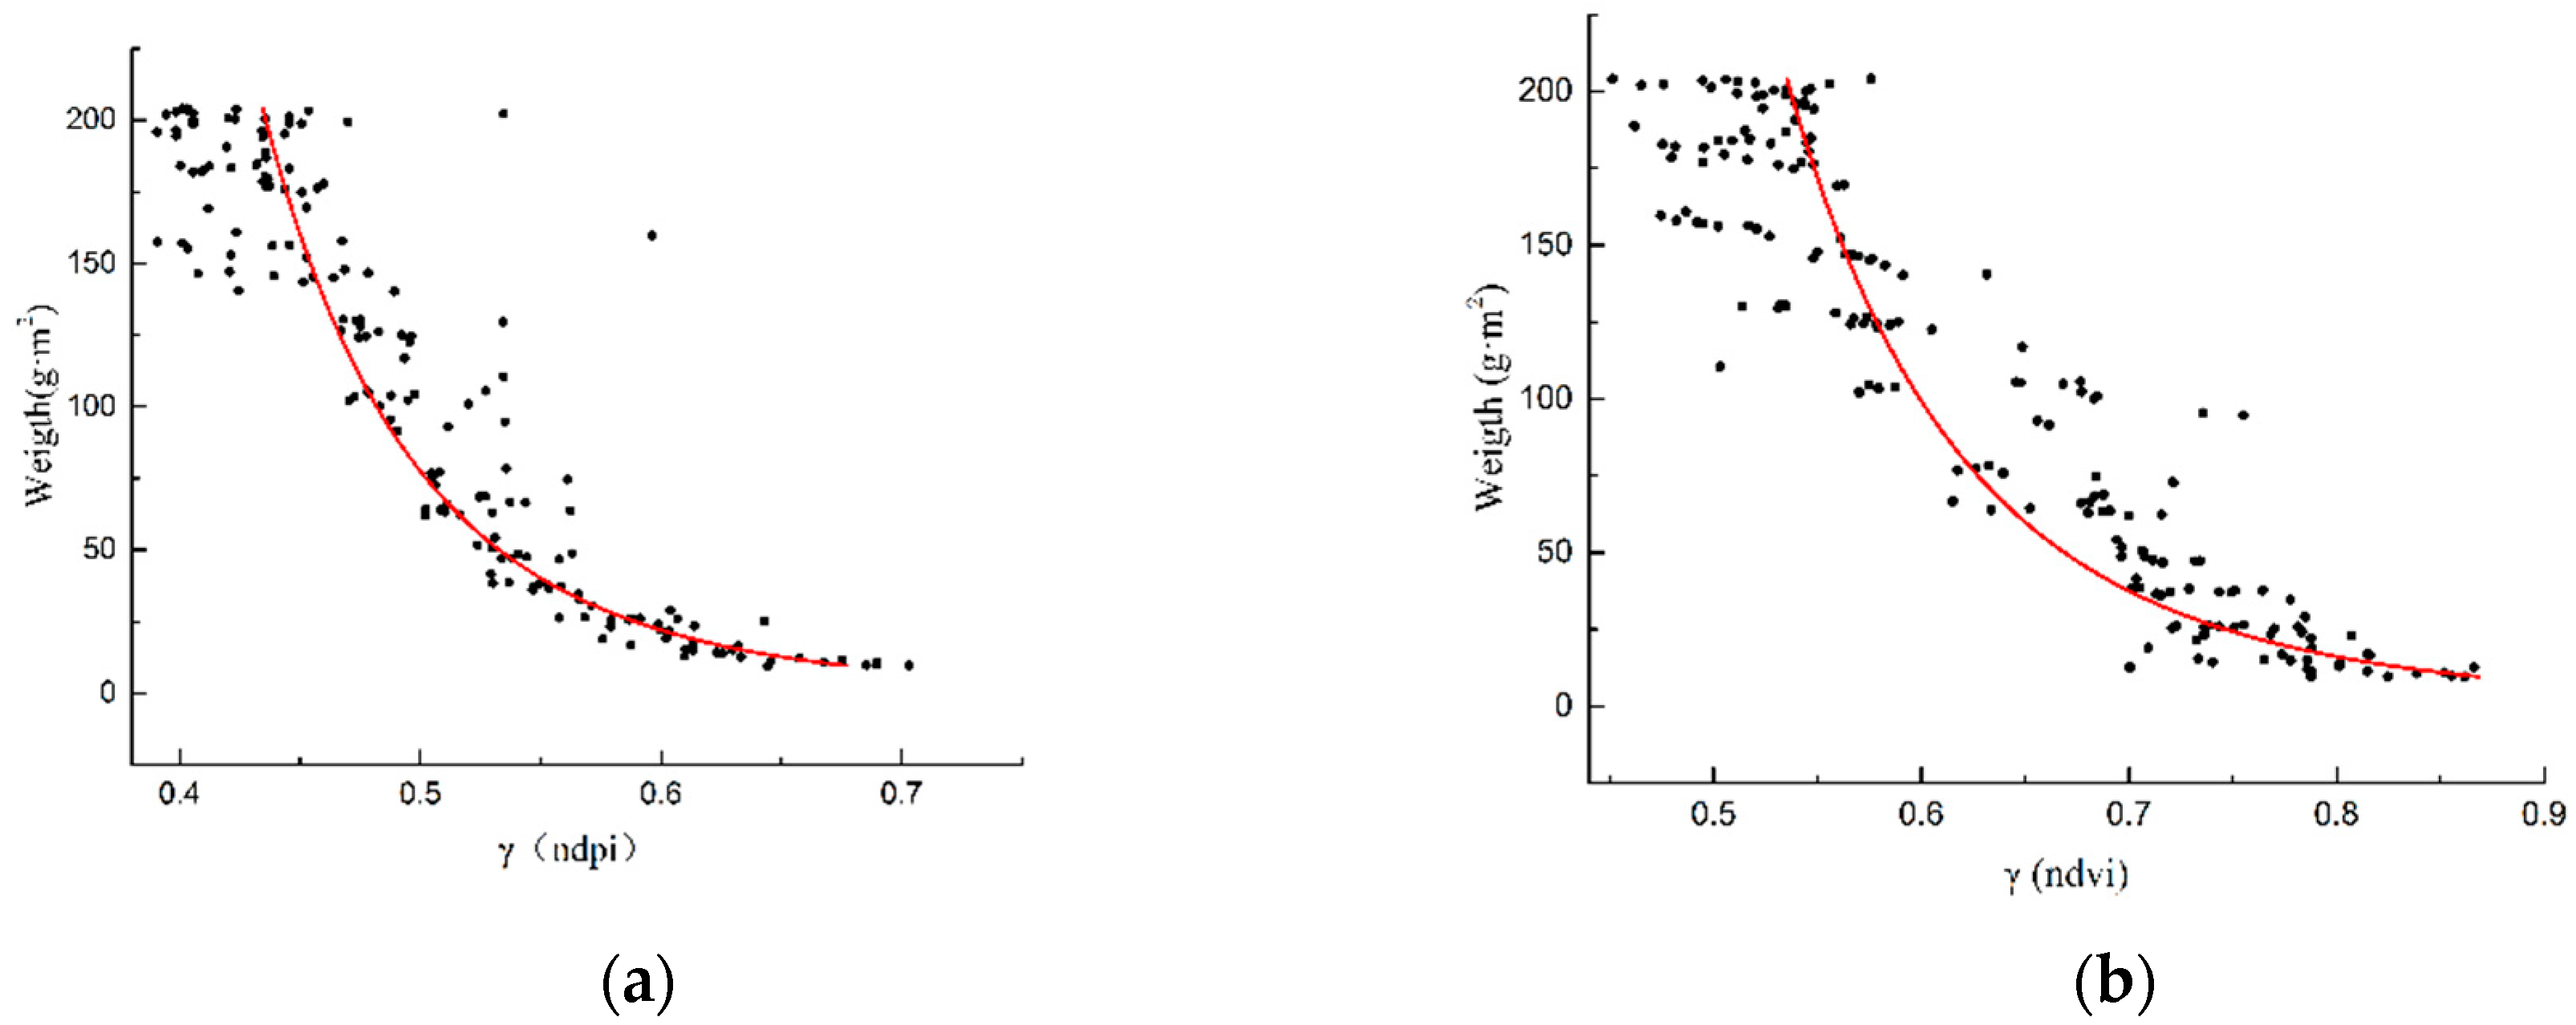
The results show a positive correlation between spectral reflectance and the amount of dust at 350–722 nm with a maximum correlation at 672 nm. The range in the green band from 510 to 580 nm is concave, which indicates that the sensitivity of the green band to dust is weaker than that of the other bands. A negative correlation was observed within 722–1050 nm, where the negative correlation from 722 to 801 nm decreases rapidly and the negative correlation reaches a minimum of −0.35 at 802 nm. Then, the negative correlation slowly changes from 801 to 1050 nm. Therefore, the red band and infrared band can be used to construct a dust inversion model. The decision coefficient R2 of the model constructed by NDPI reached a maximum of 0.879.
(2)
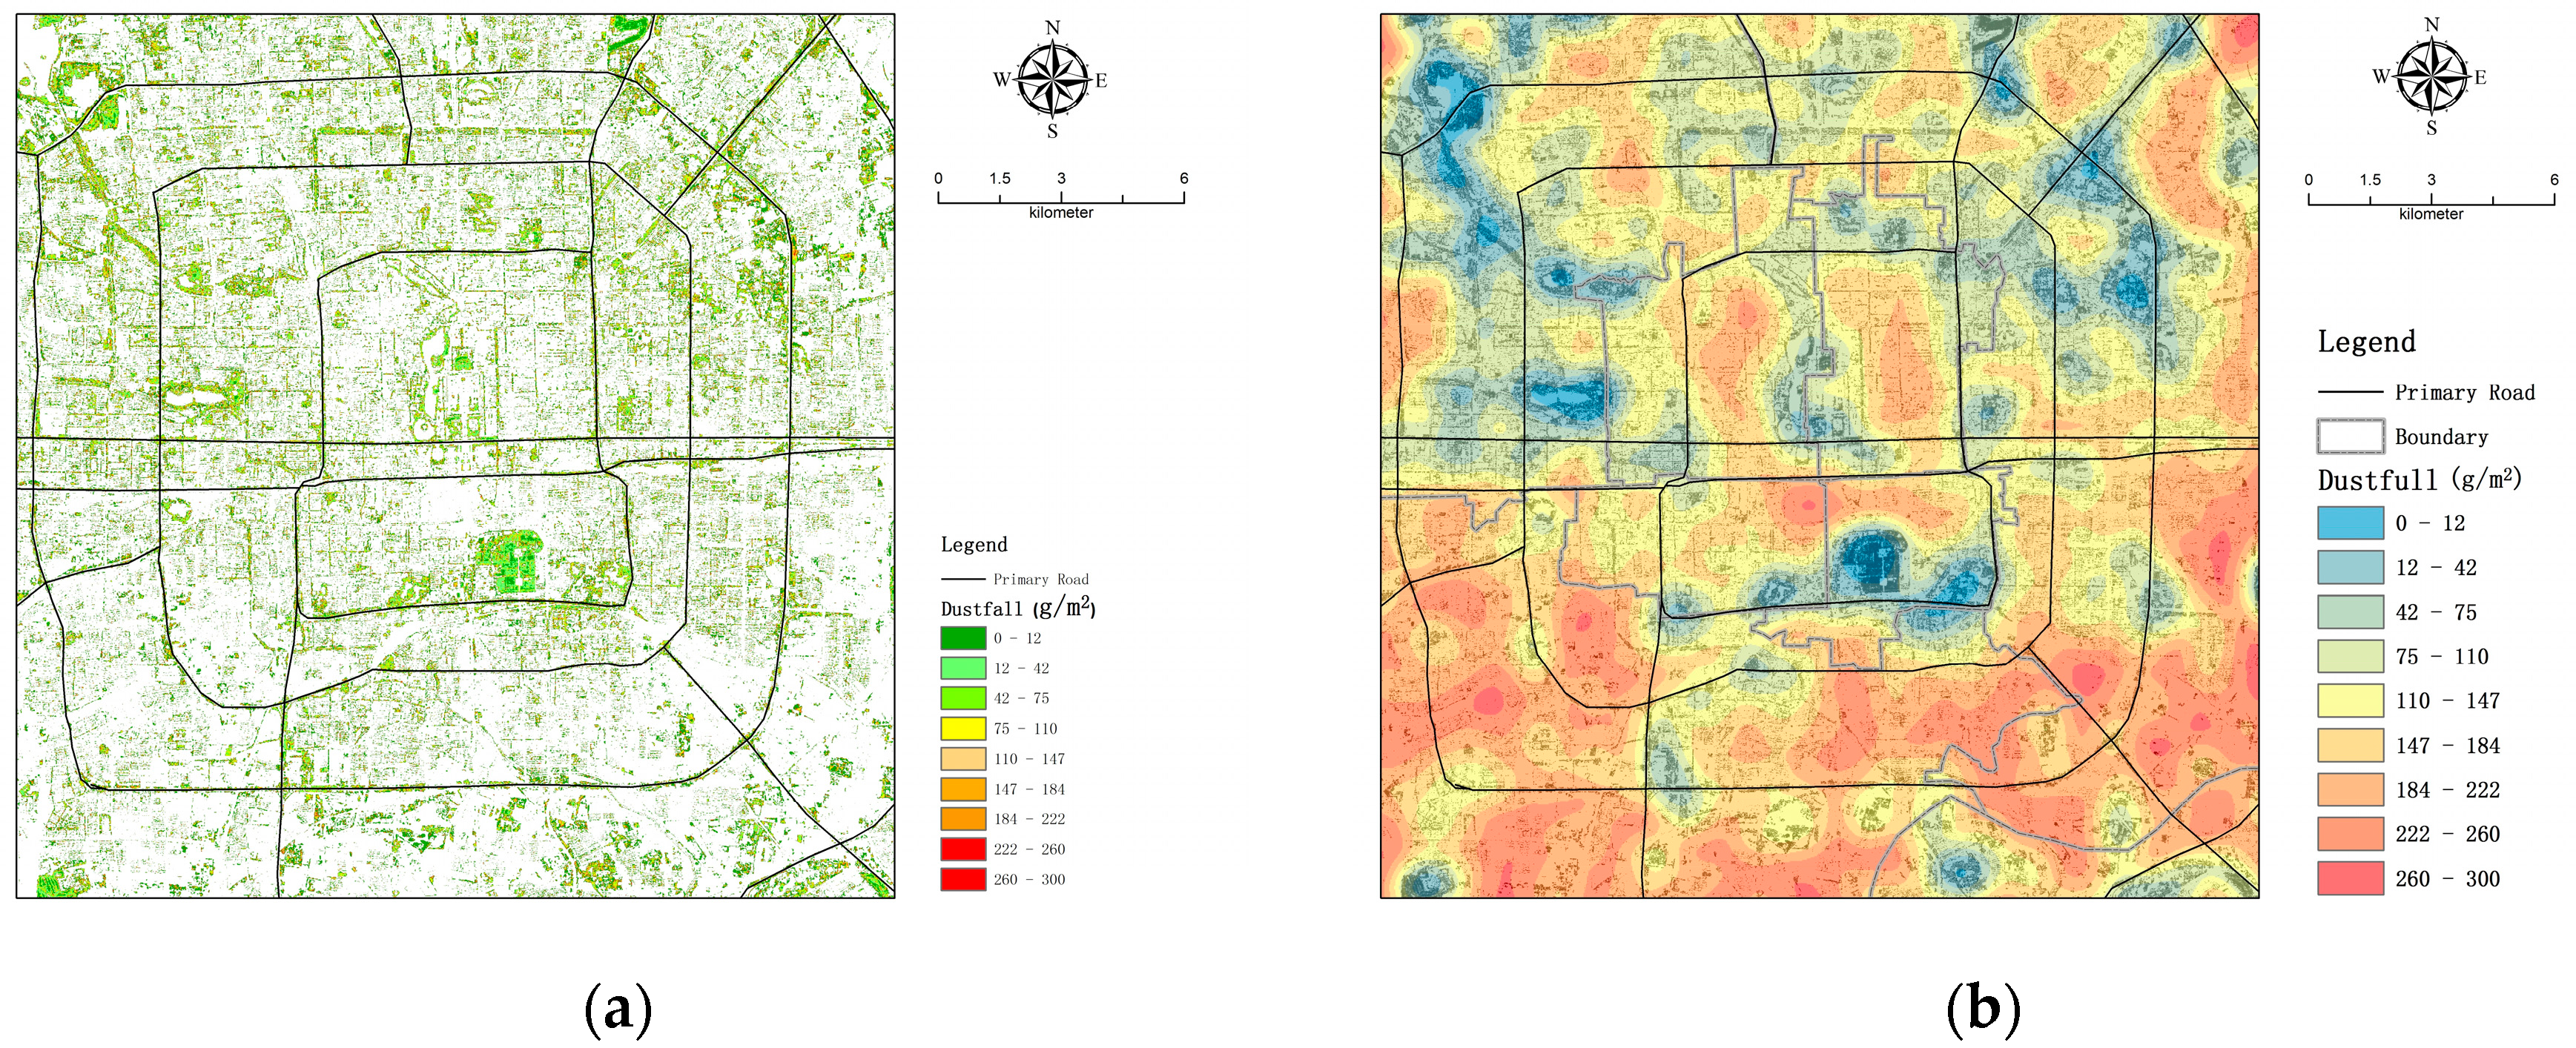
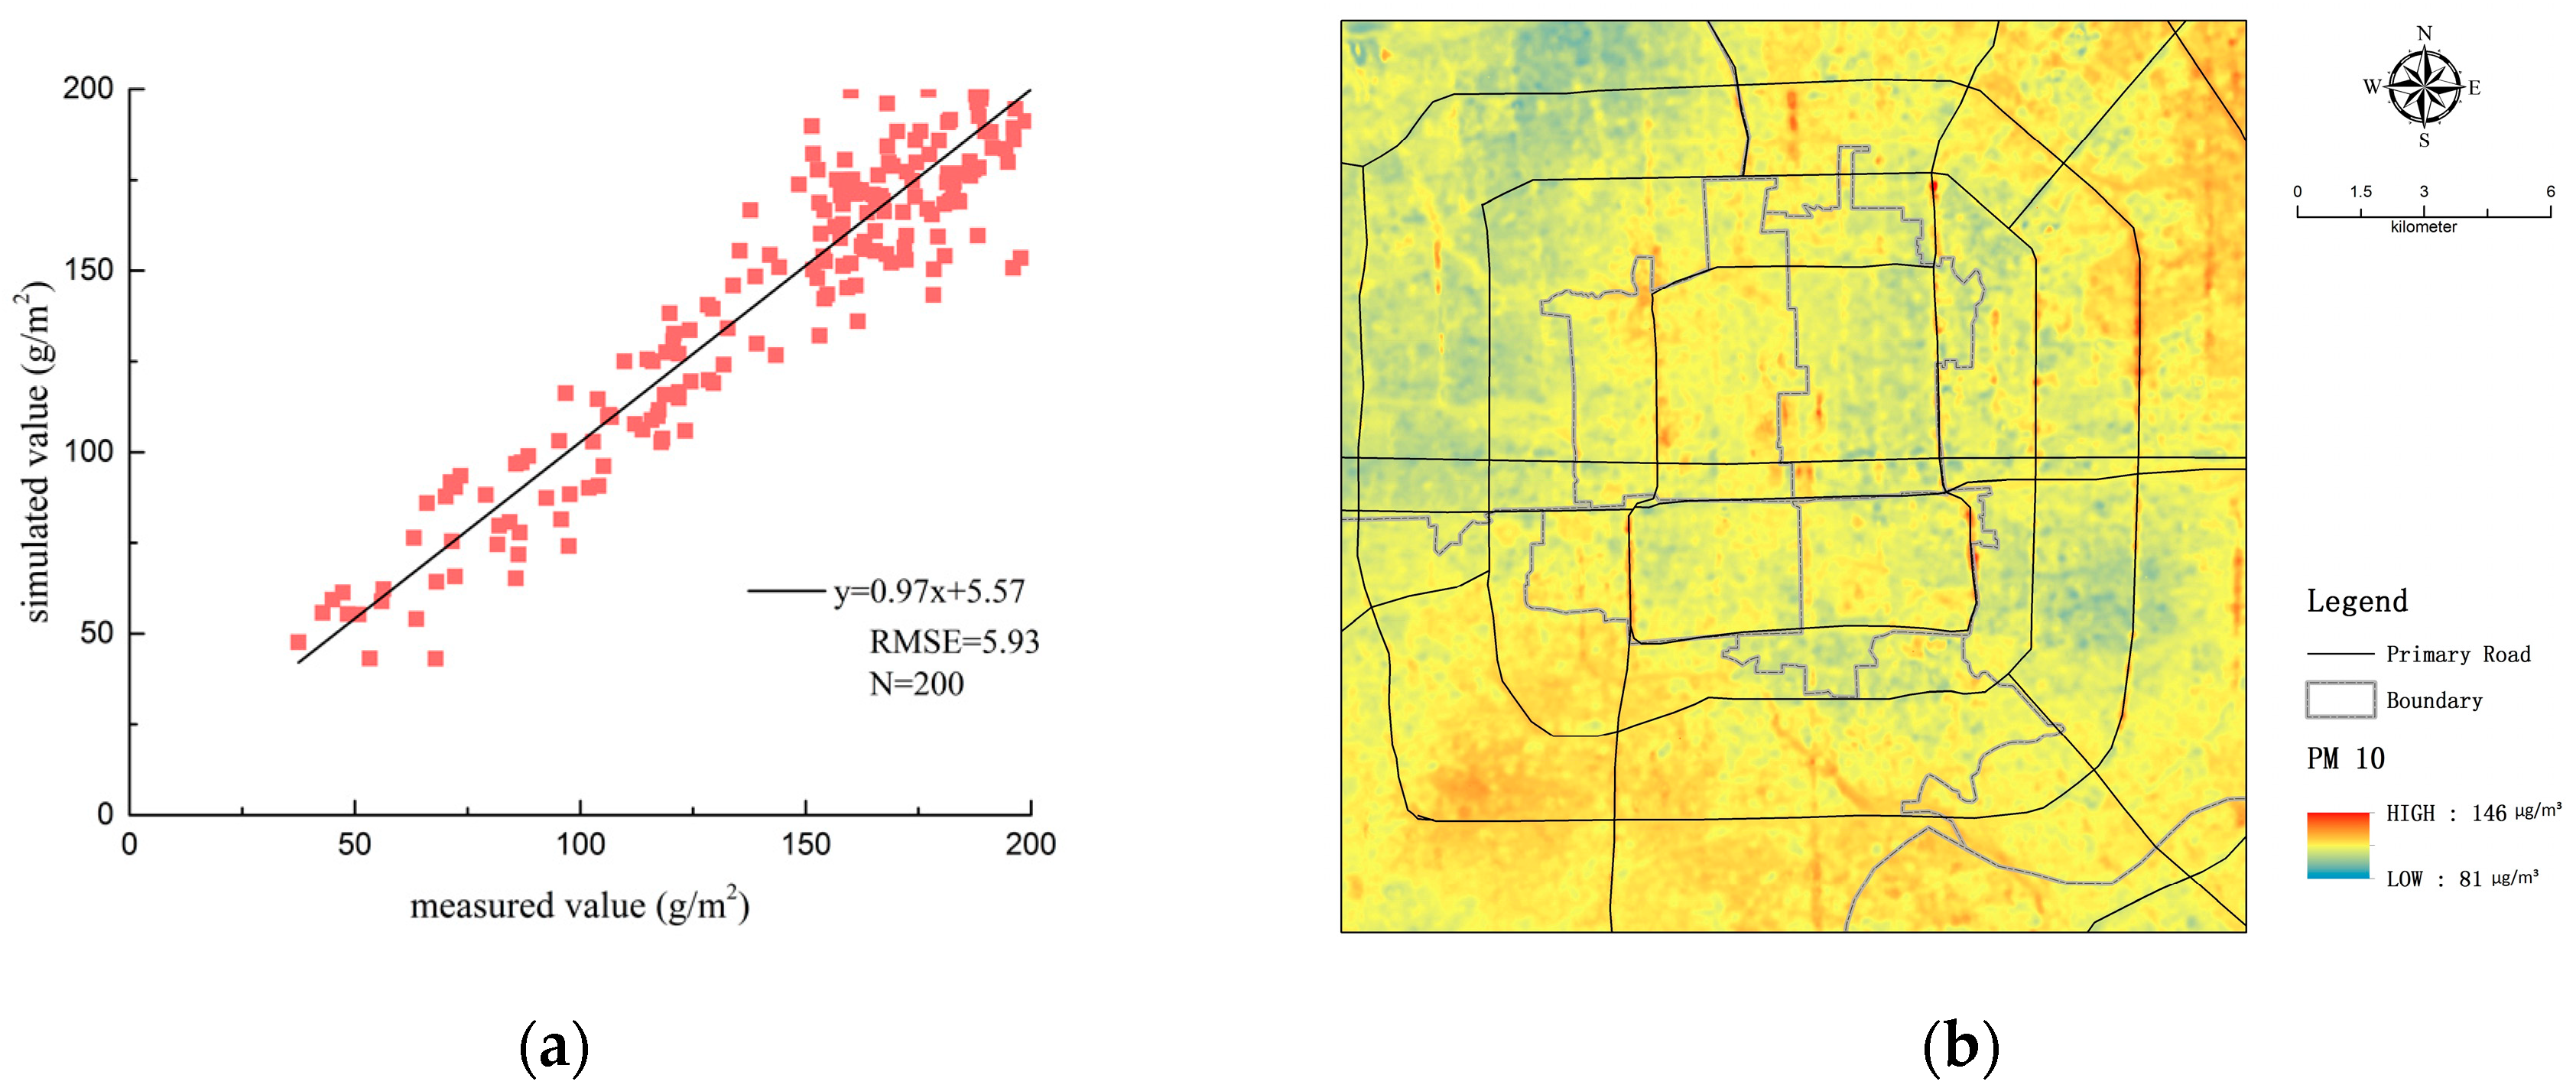
Using the Sentinel-2 satellite remote-sensing images on 22 November 2018 and 15 January 2019, we determined the distribution of dust on the leaves of the evergreen vegetation in Beijing in the winter (mainly from Euonymus Japonicus). The inversion results were verified by PM10 and measured data, and were proven to be reasonable. The results of the inversion show that the mean ADA in the enclosed area was lower than that in semi-closed and open areas. The regional distribution of high ADA in the urban area of Beijing was higher in the south, and ADA in the core area in the second ring of Beijing was less than in other loops with a tendency of the ADA to decrease from city center to the surrounding area.
(3)
Euonymus japonicus woodland has a positive effect on the urban dust environment. The size, LSI, and PLAND of patches of Euonymus japonicus significantly affect the ADA intensity. The dust retention ability is affected by the vegetation coverage rate, and generally, the higher the vegetation coverage rate is, the larger the ADA intensity is; however, this is not a linear positive correlation. Within the study area, when the PLAND of Euonymus japonicus woodland is higher than 40%, its ADA intensity remains basically unchanged. LSI affects the ADA intensity. LSI is negatively correlated with ADA intensity, and the reduction in the overall shape complexity of forestland can enhance the dust retention effect of the surrounding urban areas.

Author Contributions

K.S. designed the research, provided research method guidance and performed data analysis, collected field and indoor data, visualization, data curation, wrote the manuscript and revised the manuscript. Q.Y. provided part of the research fund, designed the research and provided research method guidance. Y.H. collected field and indoor data, data curation. Z.L. collected field and indoor data, data curation. P.W. collected field and indoor data, visualization. Q.Z. collected field and indoor data, visualization. J.Z. designed the research, provided laboratory support and the analysis method. T.N. collected field and indoor data. D.Y. provide the research fund and supervised the data analysis.

Funding

This work was supported by the National Natural Science Foundation of China (No. 20373014) and Study on Coupling and Regulating Rules between Landscape Patterns and Eco-Hydrological Processes in the Desert Oasis Ecotone, and the Fundamental Research Funds for the Central Universities (No. BLX201806): Study on Structural Characteristics and Crash Threshold of Complex Ecological Network in Desert Oasis Ecotone.

Acknowledgments

The authors thank the editors and anonymous reviewers for their helpful and constructive comments that greatly contributed to improving the quality of our paper.

Conflicts of Interest

The authors declare no conflicts of interest.

References

  1. Mage, D.; Ozolins, G.; Peterson, P.; Webster, A.; Orthofer, R.; Vandeweerd, V. Urban air pollution in megacities of the world. Atmos. Environ. 1996, 30, 681–686. [Google Scholar] [CrossRef]
  2. Shi, G.T.; Chen, Z.L.; Xu, S.Y.; Wang, L.; Zhang, J.; Li, H.W.; Li, L.N. Characteristics of heavy metal pollution in soil and dust of urban parks in Shanghai. Environ. Sci. 2007, 28, 238–242. [Google Scholar]
  3. Das, R.; Das, S.N.; Misra, V.N. Chemical composition of rainwater and dustfall at Bhubaneswar in the east coast of India. Atmos. Environ. 2005, 39, 5908–5916. [Google Scholar] [CrossRef]
  4. Levin, A. The non-medical misuse of fenfluramine by drug-dependent young South Africans. Postgrad. Med. J. 1975, 51, 186–188. [Google Scholar] [PubMed]
  5. Xia, T.; Kovochich, M.; Nel, A.E. Impairment of mitochondrial function by particulate matter (PM) and their toxic components: Implications for PM-induced cardiovascular and lung disease. Front. Biosci. J. Virtual Libr. 2007, 12, 1238. [Google Scholar] [CrossRef]
  6. Taniyama, Y.; Griendling, K.K. Reactive oxygen species in the vasculature: Molecular and cellular mechanisms. Hypertension 2003, 42, 1075–1081. [Google Scholar] [CrossRef] [PubMed]
  7. Platts-Mills, T.A.; Chapman, M.D. Dust mites: Immunology, allergic disease, and environmental control. J. Allergy Clin. Immunol. 1987, 80, 755–775. [Google Scholar] [CrossRef]
  8. Bates, D.V. Lines that connect: Assessing the causality inference in the case of particulate pollution. Environ. Health Perspect. 2000, 108, 91–92. [Google Scholar] [CrossRef] [PubMed]
  9. Yang, J.; Mcbride, J.; Zhou, J.; Sun, Z. The urban forest in Beijing and its role in air pollution reduction. Urban For. Urban Green. 2005, 3, 65–78. [Google Scholar] [CrossRef]
  10. Nowak, D.J.; Dwyer, J.F. Understanding the Benefits and Costs of Urban Forest Ecosystems. In Urban and Community Forestry in the Northeast; Kuser, J.E., Ed.; Springer: Berlin/Heidelberg, Germany, 2007; pp. 25–46. [Google Scholar]
  11. Sehmel, G.A. Particle and gas dry deposition: A review. Atmos. Environ. 1980, 14, 983–1011. [Google Scholar] [CrossRef]
  12. Kong, S.F.; Lu, B.; Ji, Y.; Bai, Z.; Xu, Y.; Liu, Y.; Jiang, H. Distribution and sources of polycyclic aromatic hydrocarbons in size-differentiated re-suspended dust on building surfaces in an oilfield city, China. Atmos. Environ. 2012, 55, 7–16. [Google Scholar] [CrossRef]
  13. Wang, X.L.; Wang, C. Research status and prospects on functions of urban forests in regulating the air particulate matter. Acta Ecol. Sin. 2014, 34, 1910–1921. [Google Scholar]
  14. Qiu, Y.; Guan, D.-S.; Song, W.-W.; Peart, M.R. The dust retention effect of urban vegetation in Huizhou, Guangdong Province. Acta Ecol. Sin. 2008, 28, 2455–2462. [Google Scholar]
  15. Tallis, M.; Taylor, G.; Sinnett, D.; Freer-Smith, P. Estimating the removal of atmospheric particulate pollution by the urban tree canopy of London, under current and future environments. Landsc. Urban Plan. 2011, 103, 129–138. [Google Scholar] [CrossRef]
  16. Prusty, B.A.K.; Mishra, P.C.; Azeez, P.A. Dust accumulation and leaf pigment content in vegetation near the national highway at Sambalpur, Orissa, India. Ecotoxicol. Environ. Saf. 2005, 60, 228–235. [Google Scholar] [CrossRef]
  17. Kim, H.S.; Chung, Y.S. Characteristics of mass concentrations depending on synoptic features during airborne dustfall episodes observed at Cheongwon in Korea in 2005. Asia-Pac. J. Atmos. Sci. 2010, 46, 209–216. [Google Scholar] [CrossRef]
  18. Zheng, J.G. Study on the Dust-Retention Capacity Resulting from Greenbelt of the Main Roads in Xuchang. Adv. Mater. Res. 2013, 726–731, 1805–1808. [Google Scholar] [CrossRef]
  19. Guo, W.; Shen, T.Y.; Zheng, S.; Wang, W.; Liu, C. Research advances on mechanisms and rules of dust retention of the urban green areas. Ecol. Environ. Sci. 2010, 19, 1465–1470. [Google Scholar]
  20. Freersmith, P.H.; Holloway, S.; Goodman, A. The uptake of particulates by an urban woodland: Site description and particulate composition. Environ. Pollut. 1997, 95, 27–35. [Google Scholar] [CrossRef]
  21. Shen, Z.X.; Cao, J.J.; Li, X.X.; Wang, Y.Q.; Jie, D.M.; Zhang, X.Y. Chemical characteristics of aerosol particles (PM 2.5) at a site of Horqin Sand-land in northeast China. J. Environ. Sci. 2006, 18, 701. [Google Scholar]
  22. Liu, L.; Guan, D.; Peart, M.R. The morphological structure of leaves and the dust-retaining capability of afforested plants in urban Guangzhou, South China. Environ. Sci. Pollut. Res. Int. 2012, 19, 3440–3449. [Google Scholar] [CrossRef] [PubMed]
  23. Li, J.Y.; Guo, L.S.; Duan, G.D. Patterns of green area in residential districts. J. Beijing For. Univ. 2002, 24, 102–106. [Google Scholar]
  24. Zhang, Q. Status and Prospects of Urban Landscape Plants’ Application in Beijing. Chin. Landsc. Architect. 2011, 1, 81–85. [Google Scholar]
  25. Zhao, Y.; Li, S.; Yan, Z. The Effect of Greenland on Absorbed Dust and Its Assessment Method. J. Huazhong Agric. Univ. 2002, 21, 582–586. [Google Scholar]
  26. Letts, M.G.; Phelan, C.A.; Johnson, D.R.; Rood, S.B. Seasonal photosynthetic gas exchange and leaf reflectance characteristics of male and female cottonwoods in a riparian woodland. Tree Physiol. 2008, 28, 1037–1048. [Google Scholar] [CrossRef] [PubMed] [Green Version]
  27. Evrendilek, F.; Gulbeyaz, O. Deriving Vegetation Dynamics of Natural Terrestrial Ecosystems from MODIS NDVI/EVI Data over Turkey. Sensors 2008, 8, 5270–5302. [Google Scholar] [CrossRef] [PubMed] [Green Version]
  28. Häusler, M.; Silva, J.M.N.; Cerasoli, S.; Lópezsaldaña, G.; Pereira, J.M.C. Modelling spectral reflectance of open cork oak woodland: A simulation analysis of the effects of vegetation structure and background. Int. J. Remote Sens. 2016, 37, 492–515. [Google Scholar] [CrossRef]
  29. Wang, C.; Chen, J.; Wu, J.; Tang, Y.; Shi, P.; Black, T.A.; Zhu, K. A snow-free vegetation index for improved monitoring of vegetation spring green-up date in deciduous ecosystems. Remote Sens. Environ. 2017, 196, 1–12. [Google Scholar] [CrossRef]
  30. Malthus, T.J.; Dekker, A.G. First derivative indices for the remote sensing of inland water quality using high spectral resolution reflectance. Environ. Int. 1995, 21, 221–232. [Google Scholar] [CrossRef]
  31. Ram, S.S.; Kumar, R.V.; Chaudhuri, P.; Chanda, S.; Santra, S.C.; Sudarshan, M.; Anindita, C. Physico-chemical characterization of street dust and re-suspended dust on plant canopies: An approach for finger printing the urban environment. Ecol. Indic. 2014, 36, 334–338. [Google Scholar] [CrossRef]
  32. Yan, X.; Shi, W.; Zhao, W.; Luo, N. Mapping dustfall distribution in urban areas using remote sensing and ground spectral data. Sci. Total Environ. 2015, 506–507, 604–612. [Google Scholar] [CrossRef]
  33. Luo, N.N.; Zhao, W.J.; Yan, X. Impact of Dust-Fall on Spectral Features of Plant Leaves. Spectrosc. Spectral Analysis. 2013, 33, 2715–2720. [Google Scholar]
  34. Wang, H.F.; Fang, N.; Yan, X.; Chen, F.T.; Xiong, Q.L.; Zhao, W.J. Retrieving dustfall distribution in Beijing City based on ground spectral data and remote sensing. Spectrosc. Spectr. Anal. 2016, 36, 2911–2918. [Google Scholar]
  35. Jie, P.; Xiang, H.Y.; Wang, J.Q.; Wen-Jun, J.I.; Liu, W.Y.; Chi, C.M.; Zuo, T.-G. Quantitative model of foliar dustfall content using hyperspectral remote sensing. J. Infrared Millim. Waves. 2013, 32, 313. [Google Scholar]
  36. Bacci, L.; Morabito, M.; Raschi, A.; Ugolini, F. Thermohygrometric conditions of some urban parks of Florence (Italy) and their effects on human well-being. Trees 2003, 6, 49. [Google Scholar]
  37. Tran, H.; Uchihama, D.; Ochi, S.; Yasuoka, Y. Assessment with satellite data of the urban heat island effects in Asian mega cities. Int. J. Appl. Earth Obs. Geoinf. 2006, 8, 34–48. [Google Scholar] [CrossRef]
  38. Pesola, L.; Cheng, X.; Sanesi, G.; Colangelo, G.; Elia, M.; Lafortezza, R. Linking above-ground biomass and biodiversity to stand development in urban forest areas: A case study in Northern Italy. Landsc. Urban Plan. 2017, 157, 90–97. [Google Scholar] [CrossRef]
  39. Alvey, A.A. Promoting and preserving biodiversity in the urban forest. Urban For. Urban Green. 2006, 5, 195–201. [Google Scholar] [CrossRef]
  40. Georgi, J.N.; Dimitriou, D. The contribution of urban green spaces to the improvement of environment in cities: Case study of Chania, Greece. Build. Environ. 2010, 45, 1401–1414. [Google Scholar] [CrossRef] [Green Version]
  41. Oliveira, S.; Andrade, H.; Vaz, T. The cooling effect of green spaces as a contribution to the mitigation of urban heat: A case study in Lisbon. Build. Environ. Pollut. 2011, 46, 2186–2194. [Google Scholar] [CrossRef]
  42. Mackey, C.W.; Lee, X.; Smith, R.B. Remotely sensing the cooling effects of city scale efforts to reduce urban heat island. Build. Environ. 2012, 49, 348–358. [Google Scholar] [CrossRef]
Figure 1. Location of (a) the study area and (b) sampling point distribution.
Forests 10 00418 g001
Figure 2. The main processes of this study.
Forests 10 00418 g002
Figure 3. (a) Main processes of indoor measurement, and (b) schematic diagram of spectral reflectance measurement.
Forests 10 00418 g003
Figure 4. Changes in leaf spectral curves before and after cleaning: (a) closed area, (b) semi-closed area, and (c) open area.
Forests 10 00418 g004
Figure 5. Spectral curves of leaves before and after cleaning by first derivative treatment: (a) closed area, (b) semi-closed area, and (c) open area.
Forests 10 00418 g005
Figure 6. The correlation between amount of dust and spectral reflectance ratio (dust and clean).
Forests 10 00418 g006
Figure 7. Inversion models based on (a) normalized difference phenology index (NDPI) and (b) normalized difference vegetation index (NDVI).
Forests 10 00418 g007
Figure 8. (a) Dust retention distribution of vegetation-covered areas in Beijing and (b) nuclear density analysis of dust retention distribution.
Forests 10 00418 g008
Figure 9. (a) Inversion precision with reference to measured data of foliar dust and (b) spatial distribution of particulate matter with diameter less than 10 μm (PM10).
Forests 10 00418 g009
Figure 10. Relationship between the percentage of landscape (PLAND) of woodland and amount of dust absorption (ADA) intensity (g/m2).
Forests 10 00418 g010
Figure 11. The amount of dust absorption (ADA) by patch area (PA) of woodland.
Forests 10 00418 g011
Figure 12. Relationship between ADA intensity and landscape shape index (LSI) of (a) PA = 3 ha, (b) PA = 7 ha, and (c) PA = 12 ha of woodland.
Forests 10 00418 g012
Table 1. Sentinel-2 satellites data band parameters.
BandNameBand Width (nm)Central Wavelength (nm)Resolution (m)
B01Coastal aerosol430–457443.960
B02Blue440–538496.610
B03Green537–58256010
B04Red646–684664.510
B05Vegetation red edge1694–713703.920
B06Vegetation red edge 2731–749740.220
B07Vegetation red edge 3769–797782.520
B08Near-infrared (NIR)769–908835.110
B08AVegetation red edge848–881864.820
B09Water vapor932–958945.060
B10Short-wave infrared (SWIR)-Cirrus1337–14121373.560
B11SWIR 11539–1682161020
B12SWIR 22078–2320129020
Table 2. Landscape metrics used to describe urban forest patterns.
Landscape MetricFormulaDescriptionUnit
Patch indexAThe area of the patchHectare
Landscape shape index E 2 π A The most straightforward measure of overall shape complexity-
Percentage of landscape j = i n a i j A ( 100 ) The proportion of total area occupied by a particular patch type; a measure of landscape composition and dominance of patch typesPercent
Table 3. Correlation between amount of dust absorption and vegetation indices. R c 2 —fitting precision; R p 2 —predicted precision; R M S E p —predicted root-mean-square error; RPD—ratio of sample standard deviation and R M S E p ; NDVI—normalized difference vegetation index; NDPI—normalized difference phenology index; EVI—environmental vegetation index; SAVI—soil-regulated vegetation index; R—ratio of vegetation index before and after cleaning.
Vegetation IndexClosed AreaSemi-closed AreaOpen Area
R c 2 R p 2 R M S E p RPD R c 2 R p 2 R M S E p RPD R c 2 R p 2 R M S E p RPD
RNDVI0.87 **0.66 **9.572.420.89 **0.67 **9.322.310.90 **0.70 **9.062.27
RNDPI0.92 **0.73 **6.462.200.93 **0.78 **6.132.110.93 **0.77 **5.892.18
REVI0.640.5012.461.310.670.5611.871.280.700.5611.451.25
RSAVI0.750.5311.581.360.770.5710.691.340.790.5810.331.29
Notes: ** correlation is significant at the 0.01 level (two-tailed); * correlation is significant at the 0.05 level (two-tailed).
Table 4. Foliar absorbed dust inversion model.
Independent VariableRetrieval ModelCoefficient of Determination (R2)
RNDVI x 1 = 1.24325 × y 0.15845 0.840
RNDPI x 2 = 0.93969 × y 0.14504 0.879
Note :   x 1 represents the ratio of NDVI, x 2 represents the ratio of NDPI, and y represents the amount of dust absorption (ADA) per unit area.

