Article

No Ontogenetic Shifts in C-, N- and P-Allocation for Two Distinct Tree Species along Elevational Gradients in the Swiss Alps

1
Key Laboratory of Tree Breeding and Cultivation of State Forestry Administration, Research Institute of Forestry, Chinese Academy of Forestry, Beijing 100091, China
2
Swiss Federal Research Institute WSL, CH-8903 Birmensdorf, Switzerland
3
Research Institute of Forest Ecology, Environment and Protection, Chinese Academy of Forestry, Beijing 100091, China
4
SwissForestLab, Zuercherstrasse 111, CH-8903 Birmensdorf, Switzerland
5
School of Geographical Sciences, Northeast Normal University, Changchun 130024, China
*
Author to whom correspondence should be addressed.
Forests 2019, 10(5), 394; https://doi.org/10.3390/f10050394
Submission received: 29 March 2019 / Revised: 19 April 2019 / Accepted: 3 May 2019 / Published: 5 May 2019
(This article belongs to the Special Issue Relationship between Forest Ecophysiology and Environment)

Abstract

:
Most of our knowledge about forest responses to global environmental changes is based on experiments with seedlings/saplings grown in artificially controlled conditions. We do not know whether this knowledge will allow us to upscale to larger and mature trees growing in situ. In the present study, we used elevation as a proxy of various environmental factors, to examine whether there are ontogenetic differences in carbon and nutrient allocation of two major treeline species (Pinus cembra L. and Larix decidua Mill.) along elevational gradients (i.e., environmental gradient) in the Swiss alpine treeline ecotone (~300 m interval). Young and adult trees grown at the same elevation had similar levels of non-structural carbohydrates (NSCs), total nitrogen (TN), and phosphorus (TP), except for August leaf sugars and August leaf TP in P. cembra at the treeline. We did not detect any interaction between tree age and elevation on tissue concentration of NSCs, TN, and TP across leaf, shoot, and root tissues for both species, indicating that saplings and mature trees did not differ in their carbon and nutrient responses to elevation (i.e., no ontogenetic differences). With respect to carbon and nutrient allocation strategies, our results show that young and adult trees of both deciduous and evergreen tree species respond similarly to environmental changes, suggesting that knowledge gained from controlled experiments with saplings can be upscaled to adult trees, at least if the light is not limited. This finding advances our understanding of plants’ adaptation strategies and has considerable implications for future model-developments.

1. Introduction

Anthropogenic drivers of global change have been increasingly evident during the last centuries, which include rising atmospheric concentrations of CO2 and other greenhouse gases and associated changes in the climate, nitrogen deposition, biotic invasions, and land-use change [1]. These environmental pressures greatly challenge performance and persistence of forest species around the world, which provide abundant products and services to support human society [2]. Therefore, understanding forest responses under global change is of fundamental and practical value for predicting the potential and limitations of forest productivity, and for defining mitigation and adaptation policies.
In the field, forest trees are often exposed to a myriad of single and combined stresses with varying strength and duration, the effects of which on plant performance are difficult to predict by solely manipulative experiments. For example, a meta-analysis covering 1634 plant species spanning four continents indicated that warming experiments (average experimental duration of 3.8 years) strongly underestimated advances in flowering and leafing, compared to long-term observations (average duration of 31.0 years) [3]. On the other hand, stress sensitivity, tolerance, and resistance of forest species vary with ontogenetic stage, making it challenging to analyze or identify the key environmental stressors driving plant performance throughout their life histories. Compared to adult trees, early life stages (e.g., seedlings or saplings) of trees are more sensitive to environmental variation or stress [4]. Numerous studies have reported wide ontogenetic variations in carbon assimilation and allocation [5,6], differing resource use strategies [7,8,9] and stress tolerances [4,10]. For example, Bansal and Germino [11] found that needles in transplanted saplings of two evergreen conifers, Abies lasiocarpa (Hook.) Nutt. and Pseudotsuga menziesii (Mirb.) Franco, had higher soluble sugar content than established adults at timberline in the Rocky Mountains during late seasons. Hence, to predict the responses of tree species to climate change, disentangling ontogenetic variations along synthesized environmental gradients is indispensable for a more profound understanding of differing adaptation and acclimation strategies between different life stages.
Among environmental gradients, increasing elevation is characterized by decreasing temperature interacting with other factors, such as soil water content, precipitation, season length, atmospheric pressure, and nutrient availability [12,13], and offer a natural laboratory to predict vegetation dynamics under climate change in recent decades [13,14,15,16]. To our knowledge, however, only a few studies have investigated the discrepancies between seedlings (saplings or juveniles) and adult trees along field environmental gradients, elevation transects, respectively. Among these are studies on A. lasiocarpa and P. menziesii [11], A. faxoniana Rehder & E.H.Wilson [17], and Picea crassifolia Kom. [18] and they generally found differing performances between seedlings and adults. Nevertheless, they are mostly restricted to the leaf level, while a whole-tree approach would be more appropriate to properly address the discrepancies between various life stages along environmental gradients. Furthermore, apart from ontogenetic differences for the same species, evergreen vs. deciduous tree species may vary in their response to environmental gradients in terms of carbon balance. So far, most studies have found higher non-structural carbohydrate concentrations (NSC) in deciduous compared to evergreen tree species [19,20,21]. However, whether this holds true when integrating ontogenetic variance is still unclear because different plant responses between life stages to climate warming have been found by other studies [22,23,24].
Pinus cembra L. (evergreen) and Larix decidua Mill. (deciduous) are two co-occurring treeline species growing in the Swiss Alps. In the present study, we aimed to answer the questions of whether the responses of carbon and nutrient allocation to environmental changes (i.e., using elevation as a proxy for changes in environmental factors) vary with ontogenetic stages of trees, and with leaf habits (evergreen vs. deciduous). We hypothesize that different life stages of both deciduous and evergreen trees lead differing carbon and nutrient allocation responses to elevational changes, because seedlings and saplings may be more sensitive to environmental changes than adult trees [4,25,26]. Our study could provide field data that reveal ontogenetic variation in response to environmental gradients and fill the gap where most predictions are restricted to manipulative experiments with young trees in early life stages.

2. Materials and Methods

2.1. Description of Sites and Species

Our study was conducted on Pinus cembra and Larix decidua, two native treeline species growing in the Swiss Alps. One transect was established within the alpine treeline ecotone in Chandolin, LaTzoumaz, Moosalp, and Sievz, respectively, in southern Switzerland (Figure 1, Table S1). In each transect, four sampling plots (n = 4) were designed at the alpine treeline (H) and the timberline (L) with ~300 m elevational difference between H and L, respectively (Table S1). The two species were selected because they have different leaf habits (evergreen vs. summergreen) and they co-exist in the Swiss alpine treeline ecotone. The four transects were selected for the present study because where every individual of both adult trees and saplings of the two species co-occurred is isolated, and thus no light effects on any individual sampled need to be considered. Each transect has a relatively homogeneous gentle slope (~30°) from the timberline to the alpine treeline, and hence, we can assume that the growth condition including temperature, water availability, and soil chemical and physical properties changes gradually with increasing elevation. This means that the present study uses elevation as a proxy for the whole of all growth-related factors, to study the ontogenetic responses of C-, N-, and P-allocation to combined environmental changes rather than to changes in any single factor.

2.2. Sampling Protocol

In each plot (mixed stand for the two targeted species), two age classes (saplings of <1.5 m in height, and adult trees of >5 m in height) per species were selected in the mid- and late-growing season (20 August and 17 October 2014) (Tables S1 and S2). Twice samplings accounted for seasonal transition which could bring variations in NSCs or nutrient status in tree species [25,27,28]; and the sampling dates selected were the time when the phenological difference among populations or individuals along elevational gradients is negligible [29,30,31]. For each age class, 3~5 isolated individuals with no signs of browsing or other damage were selected, with a minimum distance of 10 m from each other. The height (m) and diameter (cm) (10 cm aboveground diameter for saplings, and diameter at breast height for adults) of sampled individuals were carefully recorded. The individuals from the same age class from the same plot were mixed as one replicate and we had thus four replicates in total for each age class and each species.
From each targeted individual, we cut three or four upper and outermost sun-exposed branches. From these branches, current-year needles (~50 g) and shoots (~50 g) were collected. Fine roots (<5 mm in diameter, without bark) (~50 g) attached to coarse roots of each sample tree were manually excavated using a mini-spade and carefully collected. All samples were stored in a cool box for transportation after bagging and labeling. All samples were heated in a microwave oven at 600 W for 60 s to minimize the enzymic and physiological activity to reduce the respiration carbon loss of tissues [32,33] and then dried at 65 °C for 72 h and ground to pass a 0.15 mm sieve for further analyses.

2.3. Plant Analysis

2.3.1. Non-Structural Carbohydrates

The powdered material (~0.1 g) was put into a 10 ml centrifuge tube, where 5 mL of 80% ethanol was added. The mixture was incubated at 80 °C in a water bath shaker for 30 min, and then centrifuged at 4000 rpm for 5 min. The pellets were extracted two more times with 80% ethanol. Supernatants were retained, combined and stored at −20 °C for soluble sugar determinations. The ethanol-insoluble pellets were used for starch extraction. Glucose was used as a standard. Soluble sugars were determined using the anthrone method [34]. The starch concentration was measured spectrophotometrically at 620 nm using anthrone reagent and was calculated by multiplying glucose concentrations by the conversion factor of 0.9 [35]. The concentration of sugars and starch was described on a dry matter basis (% DW), and NSC was the sum of total soluble sugar and starch, and NSCs include NSC, soluble sugars, and starch.

2.3.2. Nitrogen and Phosphorus Concentrations

For the determination of tissue nitrogen (N) and phosphorus (P) concentrations (mg g−1 DW), finely ground material (~50 mg) was first digested with H2SO4 and H2O2 for further analysis. The nitrogen concentration was then measured applying the Kjeldahl method (Kjeltec 2200, FOSS, Hoganas, Sweden), while the phosphorus concentration was determined with the molybdenum blue spectrophotometric procedure (6505 UV spectrophotometer, Essex, UK) [36].

2.3.3. Carbon and Nitrogen Isotopic Abundance

The abundance of stable carbon (δ13C) and nitrogen (δ15N) isotopes in current needles was determined as described by Gebauer and Schulze [37]. To avoid tissue age-effects on δ13C and δ15N, we analyzed them in the current-year needles only. Aliquots (1.2~1.5 mg) of ground material were weighed into tin capsules, and then analyzed in an elemental analyzer (Euro EA; Hekatech GmbH, Wegberg, Germany) coupled inline with an isotope ratio mass spectrometer (DELTA V Advantage; Thermo Scientific, Bremen, Germany). The carbon and nitrogen isotopic abundance is expressed as δ13C and δ15N, respectively, and was calculated as follows: δ ‰ = [(Rsample/Rstandard) − 1) × 1000], where R is the 13C/12C or the 15N/14N ratio of the sample and the correspondent standard, i.e., Vienna Pee Dee Belemnite for C and atmospheric N2 for N. The overall precision of the delta values was 0.1‰, as determined by repetitive measurements of standard material.

2.4. Statistical Analyses

All statistical analyses were conducted using R statistical software (RStudio 1.1.463 with R version 3.5.2). Shapiro–Wilk and Bartlett’s tests were first used to test for normality and homogeneity of variances respectively, and all variables met the assumption for further variance analysis. We applied linear mixed-effects models (R package nlme) with species (P. cembra and L. decidua), tree age (sapling and adult tree), altitude (timberline and treeline), and season (mid-growing season: August; late-season: October) as fixed effects and transects as a random effect to account for variances between transects. The Wilcoxon tests for means were further conducted to analysis differences between fixed factors (age and altitude) with the ggpubr package. Since we focused on ontogenetic- or species-variations, or both, of the detected variables along altitudinal gradients, the effects of season transition were not presented in the following part.

3. Results

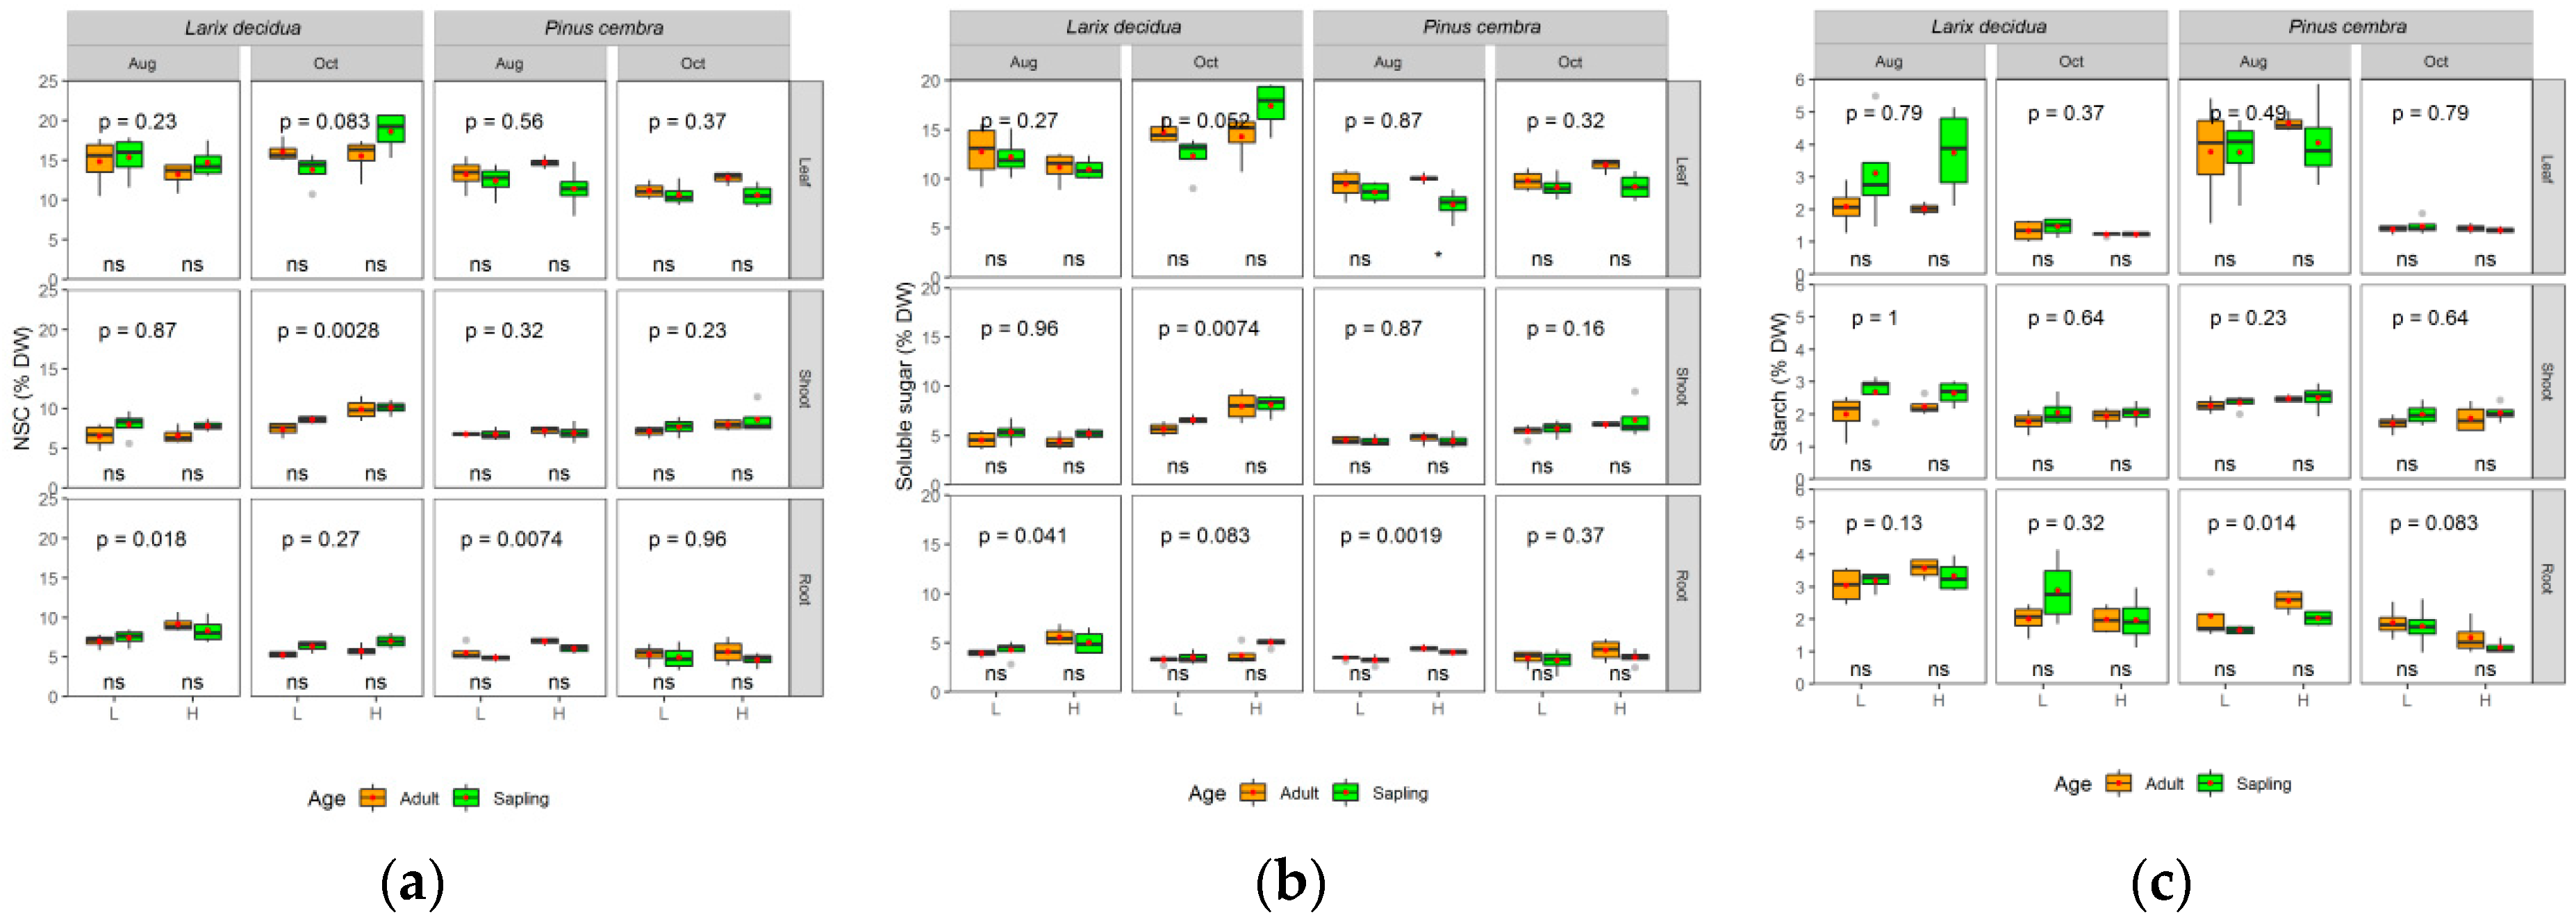
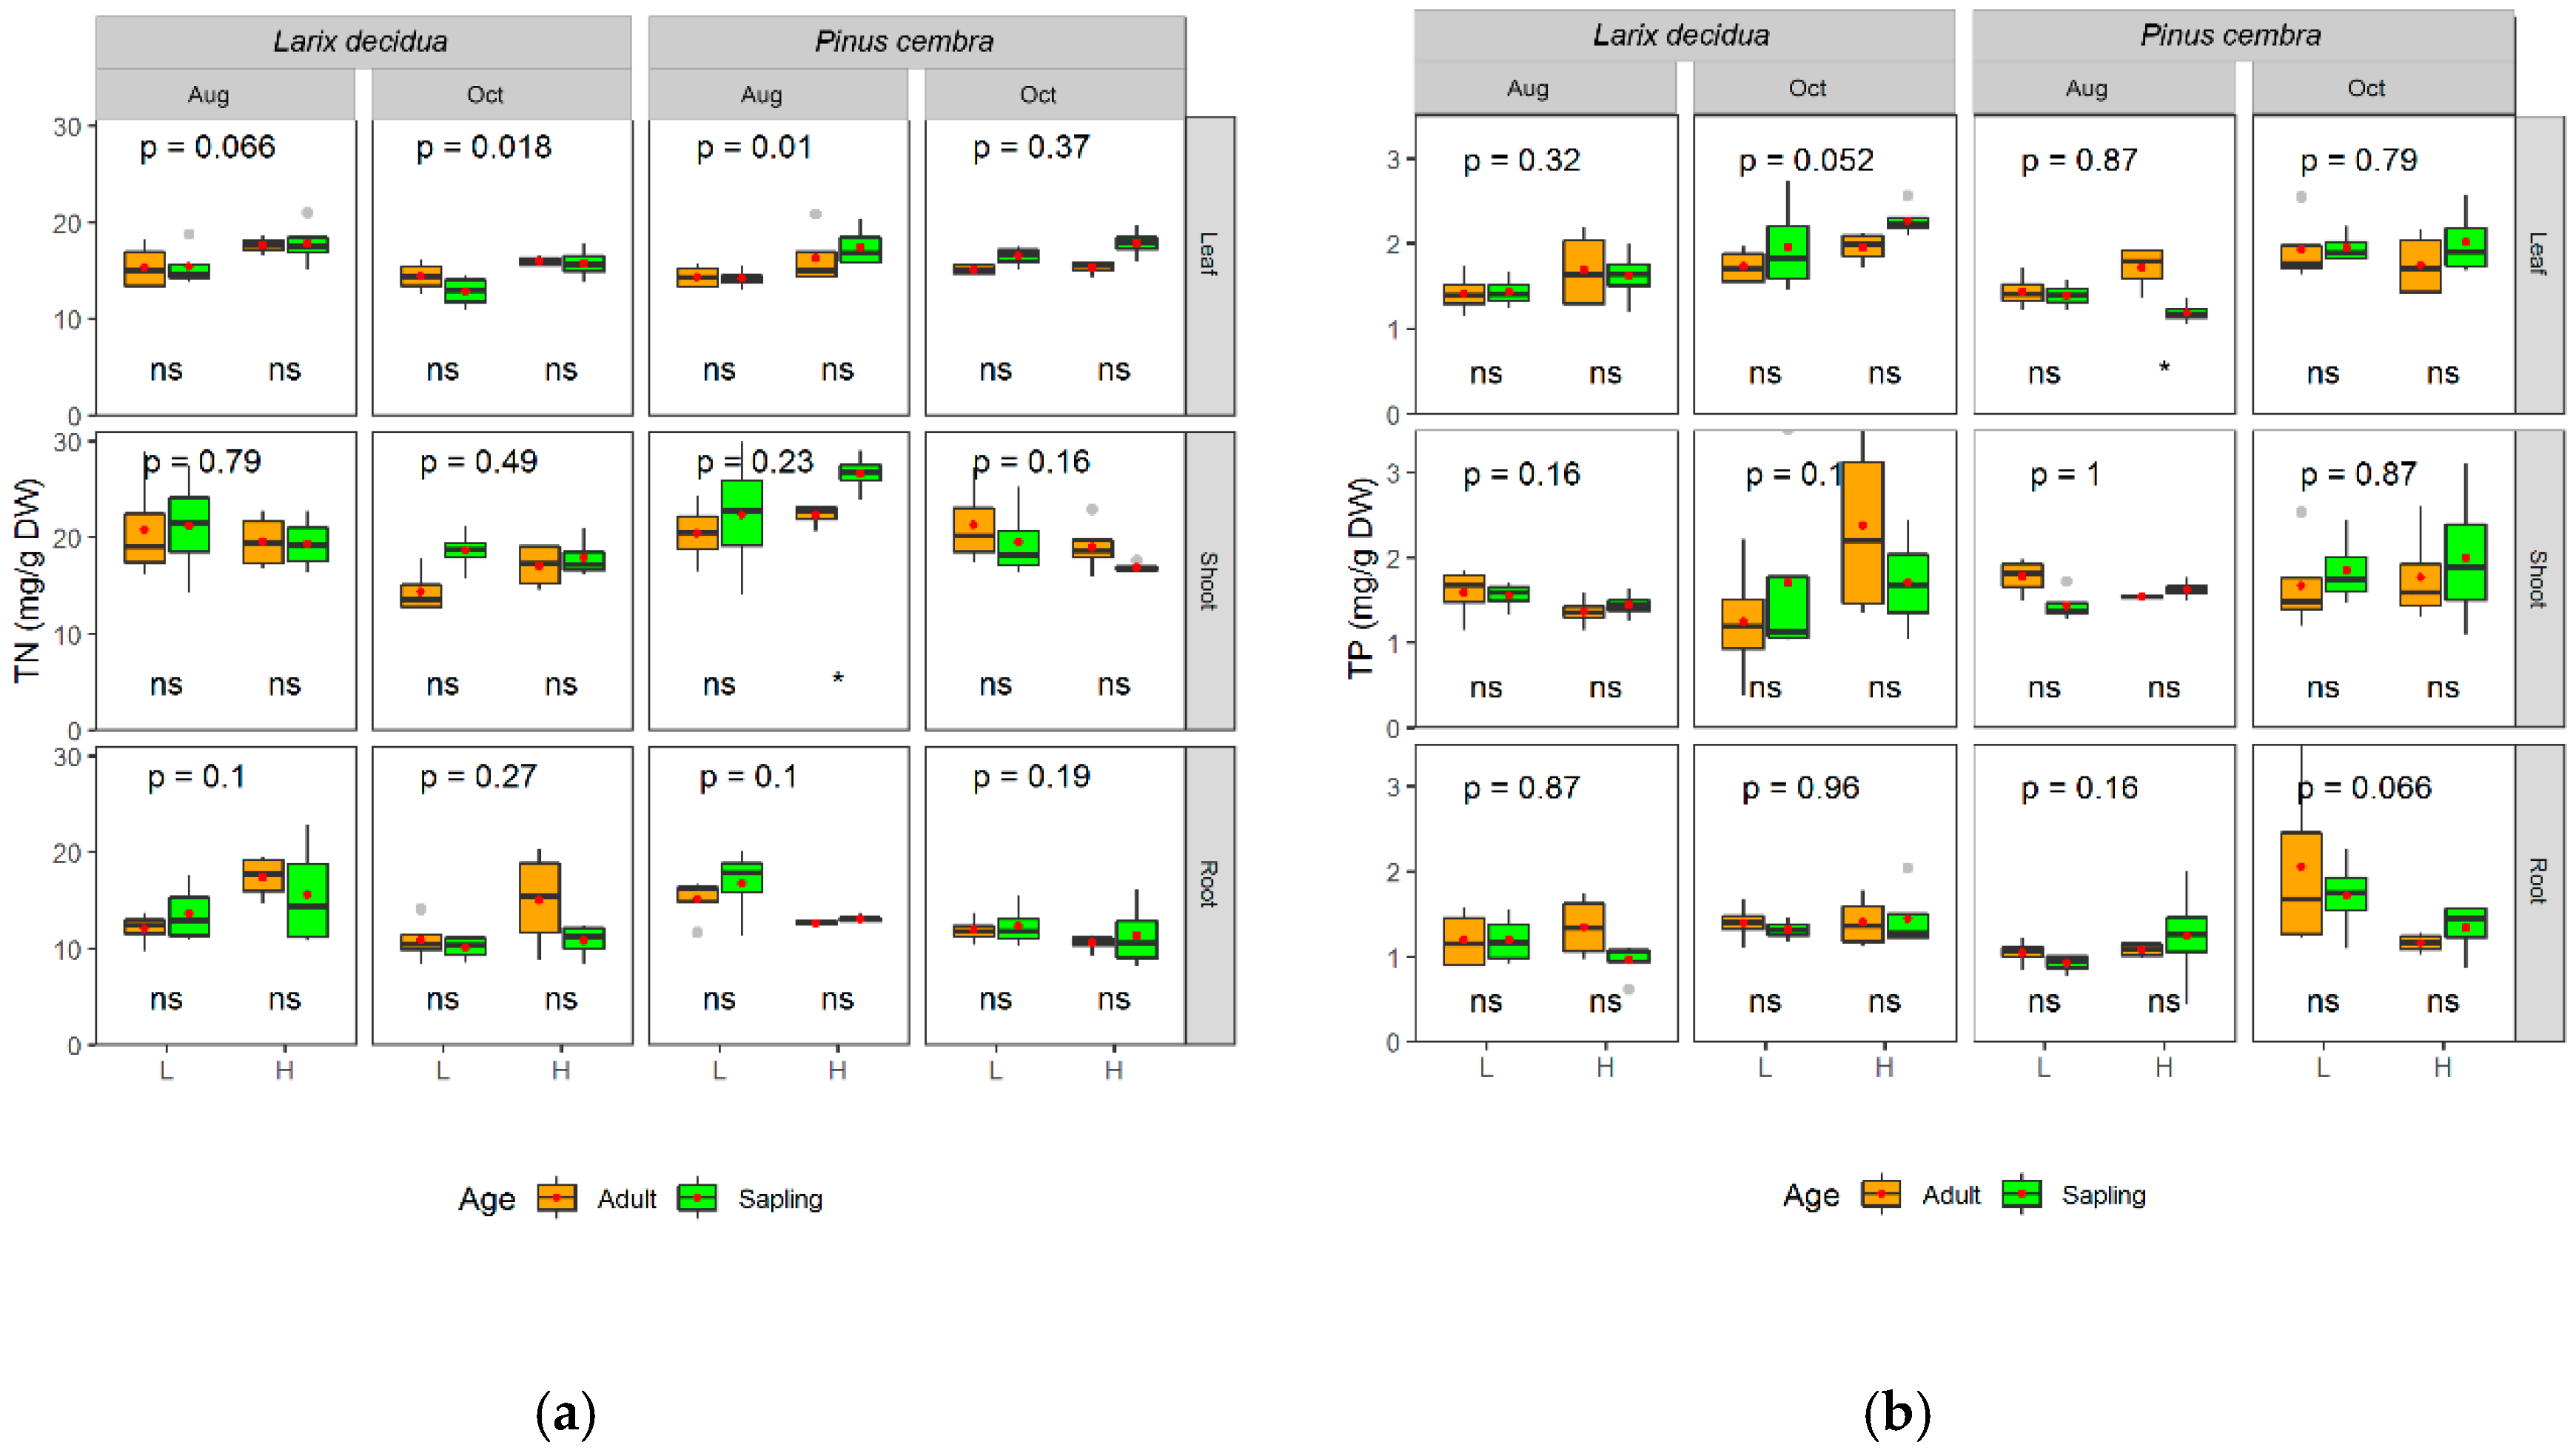
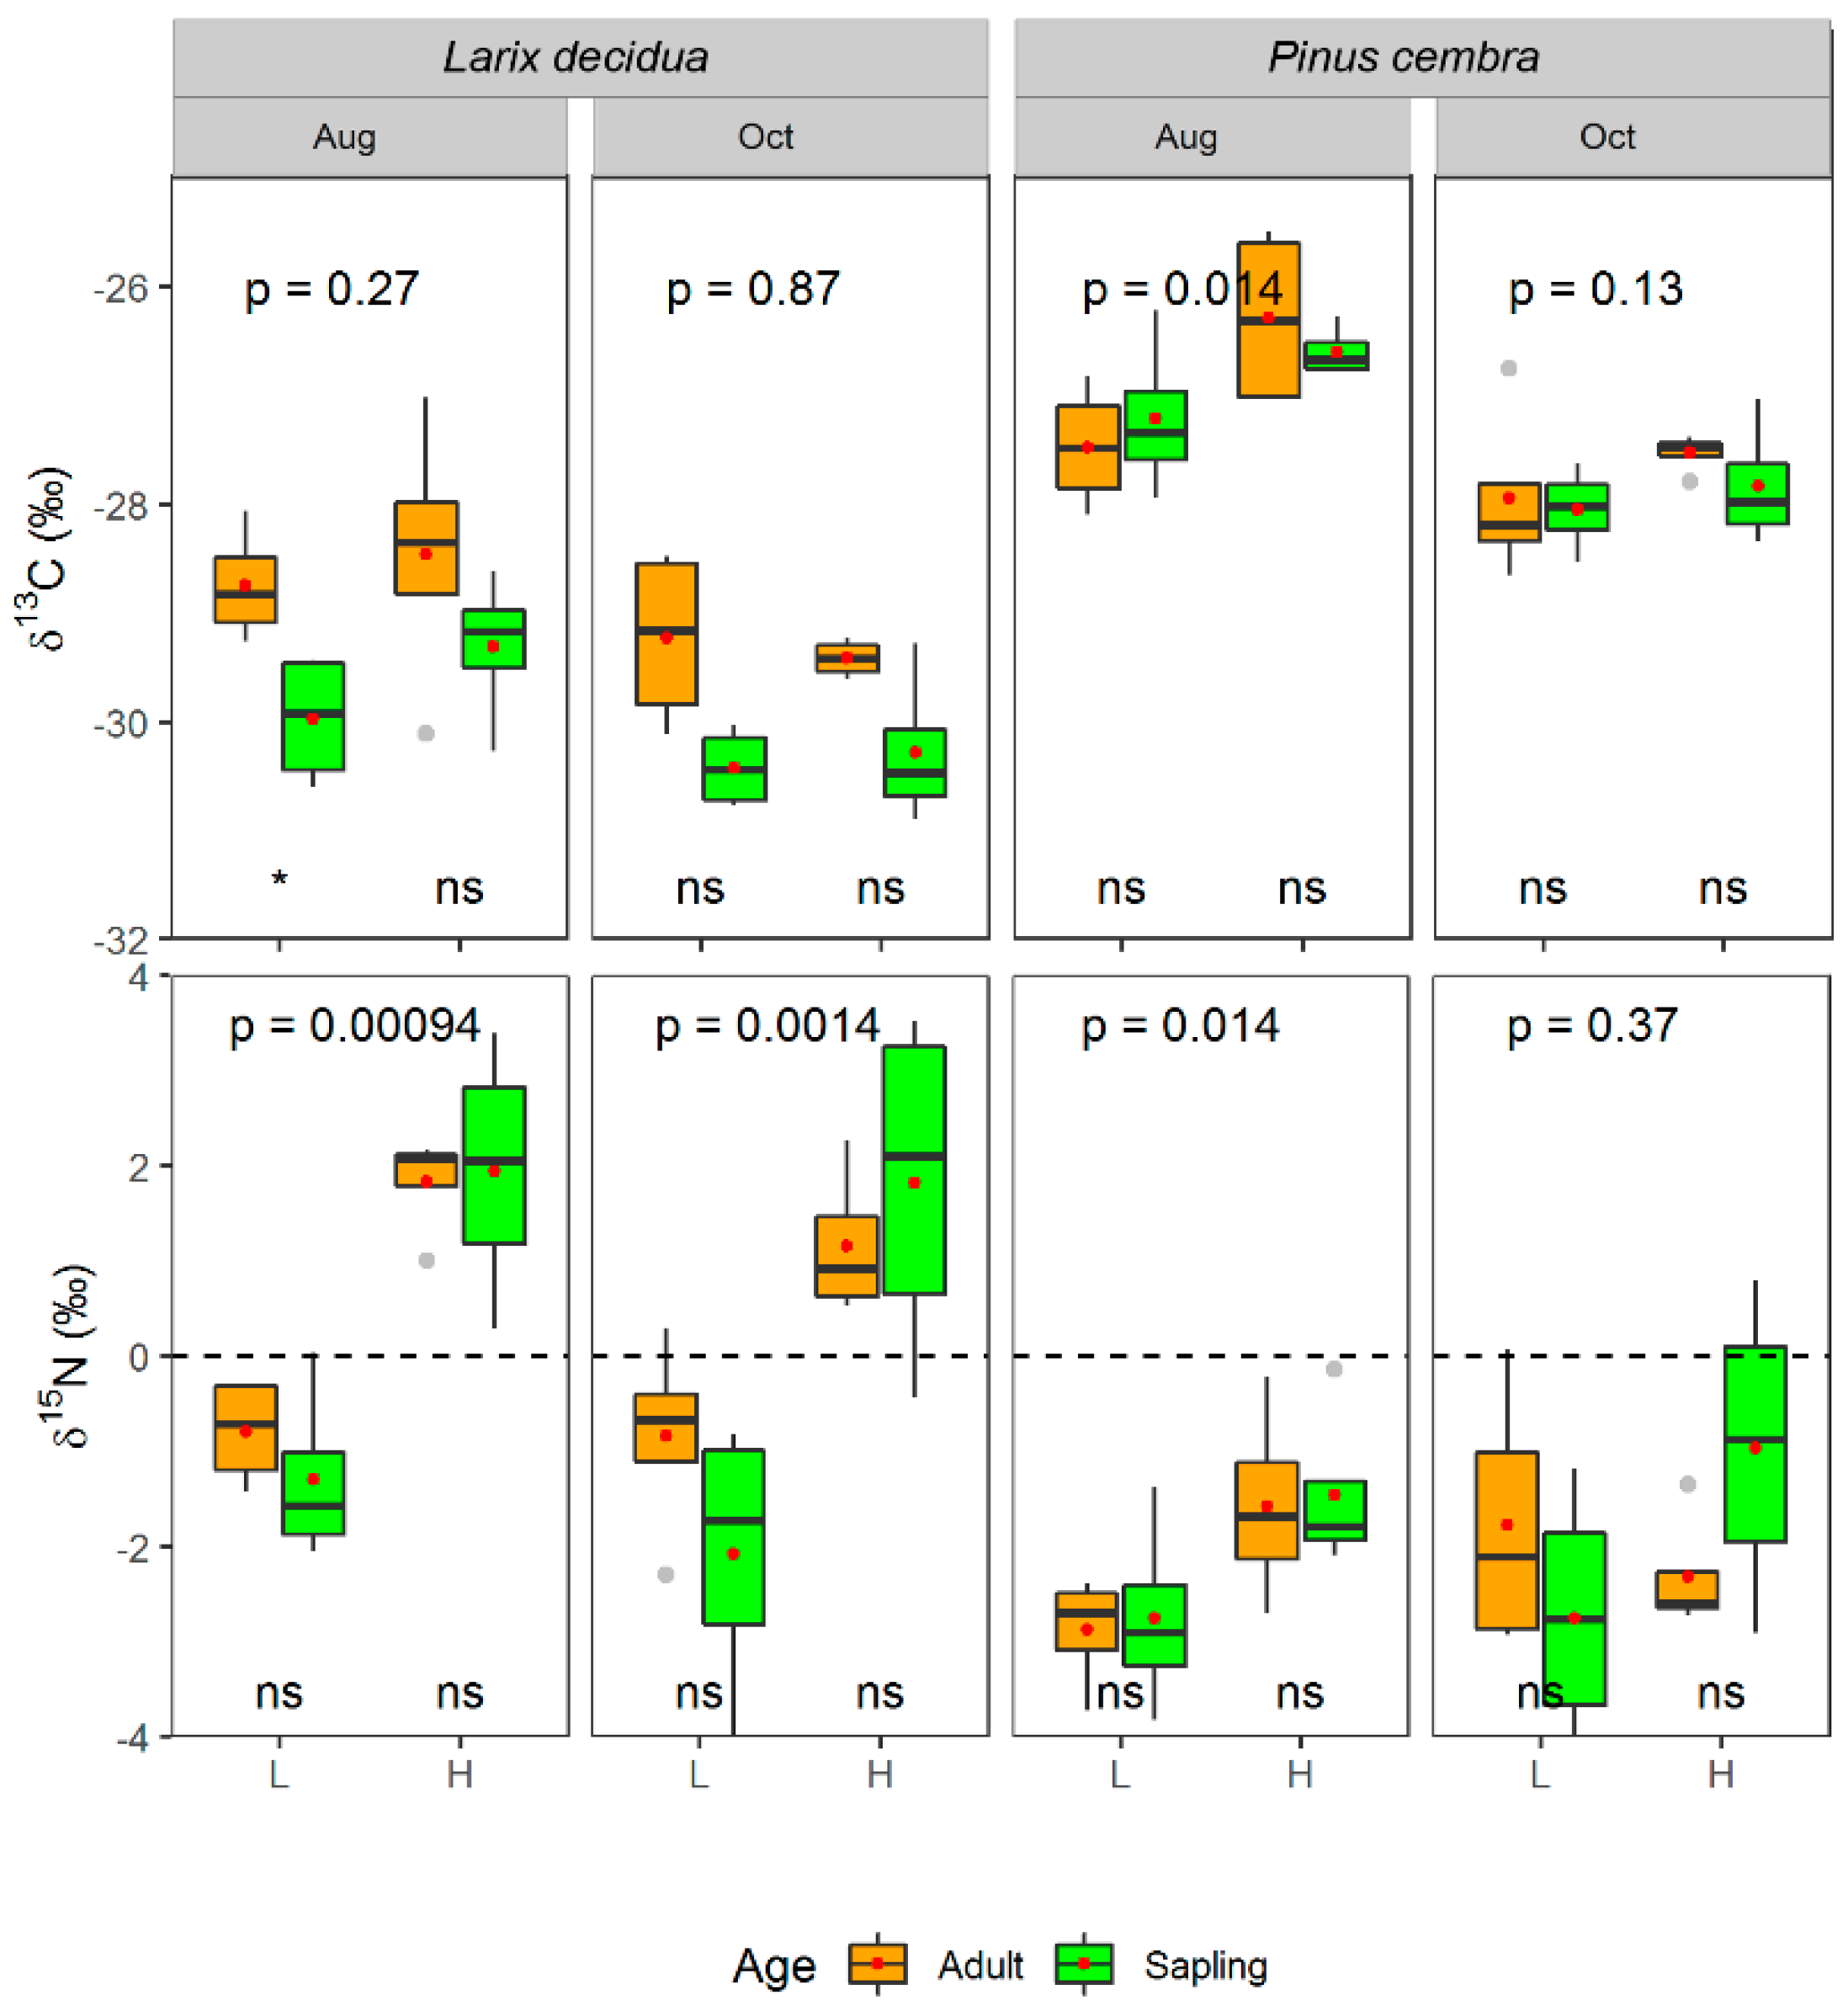
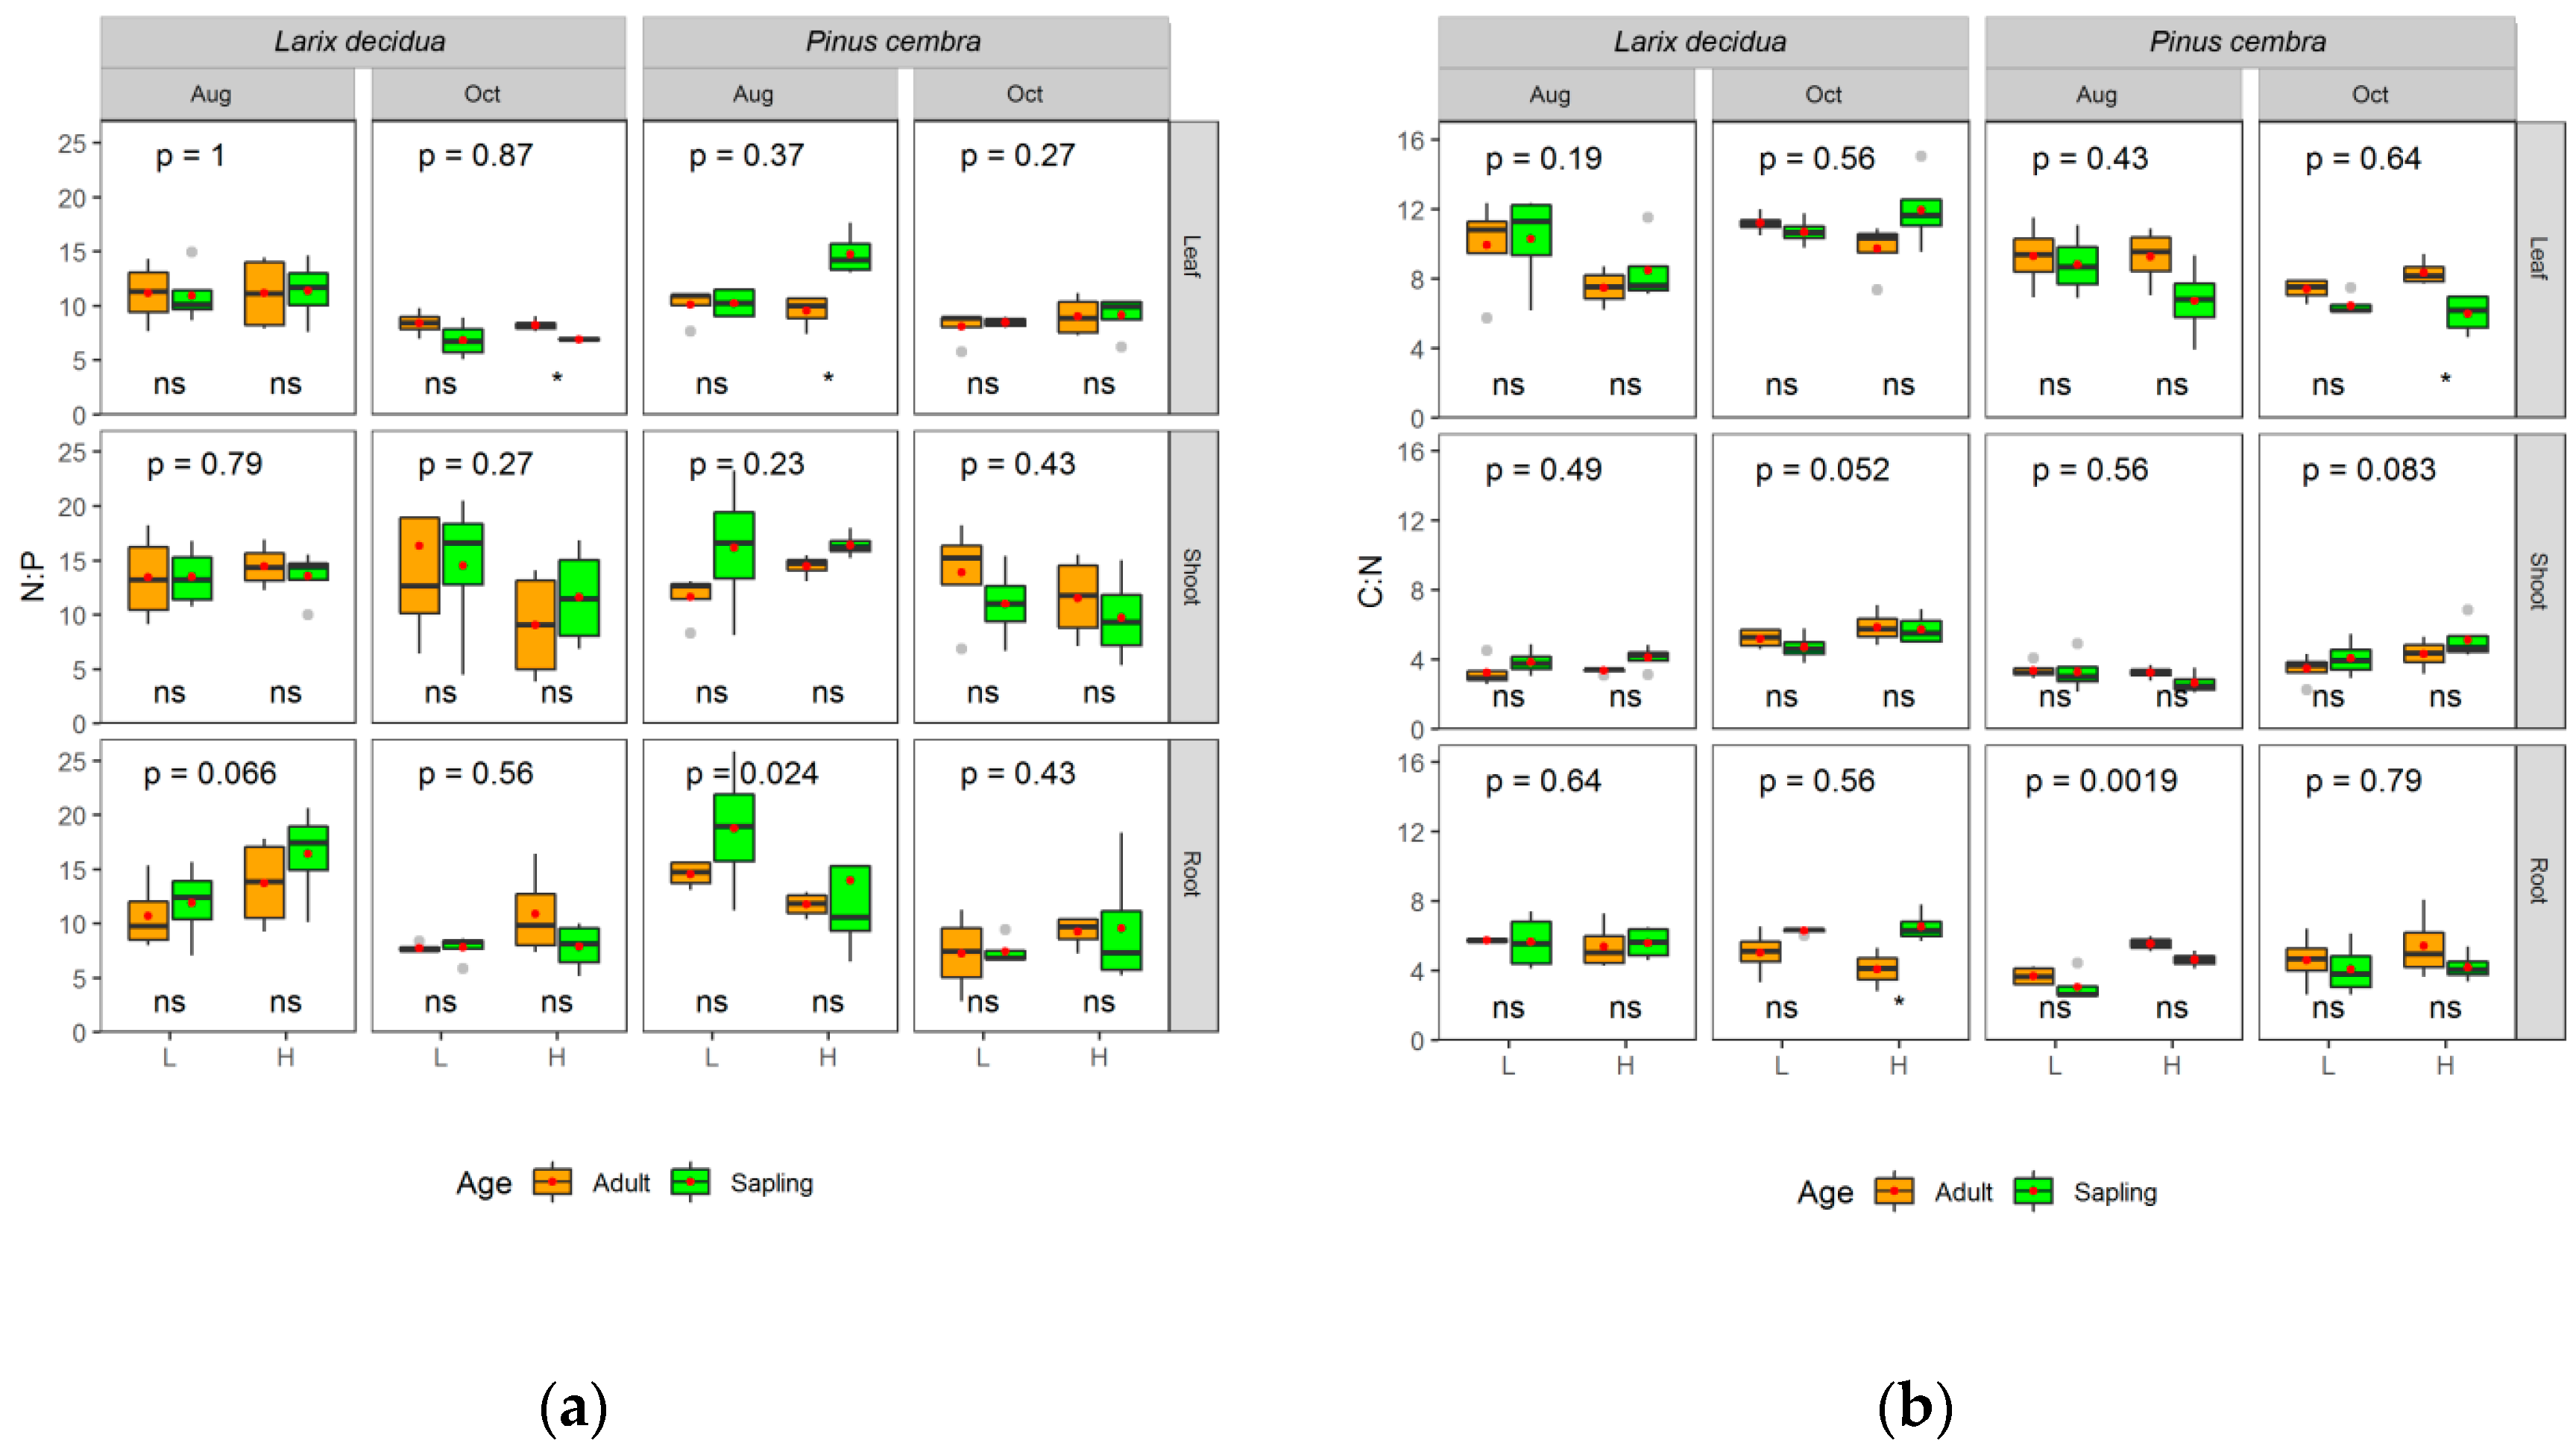
The levels of tissue NSCs (with the exception of shoot starch), C:N, and shoot N concentration, as well as leaf δ13C and δ15N differed significantly between the two species (Tables S2–S3, Figure 2). Pinus cembra had lower levels of NSCs than Larix decidua, e.g., NSC in leaves, shoots, roots of P. cembra was 12.12% ± 0.36%, 7.39% ± 0.19% and 5.51% ± 0.21%, but 15.27% ± 0.46%, 8.13% ± 0.29% and 7.04% ± 0.27% in L. decidua, respectively. Tissue C:N ratio in P. cembra was also lower than that in L. decidua, e.g., C:N in leaves, shoots, roots of P. cembra was 7.78 ± 0.32, 3.69 ± 0.19, 4.41 ± 0.23, but 9.96 ± 0.39, 4.51 ± 0.21, 5.55 ± 0.21 in L. decidua, respectively. Shoot N in L. decidua was 18.60 ± 0.66 mg/g, which was significantly lower than that in P. cembra (21.05 ± 0.74 mg/g) (F = 7.50, p < 0.01). With very few exceptions (e.g., August leaf sugars and TP, and October leaf C:N in P. cembra at the treeline), tree age did not influence tissue NSCs (Figure 2), total N and P (Figure 3), leaf δ13C and δ15N values (Figure 4), and C:N and N:P ratios (Figure 5) within each species at the same elevation. Most importantly, there were no interactions between age and altitude on concentrations of tissue NSCs (soluble sugars, starch, and NSC), nutrients (TN, TP), and the stoichiometric ratios (C:N and N:P), as well as on leaf δ13C values (Tables S2–S3), with the exception of leaf δ15N (F = 5.01, p = 0.030). For saplings, leaf δ15N increased from −2.22‰ ± 0.31‰ (timberline) to 0.34‰ ± 0.52‰ (treeline) when combining both species (p < 0.001); for adult individuals, leaf δ15N also increased from −1.57‰ ± 0.31‰ (timberline) to −0.22‰ ± 0.49‰ (treeline) (p < 0.01) (Figure 4). Here, the interaction occurred due to different magnitudes of increasing leaf δ15N from timber to treeline between the age classes.
Only leaf δ15N (F = 13.31, p < 0.001), root TN (F = 13.28, p < 0.01), and root C:N (F = 6.21, p < 0.05) were affected by species × altitude (Tables S2–S3). For L. decidua, leaf δ15N was −1.25‰ ± 0.27‰ (timberline) and 1.69‰ ± 0.29‰ (treeline) (p < 0.001, Table S5), while for P. cembra, leaf δ15N was −2.54‰ ± 0.28‰ (timberline) and −1.58‰ ± 0.28‰ (treeline) (p < 0.05, Table S4) (Figure 4). Similarly, this interaction seems to be caused by different magnitudes of increasing leaf δ15N from timberline to treeline between the two species studied (Figure 4). However, root TN of the two species showed opposite trends along elevational transects: for L. decidua, root N increased from 11.71 ± 0.60 mg g−1 at timberline to 14.75 ± 1.12 mg g−1 (p < 0.01) at the alpine treeline, whereas, for P. cembra, root TN decreased from 14.07 ± 0.78 mg g−1 at timberline to 11.93 ± 0.48 mg g−1 (p < 0.05) at the alpine treeline. Consequently, root C:N in L. decidua slightly decreased from 5.70 ± 0.26 at the timberline to 5.40 ± 0.33 (p > 0.05) at the treeline, while for P. cembra, root C:N increased from 3.86 ± 0.31 (timberline) to 4.96 ± 0.28 (treeline) (p < 0.05) (Figure 5).

4. Discussion

We found that there was no interaction between age and elevation on tissue NSCs (except for leaf sugars for the two species and leaf NSC for L. decidua) and nutrients (TN, TP) for both P. cembra and L. decidua (Tables S4 and S5). These findings suggest that saplings and adults respond consistently to combined environmental changes in terms of carbon and nutrient allocation, which does not support our hypothesis of different life stages leading to differing carbon and nutrient allocation responses along elevational changes. Niinemets [4] presented a comprehensive review which emphasized that forest trees’ physiological responses to key environmental stressors and their combinations varied throughout ontogeny. The discrepancy between this review and our results may be attributed to the fact that most reviewed studies came from closed forests, where sapling and adults, due to their different ecological niches in a community, are subjected to different light, water, and temperature and nutrient regimes [38]. For elevation-driven changes in plant nutrients, Mayor et al. [39] found that declining temperatures with increasing elevation did not affect tree leaf nutrient concentrations, implying an adaptation strategy of trees growing in a harsh environment. Deciduous species tend to store N in the wood and bark of roots [30], while evergreen species store N in the youngest age class of foliage [40,41].
We found no age effects on leaf δ15N for both species grown at a given altitude (timberline or treeline) (Tables S4 and S5, Figure 4), which indicates no distinct differences in nitrogen uptake and metabolism between two life stages for both species. This finding is consistent with Pardo et al. [42]. Our study found also that tree age did not affect tissue N concentration for both species (Tables S4 and S5), except for a significant age effect on leaf N in P. cembra (Figure S4). Previous studies [43,44], have suggested that differences in N uptake and metabolism with ontogenetic stage occur in some species and environmental conditions but not in others. Nevertheless, leaf N in both species showed an increasing trend with altitude from timberline to treeline, which corresponds with the findings from Körner [12]. There have been two main explanations for such altitudinal trends in plant N: firstly, low temperature and short growing season at higher altitude reduce growth and might consequently have an effect on leaf N contents [12]. Another cause might be the high N supply from atmospheric N deposition, due to winter snow accumulation, at the treeline [12,45] leading to higher N availability and consequently higher N uptake with increasing elevation.
Similar to leaf N content, leaf δ15N was lower at the timberline than at the treeline for both species. The positive correlation between leaf N and leaf δ15N was confirmed by previous studies [46,47,48,49], where leaf N was considered an index for soil N availability [50,51]. The increasing trend in leaf δ15N along altitude in the present study was in line with results reported by [48] (above 1,350 m), but in contrast to other studies. For example, leaf δ15N exhibited a decreasing trend with altitude in plants collected from the Kathmandu valley in Nepal [52] and from Mt. Schrankogel in Austria [53], but differences might be attributed to variations in soil 15N and its drivers. For example, with increasing elevation, organic forms of N became the dominant source of N taken up by hardwood and coniferous tree species, and that variation in natural abundance foliar δ15N with elevation was consistent with increasing organic N uptake [54]. Although we found similar trends along our altitudinal transect, the two species exhibited significant differences in leaf δ15N, with higher leaf δ15N in L. decidua than in P. cembra (Figure 4) across ontogeny and elevations. The lower leaf δ15N in P. cembra might be associated with a higher rate of root colonization with mycorrhizal fungi [55], because mycorrhizal fungi are mainly transferring 15N-depleted ammonium or amino acids to plants [56,57].
Our results showed that no significant ontogenetic differences in non-structural carbohydrates and nutrients (nitrogen and phosphorus) across leaf, shoot, and root tissues of both species grown along elevational gradients are present. However, due to the limited number of tree species growing in the alpine treeline ecotone in the Swiss Alps, we investigated only one deciduous and one evergreen tree species with four replicates. Further studies are needed to cover more tree species with more replicates for different life stages in a wider geographical range, to improve our understanding of ontogenetic effects on tree physiology.

5. Conclusions

This paper presents, to the best of our knowledge, the first field evidence to elucidate how different species integrated over different life stages cope with synthetic environmental changes (altitude) from the perspective of carbon and nutrient allocation strategies. Our results demonstrate that both deciduous and evergreen trees in their early life stage perform similarly compared to their adult individuals along an environmental gradient (from the timberline to the alpine treeline). Our results indicate that most of our knowledge of forest responses, especially shoot and root responses, to global environmental changes gained from experiments with seedlings/saplings growing in artificially controlled conditions could, to some extent, upscale to larger and mature trees growing in situ. This finding advances our understanding of plants’ adaptation strategies and has considerable implications for future model-developments.

Supplementary Materials

The following are available online at https://www.mdpi.com/1999-4907/10/5/394/s1. Table S1: Description of sampling transects and plots for Pinus cembra L. and Larix decidua Mill. in the South Swiss Alps, Table S2: LMM results for the effects of species (Pinus cembra L. and Larix decidua Mill.), altitude (timberline and treeline), tree age (sapling and adult tree), sampled season (mid-growing season: August; and late-season: October) on NSCs, nutrients, and stable isotope over tissues. The interactions were retained in the models only when significant. df: degrees of freedom. Significant p-values are in bold face, Table S3: LMM results for the effects of species (Pinus cembra L. and Larix decidua Mill.), altitude (timberline and treeline), tree age (sapling and adult tree), sampled season (mid-growing season: August; and late-season: October) on the stoichiometric ratios (C:N and N:P). The interactions were retained in the models only when significant. df: degrees of freedom. Significant p-values are in bold face, Table S4: LMM results for the effects of altitude (timberline and treeline), tree age (sapling and adult tree), sampled season (mid-growing season: August; and late-season: October) and their interactions on NSCs, nutrients and stable isotope over tissues of Pinus cembra L. The interactions were retained in the models only when significant. df: degrees of freedom. Significant p-values are in bold face, Table S5: LMM results for the effects of altitude (timberline and treeline), tree age (sapling and adult tree), sampled season (mid-growing season: August; and late-season: October) and their interactions on NSCs, nutrients and stable isotope over tissues of Larix decidua Mill. The interactions were retained in the models only when significant. df: degrees of freedom. Significant p-values are in bold face.

Author Contributions

Conceptualization, M.-H.L., J.-F.L., W.-F.X., and Z.-P.J.; methodology, M.-H.L., J.-F.L., W.-F.X., and Z.-P.J.; formal analysis, J.-F.L. and Y.-Y.N.; investigation, J.-F.L. and M.-H.L.; writing—Original draft preparation, J.-F.L.; writing—Review and editing, M.-H.L., M.S., and A.G.; supervision, M.-H.L., J.-F.L., W.-F.X., Z.-P.J., M.S., and A.G.

Funding

This research was funded by the Fundamental Research Funds for the Central Non-Profit Research Institution of CAF (CAFYBB2014ZD001), the National Natural Science Foundation of China (No. 41371076 and 41371075), and the China Scholarship Council (No. 201303270003).

Acknowledgments

The authors are grateful for the laboratory assistance from Ursula Graf (WSL).

Conflicts of Interest

The authors declare no conflict of interest.

References

  1. Steffen, W.; Sanderson, R.A.; Tyson, P.D.; Jäger, J.; Matson, P.A.; Moore, B., III; Oldfield, F.; Richardson, K.; Schellnhuber, H.J.; Turner, B.L.; et al. Global Change and the Earth System: A Planet under Pressure; Springer Science & Business Media: Heidelberg, Germany, 2006. [Google Scholar]
  2. Gamfeldt, L.; Snäll, T.; Bagchi, R.; Jonsson, M.; Gustafsson, L.; Kjellander, P.; Ruiz-Jaen, M.C.; Fröberg, M.; Stendahl, J.; Philipson, C.D.; et al. Higher levels of multiple ecosystem services are found in forests with more tree species. Nat. Commun. 2013, 4, 1340. [Google Scholar] [CrossRef]
  3. Wolkovich, E.M.; Cook, B.I.; Allen, J.M.; Crimmins, T.M.; Betancourt, J.L.; Travers, S.E.; Pau, S.; Regetz, J.; Davies, T.J.; Kraft, N.J.B.; et al. Warming experiments underpredict plant phenological responses to climate change. Nature 2012, 485, 494–497. [Google Scholar] [CrossRef] [PubMed]
  4. Niinemets, Ü. Responses of forest trees to single and multiple environmental stresses from seedlings to mature plants: Past stress history, stress interactions, tolerance and acclimation. For. Ecol. Manag. 2010, 260, 1623–1639. [Google Scholar] [CrossRef]
  5. Steppe, K.; Niinemets, Ü.; Teskey, R.O. Tree size-and age-related changes in leaf physiology and their influence on carbon gain. In Size-and Age-Related Changes in Tree Structure and Function; Springer: New York, NY, USA, 2011; pp. 235–253. [Google Scholar]
  6. Portsmuth, A.; Niinemets, Ü.; Truus, L.; Pensa, M. Biomass allocation and growth rates in Pinus sylvestris are interactively modified by nitrogen and phosphorus availabilities and by tree size and age. Can. J. For. Res. 2005, 35, 2346–2359. [Google Scholar] [CrossRef]
  7. Gedroc, J.J.; McConnaughay, K.D.M.; Coleman, J.S. Plasticity in Root/Shoot Partitioning: Optimal, Ontogenetic, or Both? Funct. Ecol. 1996, 10, 44–50. [Google Scholar] [CrossRef]
  8. Rivas-Ubach, A.; Sardans, J.; Pérez-Trujillo, M.; Estiarte, M.; Peñuelas, J. Strong relationship between elemental stoichiometry and metabolome in plants. Proc. Natl. Acad. Sci. USA 2012, 109, 4181–4186. [Google Scholar] [CrossRef]
  9. Álvarez-Yépiz, J.C.; Cueva, A.; Dovčiak, M.; Teece, M.; Yepez, E.A. Ontogenetic resource-use strategies in a rare long-lived cycad along environmental gradients. Conserv. Physiol. 2014, 2, cou034. [Google Scholar] [CrossRef]
  10. Cavender-Bares, J.; Bazzaz, F.A. Changes in drought response strategies with ontogeny in Quercus rubra: Implications for scaling from seedlings to mature trees. Oecologia 2000, 124, 8–18. [Google Scholar] [CrossRef]
  11. Bansal, S.; Germino, M.J. Variation in ecophysiological properties among conifers at an ecotonal boundary: Comparison of establishing seedlings and established adults at timberline. J. Veg. Sci. 2010, 21, 133–142. [Google Scholar] [CrossRef]
  12. Körner, C. The nutritional status of plants from high altitudes. Oecologia 1989, 81, 379–391. [Google Scholar] [CrossRef] [PubMed]
  13. Körner, C. The use of ‘altitude’ in ecological research. Trends Ecol. Evol. 2007, 22, 569–574. [Google Scholar] [CrossRef]
  14. Li, M.-H.; Xiao, W.-F.; Wang, S.-G.; Cheng, G.-W.; Cherubini, P.; Cai, X.-H.; Liu, X.-L.; Wang, X.-D.; Zhu, W.-Z. Mobile carbohydrates in Himalayan treeline trees I. Evidence for carbon gain limitation but not for growth limitation. Tree Physiol. 2008, 28, 1287–1296. [Google Scholar] [CrossRef] [PubMed]
  15. Marqués, L.; Camarero, J.J.; Gazol, A.; Zavala, M.A. Drought impacts on tree growth of two pine species along an altitudinal gradient and their use as early-warning signals of potential shifts in tree species distributions. Forest Ecol. Manag. 2016, 381, 157–167. [Google Scholar] [CrossRef]
  16. Rigling, A.; Bigler, C.; Eilmann, B.; Feldmeyer-Christe, E.; Gimmi, U.; Ginzler, C.; Graf, U.; Mayer, P.; Vacchiano, G.; Weber, P.; et al. Driving factors of a vegetation shift from Scots pine to pubescent oak in dry Alpine forests. Glob. Chang. Biol. 2013, 19, 229–240. [Google Scholar] [CrossRef]
  17. Peng, G.; Wu, C.; Xu, X.; Yang, D. The age-related changes of leaf structure and biochemistry in juvenile and mature subalpine fir trees (Abies faxoniana Rehder & E.H. Wilson.) along an altitudinal gradient. Pol. J. Ecol. 2012, 60, 311–321. [Google Scholar]
  18. Zhao, C.; Chen, L.; Ma, F.; Yao, B.; Liu, J. Altitudinal differences in the leaf fitness of juvenile and mature alpine spruce trees (Picea crassifolia). Tree Physiol. 2008, 28, 133–141. [Google Scholar] [CrossRef] [PubMed]
  19. Shi, P.; Körner, C.; Hoch, G. A test of the growth-limitation theory for alpine tree line formation in evergreen and deciduous taxa of the eastern Himalayas. Funct. Ecol. 2008, 22, 213–220. [Google Scholar] [CrossRef]
  20. Fajardo, A.; Piper, F.I.; Pfund, L.; Körner, C.; Hoch, G. Variation of mobile carbon reserves in trees at the alpine treeline ecotone is under environmental control. New Phytol. 2012, 195, 794–802. [Google Scholar] [CrossRef]
  21. Fajardo, A.; Piper, F.I.; Hoch, G. Similar variation in carbon storage between deciduous and evergreen treeline species across elevational gradients. Ann. Bot. 2013, 112, 623–631. [Google Scholar] [CrossRef]
  22. Rabasa, S.G.; Granda, E.; Benavides, R.; Kunstler, G.; Espelta, J.M.; Ogaya, R.; Peñuelas, J.; Scherer-Lorenzen, M.; Gil, W.; Grodzki, W.; et al. Disparity in elevational shifts of European trees in response to recent climate warming. Glob. Change Biol. 2013, 19, 2490–2499. [Google Scholar] [CrossRef]
  23. Máliš, F.; Kopecký, M.; Petřík, P.; Vladovič, J.; Merganič, J.; Vida, T. Life stage, not climate change, explains observed tree range shifts. Glob. Chang. Biol. 2016, 22, 1904–1914. [Google Scholar] [CrossRef] [PubMed]
  24. Bell, D.M.; Bradford, J.B.; Lauenroth, W.K. Early indicators of change: Divergent climate envelopes between tree life stages imply range shifts in the western United States. Glob. Ecol. Biogeogr. 2014, 23, 168–180. [Google Scholar] [CrossRef]
  25. Bansal, S.; Germino, M.J. Temporal variation of nonstructural carbohydrates in montane conifers: Similarities and differences among developmental stages, species and environmental conditions. Tree Physiol. 2009, 29, 559–568. [Google Scholar] [CrossRef] [PubMed]
  26. Baber, O.; Slot, M.; Celis, G.; Kitajima, K. Diel patterns of leaf carbohydrate concentrations differ between seedlings and mature trees of two sympatric oak species. Botany 2014, 92, 535–540. [Google Scholar] [CrossRef]
  27. Hoch, G.; Körner, C. Growth and carbon relations of tree line forming conifers at constant vs. variable low temperatures. J. Ecol. 2009, 97, 57–66. [Google Scholar] [CrossRef]
  28. Gruber, A.; Pirkebner, D.; Oberhuber, W. Seasonal dynamics of mobile carbohydrate pools in phloem and xylem of two alpine timberline conifers. Tree Physiol. 2013, 33, 1076–1083. [Google Scholar] [CrossRef]
  29. Zhu, W.Z.; Cao, M.; Wang, S.G.; Xiao, W.F.; Li, M.H. Seasonal dynamics of mobile carbon supply in Quercus aquifolioides at the upper elevational limit. PLoS ONE 2012, 7, e34213. [Google Scholar] [CrossRef]
  30. Li, M.H.; Jiang, Y.; Wang, A.; Li, X.; Zhu, W.; Yan, C.F.; Du, Z.; Shi, Z.; Lei, J.; Schönbeck, L. Active summer carbon storage for winter persistence in trees at the cold alpine treeline. Tree Physiol. 2018. [Google Scholar] [CrossRef]
  31. Hoch, G.; Körner, C. The carbon charging of pines at the climatic treeline: A global comparison. Oecologia 2003, 135, 10–21. [Google Scholar] [CrossRef]
  32. Zhu, W.Z.; Xiang, J.S.; Wang, S.G.; Li, M.H. Resprouting ability and mobile carbohydrate reserves in an oak shrubland decline with increasing elevation on the eastern edge of the Qinghai-Tibet Plateau. For. Ecol. Manag. 2012, 278, 118–126. [Google Scholar] [CrossRef]
  33. Li, M.H.; Hoch, G.; Körner, C. Spatial variability of mobile carbohydrates within Pinus cembra trees at the alpine treeline. Phyton-Ann. Rei. Bot. A 2001, 41, 203–213. [Google Scholar]
  34. Seifter, S.; Dayton, S.; Novic, B.; Muntwyler, E. The Estimation of Glycogen with the Anthrone Reagent. Arch. Biochem. 1950, 25, 191–200. [Google Scholar] [PubMed]
  35. Osaki, M.; Shinano, T.; Tadano, T. Redistribution of carbon and nitrogen compounds from the shoot to the harvesting organs during maturation in field crops. Soil Sci. Plant Nutr. 1991, 37, 117–128. [Google Scholar] [CrossRef]
  36. Page, A.L. Methods of Soil Analysis. Part 2. Chemical and microbiological Properties; American Society of Agronomy, Soil Science Society of America: Madison, WI, USA, 1982. [Google Scholar]
  37. Gebauer, G.; Schulze, E.-D. Carbon and nitrogen isotope ratios in different compartments of a healthy and a declining Picea abies forest in the Fichtelgebirge, NE Bavaria. Oecologia 1991, 87, 198–207. [Google Scholar] [CrossRef]
  38. Remy, E.; Wuyts, K.; Boeckx, P.; Ginzburg, S.; Gundersen, P.; Demey, A.; Van Den Bulcke, J.; Van Acker, J.; Verheyen, K. Strong gradients in nitrogen and carbon stocks at temperate forest edges. For. Ecol. Manag. 2016, 376, 45–58. [Google Scholar] [CrossRef]
  39. Mayor, J.R.; Sanders, N.J.; Classen, A.T.; Bardgett, R.D.; Clément, J.-C.; Fajardo, A.; Lavorel, S.; Sundqvist, M.K.; Bahn, M.; Chisholm, C.; et al. Elevation alters ecosystem properties across temperate treelines globally. Nature 2017, 542, 91–95. [Google Scholar] [CrossRef] [PubMed]
  40. Millard, P.; Grelet, G.-a. Nitrogen storage and remobilization by trees: Ecophysiological relevance in a changing world. Tree Physiol. 2010, 30, 1083–1095. [Google Scholar] [CrossRef]
  41. Piper, F.I.; Fajardo, A. Foliar habit, tolerance to defoliation and their link to carbon and nitrogen storage. J. Ecol. 2014, 102, 1101–1111. [Google Scholar] [CrossRef]
  42. Pardo, L.H.; Semaoune, P.; Schaberg, P.G.; Eagar, C.; Sebilo, M. Patterns in δ15N in roots, stems, and leaves of sugar maple and American beech seedlings, saplings, and mature trees. Biogeochemistry 2013, 112, 275–291. [Google Scholar] [CrossRef]
  43. Reich, A.; Ewel, J.; Nadkarni, N.; Dawson, T.; Evans, R.D. Nitrogen isotope ratios shift with plant size in tropical bromeliads. Oecologia 2003, 137, 587–590. [Google Scholar] [CrossRef]
  44. Hu, Y.-L.; Yan, E.-R.; Choi, W.-J.; Salifu, F.; Tan, X.; Chen, Z.C.; Zeng, D.-H.; Chang, S. Soil nitrification and foliar δ15N declined with stand age in trembling aspen and jack pine forests in northern Alberta, Canada. Plant Soil 2014, 376, 399–409. [Google Scholar] [CrossRef]
  45. Hiltbrunner, E.; Schwikowski, M.; Körner, C. Inorganic nitrogen storage in alpine snow pack in the Central Alps (Switzerland). Atmos. Environ. 2005, 39, 2249–2259. [Google Scholar] [CrossRef]
  46. Chen, L.; Flynn, D.F.B.; Zhang, X.; Gao, X.; Lin, L.; Luo, J.; Zhao, C. Divergent patterns of foliar δ13C and δ15N in Quercus aquifolioides with an altitudinal transect on the Tibetan Plateau: An integrated study based on multiple key leaf functional traits. J. Plant Ecol. 2015, 8, 303–312. [Google Scholar] [CrossRef]
  47. Bai, E.; Boutton, T.; Liu, F.; Wu, X.B.; Archer, S.; Hallmark, C.T. Spatial variation of the stable nitrogen isotope ratio of woody plants along a topoedaphic gradient in a subtropical savanna. Oecologia 2009, 159, 493–503. [Google Scholar] [CrossRef]
  48. Liu, X.; Wang, G.; Li, J.; Wang, Q. Nitrogen isotope composition characteristics of modern plants and their variations along an altitudinal gradient in Dongling Mountain in Beijing. Sci. China Ser. D-Earth Sci. 2010, 53, 128–140. [Google Scholar] [CrossRef]
  49. Garten, C.T., Jr.; Miegroet, H.V. Relationships between soil nitrogen dynamics and natural 15N abundance in plant foliage from Great Smoky Mountains National Park. Can. J. Forest Res. 1994, 24, 1636–1645. [Google Scholar] [CrossRef]
  50. Chen, Y.; Han, W.; Tang, L.; Tang, Z.; Fang, J. Leaf nitrogen and phosphorus concentrations of woody plants differ in responses to climate, soil and plant growth form. Ecography 2013, 36, 178–184. [Google Scholar] [CrossRef]
  51. Ordoñez, J.C.; Van Bodegom, P.M.; Witte, J.-P.M.; Wright, I.J.; Reich, P.B.; Aerts, R. A global study of relationships between leaf traits, climate and soil measures of nutrient fertility. Glob. Ecol. Biogeogr. 2009, 18, 137–149. [Google Scholar] [CrossRef]
  52. Sah, S.; Brumme, R. Altitudinal gradients of natural abundance of stable isotopes of nitrogen and carbon in the needles and soil of a pine forest in Nepal. J. Forest Sci. 2003, 49, 19–26. [Google Scholar] [CrossRef]
  53. Huber, E.; Wanek, W.; Gottfried, M.; Pauli, H.; Schweiger, P.; Arndt, S.; Reiter, K.; Richter, A. Shift in soil–plant nitrogen dynamics of an alpine–nival ecotone. Plant Soil 2007, 301, 65–76. [Google Scholar] [CrossRef]
  54. Averill, C.; Finzi, A. Increasing plant use of organic nitrogen with elevation is reflected in nitrogen uptake rates and ecosystem δ15N. Ecology 2010, 92, 883–891. [Google Scholar] [CrossRef]
  55. Keller, G. Utilization of inorganic and organic nitrogen sources by high-subalpine ectomycorrhizal fungi of Pinus cembra in pure culture. Mycol. Res. 1996, 100, 989–998. [Google Scholar] [CrossRef]
  56. Hobbie, E.A.; Högberg, P. Nitrogen isotopes link mycorrhizal fungi and plants to nitrogen dynamics. New Phytol. 2012, 196, 367–382. [Google Scholar] [CrossRef]
  57. Hasselquist, N.J.; Metcalfe, D.B.; Inselsbacher, E.; Stangl, Z.; Oren, R.; Näsholm, T.; Högberg, P. Greater carbon allocation to mycorrhizal fungi reduces tree nitrogen uptake in a boreal forest. Ecology 2016, 97, 1012–1022. [Google Scholar] [CrossRef]
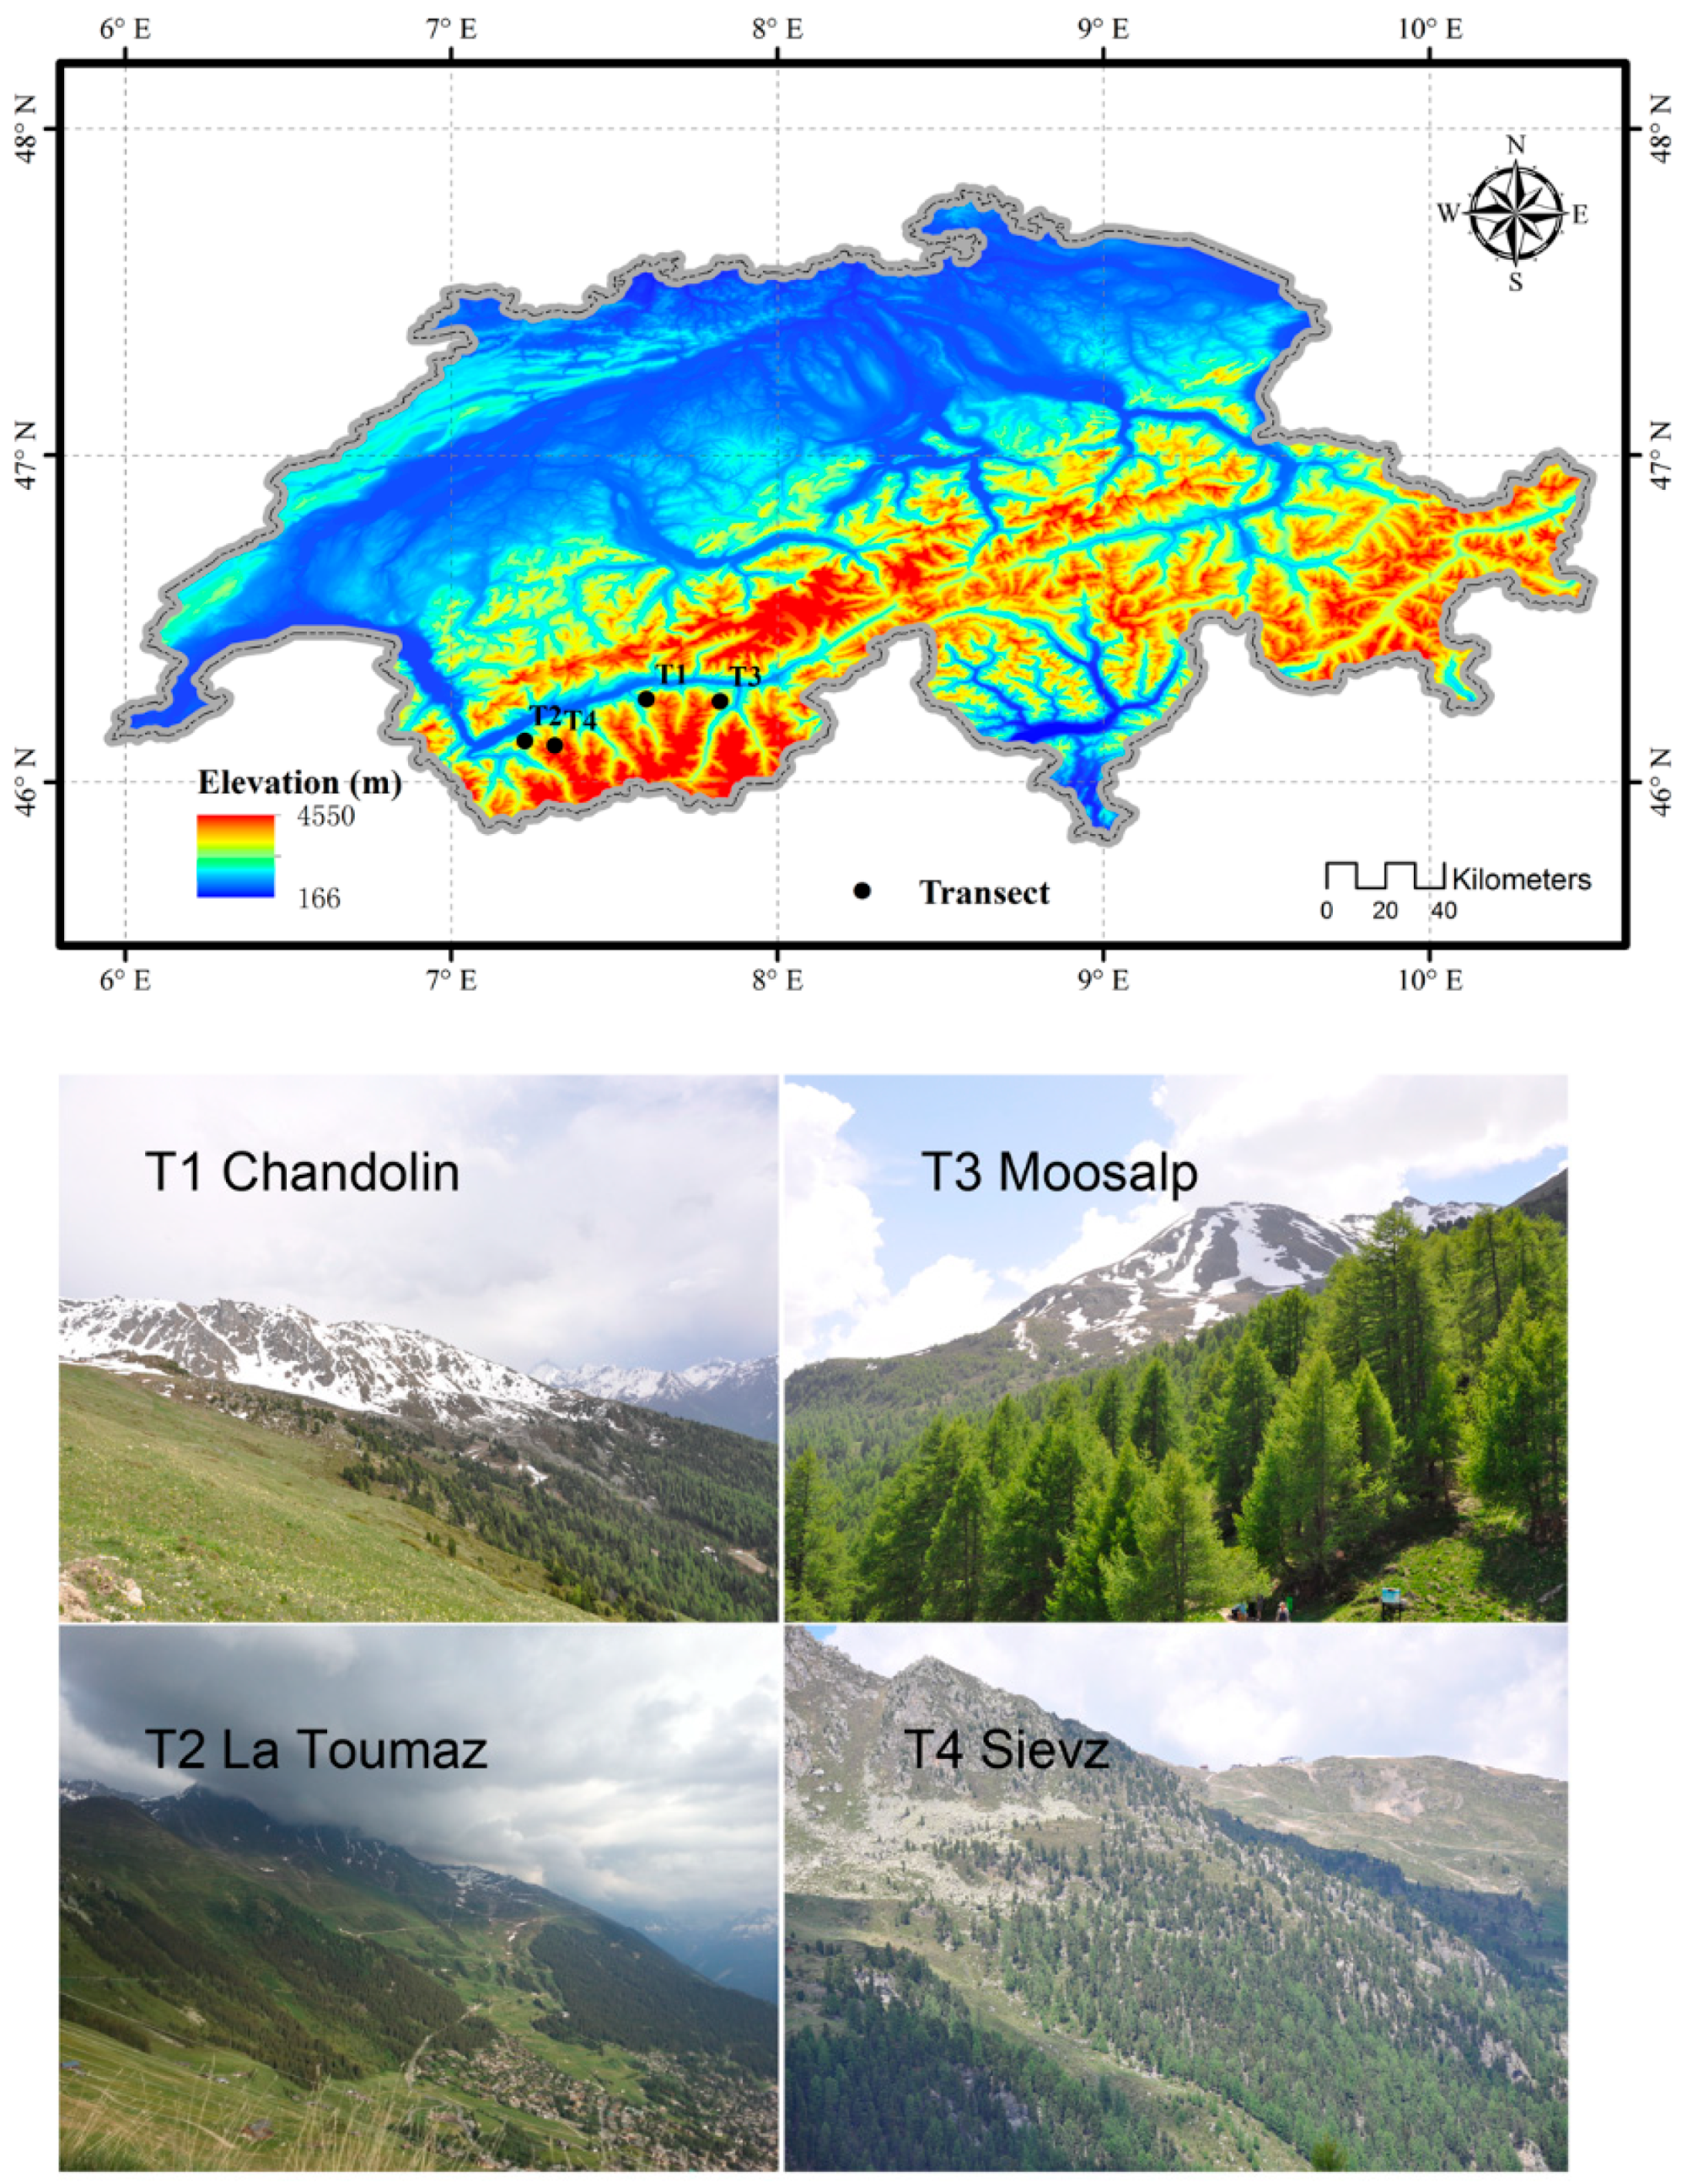
Figure 1. Locations of the sampled sites (T1: Chandolin, T2: La Toumaz, T3: Moosalp, and T4: Sievz) in the southern Swiss Alps.
Forests 10 00394 g001
Figure 2. Non-structural carbohydrate concentration (% DW) (a), soluble sugar (% DW) (b), and starch (% DW) (c) (mean ± SE, n = 4) of different species (Pinus cembra L. and Larix decidua Mill.), age (sapling and adult tree), altitude (L for timberline and H for treeline), season (Aug for mid-growing season and October for late season) and tissues (current-year leaf, shoot, and fine root). Asterisks or “ns” at the bottom of subplot indicate significant (p < 0.05) or non-significant (p > 0.05) differences between saplings and adults within the same altitude and season, and the p-value at the top of subplot denote significance level by the Wilcoxon’s mean test between L and H. The red points in the subplot denote mean value and grey point for outlier.
Forests 10 00394 g002
Figure 3. Total nitrogen (TN) (a) and phosphorus (TP) (b) concentrations (mg/g DW) (mean ± SE, n = 4) of different species (Pinus cembra L. and Larix decidua Mill.), age (sapling and adult trees), altitude (L for timberline and H for treeline), season (August for mid-growing season and October for late season), and tissues (current-year leaf, shoot, and fine root). Asterisks or “ns” at the bottom of subplot indicate significant (p < 0.05) or non-significant (p > 0.05) differences between saplings and adults within the same altitude and season, and the p-value at the top of subplot denote significance level by the Wilcoxon’s mean test between L and H.
Forests 10 00394 g003
Figure 4. Leaf stable isotopes (δ13C‰; δ15N‰) (mean ± SE, n = 4) of different species (Pinus cembra L. and Larix decidua Mill.), age (sapling and adult tree), altitude (L for timberline and H for treeline), season (August for mid-growing season and October for late season). Asterisks or “ns” at the bottom of subplot indicate significant (p < 0.05) or non-significant (p > 0.05) differences between saplings and adults within the same altitude and season, and the p-value at the top of subplot denote significance level by the Wilcoxon’s mean test between L and H.
Forests 10 00394 g004
Figure 5. The ratio of N to P (a) and the ratio of C to N (b) (mean ± SE, n = 4) across tissues of the two species (Pinus cembra L. and Larix decidua Mill.), age (sapling and adult trees), altitude (L for timberline and H for treeline), season (August for mid-growing season and October for late season) and tissues (current-year leaf, shoot, and fine root). Asterisks or “ns” at the bottom of subplot indicate significant (p < 0.05) or non-significant (p > 0.05) differences between saplings and adults within the same altitude and season, and the p-value at the top of subplot denote significance level by the Wilcoxon’s mean test between L and H.
Forests 10 00394 g005