Abstract
In China, Platycladus orientalis has a lifespan of thousands of years. The long lifespan of these trees may be relevant for the characterization of plant aging at the molecular level. However, the molecular mechanism of the aging process of P. orientalis is still unknown. To explore the relationship between age and growth of P. orientalis, we analyzed physiological changes during P. orientalis senescence. The malondialdehyde content was greater in 200-, 700-, and 1100-year-old ancient trees than in 20-year-old trees, whereas the peroxidase and superoxide dismutase activities, as well as the soluble protein content, exhibited the opposite trend. Furthermore, we performed a de novo transcriptome assembly using RNA-Seq and obtained 48,044 unigenes with an average length of 896 bp. A total of 418 differentially expressed genes were identified in different stages of aging of P. orientalis. Clustering analysis revealed distinct timepoints at which the oxidation–reduction and photosynthesis pathways changed. Eight clusters with distinct expression patterns were identified. The expression levels of photosynthesis-, oxidation–reduction-, and transporter-related genes were down-regulated, whereas those of transcription-, signaling-, and senescence-related genes were up-regulated during aging. In addition, consistent with the most obviously down-regulated genes of photosynthesis-related genes, the photosynthetic indexes including chlorophyll a and b levels decreased steadily during P. orientalis aging. This study combined transcriptome with physiological and biochemical data, revealing potential candidate genes influencing senescence during P. orientalis aging.
1. Introduction
Several woody perennials, including Sequoia sempervirens, Sequoiadendron giganteum, Platycladus orientalis, and Pinus longaeva, can live for several hundred years or even millennia [1,2]. Plant biologists are currently interested in the physiological and molecular mechanisms mediating or preventing senescence [3,4]. Some physiological and metabolic changes during aging have been reported in conifers [4,5,6]. However, no significant age-related differences were observed between 4713-year-old and 23-year-old P. longaeva trees [7,8]. The mechanisms responsible for aging in woody perennials have not been conclusively characterized [2,9].
Senescence may be considered an adaptive strategy of woody perennial species undergoing an age-related physiological deterioration that begins with a decrease in the growth rate [10,11]. However, compared with monocarpic plants, senescence in woody perennials is very difficult to determine [12]. Woody perennial growth is commonly studied by examining the leaves. The catabolism of macromolecules, such as chlorophylls, proteins, and nucleic acids, is unavoidable during the senescence process [13,14,15]. Additionally, in P. orientalis and Populus species, decrease in chlorophyll photosynthetic rate coincides with the natural senescence of leaves [4,16]. Age-induced oxidative stress in chloroplasts may lead to decreased photosynthetic activity in leaves [17]. The accumulation of reactive oxygen species (ROS) is regulated by peroxidase (POD), superoxide dismutase (SOD), and carotenoids during leaf senescence [18]. However, more research of the relative contributions of the chlorophyll and carotenoid contents to oxidative stress associated with aging in woody perennials is needed [19].
Photosynthesis converts light energy into chemical energy, and the electron transfer that occurs during the energy conversion process is regulated by the reduction–oxidation (redox) system [19]. The chlorophyll content decreases during senescence, leading to decreases in the amounts of ATP and NADPH consumed by the photosynthetic carbon cycle [20]. Additionally, cytochrome c oxidase (COX) is a key part of the mitochondrial electron transport chain, as well as a major protein that regulates the redox status [21]. In plants, the redox system is important for signal transductions that maintain the stability of cell states [22].
RNA-Sequencing (RNA-Seq) technology has been widely applied for functional genomics studies of Arabidopsis thaliana, rice, and other plant species under stress conditions [23]. Genes, including SIRK genes (encoding senescence-induced receptor-like kinases) and those encoding cysteine proteinases and WRKY transcription factors, were identified during investigations of the senescence of bean and A. thaliana leaves [23,24]. Genes exhibiting down-regulated expression, such as RbcS (ribulose bisphosphate carboxylase small chain), PsbO (a subunit involved in oxygen evolution), Lhcb6 (Chlorophyll a-b binding protein CP24), and HSP (heat shock protein), were detected in the leaves of ancient P. orientalis and Populus species under stress conditions [4,25]. High-throughput sequencing technology has enabled researchers to combine transcriptome sequencing data and digital expression profiles for studies of the high-throughput gene expression profiles of non-model plants [26]. To the best of our knowledge, there are no prior reports that describe aging-related changes in gene expression in P. orientalis trees. Moreover, the longevity of P. orientalis is regulated by many factors [11]. Molecular biology techniques may be useful for examining ancient trees. In this study, we used high-throughput sequencing technology to analyze the transcriptome of P. orientalis trees at different ages (20, 200, 700, and 1100 years old). Combining the gene expression data with physiological and biochemical data, we clarified the regulatory mechanisms underlying the anti-aging process in P. orientalis at the molecular level. The data presented herein may provide a foundation for elucidating the expression-level differences of specific genes related to aging. Moreover, our results contribute to the rejuvenation of P. orientalis trees and provide a theoretical basis for future studies of aging in other tree species.
2. Materials and Methods
2.1. Plant Materials
New leaves were collected from P. orientalis trees of various ages (about 20, 200, 700, and 1100 years old) (Figure 1), which were growing in Zhongshan Park in Beijing, China (39°54′26.37″ N, 116°23′29.22″ E), with three trees (biological replicates) per age group. Tree age was based on historical records for Zhongshan Park. Samples were collected with the approval of the Zhongshan Park administrative office. All the selected trees were ancient, except for the 20-year-old trees (adult trees) [4], which were used as controls. Additionally, all selected trees were located close to each other and were exposed to similar environmental conditions. Samples were collected as described by Zhang et al. [4]. The leaves were collected at 8:00 am in July of 2016. Specifically, new leaves were selected from the south-facing middle canopy layer of pest- and disease-free trees exposed to similar daily illumination times. Samples were flash frozen in liquid nitrogen.
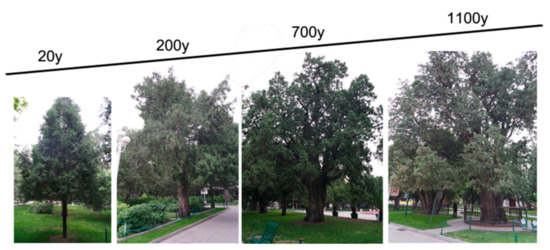
Figure 1.
The trees sampled were 20-, 200-, 700-, and 1100-year-old individuals of Platycladus orientalis in Zhongshan Park, Beijing.
2.2. Physiological Index Determination
The malondialdehyde (MDA) and soluble protein contents were measured as described by Cui et al. and Heath and Packer [27,28], respectively. The SOD and POD activities were detected as described by Dhindsa et al. [29]. The chlorophyll a and b and caretonoid contents were estimated as described by Breeze et al. [30]. Four separate experiments were conducted, differences were considered significant at the p < 0.05 and p < 0.01 levels. Data were analyzed by ANOVA in the SPSS software (IBM, Armonk, NY, USA).
2.3. Total RNA Extraction
A Column Plant RNAout kit (TIANDZ, Beijing, China) was used to isolate total RNA from the leaves of 20-, 200- ,700-, and 1100-year-old P. orientalis trees, with three biological replicates. The RNA concentrations were determined with the NanoPhotometer® spectrophotometer (Implen, Westlake Village, CA, USA), whereas RNA quality and integrity were assessed by 1.5% agarose gel electrophoresis and with a 2100 Bioanalyzer (Agilent Technologies, Santa Clara, CA, USA).
2.4. Construction and Sequencing of cDNA Libraries
Oligo-(dT) magnetic beads were used to purify mRNA from 20 μg total RNA. Fragmentation buffer was added to the purified mRNA to generate shorter segments, which were used along with six-base random primers for first-strand cDNA synthesis. The second cDNA strand was synthesized with DNA polymerase I, dNTPs, and RNase H. Sequencing adapters were ligated to the short segments purified with the QIAquick PCR purification kit to discriminate among samples (three biological replicates). Segments were amplified by PCR and then separated by agarose gel electrophoresis to produce sequencing templates. The resulting cDNA libraries were sequenced with the GAIIx system at Novogene (Beijing, China). Sequencing datasets were deposited in the NCBI database (accession: SRX1757589).
2.5. Transcriptome Assembly and Functional Annotation
Raw reads were filtered by removing adapter sequences and low-quality reads (<Q20) [Q = −10log10(e), which indicates the base quality; e refers to the sequencing error rate]. Additionally, the Q20, Q30, and GC content of the clean data were calculated, after which the Trinity program was used for the de novo assembly of clean sequences [31]. All of the parameters were set to default values, and the expression level of the assembled transcripts was based on the fragments per kilobase per million mapped read (FPKM) values [32]. The abundance of the assembled transcripts was quantified by mapping all of the fragments onto a non-redundant set of transcripts. Following optimal assembly, the longest sequences were selected as unigenes. The unigenes were functionally annotated according to homology searches at the NCBI non-redundant protein (Nr), non-redundant nucleotide (Nt), and Swiss-Prot databases, with an E-value of 10E-5. The results based on the Nr BLAST algorithm were imported into Blast2GO [33] to obtain the relevant gene ontology (GO) terms, with E-values < 10E-6. The unigenes were also used as queries to screen the Clusters of Orthologous Groups (COG) and Kyoto Encyclopedia of Genes and Genomes (KEGG) databases to predict and classify functions and pathway assignments [34].
2.6. Quantification of Gene Expression Levels and Analyses of Differentially Expressed Genes
Gene expression levels were estimated with RSEM software [35]. Clean sequences were mapped back to the assembled data. Read counts for each gene were obtained from the mapping results and normalized against the FPKM values. The read counts were adjusted with the scaling normalization method of the edge R package before examining the differentially expressed genes (DEGs) in each sequenced library. The DEGs were analyzed with the DESeq2 R package. P-values were adjusted based on the q-value. The significant DEGs were identified based on a q-value < 0.05 and |log2 fold-change| > 1. The sequences from the analysis were deposited in the NCBI database (accession: SRX1755981). To investigate the patterns of DEGs at various tree ages, K-means clustering was used to cluster the identified DEGs.
2.7. Quantitative Real-Time PCR
A PrimeScript™ RT reagent Kit (TaKaRa, Dalian, China) was used for reverse transcriptase reactions. A quantitative real-time PCR (RT-qPCR) assay was completed with SYBR® Premix Ex Taq™ II (Tli RNase H Plus; TaKaRa). The P. orientalis αTUB gene was used as an internal reference. Primers were designed with the Primer 3 program (http://frodo.wi.mit.edu/primer3/). Relative gene expression levels (for at least three biological replicates) were calculated according to the 2−ΔΔCt method [2] and are expressed as the mean ± standard deviation. Data were analyzed by ANOVA in the SPSS software with p < 0.05 set as the threshold for identifying significant differences.
3. Results
3.1. Biochemical Changes during Senescence
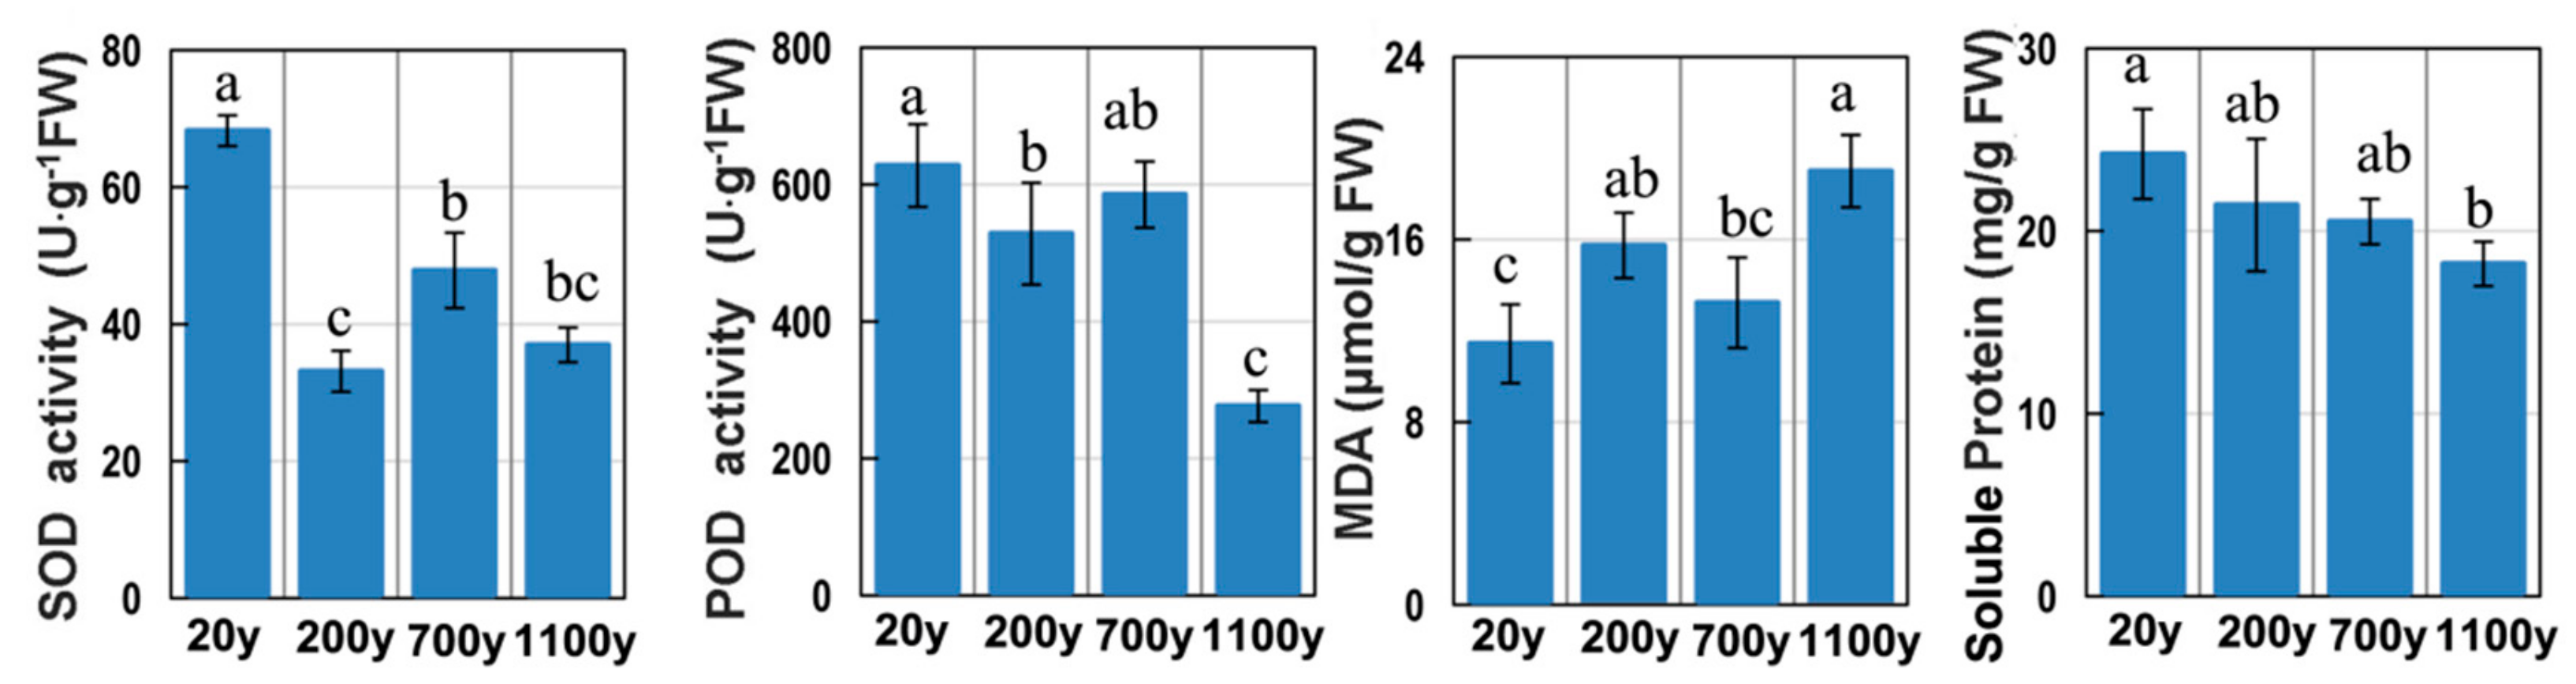
Protein and ROS levels are often used as markers for the progression of senescence [3]. The soluble protein level was high in 20-year-old samples, and then gradually decreased to a minimum in 700-year-old samples (Figure 2). The MDA content in 1100-year-old samples was 1.66-fold (p < 0.05) greater than that in 20-year-old samples. In contrast, SOD and POD activities gradually decreased with age. Thus, the extremely ancient P. orientalis trees may not be able to efficiently eliminate ROS, suggesting that they may be undergoing senescence.

Figure 2.
Superoxide dismutase (SOD) and peroxidase (POD) activities as well as the malondialdehyde (MDA) and soluble protein contents. All data points are means ± SD (n = 3). Means in each column followed by different lowercase letters are significantly different (p < 0.05).
3.2. De novo Assembly of the P. orientalis Transcriptome
Illumina HiSeq™ 2000 sequencing generates comprehensive and reliable data for plant gene expression analyses [36,37]. To characterize the aging events through DEGs, samples with three biological replicates for each age were sequenced. The resulting sequencing data comprised more than 6.22 Gb with an average GC content of 45.32% (Table S1a). Additionally, 62,184,973 clean reads were obtained (97.2%; Figure S1a). After trimming and assembling, 79,413 transcripts and 48,044 unigenes were generated (Figure S1b; Table S1b). Their length distributions are shown in Figure S1c,d. The N50 value of the unigenes was 1714 bp with an average length of 896 bp (ranging from 201 to 21,855 bp; Table S1b), and 33.96% of the unigenes were longer than 300 bp (Figure S1b). The relative expression level of each unigene, which was estimated based on the FPKM approach, ranged from 0 to 14,810.83 FPKM with an average of 8.24 FPKM. Of the 48,044 unigenes, 38,202 (79.51%) were expressed at low levels (i.e., less than 10 FPKM) (Table S2).
3.3. Functional Classification of P. orientalis Unigenes
To verify and annotate the unigenes, all of the assembled sequences were initially used as queries in a BLASTx search of the Nr and Swiss-Prot protein databases. Among the 48,044 unigenes, 24,080 (50.12%) had significant hits in the Nr database, and 18,483 (38.47%) had significant matches to proteins in the Swiss-Prot database (Table 1).

Table 1.
Functional annotation of the Platycladus orientalis transcriptome.
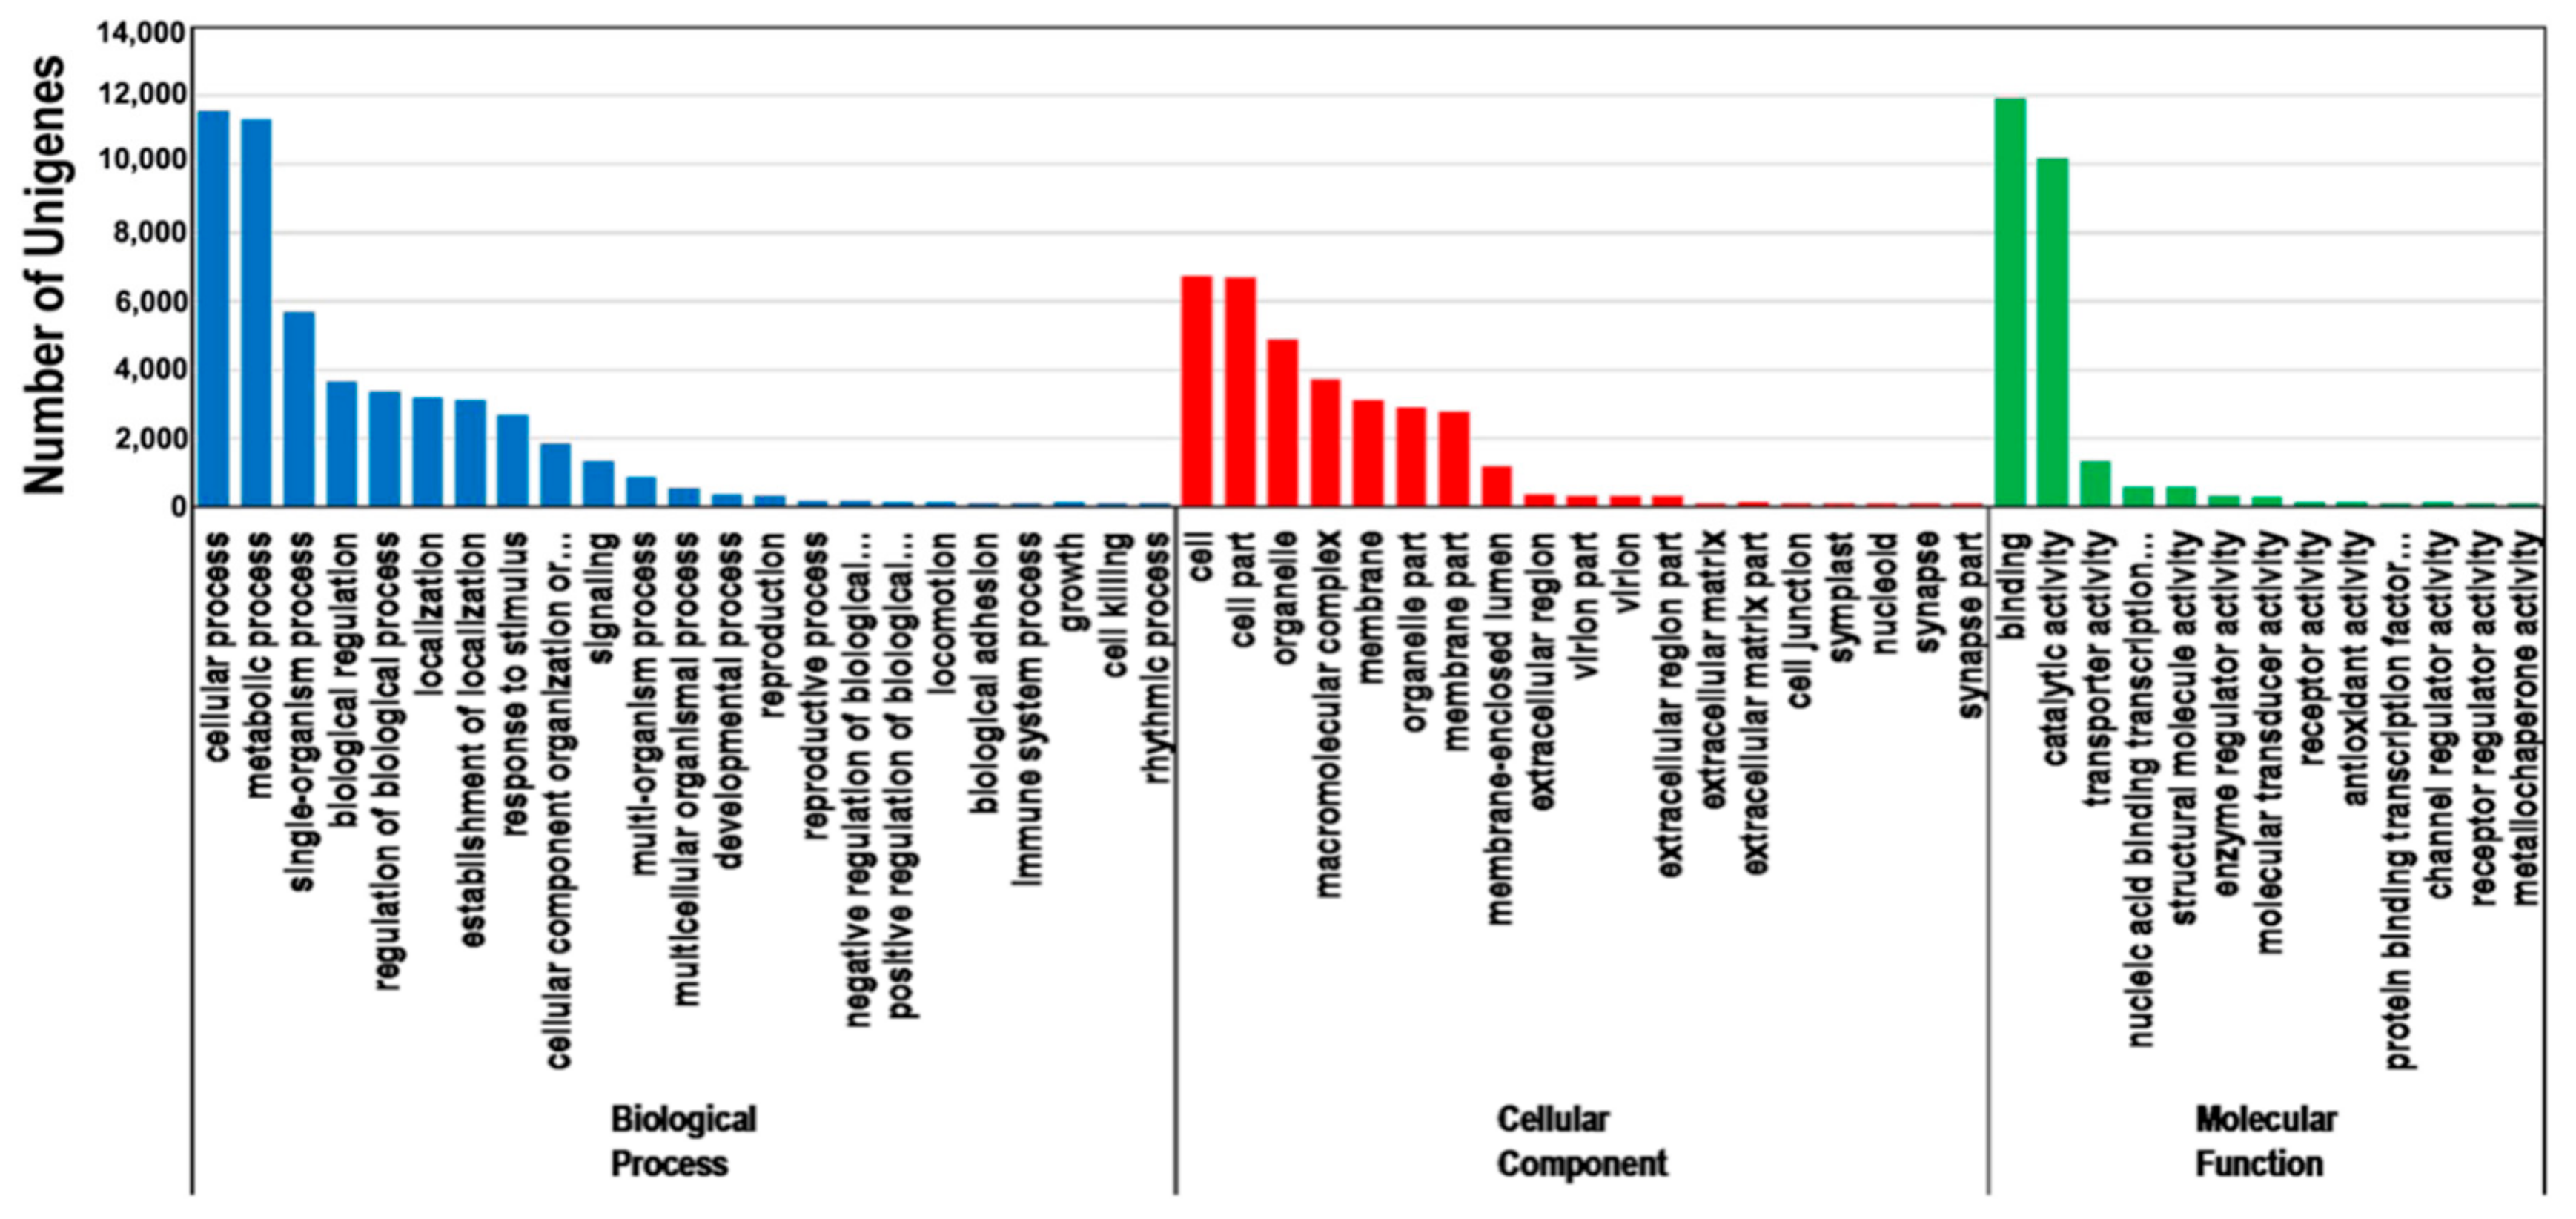
The annotated unigenes were grouped into the three main GO categories. A total of 20,029 unigenes were annotated according to the GO database (Table 1). The enriched GO terms in the biological process category were cellular processes (11,580 unigenes), metabolic processes (11,322 unigenes), and single-organism processes (5710 unigenes). Only a few unigenes were involved in growth (52 unigenes), cell killing (22 unigenes), and rhythmic processes (8 unigenes). Regarding the cellular component category, the enriched GO terms were cell (6734 unigenes), cell part (6717 unigenes), and organelle (4910 unigenes). Only 1, 1, and 6 unigenes were annotated with the synapse, synapse part, and nucleoid GO terms, respectively. In terms of the molecular function category, the enriched GO terms were binding, catalytic, and transporter activities, with 11,929, 10,181, and 1333 unigenes, respectively. Only 4 and 8 unigenes had metallochaperone and receptor regulatory activities, respectively (Figure 3).

Figure 3.
Gene Ontology (GO) classifications of the assembled unigenes. The main functional annotations in the biological process, cellular component, and molecular function categories are presented. Bars represent the number of Platycladus orientalis proteins with BLASTX matches to each GO term. One unigene may be matched to multiple GO terms.
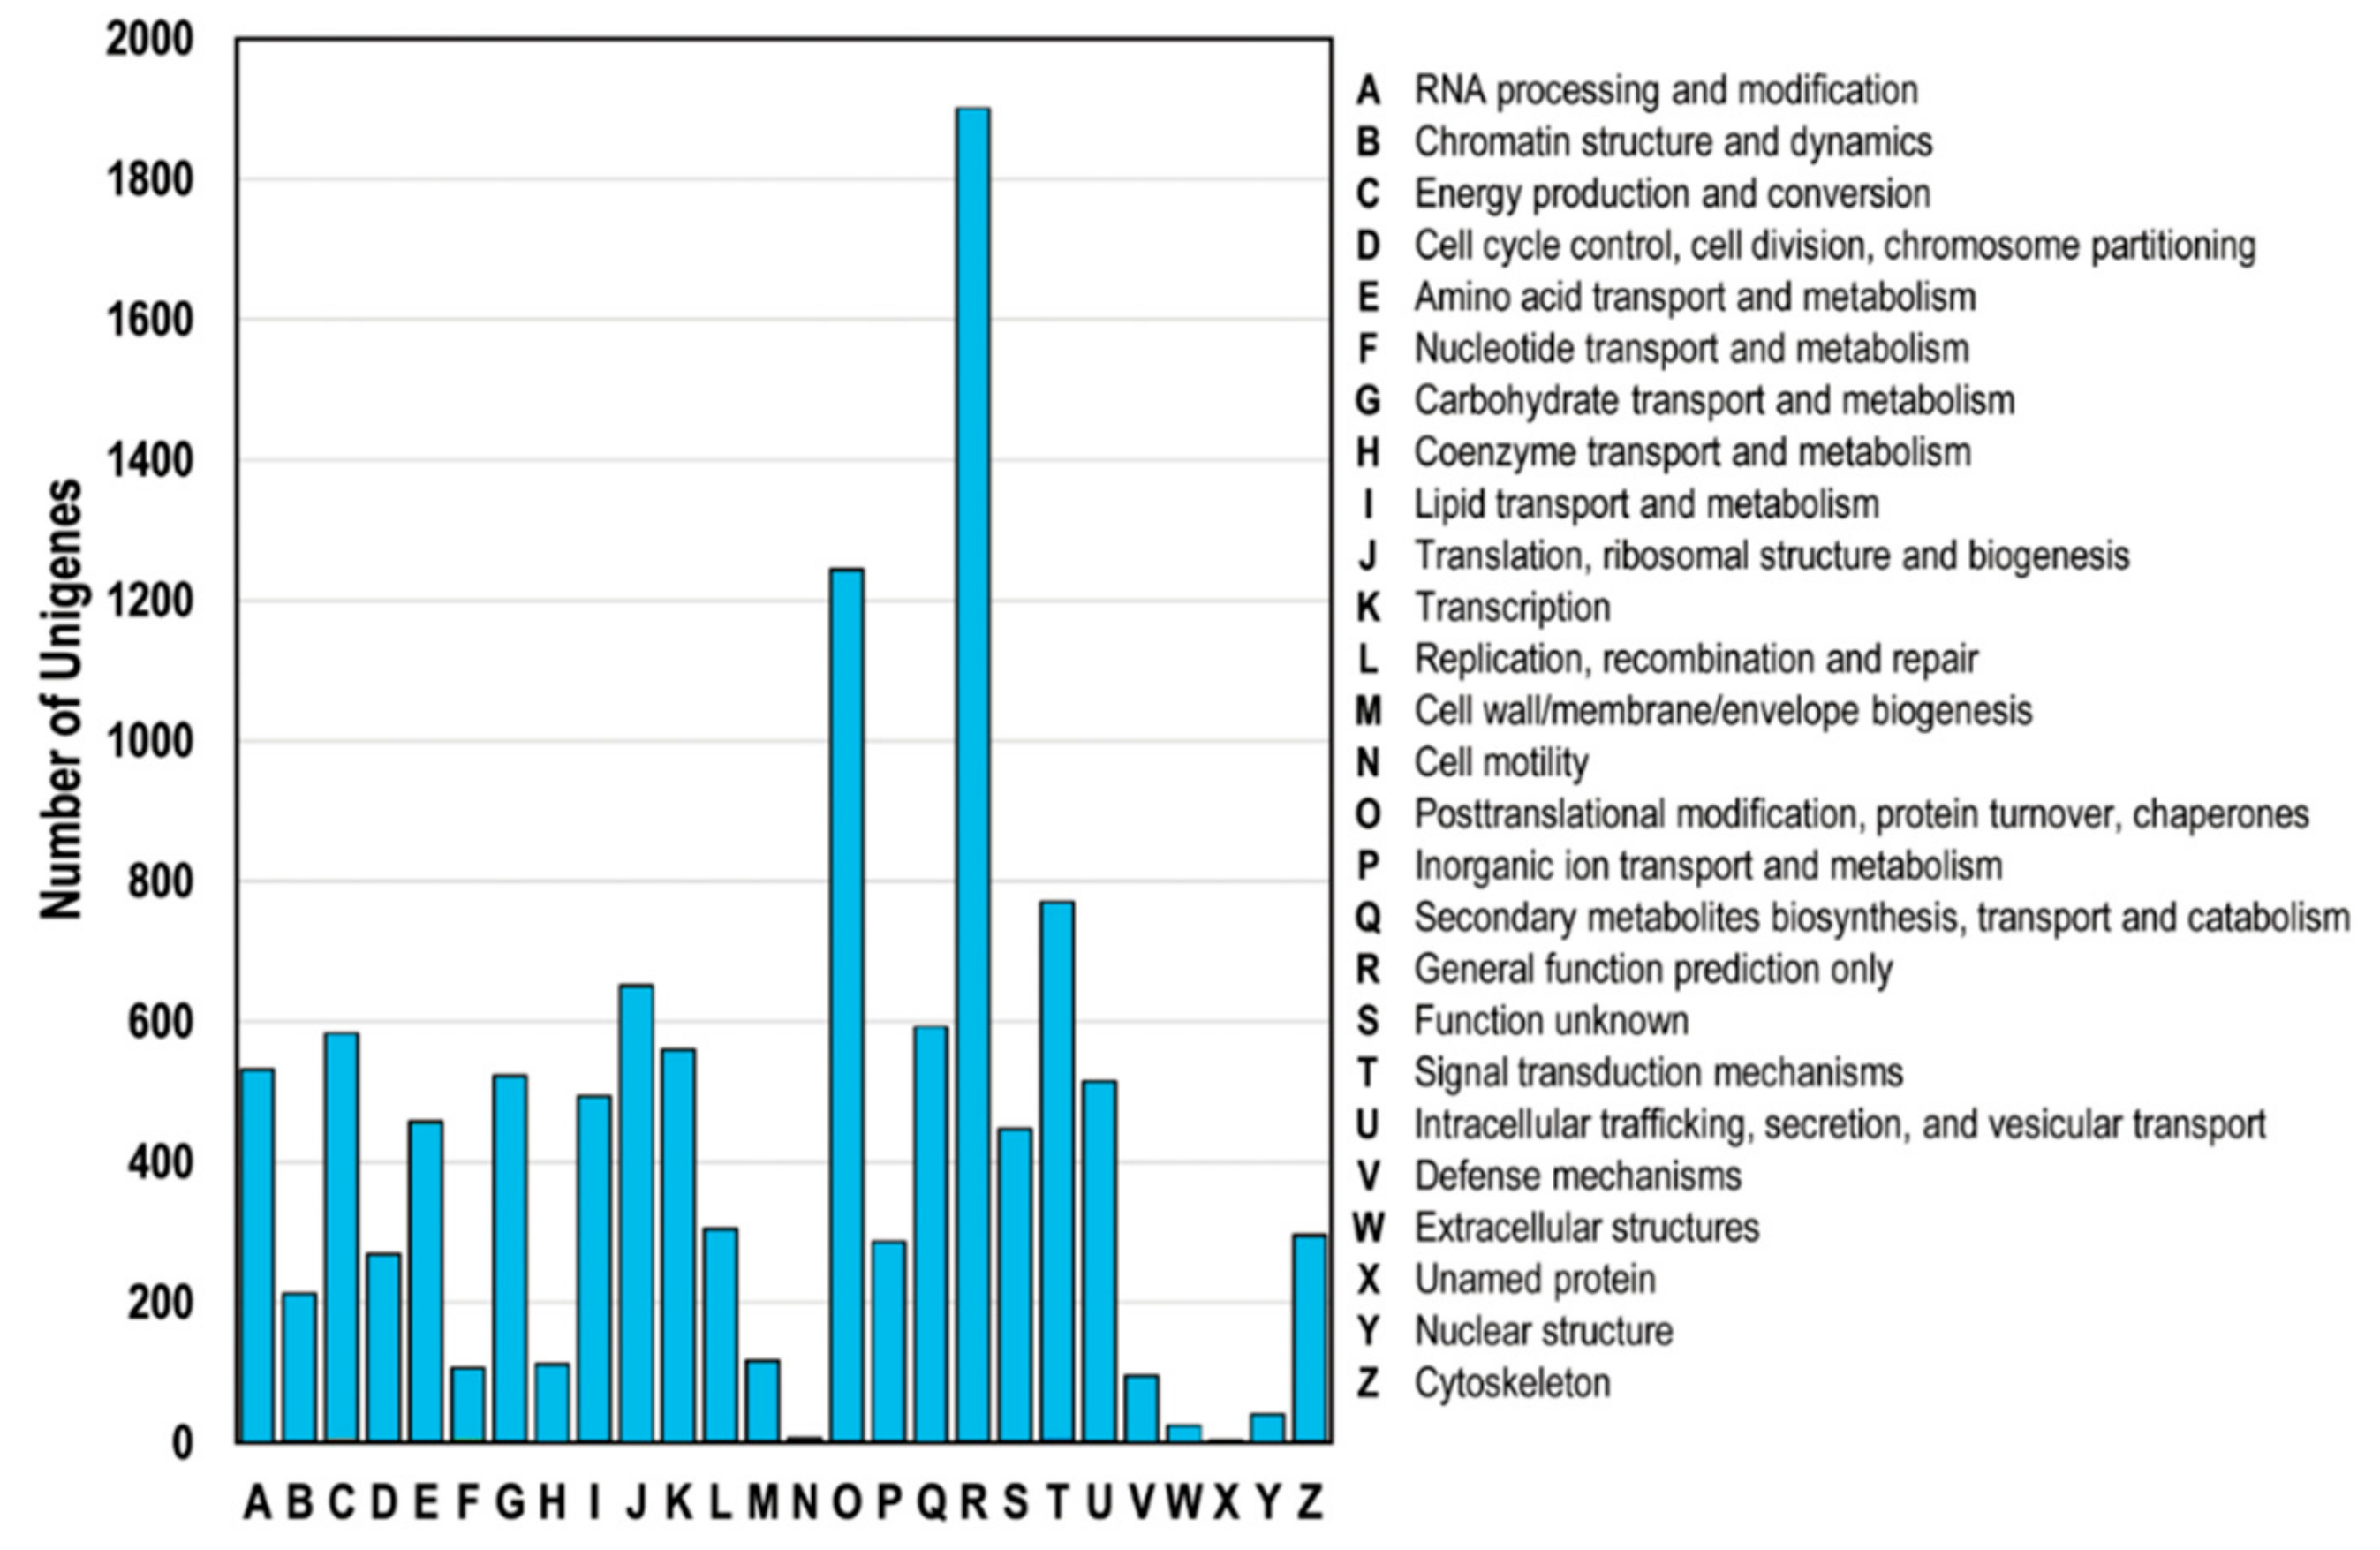
All unigenes were classified based on the COG database, ultimately resulting in the classification of the putative proteins into at least 25 functional groups (Figure 4). Specifically, the unigenes were categorized into the general function prediction (R, 1902 unigenes), post-translational modification (O, 1245 unigenes), signal transduction mechanisms (T, 770 unigenes), and translation (J, 651 unigenes) categories.

Figure 4.
Clusters of orthologous groups (COG) classification. A total of 4044 unigenes with NCBI non-redundant protein (Nr) hits were grouped into 26 COG terms. The y-axis represents the the number of unigenes.
To further explore the involvement of the identified unigenes in metabolic pathways, we screened the KEGG database with the unigenes as queries. Based on functional annotations, the KEGG pathways were categorized into five main classes, among which the metabolism pathway included the most unigenes. A total of 835 and 610 unigenes were associated with carbohydrate metabolism and amino acid metabolism, respectively. Another 498 and 482 unigenes were related to energy metabolism and lipid metabolism, respectively (Figure 5).
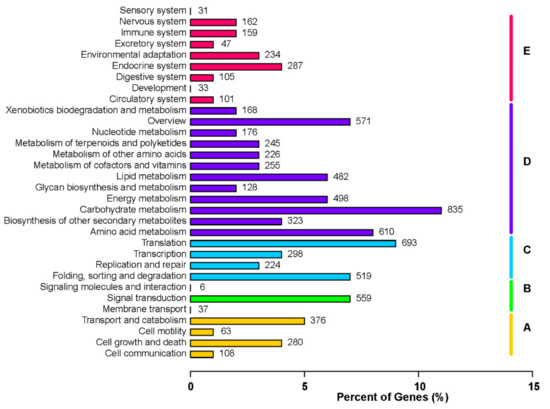
Figure 5.
Functional annotation of unigenes based on the Kyoto Encyclopedia of Genes and Genomes (KEGG) categorizations. Main functional categories are summarized as follows: (A) cellular processes, (B) environmental information processing, (C) genetic information processing, (D) metabolism, and (E) organismal systems. Bars represent the number of Platycladus orientalis unigenes with BLASTX matches to KEGG pathways. The x-axis indicates the number of genes annotated with a particular pathway out of the total number of annotated genes (%).
3.4. Identification of DEGs during Senescence
To investigate the molecular differences among the four analyzed tree ages, the gene expression levels were compared between ages to identify significant DEGs, with p < 0.05 as the threshold for significance (Figure 6a). The comparison between 1100- and 20-year-old trees resulted in the most DEGs (214 DEGs), followed by the comparisons between 1100- and 200-year-old trees (148 DEGs), 200- and 20-year-old trees (81 DEGs), and 700- and 20-year-old trees (62 DEGs). Only 14 DEGs were identified in the comparison between 700- and 200-year-old trees (Figure 6b). Thus, gene expression was most divergent between the leaves from the youngest (20-year-old) and the oldest (1100-year-old) trees, whereas the gene expression profiles in the leaves from the two middle-aged (200- and 700-year-old) trees were closer (i.e., the fewest DEGs).
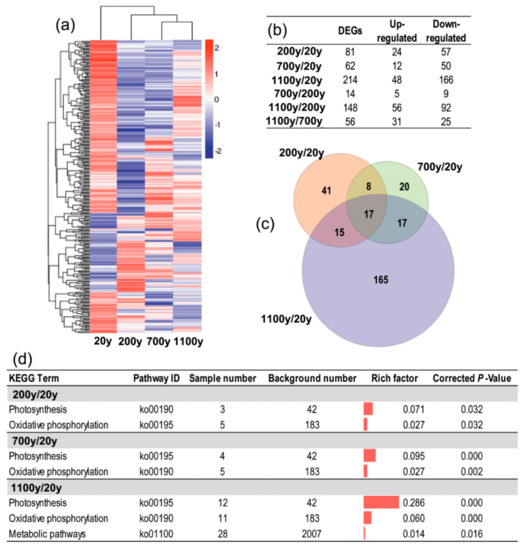
Figure 6.
Analysis of differentially expressed genes (DEGs) among the four analyzed Platycladus orientalis ages. (a) The heatmap of DEGs in pairwise comparisons; (b) Number of DEGs in pairwise comparisons; (c) A Venn diagram of the number of unique and common DEGs between different stages; (d) Significantly enriched KEGG pathways (corrected p-value < 0.05) in three comparisons (200-/20-year-old, 700-/20-year-old, and 1100-/20-year-old).
An analysis of the distribution of the DEGs among the three comparisons (200-/20-year-old, 700-/20-year-old, and 1100-/20-year-old) revealed that 17 unigenes were differentially expressed in all three comparisons (Figure 6c, Table S3). Moreover, the comparison between 1100- and 20-year-old trees had the most DEGs that were specific to a particular comparison (165 of 214). Thus, aging may affect gene expression at the transcriptome level. Furthermore, the KEGG pathway enrichment analysis indicated that the photosynthesis (ko00190) and oxidative phosphorylation (ko00195) pathways were significantly enriched in the three comparisons (200-/20-year-old, 700-/20-year-old, and 1100-/20-year-old), but they were most highly enriched in the 1100-/20-year-old comparison (0.286 for the photosynthesis and 0.060 for the oxidative phosphorylation pathways). Additionally, metabolic pathways were specifically enriched in the 1100-/20-year-old comparison (Figure 6d).
3.5. Functional Classification of DEGs
To further investigate the functional classifications of the DEGs, we performed a K-means cluster analysis, which revealed eight clusters with distinct expression patterns (Figure 7a, Table S4). Cluster 4 was the largest subset (136 genes), and the expression levels of the genes in this cluster were considerably down-regulated in the 1100-year-old samples. The genes in Cluster 3 (32 genes) had expression patterns consistent with those of the Cluster 4 genes. The functional classification analysis indicated that most of the genes in Clusters 3 and 4 were related to redox reactions, photosynthesis, and stress responses (Figure 7b). Additionally, the expression levels of the Cluster 1 genes, 26 genes mainly associated with photosynthesis, gradually decreased along with tree age. The expression levels of the 79 Cluster 5 genes were down-regulated in the 200- and 700-year-old samples. These genes were mainly transport-related genes. The expression levels of the genes in Cluster 2 (55 genes) gradually increased in 20- to 1100-year-old samples. These genes were primarily associated with transcription and senescence. Increases in the expression of genes contributing to signal transduction and protein processing occurred mainly in Clusters 2, 6, 7, and 8. Thus, the DEGs are involved in various functions.
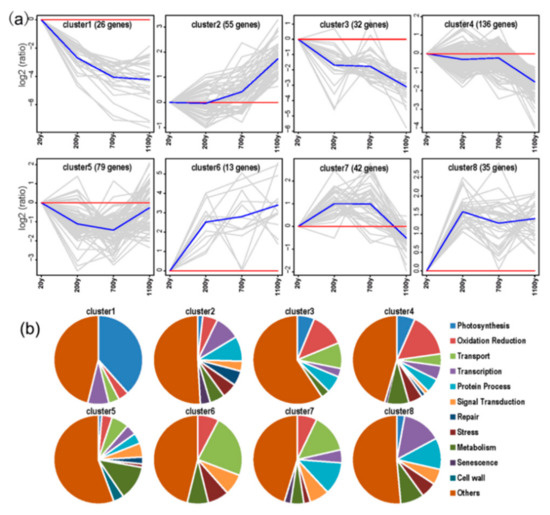
Figure 7.
K-means clustering of gene expression profiles. (a) The centers of eight clusters with different expression patterns. The number of genes in each cluster is indicated; (b) Functional classification of each cluster.
3.6. Expression Profiling of Differentially Regulated Genes by RT-qPCR
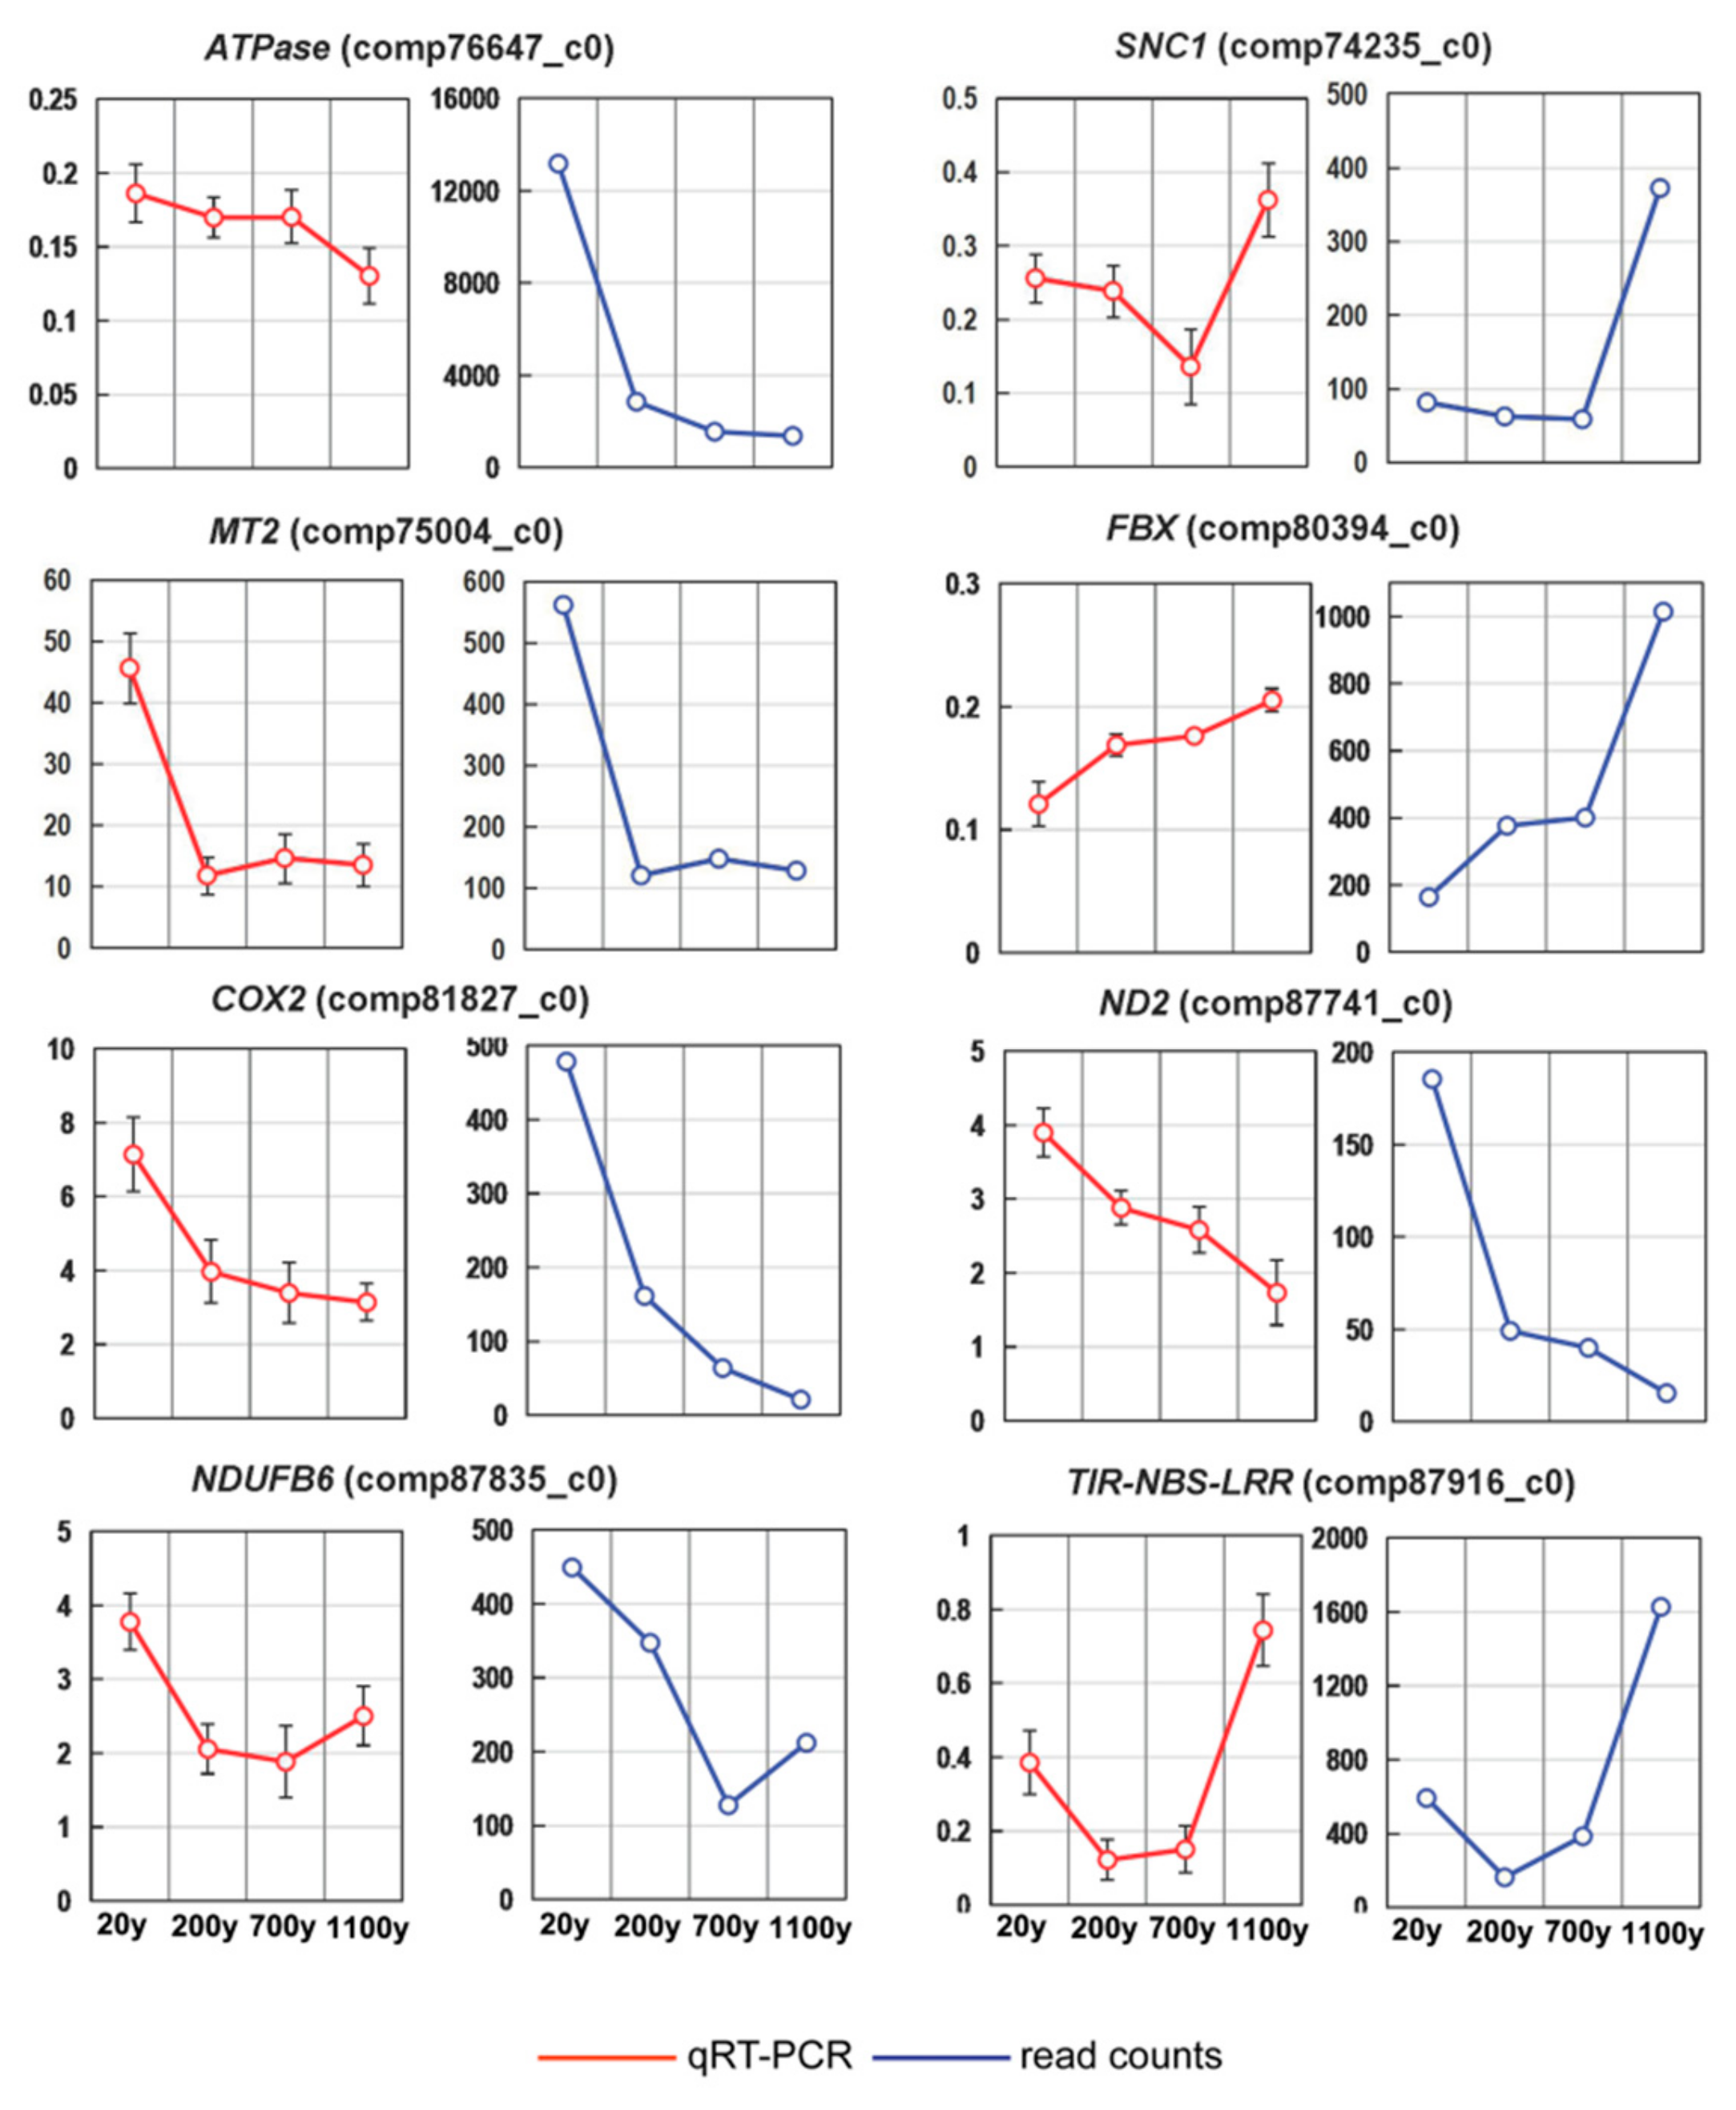
To validate the sequencing data and investigate the dynamic gene expression profiles, we analyzed the expression patterns of the following eight genes in a RT-qPCR assay: ATPase (ATP synthase subunit alpha), SNC1 (protein suppressor of npr1-1), MT2 (metallothionein-like protein class II), FBX (probable F-box protein), COX2 (cytochrome c oxidase subunit 2), ND2 (NADH dehydrogenase subunit 2), NDUFB6 (NADH-ubiquinone oxidoreductase chain 6), and TIR-NBS-LRR (putative truncated TIR-NBS-LRR protein-encoding gene) (Table S5). The expression levels of the selected genes were consistent between the RT-qPCR and RNA-seq data, confirming the reliability of our DEG results (Figure 8).
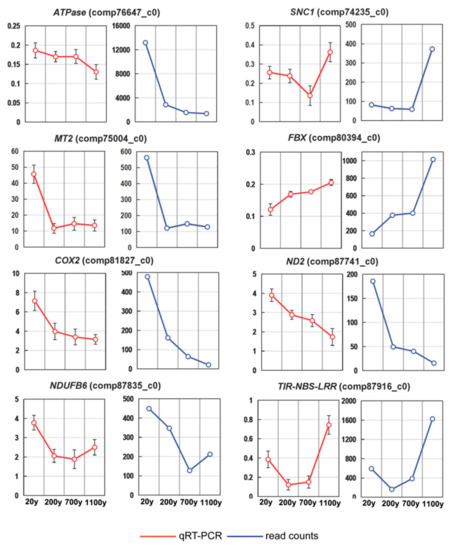
Figure 8.
Expression patterns of eight selected unigenes in Platycladus orientalis leaves. Verification of eight selected DEGs by RT-qPCR. The αTUB gene was used as the internal control. Both methods revealed similar gene expression trends. Red and blue lines correspond to the RT-qPCR and RNA-seq results, respectively. Vertical bars represent the mean ± SD of four separate experiments.
3.7. Down-Regulated Gene Clusters Resulted in Changes to Photosynthesis and the Redox Reaction
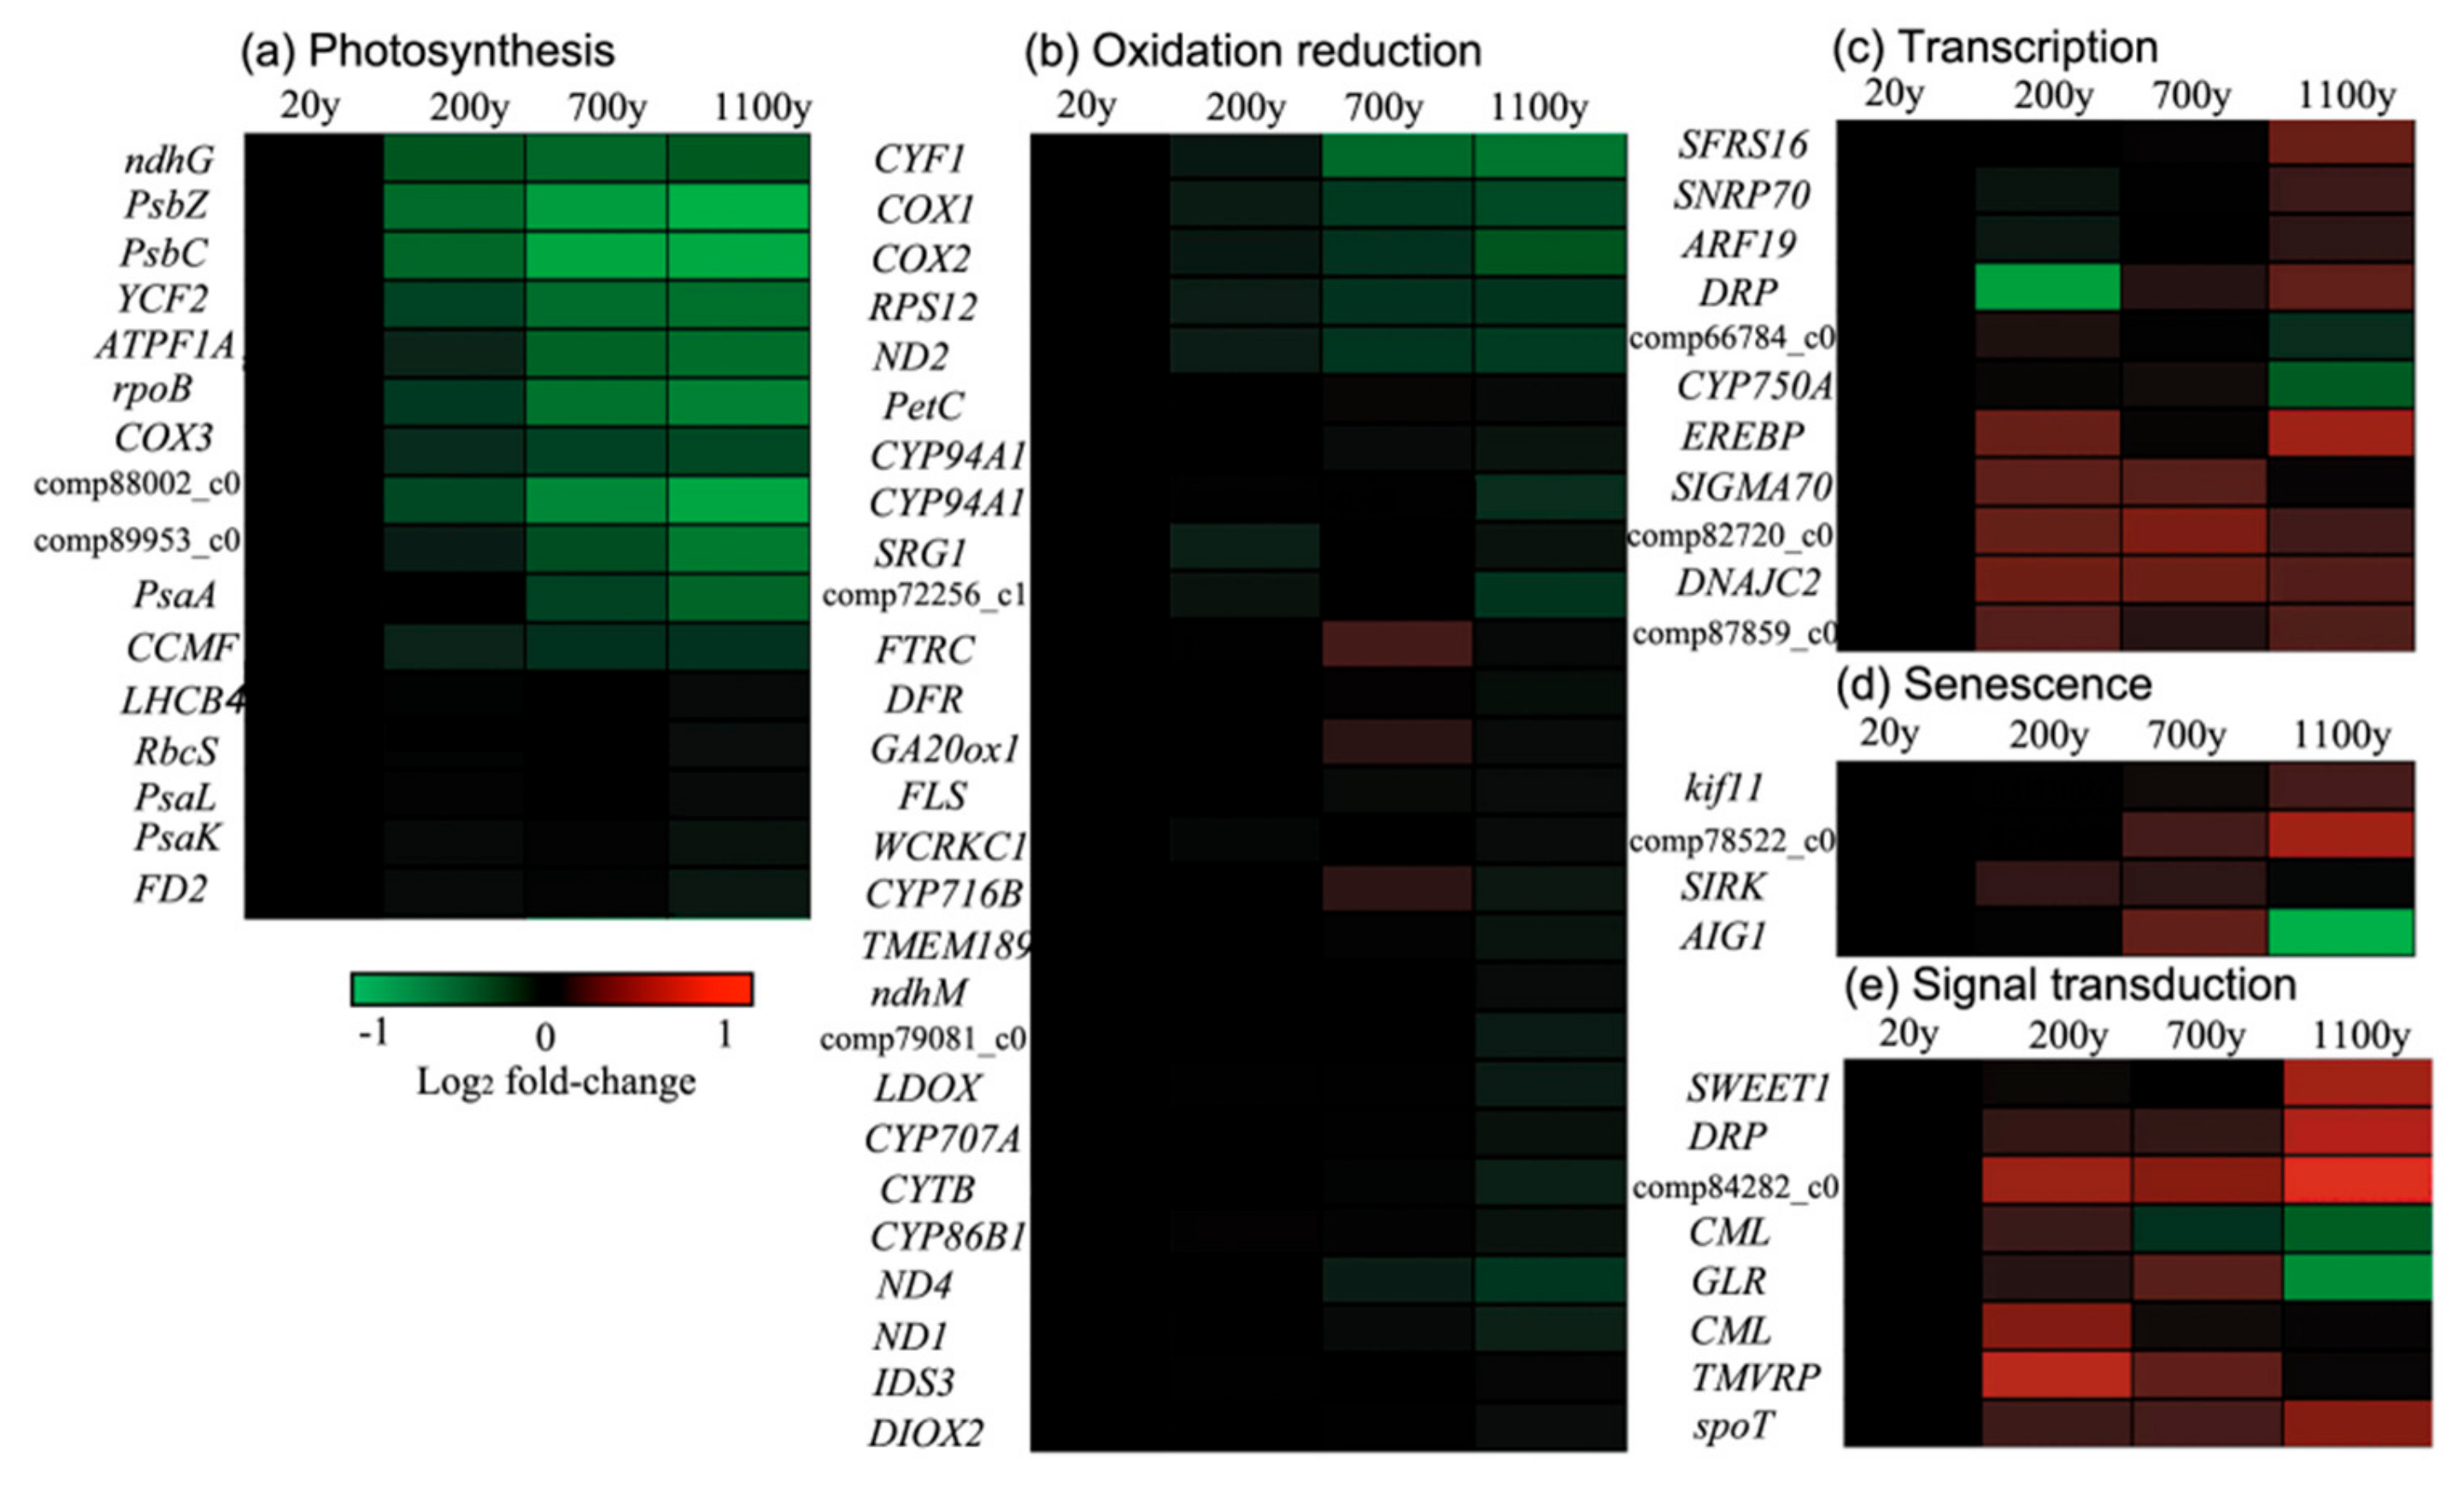
The expression levels of many photosynthesis-related genes were significantly down-regulated in Cluster 1 (Figure 9), as were the expression levels of many other genes encoding subunits of photosystem (PS) II complexes. In particular, the expression levels of the genes encoding PSII reaction center protein Z (PsbZ) and the PSII CP43 chlorophyll apoprotein decreased in a linear fashion along with tree age. In contrast, the expression levels of PSI-related genes, including PsaA and psaK were no substantial differences between 200- to 700-year-old samples in Cluster 3 and 4, illustrating that PSII is affected more than PSI during P. orientalis senescence. Moreover, the expression levels of genes involved in the redox reaction, such as COX1 (cytochrome c oxidase subunit 1) and COX2, as well as the gene encoding ribosomal protein S12, were significantly down-regulated in Clusters 1 and 3 (i.e., log2 fold-change > 1 in ancient P. orientalis samples relative to the expression level in the 20-year-old samples). Furthermore, Cluster 4 was composed of 22 redox reaction-related genes with expression levels that significantly decreased from 20- to 1100-year-old samples (i.e., log2 fold-change > 1). Genes involved in photosynthesis and the redox reaction, such as ATP94A1 (cytochrome P450 94A1) and DFR (dihydroflavonol-4-reductase), were expressed at lower levels in the 700-year-old samples than in the 20-year-old samples.
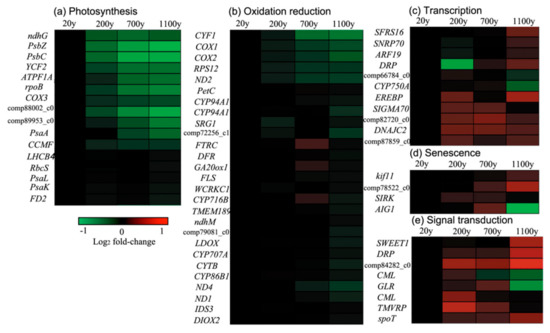
Figure 9.
Genes representing different functional classes and showing age-dependent changes in transcript level: (a) Photosynthesis, (b) Oxidation Reduction, (c) Transcription, (d) Senescence and (e) Signal transduction.
3.8. Up-Regulated Gene Clusters Resulted in Changes to Transcription, Signal Transduction, and Senescence
The expression levels of transcription-related genes involved with ethylene-responsive transcription factor 1A (EREBF) and DNAJ increased with the age of the P. orientalis trees in Clusters 2, 7, and 8, implying that these genes may encode proteins that function prior to senescence (Figure 8). Signal transduction-related genes involved with TMV (tobacco mosaic virus) resistance protein, disease resistance protein- and calmodulin-like protein (CML)-encoding genes in Clusters 2 and 7 were expressed at higher levels in young P. orientalis trees than in ancient trees (i.e., log2 fold-change > 1). The expression levels of protein processing-related genes (e.g., genes encoding the RING (really interesting new gene)-H2 finger protein and aspartic proteinase nepenthesin-2) and a SIRK gene increased with age in P. orientalis (Clusters 2 and 7). The identified genes that were more highly expressed in the ancient trees than in the 20-year-old trees are consistent with the likelihood that the ancient trees are undergoing senescence.
3.9. Validation of the Expression Kinetics of the Photosynthesis-Related Genes during Senescence
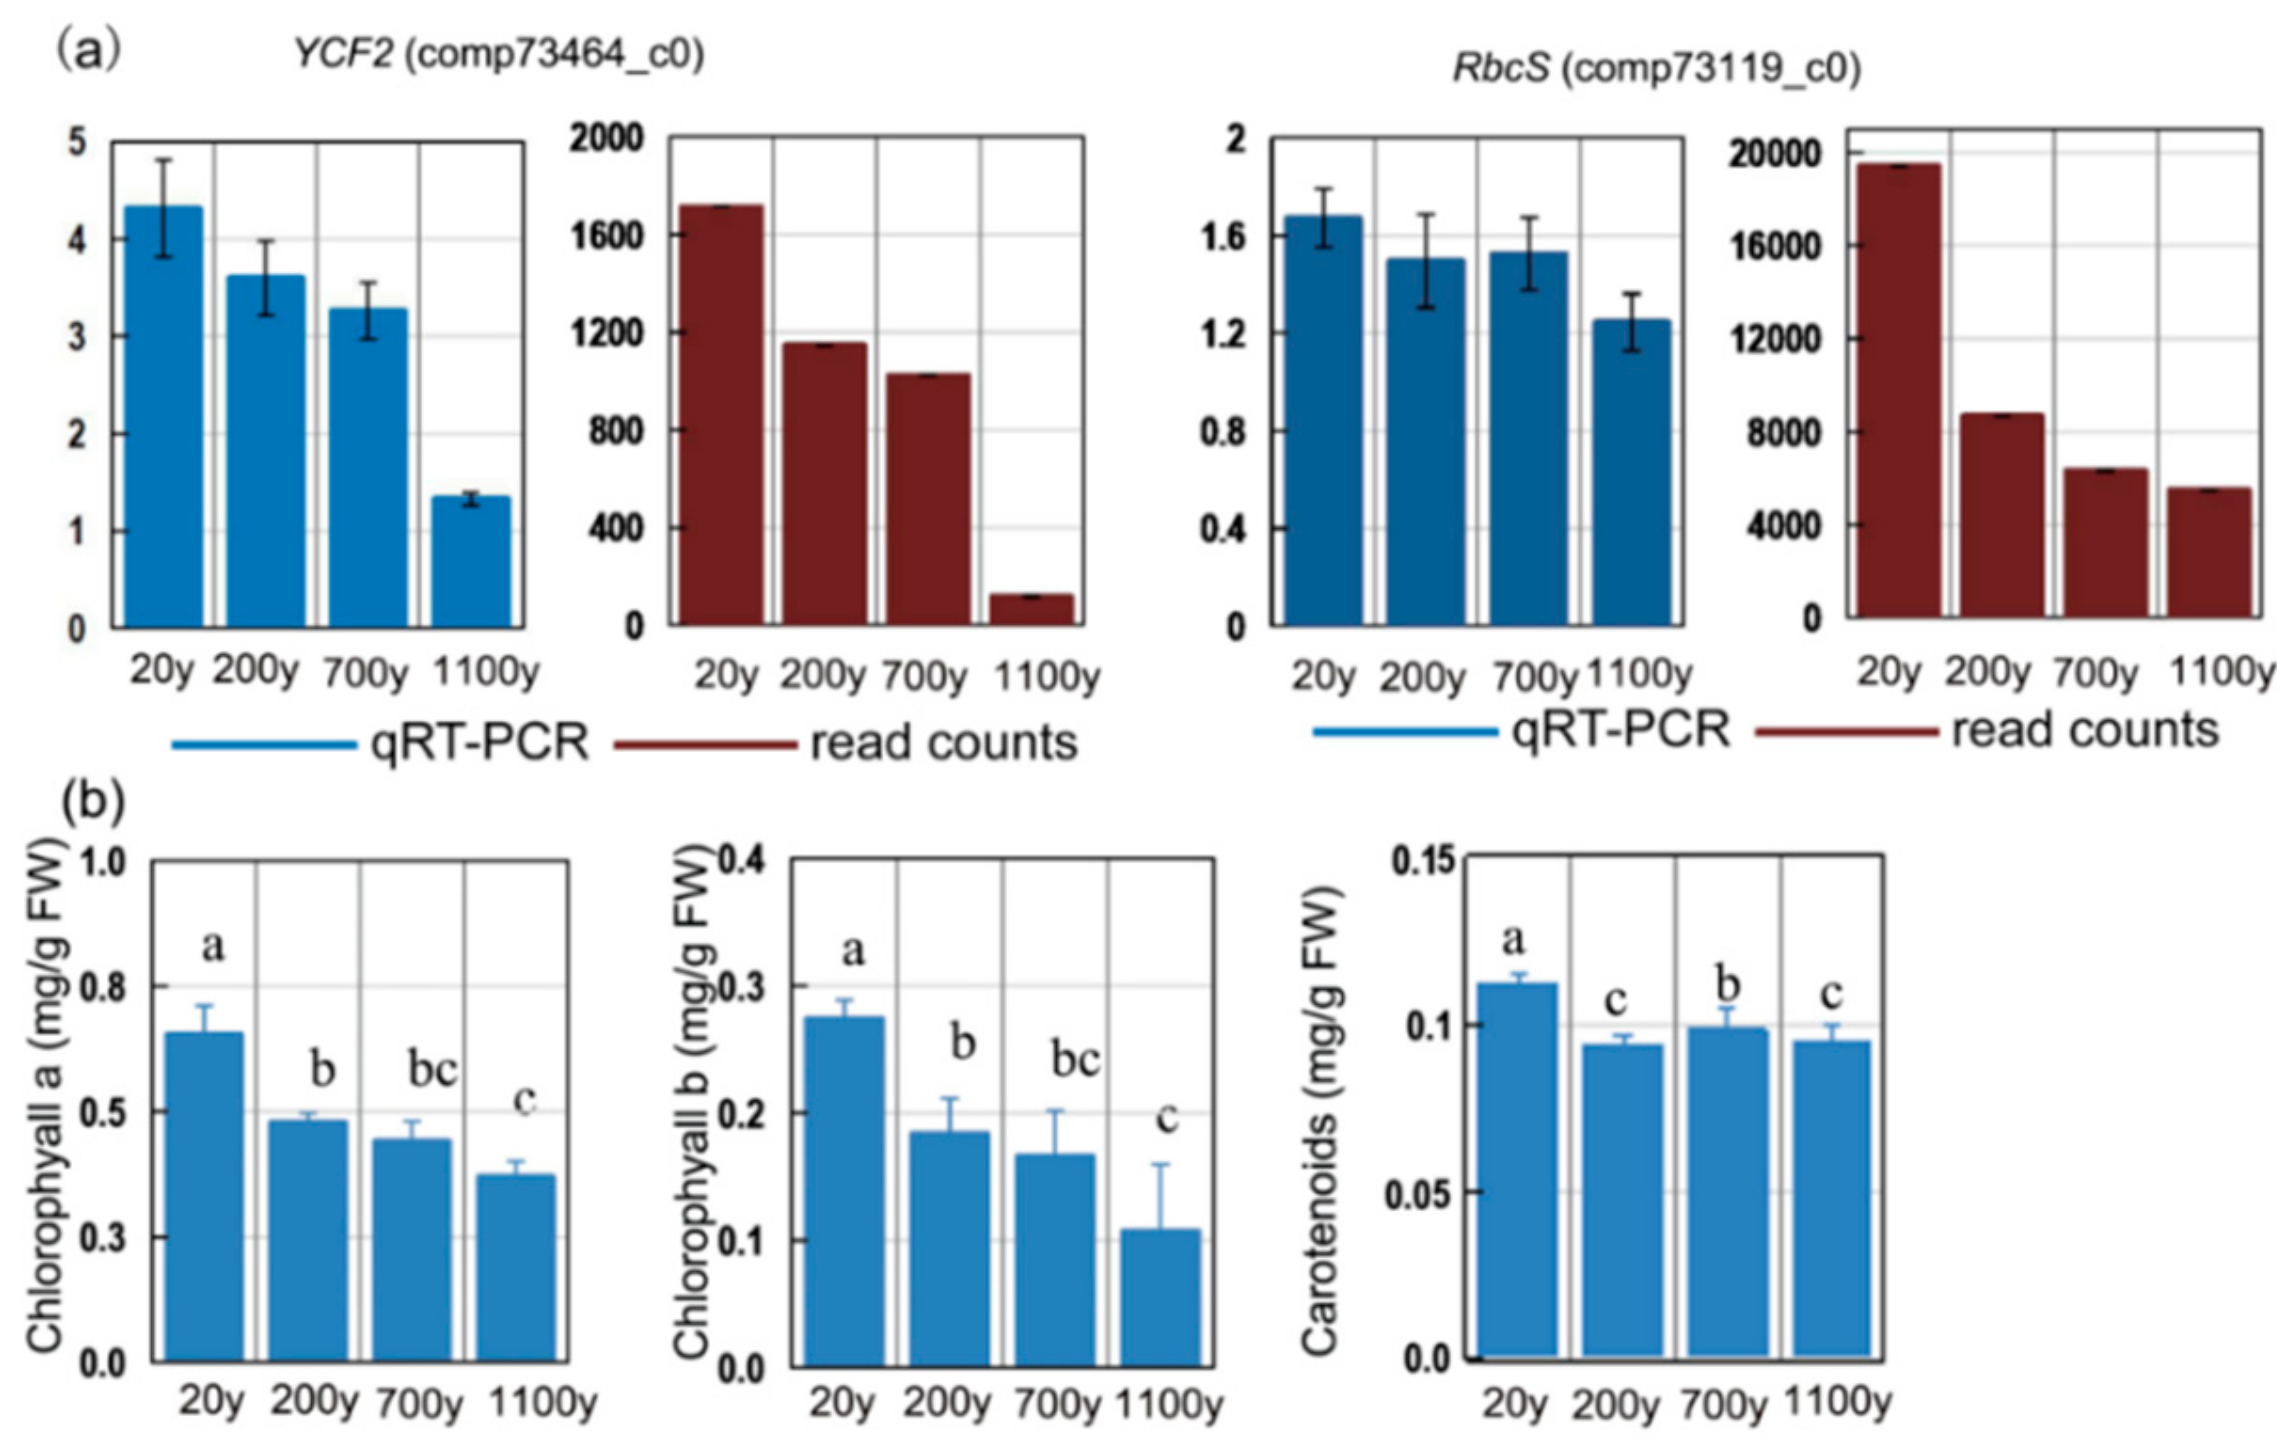
To obtain reference data for photosynthesis-related genes that showed age-dependent transcript level profiles in P. orientalis, we analyzed the RbcS and YCF2 expression profiles. The RbcS and YCF2 expression levels decreased in P. orientalis with age (Figure 10a; Table S6). These results suggest that photosynthesis is regulated by nuclear- and chloroplast-related genes.

Figure 10.
(a) Expression patterns of photosynthesis-related unigenes in Platycladus orientalis leaves. Verification of four selected DEGs by RT-qPCR. Blue and red columns correspond to the RT-qPCR and RNA-seq results, respectively. The αTUB gene was used as the internal control. (b) chlorophyll a and b and carotenoids contents. All data points are means ± SD (n = 3). Means in each column followed by different lowercase letters are significantly different (p < 0.05).
3.10. Age-Related Chlorophyll Level Changes in P. orientalis
To clarify the expression-level changes of photosynthesis-related genes associated with age in P. orientalis, we analyzed the fluctuations of the chlorophyll and carotenoid levels. Chlorophyll a and b levels were highest in the 20-year-old samples (p < 0.05; Figure 10b) and decreased steadily with age. The carotenoids were highly accumulated in 20-year-old samples and had the lowest concentration in the 200-year-old samples. The trends in the changes to the chlorophyll levels during senescence implies that our DEG results are reliable.
4. Discussion
Senescence of trees can be affected by many external cues and internal factors, including heat stress, cold stress, and age [9]. In this study, the transcriptome results provide comprehensive and reasonable data resources for gene expression analyses of different-aged P. orientalis. Noticeably, the expression of genes in photosynthesis and oxidative phosphorylation pathways was down-regulated substantially along with age of P. orientalis. Similarly, the homologous of these genes were also down-regulated during senescence in Populus tremula and Arabidopsis thaliana, which is consistent with their involvement in the senescence of ancient trees [10,26]. This shows that the physiology of ancient P. orientalis is greatly influenced by age.
Chlorophyll level is an effective marker for the progression of senescence because it decreases during senescence in leaves of ancient P. orientalis, as well as in P. tremula and A. thaliana [10,26]. In parallel with chloroplast degeneration, the transcript levels of photosynthesis-related genes, including PsaA, PsbZ, RBcS, and ATPF1A, declined along with tree age. The similar results were reported for the senescent leaves of P. tremula and P. orientalis [4,38]. The PsaA gene encodes a PSI reaction center protein, and PsaA/PsaB polymers are necessary for the assembly of the PSI complex. In apple leaves, PsbZ is the main site of the photosynthetic apparatus that is damaged because of senescence [39]. Additionally, the light system is an important reactive site for the conversion of light energy into chemical energy [40]. Energy is required for ATP degradation and transport out of the cell during senescence. The ATPF1A gene encodes a key enzyme for energy metabolism—its down-regulation suggested significant physiological differences between ancient and young trees, similar to that observed in Pinus ponderosa [41]. Moreover, ATP is a significant factor in the regulation of mitochondrial redox activity and ROS production.
Decreased expression of photosynthesis-related genes will improve the reducibility of the electron transfer chain and increase the chances of electron leakage and ROS generation [42]. In this study, MDA content increased in leaves of ancient P. orientalis, whereas chlorophyll levels and SOD and POD activity declined (Figure 11), which is consistent with an earlier study of ancient pine [4]. These findings indicate that the ROS scavenging capabilities of ancient trees are weakened, resulting in ROS accumulation in ancient trees during aging [3]. As shown in Figure 10b, the leaves of 20-year-old trees have the highest carotenoid content, followed by 700-, 1100- and 200-year-old trees. Carotenoids comprise a large group of compounds, which may differ in the capacity to interact with free medicals and singlet oxygen and therefore act as effective antioxidants [43]. However, further studies are needed to confirm its role in P. orientalis senescence. In addition, Cys and aspartic proteases may play an important role during chloroplast degradation [26]. Our data indicate that most of the cellular proteins, such as aspartic proteinases, are highly expressed in ancient P. orientalis. The SIRK genes participate in apoptosis and programmed cell death [44]. Senescence may be followed by an increase in protein hydrolysis. The study of senescence-associated gene functional networks homologous to that of P. orientalis will increase our understanding of anti-stress activities in P. orientalis.
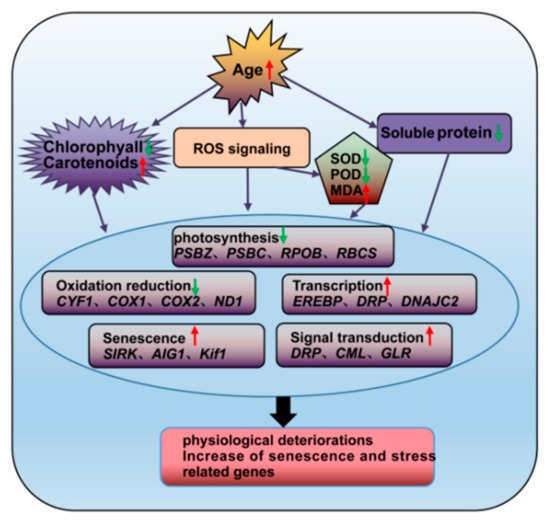
Figure 11.
Schematic representation of the changes in the regulatory characteristics and gene expression levels of P. orientalis during aging. Red and green arrows represent ascend and descend, respectively.
Senescence decreases the photosynthetic ability of P. orientalis to change redox reactions for active growth and development [45]. During P. orientalis aging, the genes involved in redox reactions are down-regulated. Most of these genes are related to oxidative phosphorylation, which is consistent with their roles during senescence in soybean leaves [46]. The expression levels of the genes encoding three main components of the COX cascade, COX1, COX2, and COX3, are down-regulated in response to low-temperature stress [47,48]. COX family plays a major role in the process of respiration, and our results suggest a reduction in the capability to convert chemical energy in ancient P. orientalis. Additionally, cytochrome P450 genes, including CYP716B1, CYP86B1, and CYP94A1, are involved with various oxidation reactions in plants [49]. They are also important for plant resistance to diseases and other stresses. In Vicia sativa, CYP94A1 might play a role in cutin biosynthesis, with implications for stress resistance [50]. These genes were highly expressed in 20-year-old trees, suggesting the young P. orientalis trees have a stronger resistance to disease than ancient trees. These observations imply that the inhibited redox reaction and abnormal energy metabolism results in various physiological metabolic changes during aging of slowly growing ancient trees.
5. Conclusions
In this study, the results of the physiological tests showed that the chlorophyll levels as well as the SOD and POD activities decline in leaves of ancient P. orientalis. De novo transcriptome analysis revealed 418 senescence-induced genes in P. orientalis trees. Age-specific differences in the transcriptome were most pronounced between 20- and 1100-year-old trees of P. orientalis. The expression levels of photosynthesis-, redox-, and transporter-related genes were down-regulated in ancient P. orientalis trees. The up-regulated genes are related to protein hydrolysis, senescence, transcription, and signal transduction, which imply that the ancient P. orientalis trees were undergoing senescence. In addition, the physiological data show that the chlorophyll a and b levels decrease steadily with P. orientalis age. The data presented herein suggest that the young P. orientalis trees are more resistant to long-term environmental stresses than the ancient trees. Through integrating RNA-Seq data with physiological and biochemical data, we provide insight into the molecular mechanisms regulating senescence and stress resistance in ancient P. orientalis trees. Consequently, the processes associated with senescence will need to be more comprehensively characterized in future studies.
Supplementary Materials
The following are available online at https://www.mdpi.com/1999-4907/10/5/393/s1. Figure S1: Overview of Platycladus orientalis transcriptome sequencing and assembly. (a) Classification of raw reads after filtering and trimming adapters; (b) Transcript and Unigene length interval, the x-axis represents the length interval; (c/d) Transcript/unigene length distribution, the y-axis represents the length frequency; Table S1: Summaries of transcriptome sequencing and assembly for Platycladus orientalis; Table S2: Read counts and FPKM values of Platycladus orientalis unigenes; Table S3: Seventeen unigenes were differentially expressed in all three comparisons (200-/20-year-old, 700-/20-year-old, and 1100-/20-year-old); Table S4: K-Means clustering of gene expression profiles; Table S5: Primers of candidate genes for RT-qPCR in Figure 8; Table S6: Primers of photosynthesis-related unigenes for RT-qPCR in Figure 10.
Author Contributions
E.C., Z.J. and X.Y. conceived and designed the experiments. E.C., X.Y., S.T. and N.D. participated in the experiments. E.C., X.Z., J.L. and J.Z. performed data analysis and drafted the manuscript. J.Z. and S.S. provided reagents and analysis tools. All authors read and approved the final version of the manuscript.
Funding
This work was supported by the National Non-Profit Research Institutions of the Chinese Academy of Forestry [grant numbers: CAFYBB2017ZA007] and the National Natural Science Foundation of China [grant number 31870664].
Acknowledgments
The authors thank the Zhongshan Park (Beijing, China) for providing the P. orientalis samples. We thank Lesley Benyon, from Liwen Bianji, Edanz Group China, for editing the English text of a draft of this manuscript.
Conflicts of Interest
The authors declare no conflict of interest.
References
- Munné-Bosch, S. Aging in perennials. Crit. Rev. Plant Sci. 2007, 26, 123–138. [Google Scholar]
- Chang, E.; Jin, Z.; Nan, D.; Yao, X.; Liu, J.; Zhao, X.; Jiang, Z.; Shi, S. Transcriptome differences between 20- and 3000-year-old Platycladus orientalis reveals ROS involved in senescence regulation. Electron. J. Biotechn. 2017, 29, 68–77. [Google Scholar]
- Zhang, S.; Zhang, L.; Chai, Y.; Wang, F.; Li, Y.; Su, L.; Zhao, Z. Physiology and proteomics research on the leaves of ancient Platycladus orientalis (L.) during winter. J. Proteomics 2015, 126, 263–278. [Google Scholar] [CrossRef] [PubMed]
- Nemoto, S.; Finkel, T. Ageing and the mystery at Arles. Nature 2004, 429, 149–152. [Google Scholar] [CrossRef]
- Klimešová, J.; Nobis, M.P.; Herben, T. Senescence, ageing and death of the whole plant: Morphological prerequisites and constraints of plant immortality. New Phytol. 2015, 206, 14–18. [Google Scholar] [CrossRef]
- Sillett, S.C.; Van Pelt, R.; Carroll, A.L.; Kramer, R.D.; Ambrose, A.R.; Trask, D. How do tree structure and old age affect growth potential of California redwoods? Ecol. Monogr. 2015, 85, 181–212. [Google Scholar] [CrossRef]
- Lanner, R.M.; Connor, K.F. Does bristlecone pine senesce? Exp. Gerontol. 2001, 36, 675–685. [Google Scholar] [CrossRef]
- Flanary, B.E.; Kletetschka, G. Analysis of telomere length and telomerase activity in tree species of various life-spans, and with age in the bristlecone pine Pinus longaeva. Biogerontology 2005, 6, 101–111. [Google Scholar] [CrossRef] [PubMed]
- Munné-Bosch, S. Do perennials really senesce? Trends Plant Sci. 2008, 13, 216–220. [Google Scholar] [CrossRef]
- Martínez, D.E.; Guiamet, J.J. Senescence-related changes in the leaf apoplast. J. Plant Growth Regul. 2014, 33, 44–55. [Google Scholar] [CrossRef]
- Peñuelas, J. Plant physiology: A big issue for trees. Nature 2005, 437, 965–966. [Google Scholar] [CrossRef] [PubMed]
- Issartel, J.; Coiffard, C. Extreme longevity in trees: Live slow, die old? Oecologia 2011, 165, 1–5. [Google Scholar] [CrossRef]
- Gupta, D.K.; Pena, L.B.; Romero Puertas, M.C.; Hernández, A.; Inouhe, M.; Sandalio, L.M. NADPH oxidases differentially regulate ROS metabolism and nutrient uptake under cadmium toxicity. Plant Cell Environ. 2016, 40, 509–526. [Google Scholar] [CrossRef] [PubMed]
- Huang, J.; Gu, M.; Lai, Z.; Fan, B.; Shi, K.; Zhou, Y.H.; Yu, J.Q.; Chen, Z. Functional analysis of the Arabidopsis PAL gene family in plant growth, development, and response to environmental stress. Plant Physiol. 2010, 153, 1526–1538. [Google Scholar] [CrossRef]
- Palma, J.M.; Río, L.A.D. Antioxidative enzymes from chloroplasts, mitochondria, and peroxisomes during leaf senescence of nodulated pea plants. J. Exp. Botany 2006, 57, 1747–1758. [Google Scholar] [CrossRef]
- Keskitalo, J.; Bergquist, G.; Gardeström, P.; Jansson, S. A cellular timetable of autumn senescence. Plant Physiol. 2005, 139, 1635–1648. [Google Scholar] [CrossRef] [PubMed]
- Munné-Bosch, S.; Alegre, L. Plant aging increases oxidative stress in chloroplasts. Planta 2002, 214, 608–615. [Google Scholar]
- Juvany, M.; Müller, M.; Munné-Bosch, S. Plant age-related changes in cytokinins, leaf growth and pigment accumulation in juvenile mastic trees. Environ. Exp. Botany 2013, 87, 10–18. [Google Scholar] [CrossRef]
- Luo, Z.; Guan, H.; Zhang, X.; Liu, N. Photosynthetic capacity of senescent leaves for a subtropical broad leaf deciduous tree species Liquidambar formosana Hance. Sci. Rep. 2017, 7, 6323. [Google Scholar] [CrossRef]
- Zhang, Z.; Li, G.; Gao, H.; Zhang, L.; Yang, C.; Liu, P.; Meng, Q. Characterization of photosynthetic performance during senescence in stay-green and quick-leaf-senescence Zea mays L. Inbred Lines. PLoS ONE 2012, 7, e42936. [Google Scholar] [CrossRef]
- Gonzales, D.H.; Neupert, W. Biogenesis of mitochondrialc-type cytochromes. J. Bioenerg. Biomembr. 1990, 22, 753–768. [Google Scholar]
- Reich, P.B.; Tjoelker, M.G.; Machado, J.; Oleksyn, J. Universal scaling of respiratory metabolism, size and nitrogen in plants. Nature 2006, 439, 457–461. [Google Scholar] [CrossRef] [PubMed]
- Wagstaff, C.; Yang, T.J.; Stead, A.D.; Buchanan Wollaston, V.; Roberts, J.A. A molecular and structural characterization of senescing Arabidopsis siliques and comparison of transcriptional profiles with senescing petals and leaves. Plant J. 2009, 57, 690–705. [Google Scholar] [CrossRef] [PubMed]
- Guo, Y.; Cai, Z.; Gan, S. Transcriptome of Arabidopsis leaf senescence. Plant Cell Environ. 2004, 27, 521–549. [Google Scholar] [CrossRef]
- Wang, B.; Du, Q.; Yang, X.; Zhang, D. Identification and characterization of nuclear genes involved in photosynthesis in Populus. BMC Plant Biol. 2014, 14, 81. [Google Scholar] [CrossRef]
- Bhalerao, R.; Keskitalo, J.; Sterky, F.; Erlandsson, R.; Björkbacka, H.; Birve, S.J.; Karlsson, J.; Gardeström, P.; Gustafsson, P.; Lundeberg, J. Gene expression in autumn leaves. Plant Physiol. 2003, 131, 430–442. [Google Scholar] [CrossRef] [PubMed]
- Cui, Z.; Bi, W.; Hao, X.; Xu, Y.; Li, P.; Walker, M.A.; Wang, Q. Responses of in vitro-grown plantlets (Vitis vinifera) to grapevine leaf roll-associated virus-3 and PEG-induced drought stress. Front. Physiol. 2016, 7, 203. [Google Scholar] [CrossRef]
- Heath, R.L.; Packer, L. Photoperoxidation in isolated chloroplasts: I. Kinetics and stoichiometry of fatty acid peroxidation. Arch. Biochem. Biophys. 1968, 125, 189–198. [Google Scholar] [CrossRef]
- Dhindsa, R.S.; Plumbdhindsa, P.; Thorpe, T.A. Leaf senescence: Correlated with increased levels of membrane permeability and lipid peroxidation, and decreased levels of superoxide dismutase and catalase. J. Exp. Botany 1981, 32, 93–101. [Google Scholar] [CrossRef]
- Breeze, E.; Harrison, E.; McHattie, S.H.; Hughes, L.; Hickman, H.; Hill, C.; Kiddle, S.; Kim, Y.; Penfold, C.A.; Jenkins, D. High-resolution temporal profiling of transcripts during Arabidopsis leaf senescence reveals a distinct chronology of processes and regulation. Plant Cell 2011, 23, 873–94. [Google Scholar] [CrossRef]
- Grabherr, M.G.; Haas, B.J.; Moran, Y.; Levin, J.Z.; Thompson, D.A.; Ido, A.; Xian, A.; Lin, F.; Raktima, R.; Qiandong, Z. Full-length transcriptome assembly from RNA-Seq data without a reference genome. Nat. Biotechnol. 2011, 29, 644. [Google Scholar] [CrossRef]
- Mortazavi, A.; Williams, B.A.; Mccue, K.; Schaeffer, L.; Wold, B. Mapping and quantifying mammalian transcriptomes by RNA-Seq. Nat. Methods 2008, 5, 621–628. [Google Scholar] [CrossRef]
- Conesa, A.; Gã Tz, S.; Garcã A-Gã Mez, J.M.; Terol, J.; Talã N, M.; Robles, M. Blast2GO: A universal tool for annotation, visualization and analysis in functional genomics research. Bioinformatics 2005, 21, 3674–3676. [Google Scholar] [CrossRef]
- Tang, Q.; Ma, X.; Mo, C.; Wilson, I.W.; Song, C.; Zhao, H.; Yang, Y.; Fu, W.; Qiu, D. An efficient approach to finding Siraitia grosvenorii triterpene biosynthetic genes by RNA-seq and digital gene expression analysis. BMC Genom. 2011, 12, 343. [Google Scholar] [CrossRef]
- Bo, L.; Dewey, C.N.; Li, B. Dewey CN. RSEM: Accurate transcript quantification from RNA-Seq data with or without a reference genome. BMC Bioinform. 2011, 12, 323. [Google Scholar]
- Springer, A.; Acker, G.; Bartsch, S.; Bauerschmitt, H.; Reinbothe, S.; Reinbothe, C. Differences in gene expression between natural and artificially induced leaf senescence in barley. J. Plant Physiol. 2015, 176, 180–191. [Google Scholar] [CrossRef]
- Deng, N.; Chang, E.; Li, M.; Ji, J.; Yao, X.; Bartish, I.V.; Liu, J.; Ma, J.; Chen, L.; Jiang, Z. Transcriptome characterization of Gnetum parvifolium reveals candidate genes involved in important secondary metabolic pathways of flavonoids and stilbenoids. Front. Plant Sci. 2016, 7, 174. [Google Scholar] [CrossRef]
- Andersson, A.; Keskitalo, J.; Sjödin, A.; Bhalerao, R.; Sterky, F.; Wissel, K.; Tandre, K.; Aspeborg, H.; Moyle, R.; Ohmiya, Y. A transcriptional timetable of autumn senescence. Genome Biol. 2004, 5, 1–13. [Google Scholar] [CrossRef]
- Wang, P.; Sun, X.; Li, C.; Wei, Z.; Liang, D.; Ma, F. Long-term exogenous application of melatonin delays drought-induced leaf senescence in apple. J. Pineal Res. 2013, 54, 292–302. [Google Scholar] [CrossRef]
- Amunts, A.; Toporik, H.; Borovikova, A.; Nelson, N. Structure determination and improved model of plant photosystem I. J. Biol. Chem. 2010, 285, 3478–3486. [Google Scholar] [CrossRef] [PubMed]
- Hubbard, R.M.; Ryan, M.V.; Sperry, J.S. Stomatal conductance and photosynthesis vary linearly with plant hydraulic conductance in ponderosa pine. Tree Physiol. 2010, 24, 113–121. [Google Scholar] [CrossRef]
- Blokhina, O.; Fagerstedt, K.V. Reactive oxygen species and nitric oxide in plant mitochondria: Origin and redundant regulatory systems. Physiol. Plantarum 2010, 138, 447–462. [Google Scholar] [CrossRef]
- Rivas, F.; Fornes, F.; Rodrigo, M.J.; Zacarías, L.; Agustí, M. Changes in carotenoids and ABA content in citrus leaves in response to girdling. Sci. Horticult. 2011, 127, 482–487. [Google Scholar] [CrossRef]
- Małgorzata, G.; Piotr, L.; Krystyna, R. Two-dimensional zymography in detection of proteolytic enzymes in wheat leaves. Acta Physiol. Plant. 2013, 35, 3477–3482. [Google Scholar]
- Yutaka, S.; Morita, R.; Katsuma, S.; Nishimura, M.; Tanaka, A.; Kusaba, M. Two short-chain dehydrogenase/reductases, NON-YELLOW COLORING 1 and NYC1-LIKE, are required for chlorophyll b and light-harvesting complex II degradation during senescence in rice. Plant J. 2008, 57, 120–131. [Google Scholar]
- Locke, A.M.; Ort, D.R. Leaf hydraulic conductance declines in coordination with photosynthesis, transpiration and leaf water status as soybean leaves age regardless of soil moisture. J. Exp. Bot. 2014, 65, 6617–6627. [Google Scholar] [CrossRef]
- Liu, A.; Chen, S.; Wang, M.; Wang, Z.; Zheng, C.; Zhao, P.; Guo, D.; Ahammed, G.J. Silencing of mitochondrial uncoupling protein gene aggravates chilling stress by altering mitochondrial respiration and electron transport in tomato. Acta Physiol. Plant. 2015, 37, 1–9. [Google Scholar] [CrossRef]
- Ott, M.; Gogvadze, V.; Orrenius, S.; Zhivotovsky, B. Mitochondria, oxidative stress and cell death. Apoptosis 2007, 12, 913–922. [Google Scholar] [CrossRef]
- Wang, C.; Yang, Y.; Wang, H.; Ran, X.; Li, B.; Zhang, J.; Zhang, H. Ectopic expression of a cytochrome P450 monooxygenase gene PtCYP714A3 from Populus trichocarpa reduces shoot growth and improves tolerance to salt stress in transgenic rice. Plant Biotechnol. J. 2016, 14, 1838–1851. [Google Scholar] [CrossRef] [PubMed]
- Pinot, F.; Skrabs, M.; Compagnon, V.; Salaün, J.P.; Benveniste, I.; Schreiber, L.; Durst, F. Omega-Hydroxylation of epoxy- and hydroxy-fatty acids by CYP94A1: Possible involvement in plant defence. Biochem. Soc. Trans. 2000, 28, 867–870. [Google Scholar] [CrossRef]


© 2019 by the authors. Licensee MDPI, Basel, Switzerland. This article is an open access article distributed under the terms and conditions of the Creative Commons Attribution (CC BY) license (http://creativecommons.org/licenses/by/4.0/).