Article

Dynamic Simulation of the Crown Net Photosynthetic Rate for Young Larix olgensis Henry Trees

Key Laboratory of Sustainable Forest Ecosystem Management-Ministry of Education, School of Forestry, Northeast Forestry University, Harbin 150040, China
*
Author to whom correspondence should be addressed.
Forests 2019, 10(4), 321; https://doi.org/10.3390/f10040321
Submission received: 17 February 2019 / Revised: 28 March 2019 / Accepted: 4 April 2019 / Published: 10 April 2019
(This article belongs to the Section Forest Ecology and Management)

Abstract

:
Numerical integration of the instantaneous net photosynthetic rate (An) is a common method for calculating the long-term CO2 uptake of trees, and accurate dynamic simulation of the crown An has been receiving substantial attention. Tree characteristics are challenging to assess given their aerodynamically coarse crown properties, spatiotemporal variation in leaf functional traits and microenvironments. Therefore, the variables associated with the dynamic variations in the crown An must be identified. The relationships of leaf temperature (Tleaf), the vapor pressure deficit (VPD), leaf mass per area (LMA) and the relative depth into the crown (RDINC) with the parameters of the photosynthetic light-response (PLR) model of Larix olgensis Henry were analyzed. The LMA, RDINC and VPD were highly correlated with the maximum net photosynthetic rate (Amax). The VPD was the key variable that mainly determined the variation in the apparent quantum yield (AQY). Tleaf exhibited a significant exponential correlation with the dark respiration rate (Rd). According to the above correlations, the crown PLR model of L. olgensis trees was constructed by linking VPD, LMA and RDINC to the original PLR equation. The model performed well, with a high coefficient of determination (R2) value (0.883) and low root mean square error (RMSE) value (1.440 μmol m−2 s−1). The extinction coefficient (k) of different pseudowhorls within a crown was calculated by the Beer–Lambert equation based on the observed photosynthetically active radiation (PAR) distribution. The results showed that k was not a constant value but varied with the RDINC, solar elevation angle (ψ) and cumulative leaf area of the whole crown (CLA). Thus, we constructed a k model by reparameterizing the power function of RDINC with the ψ and CLA, and the PAR distribution within a crown was therefore well estimated (R2 = 0.698 and RMSE = 174.4 μmol m−2 s−1). Dynamic simulation of the crown An for L. olgensis trees was achieved by combining the crown PLR model and dynamic PAR distribution model. Although the models showed some weakened physiological biochemical processes during photosynthesis, they enabled the estimation of long-term CO2 uptake for an L. olgensis plantation, and the results could be easily fitted to gas-exchange measurements.

1. Introduction

Photosynthesis is one of the most important elements in many ecophysiological models [1,2,3] as photosynthesis plays a vital role in the material cycle and energy flow of forest ecosystems [1,4,5]. Photosynthesis supports metabolism in leaves and provides nutrition to stems and other plant parts for growth [6]. For an individual tree, a good understanding of crown photosynthesis also informs physiological principles for forest management, such as artificial pruning for young forests [7], which can improve the economic value of stems [8,9]. However, the simulation of photosynthesis is generally challenging due to the spatiotemporal variability in leaf functional traits [6,7,10,11,12,13,14,15,16,17], microenvironments [5,18,19,20], foliage ages [12,20,21,22] and branch factors [23].
Many mechanistic models, including the big-leaf model [24], the multistory model [25] and the two-leaf model [26], which were developed from Farquhar’s scheme [27], accurately describe the biochemical process of crown photosynthesis. These models have been widely applied in many ecophysiological process-based models [1,28]. However, these models are usually complex as they require empirical calculations of species-specific photo- and biochemical parameters that are subject to environmental control [29], and the behaviors of the parameters are not easily predicted from their formulations [3,20]. Semiempirical models, such as the photosynthetic light-response (PLR) curve model, serve as an intermediate option to define photosynthesis according to a mathematical description of a single biochemical process between the net photosynthetic rate (An) and photosynthetically active radiation (PAR) [29].
PLR curves vary considerably among species and among individuals of the same species growing in different environments [7,30]. To expand the application of the PLR model from a single leaf to larger scales, many researchers have tried to link leaf functional traits and environmental conditions to the main photosynthetic indicators [11,16,20,29,31,32]. Leaf mass per area (LMA) and its reciprocal variable, the specific leaf area (SLA), are both important leaf functional traits that have been suggested to be closely associated with mesophyll conductivity to CO2 [33,34], consequently impacting photosynthetic indicators [13,35,36,37]. Thus, some researchers have estimated photosynthetic indicators using LMA according to their allometric relationships [11,16,38,39], but photosynthetic indicators can be more accurately predicted if the light condition is included [40]. The nitrogen (N) content is one of the most important factors related to leaf photosynthetic capability [11,12,16,41]. Xu et al. [32] used a chlorophyll meter (SPAD) to incorporate a popular indicator reflecting N into the PLR model to overcome the large coefficient variations between individual leaves with different N statuses. Photosynthesis is also sensitive to changes in surrounding environmental conditions [42,43,44,45]. Ignoring environmental effects may reduce the precision and applicability of large-scale models [16]. Calama et al. [20] and Mayoral et al. [29] successfully expanded the application scope of the PLR model by linking leaf temperature (Tleaf) and the global site factor (GSF) to the parameters. Photosynthetic indicators within crowns also vary with the vertical position [38,46,47,48,49,50]; therefore, simulation of crown photosynthesis should comprehensively consider leaf functional traits, environmental conditions and vertical position within a crown. Liu et al. [7] estimated the response of the An to PAR at different crown positions and under different environmental conditions by modifying the PLR model via reparameterization according to the relationships between the main parameters and LMA, Tleaf, the vapor pressure deficit (VPD), and the relative depth into the crown (RDINC).
Light transmission also plays a crucial role in calculating CO2 uptake due to the sensitive response of the photosynthetic process to light. Thus, light transmission has been simulated in many forest dynamics models, e.g., FORSKA [51]; FORMIND [52]; LPJ [53]; PHOTOS [1]; FAREST [54]; JULES [55]. Beer’s law was the core theory in these models, where the Beer–Lambert equation was the basic equation [56,57,58]. The extinction coefficient (k) and leaf area index (LAI) are the only two essential factors that depend on the distributions of the leaf angle and leaf area, respectively. Campbell [59] used the ellipsoidal leaf angle density function to yield good approximations of leaf angle distributions in real plant canopies and calculated the formula of k. Then, Campbell [60] and Wang and Jarvis [61] developed empirical equations for k involving the mean leaf angle. The LAI was also modified by using the clumping index [62] because leaves are generally non-randomly distributed in a canopy or even in an individual crown [63]. Because leaf angle distributions usually exhibit high spatial and temporal variability [64], k is not unique [1,63,65], although some previous studies directly use a constant k value [14,52,53,54,55,66]. In addition, light is also intercepted by other phytoelements, such as twigs and branches [61,62], which hinders an accurate simulation of light transmission.
Larix olgensis is one of the main tree species used for afforestation in northeastern China, and this species accounts for 36% and 37% of the total area and total volume, respectively, of all plantations located in this region. A good understanding of the dynamic An of L. olgensis trees is significant for studying carbon storage and the carbon cycle in the main forest type in this area. Annual or long-term CO2 uptake is generally determined by integrating the instantaneous An [1,14,28]; thus, an accurate dynamic simulation of the An is crucial. The objectives of this investigation are (1) to expand the PLR model from a single leaf to a tree crown with varied leaf functional traits and environmental conditions for young planted L. olgensis trees, (2) to model the radiation transfer within a crown, and (3) to simulate the dynamic An of a multilayer crown through the growing season.

2. Materials and Methods

2.1. Site Description and Sample Tree Selection

The experiments were conducted at the Maoershan Forest Farm (127°18′0″ E–127°41′6″ E and 45°2′20″ N–45°18′16″ N) in northeastern China. The mean annual air temperature, the mean annual precipitation, and the mean elevation in this region are 2.0 °C, 525 mm, and 400 m, respectively. The soil type is Eutroboralf, and the total forest coverage is approximately 83.3% of the area, 14.7% of which consists of plantations.
Five sample trees, each with a similar diameter at breast height (DBH) to quadratic mean diameter (Dg), representing the average state of each sample plot (20 m × 30 m) were selected according to the measurements of basic tree factors for each tree. Scaffoldings were constructed around each sample tree, needle samples for gas-exchange measurements were selected at different positions within the crown, and this process is described in detail in Liu and Li [17].

2.2. Measurements of the PLR Curves

The PLR curves were generated using fully expanded healthy needles and a portable photosynthesis system (LI-6400XT, LI-COR, Inc., Lincoln, NE, USA) coupled with a standard light-emitting diode (LED) light source (Li-6400-02B) at 17 PAR levels (2200, 2000, 1800, 1600; 1400, 1200, 1000, 800, 600, 400, 200, 150, 100, 60, 40, 15 and 0 μmol m−2 s−1). Sample needle clusters were acclimated for 20 min at a CO2 concentration of 370 μmol m−2 s−1, which approached the actual concentration around the needles, although this concentration was slightly lower than the ambient conditions, by using a CO2 mixer (Li-6400-01) to maintain a stable CO2 supply in the chamber. In our previous study, we proved that An in different vertical positions within crowns of Larix olgensis trees tended to be stable at a PAR of 1400 μmol m−2 s−1 [67]; thus, 1400 μmol m−2 s−1 was used to induce all needle clusters for at least 10 min to ensure that the potential photosynthetic capacities of all needle clusters could be activated. The needle clusters were allowed to equilibrate for a minimum of 2 min at each step before the data were logged. The data for the PLR curves were measured every half month during the growing season (approximately from 15th May to 10th September) in 2016 and 2017. The measurements were conducted from 7:00 to 17:00.

2.3. Measurements of the RDINC and LMA

The depth into the crown (DINC) of the needle clusters and the data for the PLR curves were measured. Then, the RDINC of each needle cluster was calculated by dividing the DINC by crown depth (the distance from the tree tip to the base of its live crown, CD). Once the photosynthetic gas-exchange measurements were completed, corresponding needle clusters were scanned immediately and then surveyed with image analysis software (Image-Pro Plus 6.0, Media Cybernetics, Bethesda, MD, USA) in the laboratory, resulting in a projected leaf area. Then, immediately after their collection in the field, the corresponding needles were dried to a constant weight at 85 °C and weighed. LMA was calculated by dividing the needle dry mass by the corresponding projected leaf area. The statistics for the measurement data for the PLR curves and the corresponding Tleaf, VPD and LMA are listed in Table 1.

2.4. Measurements of PAR within the Crown

PAR measurements were conducted after the leaves fully expanded. First, the incident PAR at the top of the crown was measured using a PAR sensor on the handheld part of the photosynthesis system (LI-6400XT, LI-COR, Inc., Lincoln, NE, USA). Then, the PAR in each pseudowhorl was measured in four directions depending on the branch azimuth (φ) (0 ≤ φ < 45 and 315 ≤ φ < 360 defined as north; 45 ≤ φ < 135 defined as east; 135 ≤ φ < 225 defined as south; and 225 ≤ φ < 315 defined as west) with 10 records every 30 cm in horizontal distance from the tree stem to the outermost part of the pseudowhorl. Each measurement for the whole tree crown was conducted in at 8:00, 10:00, 12:00, 14:00 and 16:00 on a clear and cloudless day for each sample tree. The solar elevation angle (ψ) at each measurement was also recorded. The data in this section were used to fit the k model.

2.5. Calculation of the Leaf Area and LAI

At the end of the growing season (early September), three sample trees were cut down for measurement. The CD of each sampled tree was divided into several segments based on the pseudowhorls [68] from top to bottom. The branch diameter (BD), branch length (BH), branch chord length (BC), φ, branch angle (θ) and DINC of all branches in each pseudowhorl were measured. Then, all branches were cut and weighed. Next, in each pseudowhorl, one branch with the average weight was selected as the representative branch, and the branch and needle clusters were separated and weighed. The ratio of needle-cluster weight to branch weight (RNB) in each segment was calculated. The needle clusters were then sampled (approximately 50–100 g) randomly, weighed and taken to the laboratory for dry matter proportion (DMP) determination. The LMA for each corresponding pseudowhorl was also obtained by additional needle-cluster samples (approximately 10 groups and each group was 0.1 g). Finally, the LA in each pseudowhorl could be calculated as follows:
LA i = DMP i × RNB i × TW i / LMA i
where TW is the total weight of the branches and needle clusters in each pseudowhorl, and i is the serial number of the pseudowhorl.
The relative crown projected area (RCA) of each pseudowhorl was calculated as a circle using the mean projected length of the four longest branches in four directions. The relative cumulative LAI (RCLAI) of each pseudowhorl was calculated by dividing the relative cumulative leaf area (RCLA) by the RCA. The statistics of the measured PAR, LA and RCLA are listed in Table 2.

2.6. Meteorological Data Collection

The instantaneous Tleaf, air temperature (Tair) and VPD were recorded simultaneously when the PLR curves were measured using the photosynthesis system (LI-6400XT, LI-COR, Inc., Lincoln, NE, USA). The dynamic data of Tair, the VPD and PAR (recorded every 30 min each day) were obtained from the National Science and Technology Infrastructure Program (http://mef.cern.ac.cn/). The data in this section were used to simulate the dynamic crown An of L. olgensis.

2.7. Statistical Analysis

2.7.1. Model Descriptions

In this study, the modified Mitscherlich equation [69] was used to model the PLR curve:
A n = A max × ( 1 e ( AQY × PAR / A max ) ) R d
where Amax is the maximum net photosynthetic rate (μmol m−2 s−1), AQY is the apparent quantum yield, and Rd is the dark respiration rate (μmol m−2 s−1).
According to a previous study [7], the correlations of the parameters (the Amax, AQY and Rd) with the environmental conditions (Tleaf and the VPD), leaf traits (LMA) and spatial position (the RDINC) were analyzed, and the original PLR curve (Equation (2)) was modified to the following form:
A n = A max ( 1 e ( AQY · PAR / A max ) ) R d ,   { A max = f ( x ) AQY = g ( x ) R d   = h ( x )
where f(x), g(x) and h(x) represent the functions of Tleaf, VPD, LMA, and RDINC or their combinations.
The Beer–Lambert equation was used to model the PAR distribution within the crown:
PAR i = PAR t × exp ( k i × RCLAI i / sin ( ψ ) )
where i is the serial number of the pseudowhorl, PARt is the incident PAR at the top of the crown, and ψ is the solar elevation angle.
The k value in each pseudowhorl was calculated with Equation (4) based on the observed PARi, PARt, RCLAIi and ψ. Then, the vertical patterns of the k value for the sample trees were modelled based on the relationship between k and the RDINC, ψ and CLA as shown below:
k   =   f   ( RDINC ,   ψ ,   CLA )
where f(RDINC) represents the function of the RDINC.

2.7.2. Model Assessment and Validation

The crown PLR model was fitted to the entire data set, and the models were validated using the jackknife technique, in which a PLR model was constructed using four trees and the other one tree was used to validate the model. We repeated the process for five times to make sure that all the five sample trees have been used as validation data at least once. The model assessment was based on the coefficient of determination (R2) and the root mean square error (RMSE) (Equations (6) and (7)), and model validation was evaluated based on R2, RMSE, the mean error (ME) and precision estimation (P) (Equations (8) and (9)) as follows:
R 2 = 1 i = 1 n ( y i y ^ i ) 2 i = 1 n ( y i y ¯ ) 2
RMSE = i = 1 n ( y i y ^ i ) 2 n p
ME = i = 1 n ( y i y ^ i n )
P = ( 1 t 0.05 × S y ¯ ^ y ¯ ^ ) × 100 % ,   where   S y ¯ ^ = ( y i y ^ i ) 2 n × ( n p )
where yi is the observed value; y ¯ is the mean of the observed value; y ^ i is the predicted value; n is the number of observations; and p is the number of parameters.

3. Results

3.1. Correlations between Photosynthetic Parameters and the RDINC, Tleaf, VPD and LMA

Figure 1 shows the relationships between the fitted parameters (the Amax, AQY and Rd) for the Mitscherlich equation and the RDINC, Tleaf, VPD and LMA in the 752 needle clusters from the five sample trees. The Amax exhibited strong correlations with the RDINC and LMA, in which Amax was negatively correlated with the RDINC but positively correlated with LMA. Although the relationships between the Amax and environmental conditions (Tleaf and the VPD) were also significant, their correlations were weak. The AQY exhibited a strong negative correlation with the VPD but weak correlations with Tleaf. The Rd was positively correlated with Tleaf but negatively correlated with the RDINC. In addition, the VPD and LMA were also positively correlated with the Rd.

3.2. Simulation of the Responses of the An to PAR under Different Conditions

The PLR curve model (Equation (3)) was determined according to the relationships between the fitted parameters (the Amax, AQY and Rd) for the PLR curve equation and the RDINC, Tleaf, VPD and LMA (Figure 1). To make sure that the scaled parameters are consistent with the ones retrieved at leaf level by fitting the PLR curves, the final crown PLR curve model was determined as follow:
A n = ( a 0 · ln ( L M A V P D · R D I N C )   + a 1 ) · ( 1 exp ( ( b 0 · V P D + b 1 ) · P A R ( a 0 · ln ( L M A V P D · R D I N C )   + a 1 ) ) ) R d
where a0, a1, b0, b1 and Rd are unknown parameters to be estimated.
Table 3 shows the parameter estimates for the nonlinear least-squares fit of model 10 and the goodness of fit and validation statistics for the model. All the parameters were significant at a 0.01 level, and the model presented satisfactory model assessment in modeling the crown PLR curves, with a high R2 value (0.883) and a low RMSE value (1.440 μmol m−2 s−1). Meanwhile it also performed well in validation, with high values of R2 (0.849) and P% (93.19) and low values of RMSE (1.670 μmol m−2 s−1) and ME (-0.114 μmol m−2 s−1).

3.3. Vertical Patterns of PAR and k within the Crown

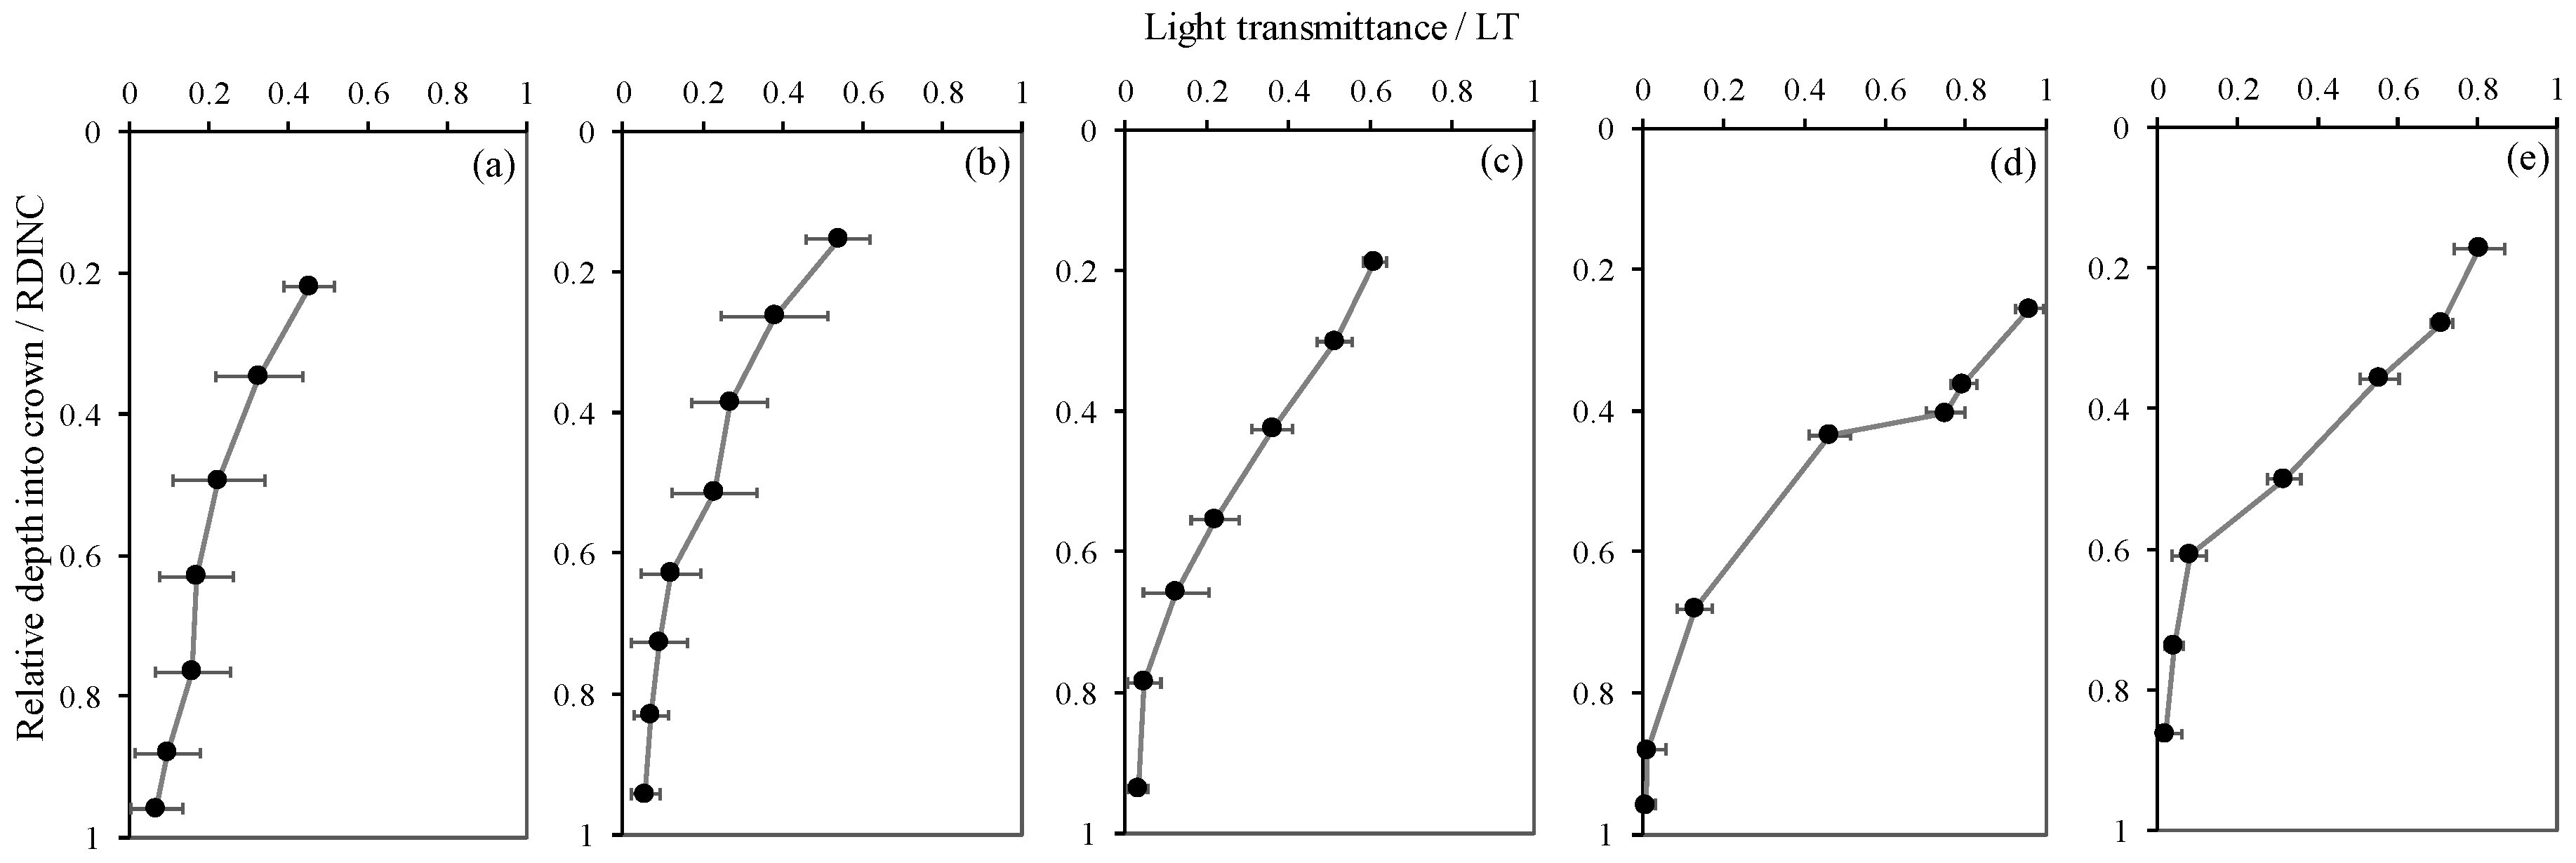
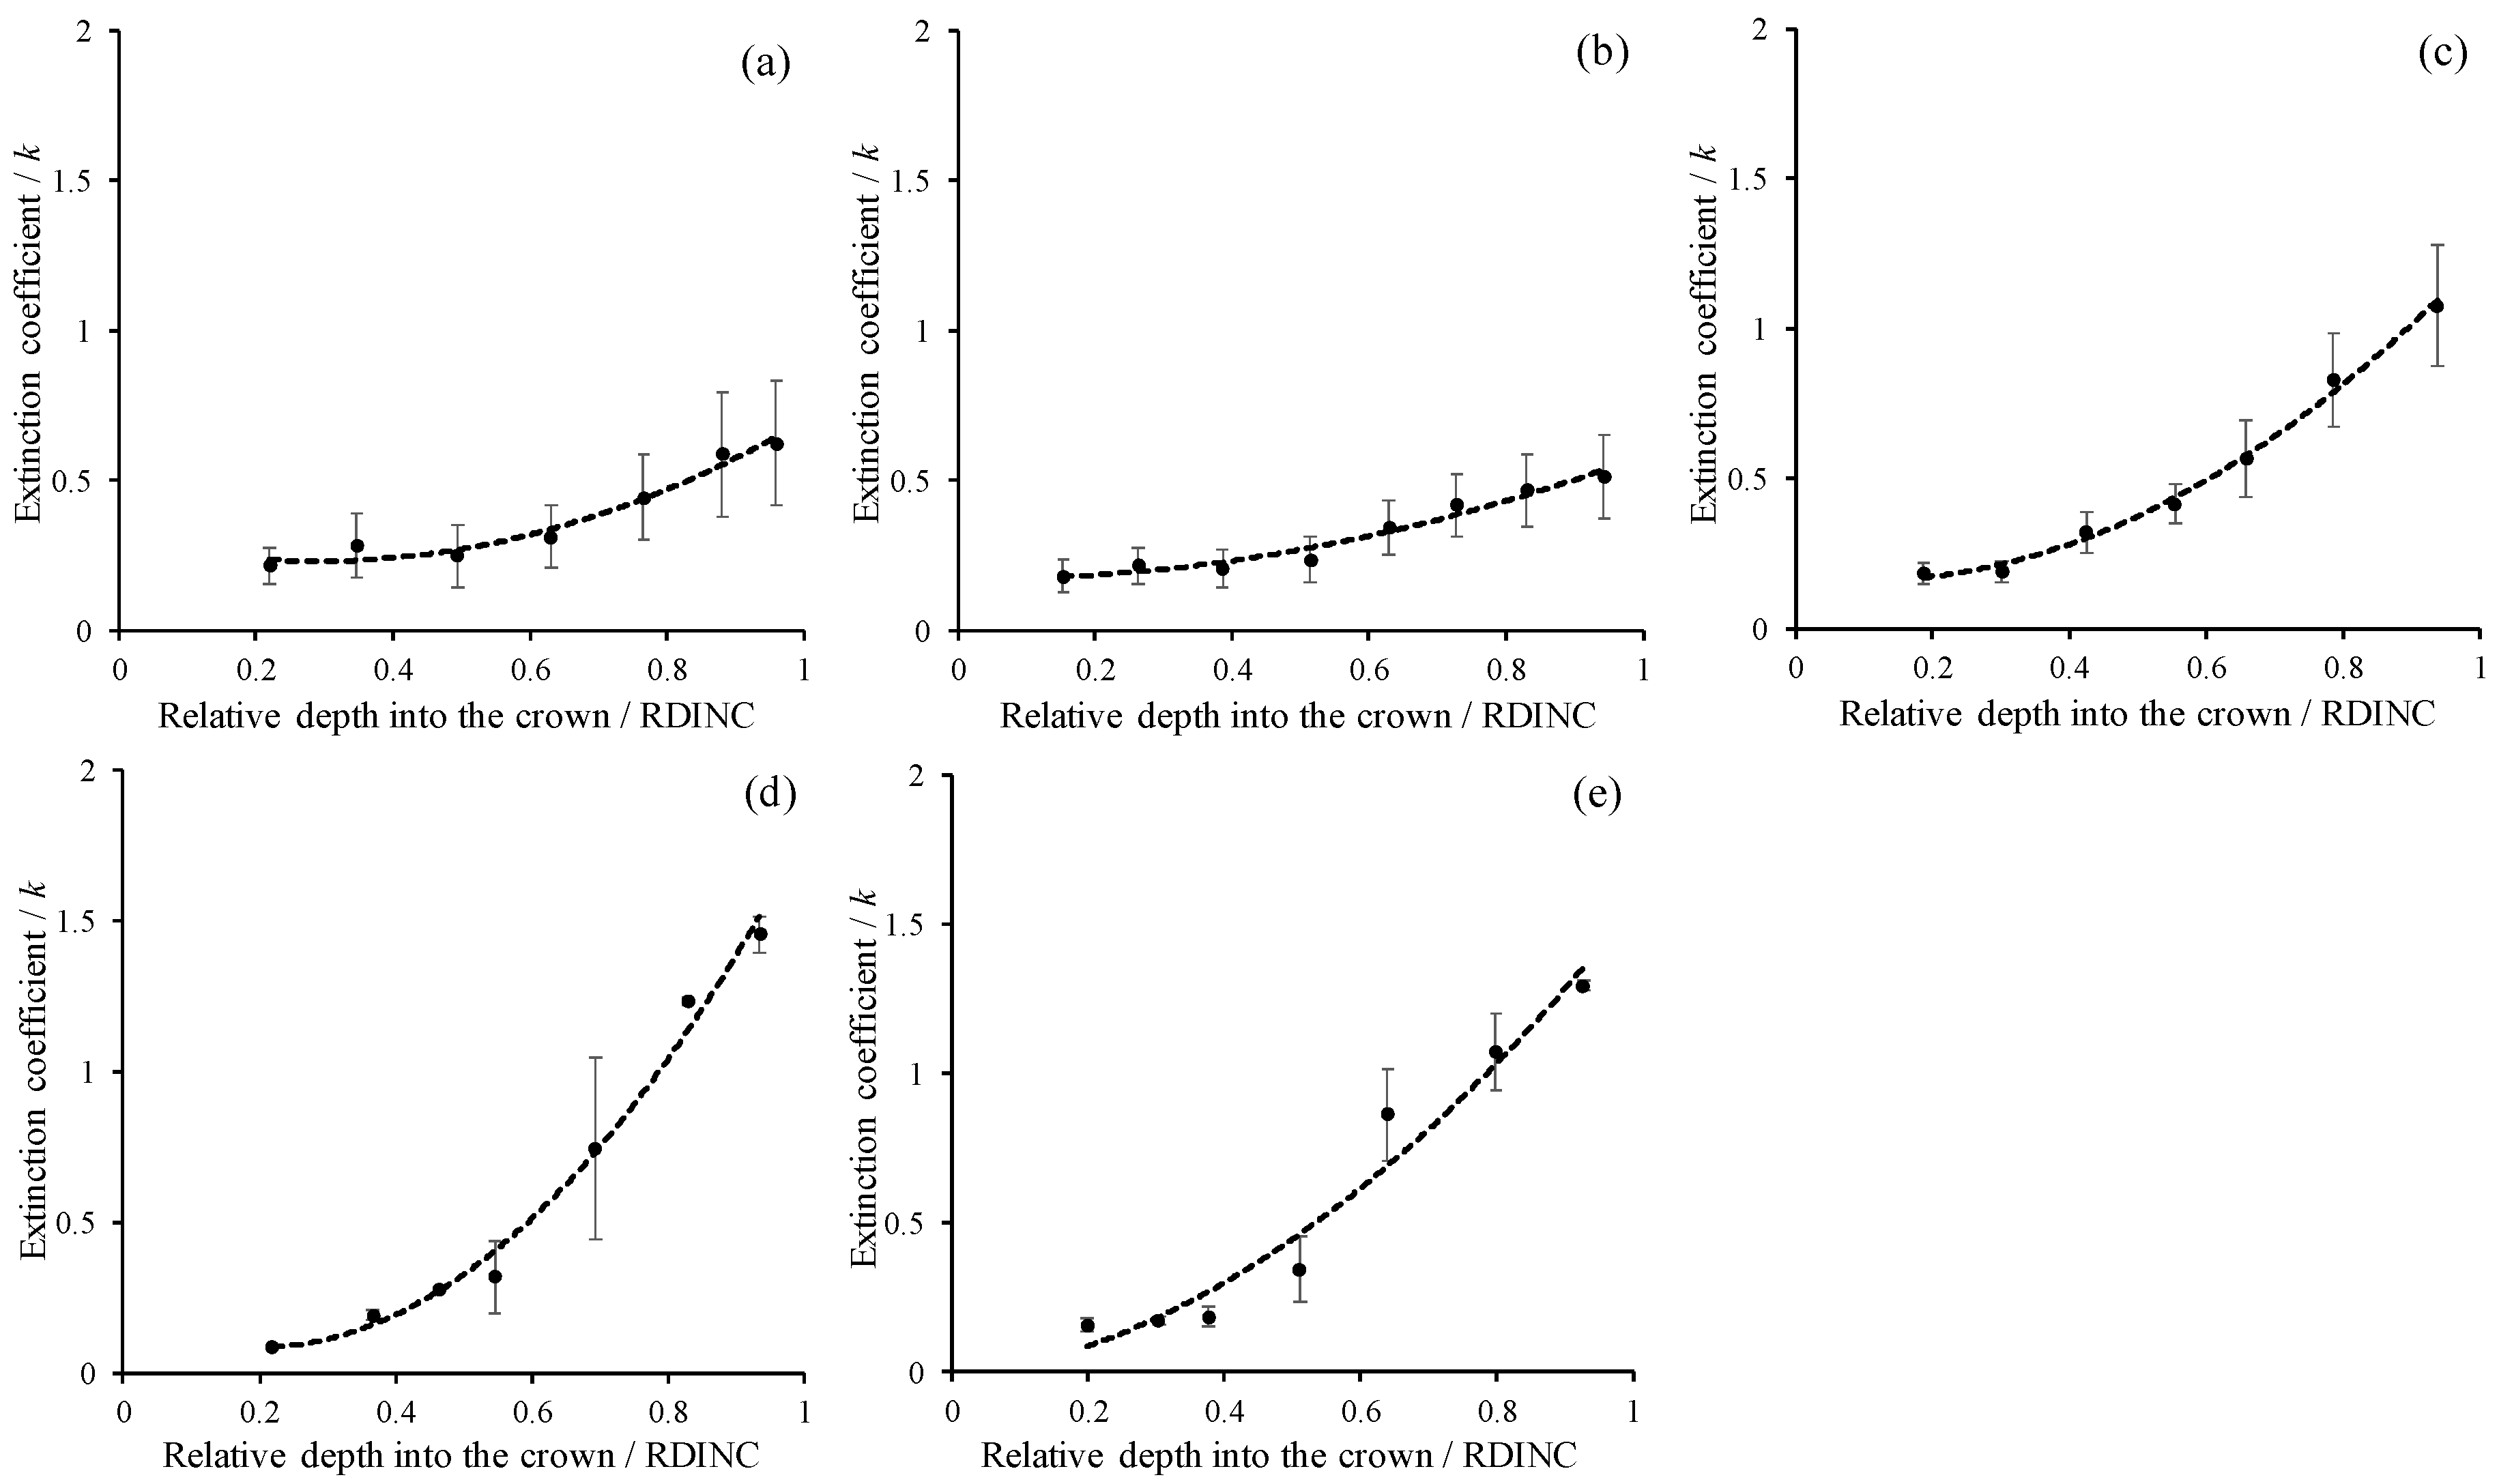
Figure 2 shows the vertical patterns of light transmittance (the ratio of PAR in the crown to the incident PAR, LT) for five planted L. olgensis trees. Although the LT decreased with increases in the RDINC in the five sample trees, the patterns still showed minimal differences among different trees, which was probably associated with the different PARt and RCLAI in each pseudowhorl (Table 2). This scenario also caused a vertical variation in k, where k increased with an increasing RDINC (Figure 3). In the top of the crown, the k for the five sample trees was relatively stable at approximately 0.2. Compared to the k values in the top of the crown, the k values in the bottom of the crown k values in tree I, tree II, tree III, tree IV and tree V were 1.9-, 1.8-, 4.8-, 16.1- and 7.2- times higher, respectively. In addition, k was also different among the five sample trees, as the mean k values were 0.39, 0.32, 0.51, 0.61 and 0.58 in tree I, tree II, tree III, tree IV and tree V, respectively.

3.4. Estimation of k

According to the nonlinear correlation between k and the RDINC, we modeled k for the five sample trees based on the power function as k = a 0 · RDINC b 0 . Then, the parameters (a0 and b0) were reparameterized by linking ψ and CLA to model k. The k model was finally constructed as follows:
k = ( d 0 · ψ + d 1 · CLA + d 2 ) · RDINC ( e 0 · CLA + e 1 )
where d0, d1, d2, e0 and e1 are unknown parameters to be estimated.
Table 4 shows the parameter estimates for the nonlinear least-squares fit of model 11 and the goodness of fit statistics for the model. All the parameters were significant at a 0.01 level, and the model performed well in modeling the multiwhorl k, with a high R2 value (0.569) and a low RMSE value (0.159). Meanwhile it also performed well in validation, with high values of R2 (0.569) and P% (93.15) and low values of RMSE (0.170) and ME (0.038).

3.5. Dynamic Simulation of the An within the Crown throughout the Whole Growing Season

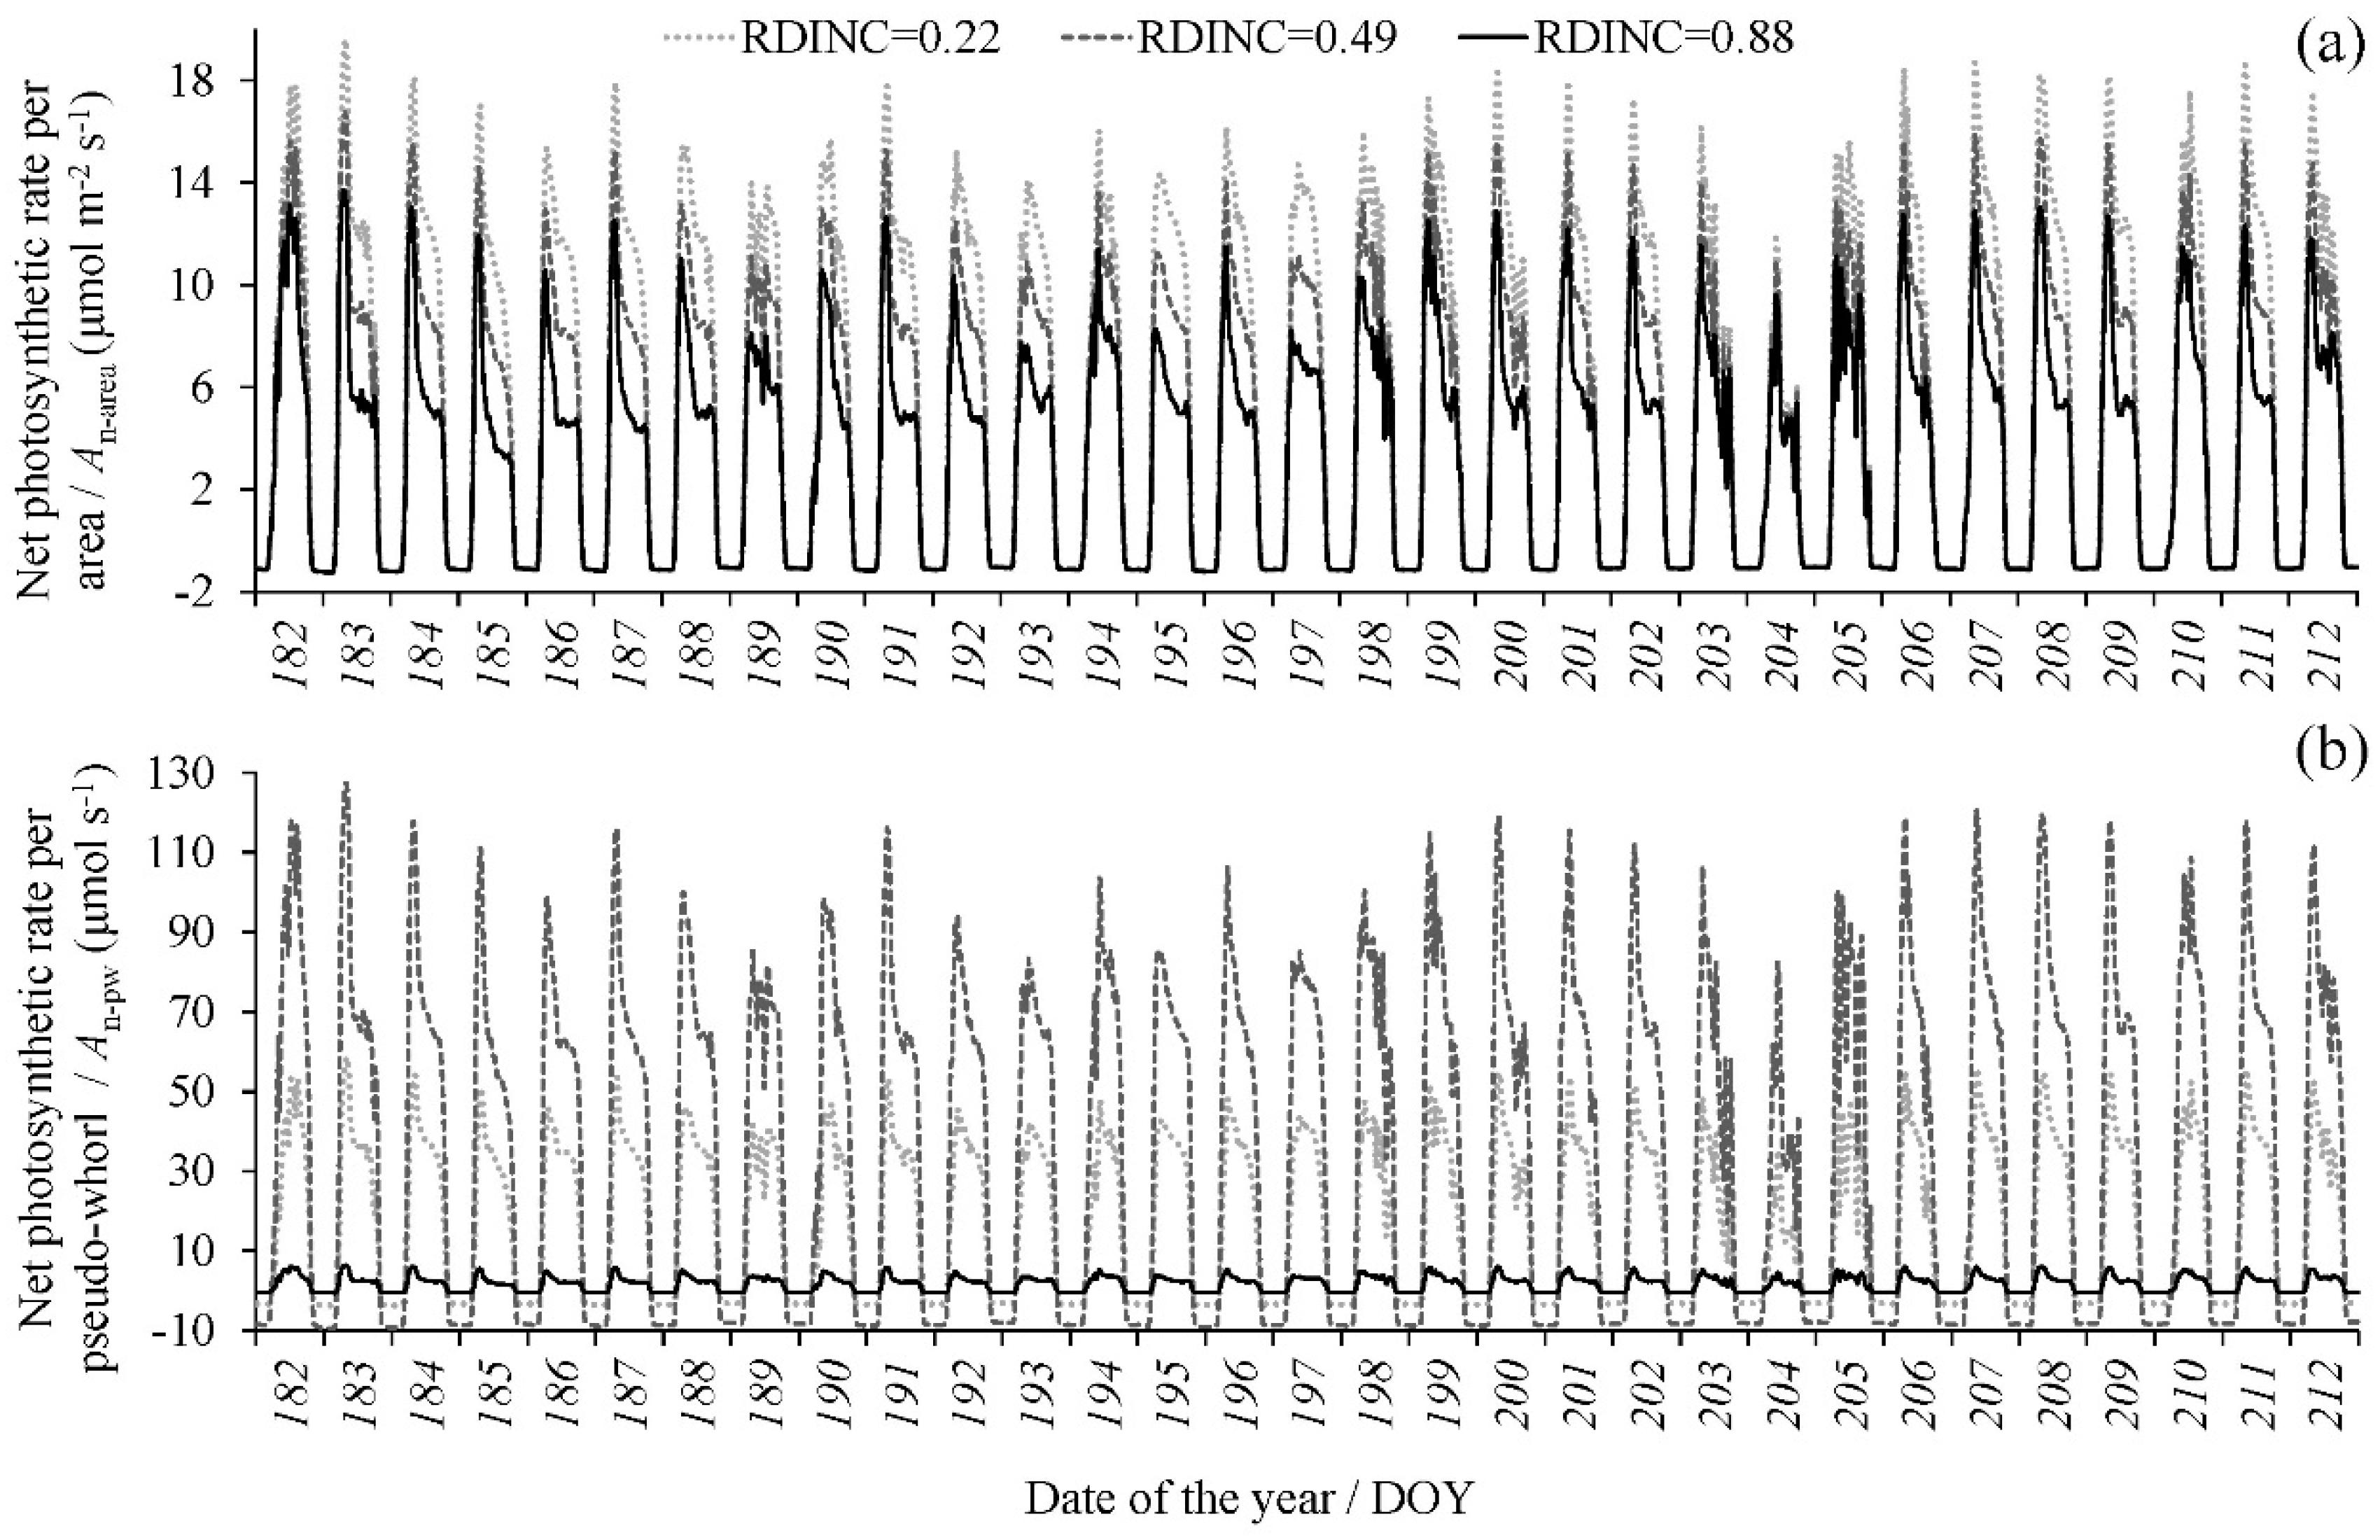
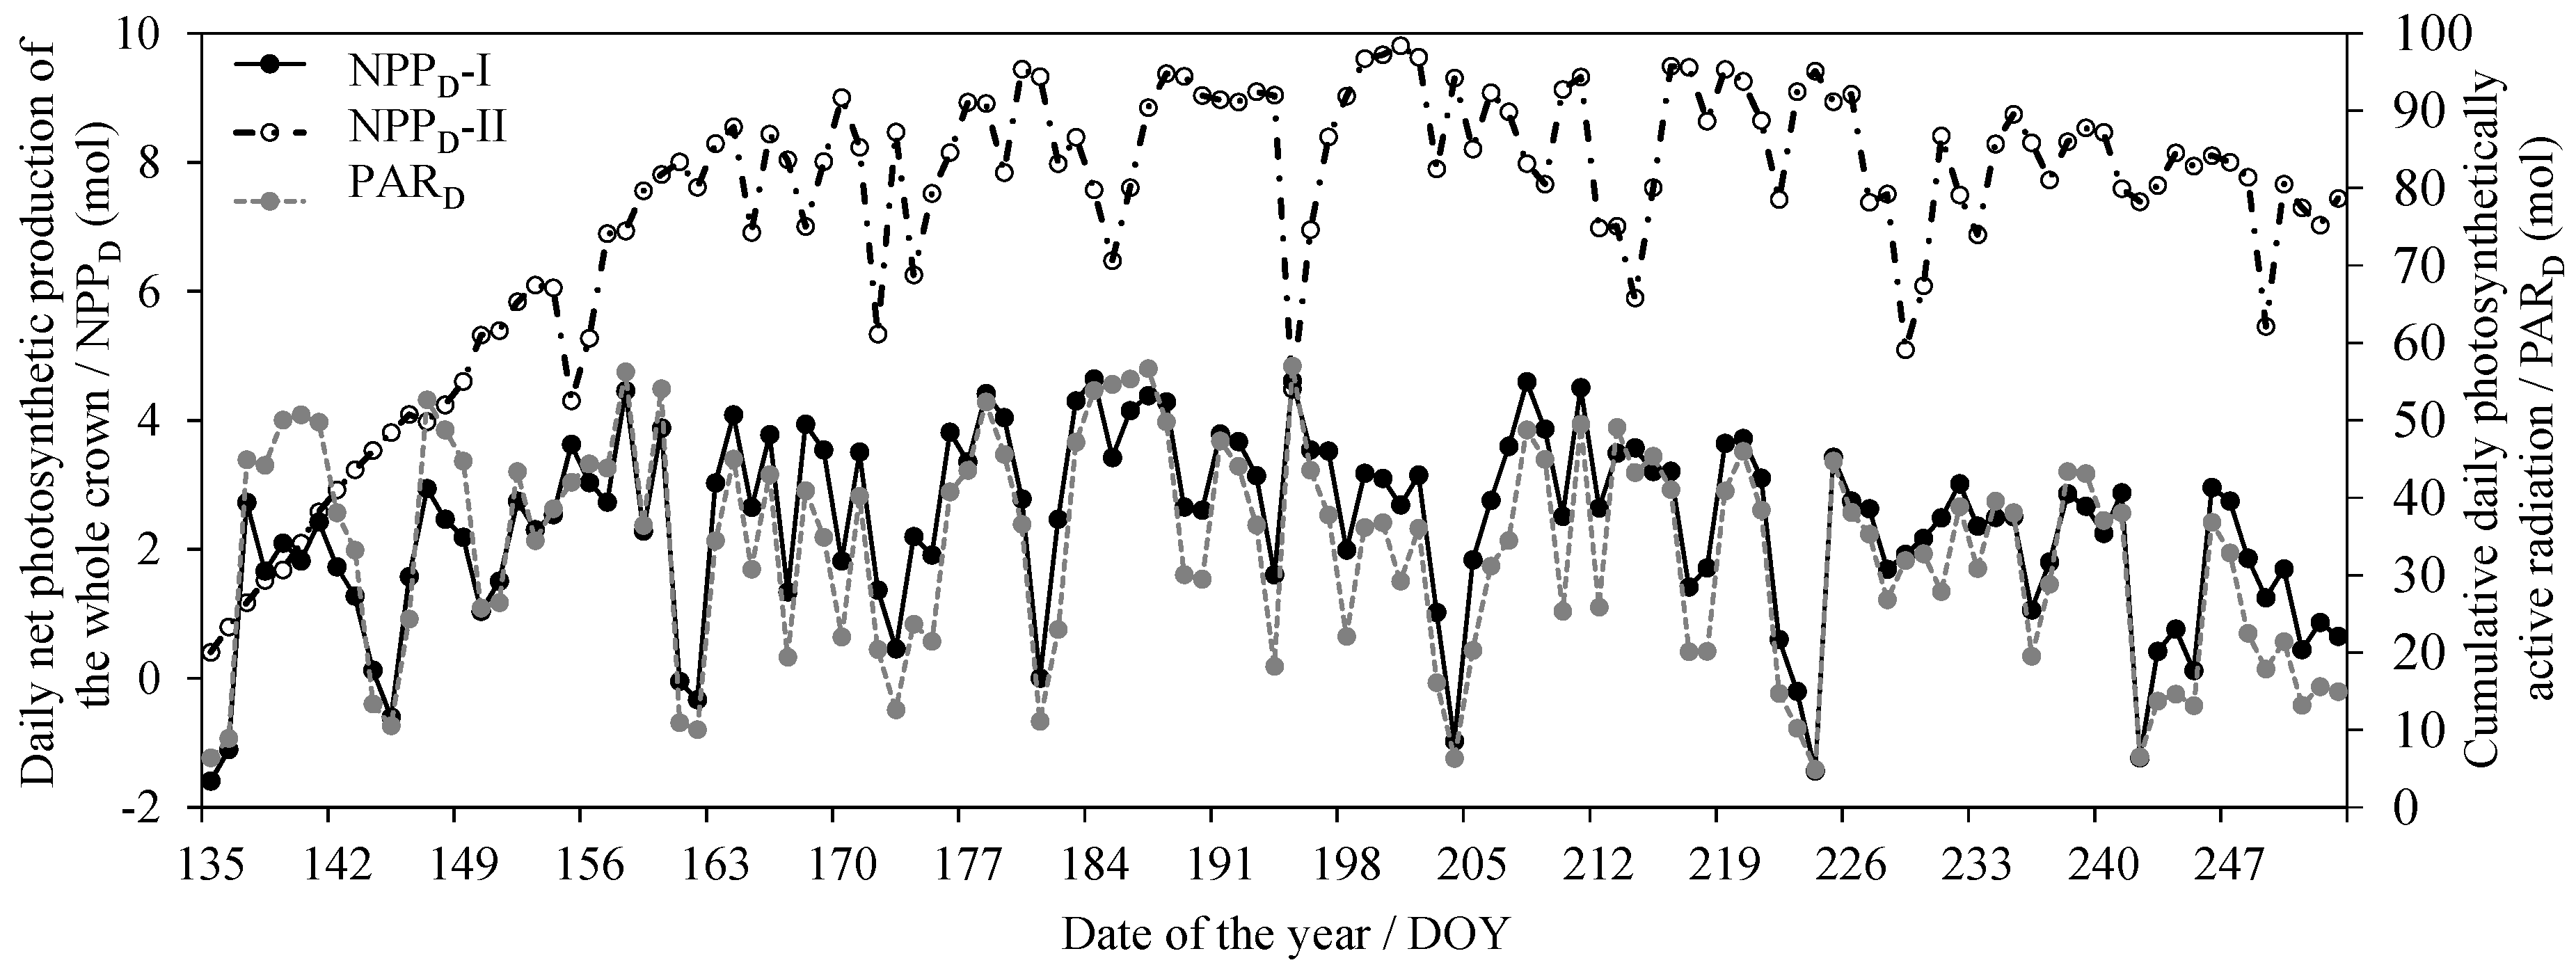
With the dynamic meteorological data, the PAR in each pseudowhorl within the crown was calculated based on the multiwhorl k model, and consequently, the dynamic An per area (An-area) in each pseudowhorl was simulated according to model 10. Figure 4a shows the dynamic An-area at different pseudowhorls during July (tree I was the example), which clearly describe the temporal variation in the An-area in multiwhorls within a crown at a diurnal scale and monthly scale and even at a seasonal scale. The An-area decreased with an increasing RDINC, but the An per pseudowhorl (An-pw) was greatest in the middle crown (Figure 4b). We calculated the daily net photosynthetic production (NPPD) of the whole crown according to the dynamic simulation of the crown An based on Equation (8) (NPPD-I) and Equation (2) (NPPD-II) respectively (Figure 5). The NPPD that was calculated based on our modified PLR model (NPPD-I) was highly consistent with the dynamic changes in the cumulative daily PAR (PARD), which conformed to the natural reality. However, the NPPD that was calculated based on the original PLR model (NPPD-II) was weakly correlated with the PARD and was obviously an overestimation. The NPPD exhibited obvious fluctuations during the growing season but was highly consistent with the dynamic changes in the cumulative daily PAR (PARD).

4. Discussion

For trees, the photosynthetic properties of foliage exhibit vertical variation within a crown [47,50,70], and this phenomenon is intimately associated with leaf traits [10,15,23] and the surrounding microenvironment [18]. Our results showed that the Amax and Rd were negatively correlated with the RDINC (Figure 1), which is consistent with other studies [35,48,49,71,72,73,74]. This phenomenon is consistent with the theory of low light acclimation [23,70]. LMA generally demonstrated a strong correlation with photosynthesis [31,35,36,37] due to its close association with mesophyll conductivity to CO2 [33,34], and LMA has also served as an indicator of the potential growth rate [75]. Figure 1 shows that LMA exhibited a positive correlation with the Amax, which is consistent with previous studies [38,76,77,78]. In contrast, LMA is usually negatively correlated with the Amax in large trees [34,79,80,81]. However, the LMA in large trees can be extremely high, which may hinder mesophyll conductivity to CO2 and consequently reduce the Amax [34,35]. Tleaf has been extensively reported to be parabolically correlated with the Amax [20,29,82,83,84,85], and the optimum temperature (Topt) for the Amax was in the range of 15–30 °C for most temperate species [12]. Our results (Figure 1) are also in agreement with the results from the above reports; however, the correlation between Tleaf and the Amax was weak, and the optimum temperature for Amax was approximately 30 °C, which is consistent with the optimum temperature for the Amax of Pinus pinea [20]. The Rd demonstrated a significant exponential correlation with Tleaf (Figure 1), which is also in line with the results of other previous studies [5,49,84,86]. Our results showed that the AQY was strongly and negatively correlated with the VPD (Figure 1), presumably due to the limitation that a high VPD imposes on stomatal conductance [19,87,88,89]. Similar to Cannell and Thornley [90], we also found a decreasing relationship between the AQY and Tleaf, although some previous studies have suggested that the AQY is independent of temperature [20].
The Amax, AQY and Rd are not only important photosynthetic indicators but also core parameters for determining the shape of the PLR curve (Equation (2)). Thus, many studies have linked leaf traits [11,16,32,91] or environmental conditions [20,29] in the PLR models based on their correlations with the Amax, AQY and Rd to resolve the problem of parameter variation among different species or environments. In this study, we comprehensively considered the influence of spatial position, leaf traits and environmental conditions on leaf photosynthesis and then linked the RDINC, LMA and VPD in the PLR model to extend the PLR model from a single leaf to the whole crown and render the model sufficiently flexible to be applied in different conditions. The Beer–Lambert equation was the basic equation [56,57,58] used to model PAR transmission within the crown, in which the k value played a vital role. However, the k value was challenging to determine in the trees due to their aerodynamically coarse crown properties. The ellipsoidal leaf angle density function is generally used to estimate the leaf angle distributions in real plant crowns to calculate k values [59]. Campbell [60] and Wang and Jarvis [61] developed empirical equations for k involving the mean leaf angle, but the equations are time-consuming and complex in terms of leaf angle measurement. Thus, many studies directly use a constant k value of 0.4 [54], 0.5 [14,55], 0.52 [66] or 0.7 [52] to simulate PAR transmission within crowns. Our results showed that the k value was not constant (Figure 3), which was also observed in other studies [63,65]. In addition, we modeled k based on its exponential correlation with the RDINC for each sample tree and further constructed the k model (Equation (11)) by reparameterization using ψ and CLA. Figure 6 shows the performances of different constant k values in terms of predicting PAR within the crowns of the five sample trees. The k model performed better when k was assigned a value of 0.33, with a greater R2 (0.37) and smaller RMSE (252.31 μmol m−2 s−1). We contrasted the results of the estimated PAR using different methods for determining k (Figure 7), and the results showed that our k model performed the best among these models (Figure 7a). In addition, the k value was unsatisfactorily determined based on the leaf angle (Figure 7c,d) for L. olgensis trees.
The crown An is difficult to simulate, specifically in trees with their aerodynamically coarse microenvironments and seasonal and spatial changes in leaf traits. Thus, a crown An model should be sufficiently enough to consider account the diurnal, seasonal and spatial variations in the An. Previous studies have suggested that incorrect simulations usually occur when modeling long-term carbon uptake if the spatial and seasonal variations in photosynthesis [46,92,93,94,95] or leaf traits [96,97] are neglected. Some scientists have successfully incorporated leaf traits [11,16,29,32,91] and environmental conditions [20,29] into the PLR model to extend the model from a single leaf to a larger scale. However, these models are limited in their application because they only describe the response of the An to PAR in different conditions and do not describe the dynamic simulation of the An. In this study, we constructed a k model to simulate the dynamic PAR within a crown to achieve a dynamic simulation of the An based on dynamic meteorological data (Figure 5).
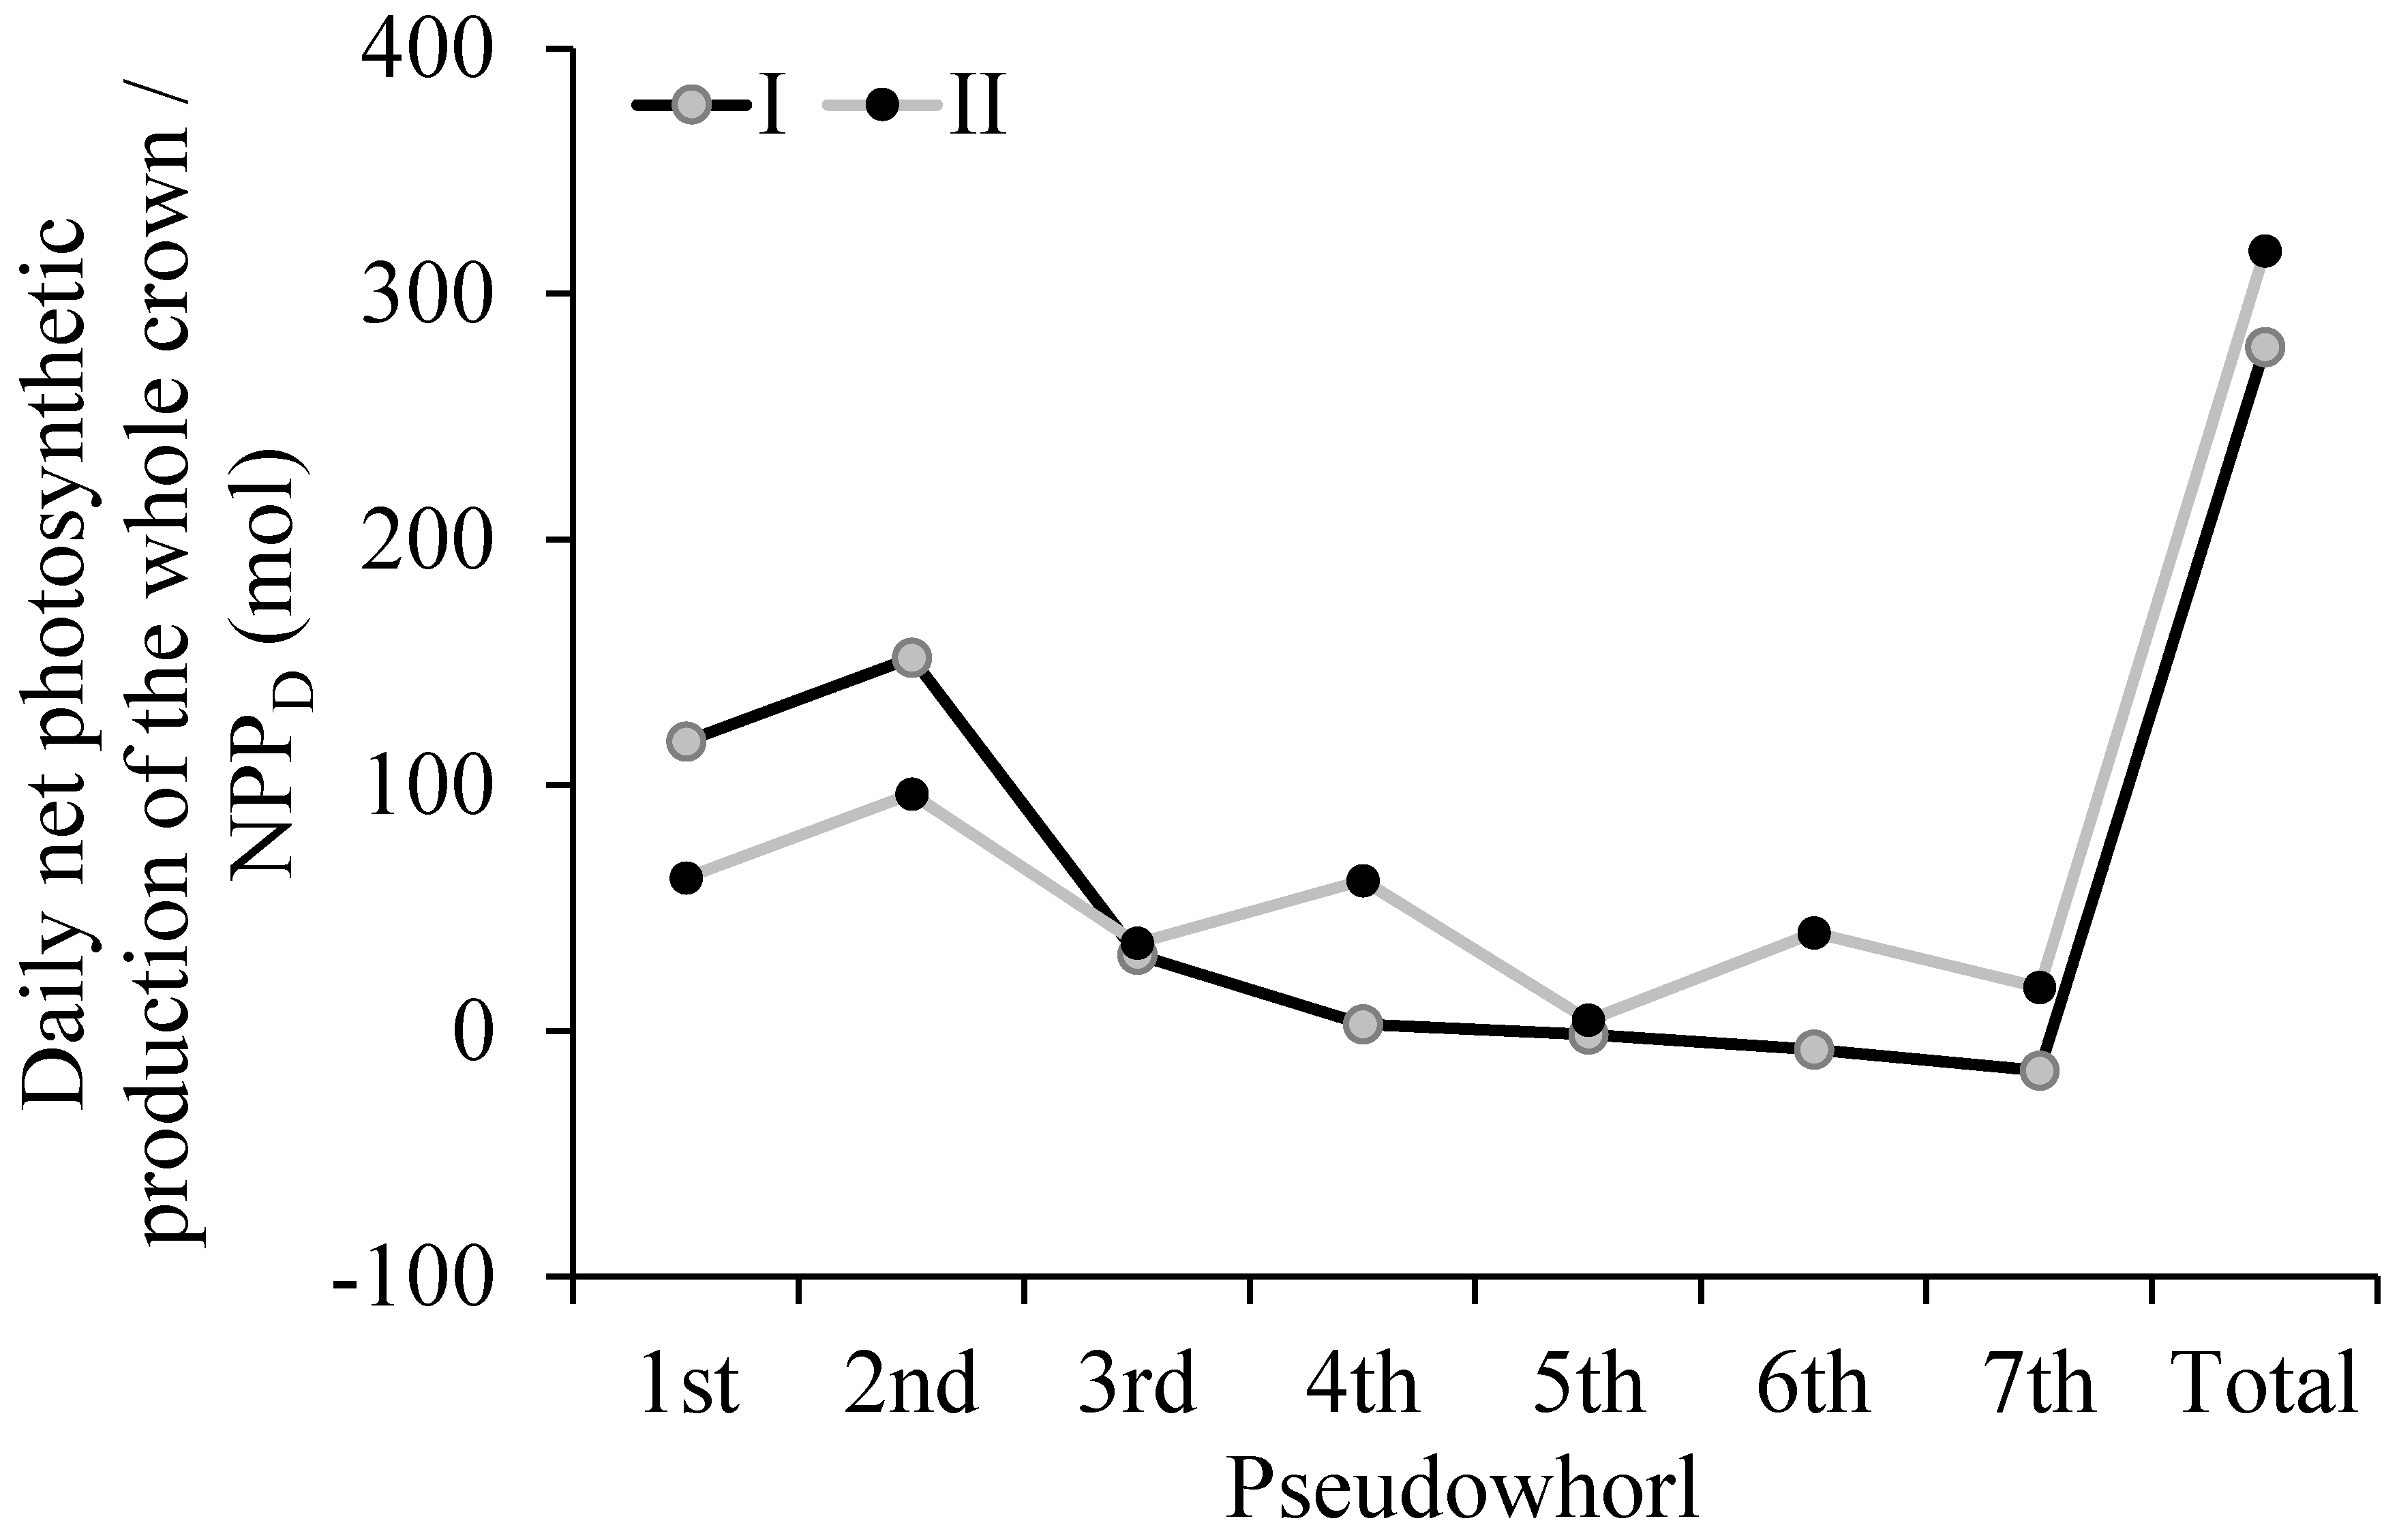
For a clear understanding of the influence of the k value determined based on different methods on the NPPD, we compared the NPPD results that were calculated based on two methods (Figure 8) for tree I. The total NPPD that was calculated by method II was overestimated by 14.1% compared to the total NPPD that was calculated by method I. The NPPD results for each pseudowhorl showed that method I underestimated the value in the upper pseudowhorl compared to method II but overestimated the value in the lower pseudowhorl compared to method II, indicating that the NPPD calculated by method II may have yielded an incorrect result regarding the contribution of photosynthate from branches in pseudowhorls to trunks. Consequently, this method resulted in an incorrect judgment for the effective crown (i.e., the basis for the scientific, artificial pruning of young forests).
In summary, the results of this study show that environmental conditions (Tleaf and the VPD), leaf traits (LMA) and spatial positions (the RDINC) are the key variables causing the dynamic variation in crown PLR curves for L. olgensis trees. Thus, Tleaf, the VPD, LMA and the RDINC should to be linked to the parameters of the PLR model to construct a crown PLR model of L. olgensis trees. The k value exhibits obvious vertical variation within a crown, indicating that a constant value of k will result in incorrect PAR estimations. Therefore, a k model was established to simulate the dynamic PAR within a crown based on the Beer–Lambert function. Finally, the dynamic simulation of the crown An for L. olgensis trees was conducted by combining the crown PLR model and dynamic PAR distribution model. Compared to the mechanistic photosynthesis models [24,25,26,27] that have been widely used in forest dynamics models [51,52,53,54,55], our model weakened the descriptions of some physiological and biochemical processes, rendering the model more convenient for application than the mechanistic models. The model can be further improved based on data from trees of different sizes and can serve as a foundation for estimating the long-term CO2 uptake in L. olgensis plantations.

5. Conclusions

The PLR curves and PAR were measured within multilayer tree crowns of five planted L. olgensis trees during the whole growing season. The crown PLR model of L. olgensis trees was constructed by linking VPD, LMA and RDINC to the original PLR equation. The k model was constructed based on the ψ, CLA and RDINC, and consequently the dynamic PAR distribution can be simulated. Finally, the dynamic simulation of multilayer crown An for L. olgensis trees was conducted by combining the crown PLR model and dynamic PAR simulation. Compared with the traditional mechanism models, our model weakened other physiological biochemical processes but with simpler model structure, fewer variables to be measured and guaranteed well estimation accuracy. Based on our model the NPP in each pseudowhorl through the growing season can be calculated by numerical integration of the dynamic An, thus serving as a foundation for determining the ratio of the functional crown, which could provide a scientific and effective guidance in artificial pruning for young forests.

Author Contributions

Q.L. and F.L. conceived of the study and designed the methodology; Q.L. and L.X. collected and analyzed the data; Q.L. and F.L. led the writing of the manuscript. All authors contributed substantially to the drafts and provided final approval for publication.

Funding

This research was funded by National Key R&D Program of China (2017YFD0600402) and Fundamental Research Funds for the Central Universities (2572016AA29).

Acknowledgments

The authors would like to thank Xingchang Wang, Longfei Xie, Xiang Li, Fanlin Kong and Yibo Sun who provided and collected the data for this study. We would like to express our appreciation to the anonymous reviewers for their constructive comments on the manuscript.

Conflicts of Interest

The authors declare no conflict of interest.

References

  1. Zhang, X.Q.; Xu, D.Y. Eco-physiological modelling of canopy photosynthesis and growth of a Chinese fir plantation. For. Ecol. Manag. 2003, 173, 201–211. [Google Scholar] [CrossRef]
  2. Wang, P.; Sun, R.; Hu, J.; Zhu, Q.; Zhou, Y.Y.; Li, L.; Chen, J.M. Measurements and simulation of forest leaf area index and net primary productivity in Northern China. J. Environ. Manag. 2007, 85, 607–615. [Google Scholar] [CrossRef] [PubMed]
  3. Sato, H.; Itoh, A.; Kohyama, T. SEIB-DGVM: A new dynamic global vegetation model using a spatially explicit individual-based approach. Ecol. Model. 2007, 200, 279–307. [Google Scholar] [CrossRef]
  4. Allen, A.P.; Gillooly, J.F.; Brown, J.H. Linking the global carbon cycle to individual metabolism. Funct. Ecol. 2005, 19, 202–213. [Google Scholar] [CrossRef] [Green Version]
  5. Quan, X.K.; Wang, C.K. Acclimation and adaptation of leaf photosynthesis, respiration and phenology to climate change: A 30-year Larix gmelinii common-garden experiment. For. Ecol. Manag. 2018, 411, 166–175. [Google Scholar]
  6. Wright, I.J.; Reich, P.B.; Westoby, M.; Ackerly, D.D.; Baruch, Z.; Bongers, F.; Cavender-Bares, J.; Chapin, T.; Cornelissen, J.H.C.; Diemer, M.; et al. The worldwide leaf economics spectrum. Nature 2004, 428, 821–827. [Google Scholar] [CrossRef] [PubMed] [Green Version]
  7. Liu, Q.; Dong, L.H.; Li, F.R. Modeling net CO2, assimilation (AN) within the crown of young planted Larix olgensis trees. Can. J. For. Res. 2018, 48, 1085–1098. [Google Scholar] [CrossRef]
  8. Kerr, G.; Morgan, G. Does formative pruning improve the form of broadleaved trees? Can. J. For. Res. 2006, 36, 132–141. [Google Scholar] [CrossRef]
  9. Springmanna, S.; Rogersb, R.; Spiecker, H. Impact of artificial pruning on growth and secondary shoot development of wild cherry (Prunus avium L.). For. Ecol. Manag. 2011, 261, 764–769. [Google Scholar] [CrossRef]
  10. Reich, P.B.; Ellsworth, D.S.; Kloeppel, B.D.; Fownes, J.H.; Gower, S. Vertical variation in canopy structure and CO2 exchange of oak-maple forests: Influence of ozone, nitrogen, and other factors on simulated canopy carbon gain. Tree Physiol. 1990, 7, 329–345. [Google Scholar] [CrossRef]
  11. Marino, G.; Aqil, M.; Shipley, B. The leaf economics spectrum and the prediction of photosynthetic light-response curves. Funct. Ecol. 2010, 24, 263–272. [Google Scholar] [CrossRef]
  12. Atkinson, L.J.; Campbell, C.D.; Zaragoza-Castells, J.; Hurry, V.; Atkin, O.K. Impact of growth temperature on scaling relationships linking photosynthetic metabolism to leaf functional traits. Funct. Ecol. 2010, 24, 1181–1191. [Google Scholar] [CrossRef] [Green Version]
  13. Cavaleri, M.A.; Oberbauer, S.F.; Clark, D.B.; Clark, D.A.; Ryan, M.G. Height is more important than light in determining leaf morphology in a tropical forest. Ecology 2010, 91, 1730–1739. [Google Scholar] [CrossRef]
  14. Falster, D.S.; Brännström, Å.; Dieckmann, U.; Westoby, M. Influence of four major plant traits on average height, leaf-area cover, net primary productivity, and biomass density in single-species forests: A theoretical investigation. J. Ecol. 2011, 99, 148–164. [Google Scholar] [CrossRef]
  15. Chiarawipa, R.; Rueangkhanab, M.; Wang, Y.; Zhang, X.Z.; Han, Z.H. Modeling light acclimation of photosynthetic response in different ages of vine leaves. Acta Hortic. 2012, 956, 255–260. [Google Scholar] [CrossRef]
  16. Lachapelle, P.P.; Shipley, B. Interspecific prediction of photosynthetic light response curves using specific leaf mass and leaf nitrogen content: Effects of differences in soil fertility and growth irradiance. Ann. Bot. 2012, 109, 1149–1157. [Google Scholar] [CrossRef]
  17. Liu, Q.; Li, F.R. Spatial and Seasonal Variations of Standardized Photosynthetic Parameters under Different Environmental Conditions for Young Planted Larix olgensis Henry Trees. Forests 2018, 9, 522. [Google Scholar] [CrossRef]
  18. Rook, D.A.; Corson, M.J. Temperature and irradiance and the total daily photosynthetic production of the crown of a Pinus radiate tree. Oecologia 1978, 36, 371–382. [Google Scholar] [CrossRef]
  19. Mengistu, T.; Sterck, F.J.; Fetene, M.; Tadesse, W.; Bongers, F. Leaf gas exchange in the frankincense tree (Boswellia papyrifera) of African dry woodlands. Tree Physiol. 2001, 31, 740–750. [Google Scholar] [CrossRef]
  20. Calama, R.; Puértolas, J.; Madrigal, G.; Pardos, M. Modeling the environmental response of leaf net photosynthesis in Pinus pinea L. natural regeneration. Ecol. Model. 2013, 251, 9–21. [Google Scholar] [CrossRef]
  21. Bond, B.J. Age-related changes in photosynthesis of woody plants. Trends Plant Sci. 2000, 5, 349–353. [Google Scholar] [CrossRef]
  22. Wyka, T.P.; Żytkowiak, R.; Oleksyn, J. Seasonal dynamics of nitrogen level and gas exchange in different cohorts of Scots pine needles: A conflict between nitrogen mobilization and photosynthesis? Eur. J. For. Res. 2016, 135, 483–493. [Google Scholar] [CrossRef]
  23. Kull, O. Acclimation of photosynthesis in canopies: Models and limitations. Oecologia 2002, 133, 267–279. [Google Scholar] [CrossRef]
  24. Amthor, J.S. Scaling CO2–photosynthesis relationships from the leaf to the canopy. Photosynth. Res. 1994, 39, 321–350. [Google Scholar] [CrossRef]
  25. Leuning, R.; Kelliher, F.M.; Pury, D.G.G.; Schulze, E.D. Leaf nitrogen, photosynthesis, conductance and transpiration: Scaling from leaves to canopies. Plant Cell Environ. 1995, 18, 1183–1200. [Google Scholar] [CrossRef]
  26. Wang, Y.P.; Leuning, R. A two-leaf model for canopy conductance, photosynthesis and partitioning of available energy. I: Model description and comparison with a multi-layered model. Agric. For. Meteorol. 1998, 91, 89–111. [Google Scholar] [CrossRef]
  27. Farquhar, G.D.; von Caemmerer, S.; Berry, J.A. A biochemical model of photosynthetic CO2 assimilation in leaves of C3 species. Planta 1980, 149, 78–90. [Google Scholar] [CrossRef]
  28. Jin, S.; Zhou, X.; Fan, J. Modeling daily photosynthesis of nine major tree species in northeast China. For. Ecol. Manag. 2003, 184, 125–140. [Google Scholar] [CrossRef]
  29. Mayoral, C.; Calama, R.; Sánchez-González, M.; Pardos, M. Modelling the influence of light, water and temperature on photosynthesis in young trees of mixed Mediterranean forests. New For. 2015, 46, 485–506. [Google Scholar] [CrossRef]
  30. Lambers, H.; Chapin, F.S.; Pons, T.L. Plant Physiological Ecology; Springer: New York, NY, USA, 1998. [Google Scholar]
  31. Rijkers, T.; Pons, T.L.; Bongers, F. The Effect of Tree Height and Light Availability on Photosynthetic Leaf Traits of Four Neotropical Species Differing in Shade Tolerance. Funct. Ecol. 2000, 14, 77–86. [Google Scholar] [CrossRef]
  32. Xu, J.Z.; Yu, Y.M.; Peng, S.Z.; Yang, S.H.; Liao, L.X. A modified nonrectangular hyperbola equation for photosynthetic light-response curves of leaves with different nitrogen status. Photosynthetica 2014, 52, 117–123. [Google Scholar] [CrossRef]
  33. Riikonen, J.; Oksanen, E.; Peltonen, P.; Holopainen, T.; Vapaavuori, E. Seasonal variation in physiological characteristics of two silver birch clones in the field. Can. J. For. Res. 2003, 33, 2164–2176. [Google Scholar] [CrossRef]
  34. Han, Q.M. Height-related decreases in mesophyll conductance, leaf photosynthesis and compensating adjustments associated with leaf nitrogen concentrations in Pinus densiflora. Tree Physiol. 2011, 31, 976–984. [Google Scholar] [CrossRef] [Green Version]
  35. Mullin, L.P.; Sillett, S.C.; Koch, G.; Tu, K.; Antoine, M.E. Physiological consequences of height-related morphological variation in Sequoia sempervirens foliage. Tree Physiol. 2009, 29, 1–12. [Google Scholar] [CrossRef]
  36. Flexas, J.; Barbour, M.M.; Brendel, O.; Cabrera, H.M.; Carriquí, M.; Díaz-Espejo, A.; Douthe, C.; Dreyer, E.; Ferrio, J.P.; Gago, J.; et al. Mesophyll diffusion conductance to CO2: An unappreciated central player in photosynthesis. Plant Sci. 2012, 193, 70–84. [Google Scholar] [CrossRef]
  37. Woodruff, D.R. The impacts of water stress on phloem transport in Douglas-fir trees. Tree Physiol. 2014, 34, 5–14. [Google Scholar] [CrossRef]
  38. Bond, B.J.; Farnsworth, B.T.; Coulombe, R.A.; Winner, W.E. Foliage physiology and biochemistry in response to light gradients in conifers with varying shade tolerance. Oecologia 1999, 120, 183–192. [Google Scholar] [CrossRef]
  39. Shipley, B.; Vile, D.; Garnier, E.; Wright, I.J.; Poorter, H. Functional Linkages between Leaf Traits and Net Photosynthetic Rate: Reconciling Empirical and Mechanistic Models. Funct. Ecol. 2005, 19, 602–615. [Google Scholar] [CrossRef]
  40. Givnish, T.J.; Montgomery, R.A.; Goldstein, G. Adaptive radiation of photosynthetic physiology in the Hawaiian lobeliads: Light regimes, static light responses, and whole-plant compensation points. Am. J. Bot. 2004, 91, 228–246. [Google Scholar] [CrossRef]
  41. Arora, A.; Singh, V.P.; Mohan, J. Effect of nitrogen and water stress on photosynthesis and nitrogen content in wheat. Biol. Plant. 2001, 44, 153–155. [Google Scholar] [CrossRef]
  42. Kull, O.; Kruijt, B. Leaf photosynthetic light response: A mechanistic model for scaling photosynthesis to leaves and canopies. Funct. Ecol. 1998, 12, 767–777. [Google Scholar] [CrossRef]
  43. Atkin, O.K.; Scheurwater, I.; Pons, T.L. High thermal acclimation potential of both photosynthesis and respiration in two lowland Plantago species in contrast to an alpine congeneric. Glob. Chang. Biol. 2006, 12, 500–515. [Google Scholar] [CrossRef]
  44. Sage, R.F.; Kubien, D.S. The temperature response of C3, and C4, photosynthesis. Plant Cell Environ. 2010, 30, 1086–1106. [Google Scholar] [CrossRef]
  45. Campbell, C.; Atkinson, L.; Zaragoza-Castells, J.; Lundmark, M.; Atkin, O.; Hurry, V. Acclimation of photosynthesis and respiration is asynchronous in response to changes in temperature regardless of plant functional group. New Phytol. 2007, 176, 375–389. [Google Scholar] [CrossRef] [Green Version]
  46. Kosugi, Y.; Shibata, S.; Kobashi, S. Parameterization of the CO2 and H2O gas exchange of several temperate deciduous broad-leaved trees at the leaf scale considering seasonal changes. Plant Cell Environ. 2003, 26, 285–301. [Google Scholar] [CrossRef]
  47. Han, Q.; Kawasaki, T.; Katahata, S.; Mukai, Y.; Chiba, Y. Horizontal and vertical variations in photosynthetic capacity in a Pinus densiflora crown in relation to leaf nitrogen allocation and acclimation to irradiance. Tree Physiol. 2003, 23, 851–857. [Google Scholar] [CrossRef] [Green Version]
  48. O’Grady, A.P.; Worledge, D.; Wilkinson, A.; Battaglia, M. Photosynthesis and respiration decline with light intensity in dominant and suppressed Eucalyptus globulus canopies. Funct. Plant Biol. 2008, 35, 439–447. [Google Scholar] [CrossRef]
  49. Weerasinghe, L.K.; Creek, D.; Crous, K.Y.; Xiang, S.; Liddell, M.J.; Turnbull, M.H.; Atkin, O.K. Canopy position affects the relationships between leaf respiration and associated traits in a tropical rainforest in Far North Queensland. Tree Physiol. 2014, 34, 564–584. [Google Scholar] [CrossRef] [Green Version]
  50. Hamada, S.; Kumagai, T.; Kochi, K.; Kobayashi, N.; Hiyama, T.; Miyazawa, Y. Spatial and temporal variations in photosynthetic capacity of a temperate deciduous-evergreen forest. Trees 2016, 30, 1083–1093. [Google Scholar] [CrossRef]
  51. Prentice, I.C.; Leemans, R. Pattern and Process and the Dynamics of Forest Structure: A Simulation Approach. J. Ecol. 1990, 78, 340–355. [Google Scholar] [CrossRef]
  52. Kohler, P.; Huth, A. The effects of tree species grouping in tropical rainforest modelling: Simulations with the individual-based model Formind. Ecol. Model. 1998, 109, 301–321. [Google Scholar] [CrossRef] [Green Version]
  53. Sitch, S.; Smith, B.; Prentice, I.C. Evaluation of ecosystem dynamics, plant geography and terrestrial carbon cycling in the LPJ dynamic global vegetation model. Glob. Chang. Biol. 2003, 9, 161–185. [Google Scholar] [CrossRef]
  54. Yan, X.; Shugart, H. FAREAST: A forest gap model to simulate dynamics and patterns of eastern Eurasian forests. J. Biogeogr. 2010, 32, 1641–1658. [Google Scholar]
  55. Clark, D.B.; Mercado, L.M.; Sitch, S.; Jones, C.D.; Gedney, N.; Best, M.J.; Pryor, M.; Rooney, G.G.; Essery, R.L.H.; Blyth, E.; et al. The Joint UK Land Environment Simulator (JULES), model description—Part 2: Carbon fluxes and vegetation dynamics. Geosci. Model Dev. 2011, 4, 701–722. [Google Scholar] [CrossRef]
  56. Vose, J.M.; Swank, W.T. Assessing seasonal leaf area dynamics and vertical leaf area distribution in eastern white pine (Pinus strobus L.) with a portable light meter. Tree Physiol. 1990, 7, 125–134. [Google Scholar] [CrossRef]
  57. Vose, J.M.; Clinton, B.D.; Sullivan, N.H.; Bolstad, P.V. Vertical leaf area distribution, light transmittance, and application of the Beer–Lambert Law in four mature hardwood stands in the southern Appalachians. Can. J. For. Res. 1995, 25, 1036–1043. [Google Scholar] [CrossRef]
  58. Monsi, M. On the factor light in plant communities and its importance for matter production. Ann. Bot. 2005, 95, 549–567. [Google Scholar] [CrossRef]
  59. Campbell, G.S. Extinction coefficients for radiation in plant canopies calculated using an ellipsoidal inclination angle distribution. Agric. For. Meteorol. 1986, 36, 317–321. [Google Scholar] [CrossRef]
  60. Campbell, G.S. Derivation of an angle density function for canopies with ellipsoidal leaf angle distributions. Agric. For. Meteorol. 1990, 49, 173–176. [Google Scholar] [CrossRef]
  61. Wang, Y.P.; Jarvis, P.G. Influence of crown structural properties on PAR absorption, photosynthesis, and transpiration in Sitka spruce: Application of a model (MAESTRO). Tree Physiol. 1990, 7, 297–316. [Google Scholar] [CrossRef]
  62. Chen, J.M.; Leblanc, S.G. A four-scale bidirectional reflectance model based on canopy architecture. IEEE Trans. Geosci. Remote Sens. 1997, 35, 1316–1337. [Google Scholar] [CrossRef] [Green Version]
  63. Wang, W.M.; Li, Z.L.; Su, H.B. Comparison of leaf angle distribution functions: Effects on extinction coefficient and fraction of sunlit foliage. Agric. For. Meteorol. 2007, 143, 106–122. [Google Scholar] [CrossRef] [Green Version]
  64. Wirth, R.; Weber, B.; Ryel, R.J. Spatial and temporal variability of canopy structure in a tropical moist forest. Acta Oecol. 2001, 22, 235–244. [Google Scholar] [CrossRef]
  65. Aubin, I.; Beaudet, M.; Messier, C. Light extinction coefficients specific to the understory vegetation of the southern boreal forest, Quebec. Can. J. For. Res. 2000, 30, 168–177. [Google Scholar] [CrossRef] [Green Version]
  66. Pierce, L.L.; Running, S.W. Rapid Estimation of Coniferous Forest Leaf Area Index Using a Portable Integrating Radiometer. Ecology 1988, 69, 1762–1767. [Google Scholar] [CrossRef]
  67. Liu, Q.; Dong, L.H.; Li, F.R.; Xie, L.F. Spatial heterogeneity of canopy photosynthesis for Larix olgensis. Chin. J. Appl. Ecol. 2016, 27, 2789–2796. (In Chinese) [Google Scholar]
  68. Cluzeau, C.; Goff, N.L.; Ottorini, J.M. Development of primary branches and crown profile of Fraxinus excelsior. Can. J. For. Res. 1994, 24, 2315–2323. [Google Scholar] [CrossRef]
  69. Bassman, J.H.; Zwier, J.C. Gas exchange characteristics of Populus trichocarpa, Populus deltoides and Populus trichocarpa × P. deltoides clones. Tree Physiol. 1991, 8, 145–159. [Google Scholar] [CrossRef]
  70. Niinemets, U.; Kull, O.; Tenhunen, J.D. Within-canopy variation in the rate of development of photosynthetic capacity is proportional to integrated quantum flux density in temperate deciduous trees. Plant Cell Environ. 2004, 27, 293–313. [Google Scholar] [CrossRef] [Green Version]
  71. Griffin, K.L.; Tissue, D.T.; Turnbull, M.H.; Schuster, W.; Whitehead, D. Leaf dark respiration as a function of canopy position in Nothofagus fusca trees grown at ambient and elevated CO2 partial pressures for 5 years. Funct. Ecol. 2001, 15, 497–505. [Google Scholar] [CrossRef]
  72. Xu, C.Y.; Griffin, K.L. Seasonal variation in the temperature response of leaf respiration in Quercus rubra: Foliage respiration and leaf properties. Funct. Ecol. 2006, 20, 778–789. [Google Scholar] [CrossRef]
  73. Ambrose, A.R.; Sillett, S.C.; Dawson, T.E. Effects of tree height on branch hydraulics, leaf structure and gas exchange in California redwoods. Plant Cell Environ. 2009, 32, 743–757. [Google Scholar] [CrossRef] [Green Version]
  74. Kosugi, Y.; Takanashi, S.; Yokoyama, N.; Kamakura, M. Vertical variation in leaf gas exchange parameters for a Southeast Asian tropical rainforest in Peninsular Malaysia. J. Plant Res. 2012, 125, 735–748. [Google Scholar] [CrossRef]
  75. Fellner, H.; Dirnberger, G.F.; Sterba, H. Specific leaf area of European Larch (Larix decidua Mill.). Trees 2016, 30, 1237–1244. [Google Scholar] [CrossRef]
  76. Kenzo, T.; Ichie, T.; Watanabe, Y.; Koike, T. Changes in photosynthesis and leaf characteristics with tree height in five dipterocarp species in a tropical rain forest. Tree Physiol. 2006, 26, 865–873. [Google Scholar] [CrossRef] [Green Version]
  77. Meinzer, F.C.; Bond, B.J.; Karanian, J.A. Biophysical constraints on leaf expansion in a tall conifer. Tree Physiol. 2008, 28, 197–206. [Google Scholar] [CrossRef] [Green Version]
  78. Sperlich, D.; Chang, C.T.; Penuelas, J.; Gracia, C.; Sabaté, S. Seasonal variability of foliar photosynthetic and morphological traits and drought impacts in a Mediterranean mixed forest. Tree Physiol. 2015, 35, 501–520. [Google Scholar] [CrossRef] [Green Version]
  79. Marshall, J.D.; Monserud, R.A. Foliage height influences specific leaf area of three conifer species. Can. J. For. Res. 2003, 33, 164–170. [Google Scholar] [CrossRef]
  80. Koch, G.W.; Sillett, S.C.; Jennings, G.M.; Davis, S.D. The limits to tree height. Nature 2004, 428, 851–854. [Google Scholar] [CrossRef] [Green Version]
  81. Xiao, C.W.; Janssens, I.A.; Yuste, J.C.; Ceulemans, R. Variation of specific leaf area and upscaling to leaf area index in mature scots pine. Trees 2006, 20, 304–310. [Google Scholar] [CrossRef]
  82. Hikosaka, K.; Nabeshima, E.; Hiura, T. Seasonal changes in the temperature response of photosynthesis in canopy leaves of Quercus crispula in a cool-temperate forest. Tree Physiol. 2007, 27, 1035–1041. [Google Scholar] [CrossRef]
  83. Way, D.A.; Sage, R.F. Thermal acclimation of photosynthesis in black spruce [Picea mariana (Mill). B.S.P.]. Plant Cell Environ. 2008, 31, 1250–1262. [Google Scholar] [CrossRef]
  84. Wieser, G.; Oberhuber, W.; Walder, L.; Spieler, D.; Gruber, A. Photosynthetic temperature adaptation of Pinus cembra, within the timberline ecotone of the Central Austrian Alps. Ann. For. Sci. 2010, 67, 201. [Google Scholar] [CrossRef]
  85. Lin, Y.S.; Medlyn, B.E.; Ellsworth, D.S. Temperature responses of leaf net photosynthesis: The role of component processes. Tree Physiol. 2012, 32, 219–231. [Google Scholar] [CrossRef]
  86. Rodríguez-calcerrada, J.; Atkin, O.K.; Robson, T.M.; Zaragoza-castells, J.; Gil, L.; Aranda, I. Thermal acclimation of leaf dark respiration of beech seedlings experiencing summer drought in high and low light environments. Tree Physiol. 2010, 30, 214–224. [Google Scholar] [CrossRef]
  87. Day, M.E. Influence of temperature and leaf-to-air vapor pressure deficit on net photosynthesis and stomatal conductance in red spruce (Picea rubens). Tree Physiol. 2000, 20, 57–63. [Google Scholar] [CrossRef]
  88. Awada, T.; Radoglou, K.; Fotelli, M.N.; Constantinidou, H.I.A. Ecophysiology of seedlings of three Mediterranean pine species in contrasting light regimes. Tree Physiol. 2003, 23, 33–41. [Google Scholar] [CrossRef] [Green Version]
  89. Voelker, S.L.; Meinzer, F.C.; Way, D. Where and when does stem cellulose δ18O reflect a leaf water enrichment signal? Tree Physiol. 2017, 37, 551–553. [Google Scholar] [CrossRef]
  90. Cannell, M.G.R.; Thornley, J.H.M. Temperature and CO2 Responses of Leaf and Canopy Photosynthesis: A Clarification using the Non-rectangular Hyperbola Model of Photosynthesis. Ann. Bot. 1998, 82, 883–892. [Google Scholar] [CrossRef]
  91. Xu, J.Z.; Wang, Y.H.; Yang, S.H.; Peng, S.Z.; Kong, W.L. Improved performance of photosynthetic light response equations with unified parameters for rice leaves with different SPAD values. Pak. J. Bot. 2015, 47, 877–882. [Google Scholar]
  92. Wilson, K.B.; Baldocchi, D.D.; Hanson, P.J. Leaf age affects the seasonal pattern of photosynthetic capacity and net ecosystem exchange of carbon in a deciduous forest. Plant Cell Environ. 2001, 24, 571–583. [Google Scholar] [CrossRef]
  93. Tanaka, K.; Kosugi, Y.; Nakamura, A. Impact of leaf physiological characteristics on seasonal variation in CO2, latent and sensible heat exchanges over a tree plantation. Agric. For. Meteorol. 2002, 114, 103–122. [Google Scholar] [CrossRef]
  94. Grassi, G.; Vicinelli, E.; Ponti, F.; Cantoni, L.; Magnani, F. Seasonal and interannual variability of photosynthetic capacity in relation to leaf nitrogen in a deciduous forest plantation in northern Italy. Tree Physiol. 2005, 25, 349–360. [Google Scholar] [CrossRef] [PubMed] [Green Version]
  95. Coble, A.P.; Vanderwall, B.; Mau, A.; Cavaleri, M. How vertical patterns in leaf traits shift seasonally and the implications for modeling canopy photosynthesis in a temperate deciduous forest. Tree Physiol. 2016, 36, 1077–1091. [Google Scholar] [CrossRef]
  96. Nouvellon, Y.; Laclau, J.P.; Epron, D.; Kinana, A.; Mabiala, A.; Roupsard, O.; Bonnefond, J.M.; Maire, G.; Marsden, C.; Bontemps, J.D.; et al. Within-stand and seasonal variations of specific leaf area in a clonal Eucalyptus plantation in the Republic of Congo. For. Ecol. Manag. 2010, 259, 1796–1807. [Google Scholar] [CrossRef]
  97. Bauerle, W.L.; Oren, R.; Way, D.A.; Qian, S.S.; Stoy, P.C.; Thornton, P.E.; Bowden, J.D.; Hoffman, F.M.; Reynolds, R.F. Photoperiodic regulation of the seasonal pattern of photosynthetic capacity and the implications for carbon cycling. Proc. Natl. Acad. Sci. USA 2012, 109, 8612–8617. [Google Scholar] [CrossRef] [Green Version]
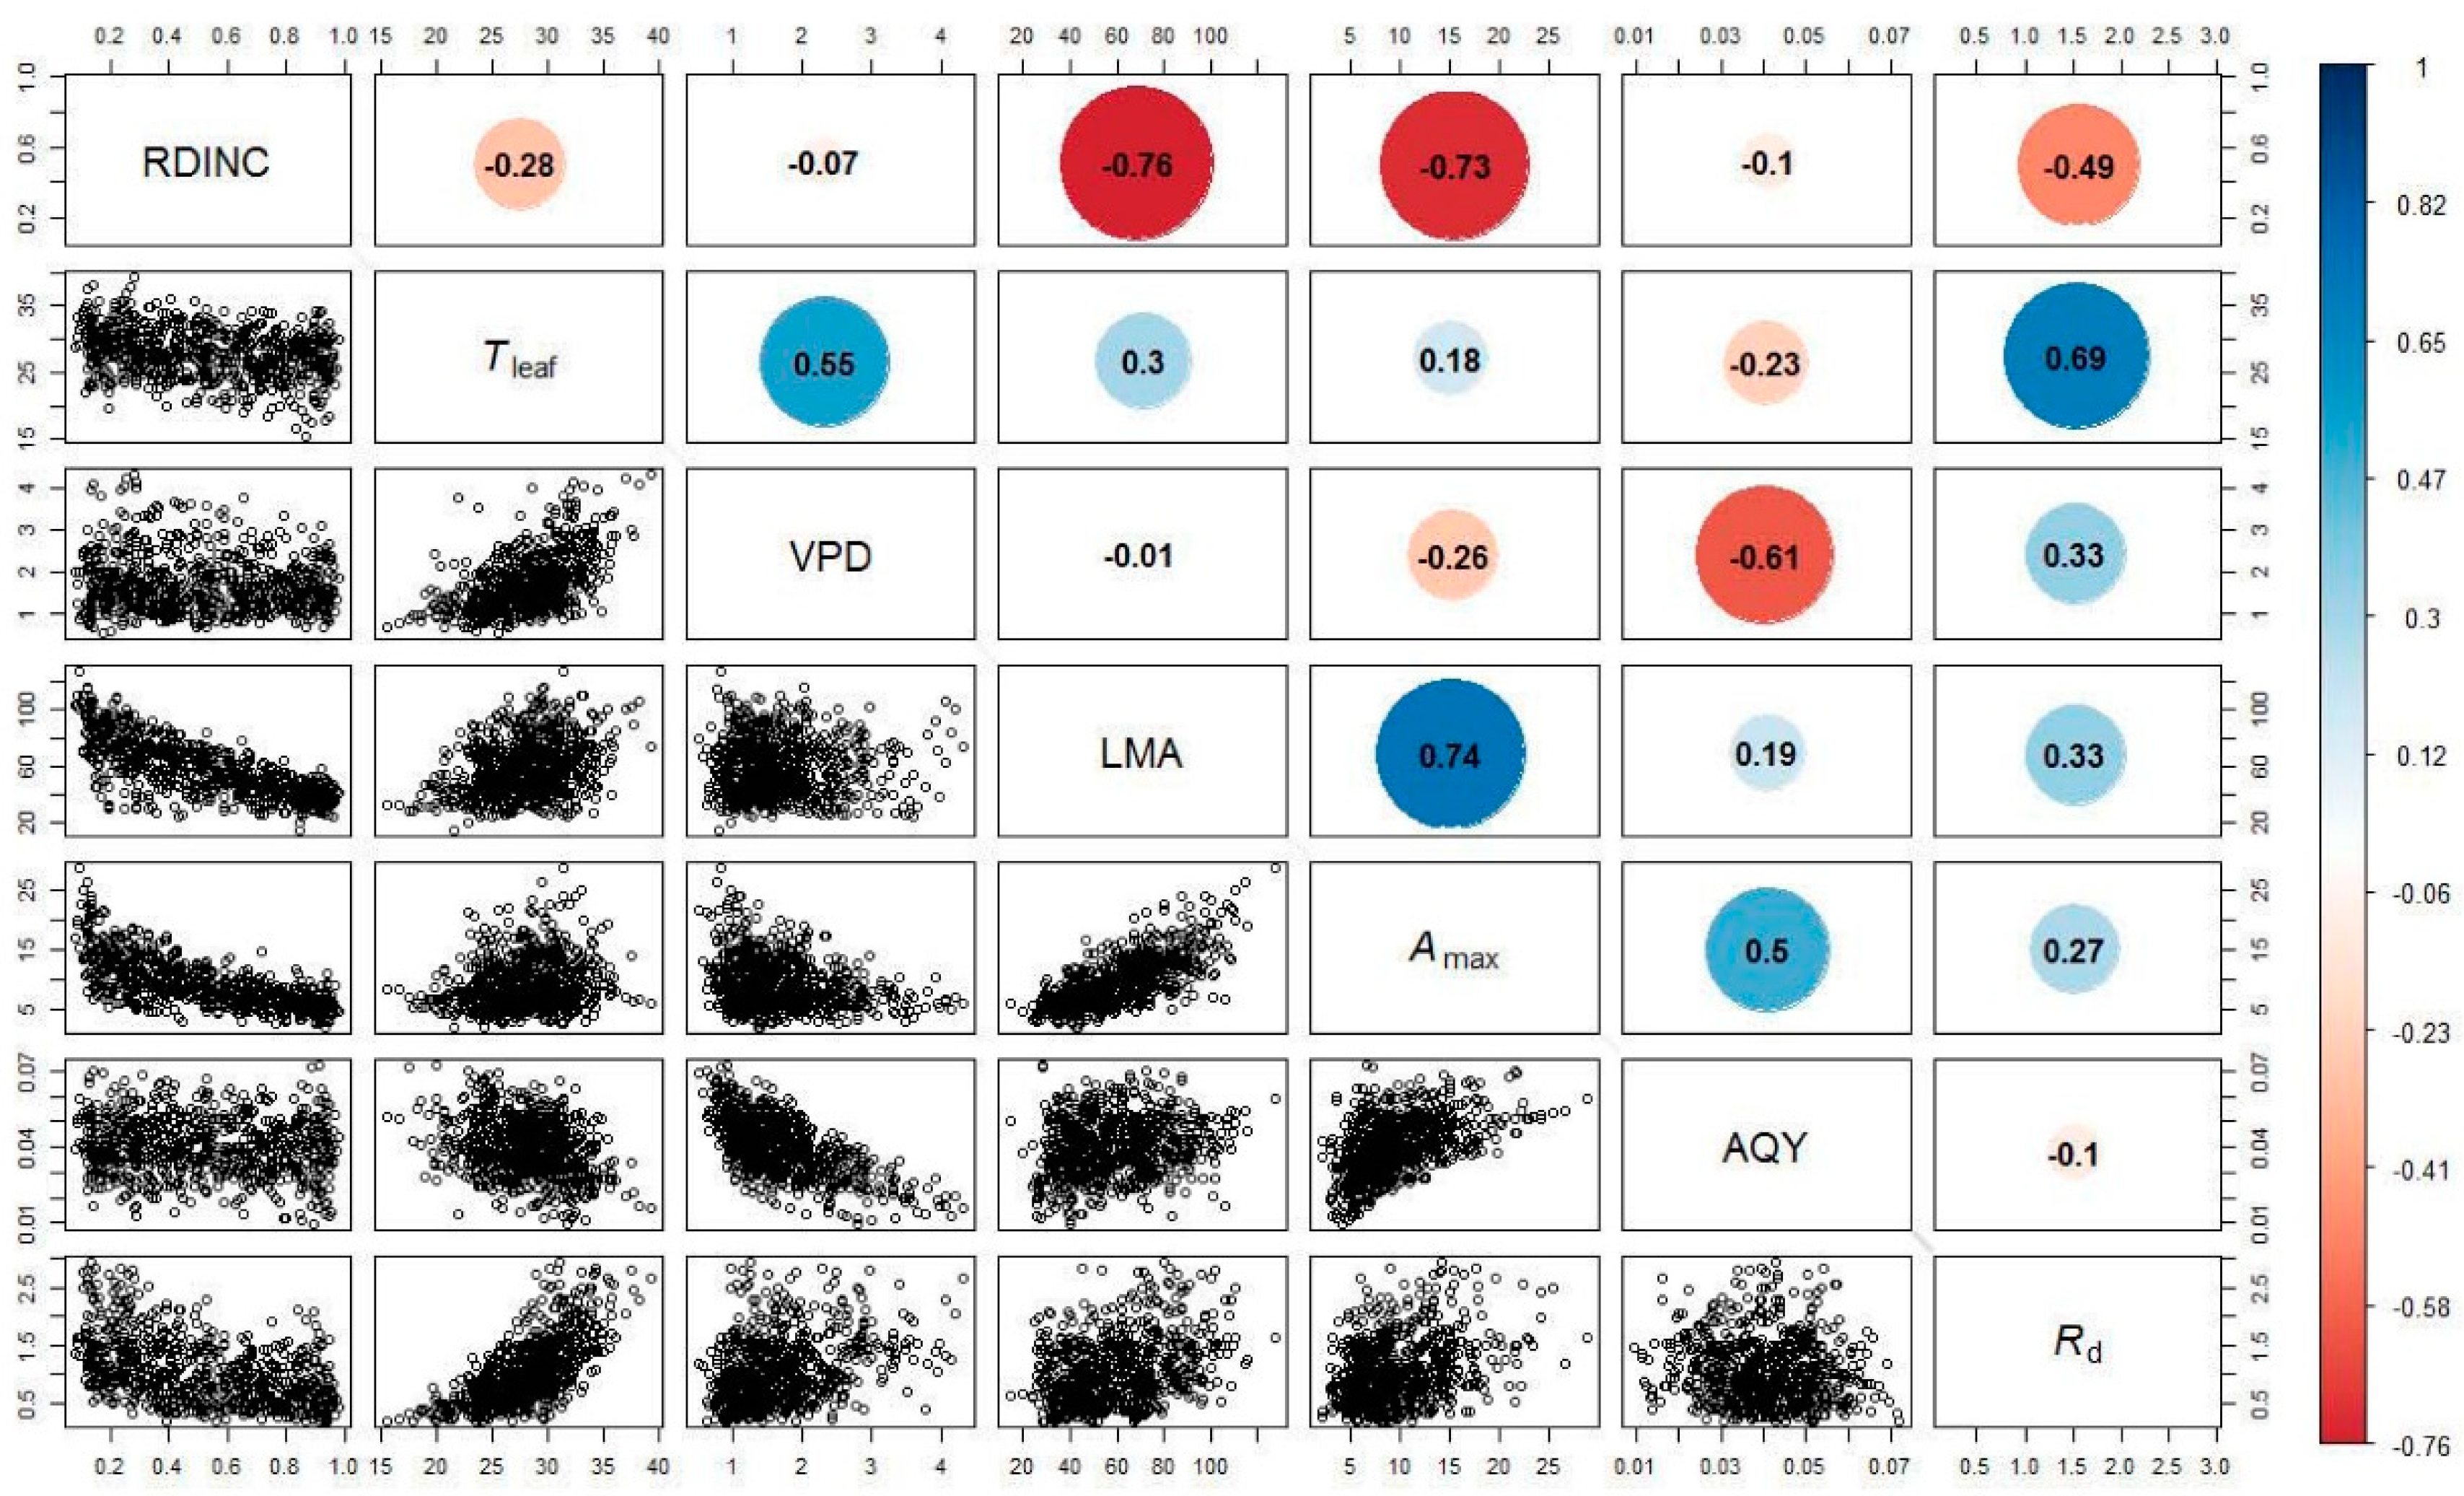
Figure 1. Relationships between the fitted parameters (The maximum net photosynthetic rate, Amax, μmol m−2 s−1; the apparent quantum yield, AQY; and the dark respiration rate, Rd, μmol m−2 s−1) for the modified Mitscherlich equation and the relative depth into the crown (RDINC), leaf temperature (Tleaf, °C), vaper pressure deficit (VPD, kPa) and leaf mass per area (LMA, g m−2) in the 752 needle clusters from the five sample trees (open circles). Color circles containing values show Spearman’s correlation coefficients (α = 0.05).
Forests 10 00321 g001
Figure 2. Vertical patterns of light transmittance (The ratio of photosynthetically active radiation in the crown to the incident photosynthetically active radiation, LT) for the planted Larix olgensis Henry trees. (a~e) represents Tree I ~ Tree V. The dark circles are the mean LT in each pseudowhorl, and the black bars are standard deviations.
Forests 10 00321 g002
Figure 3. Vertical patterns of the extinction coefficient (k) for the five planted Larix olgensis trees. (a~e) represents Tree I ~ Tree V. The RDINC is the relative depth into the crown; the dark circles are mean k in each pseudowhorl; the black bars are standard deviations; and the dotted lines are the trendlines following the power function.
Forests 10 00321 g003
Figure 4. The dynamic simulation of (a) the net photosynthetic rate (An) per area (An-area) and (b) the total An per pseudowhorl (An-pw) (only tree I was used as an example during July). Three pseudowhorls with relative depths into the crown (RDINC) of 0.22, 0.49 and 0.88, representing the upper, middle and lower crowns, respectively, were selected.
Forests 10 00321 g004
Figure 5. The daily net photosynthetic production of the whole crown (NPPD) based on Equation (8) (NPPD-I) and Equation (2) (NPPD-II) for tree I and the corresponding cumulative daily photosynthetically active radiation (PARD).
Forests 10 00321 g005
Figure 6. The performance of the estimation of the photosynthetically active radiation (PAR) distribution within crowns with different extinction coefficient (k) values. R2 is the coefficient of determination, and RMSE is the root mean square error.
Forests 10 00321 g006
Figure 7. Comparison of the observed and simulated photosynthetically active radiation (PAR) within a crown: (a) PAR is simulated with the k model that was constructed in this study; (b) PAR is simulated with k values ranging from 0.30 to 0.50 at 0.01 intervals; (c) PAR is simulated with k values that were calculated from the empirical equation [60]; and (d) PAR is simulated with the k values that were calculated from the empirical equation [61].
Forests 10 00321 g007
Figure 8. The daily net photosynthetic production of the whole crown (NPPD) of each pseudowhorl and the whole crown for tree I. The k values for calculating NPPD were respectively determined based on the k model which was constructed in this study (I) and an optimum constant value of 0.33 (II).
Forests 10 00321 g008
Table 1. Summary of parameters of all the photosynthetic light-response (PLR) curves, leaf traits and environmental conditions in 2016–2017. The following leaf variables are given: the maximum net photosynthetic rate (Amax), apparent quantum yield (AQY), dark respiration rate (Rd), photosynthetic light response curve (PLR), relative depth into crown (RDINC), leaf mass per area (LMA) leaf temperature (Tleaf) and vapor pressure deficit (VPD). Mean, Std., Max. and Min. represent the mean value, standard deviation, maximum value and minimum value respectively. The values are based on 752 individual needle-clusters from 36 pseudowhorls belonging to five planted Larix olgensis Henry trees.
RDINCStatisticsPhotosynthetic ParametersLeaf TraitEnvironmental Conditions
Amax
(μmol m−2 s−1)
AQYRd
(μmol m−2 s−1)
LMA
(g m−2)
Tleaf
(°C)
VPD
(kPa)
0.1–0.2Sample sizen = 1372 (108 PLR curves)
Mean14.800.041.4583.1729.321.69
Std.4.880.010.6018.863.450.67
Max.28.770.072.93127.5338.154.05
Min.5.570.020.5429.1819.530.51
0.2–0.3Sample sizen = 1200 (103 PLR curves)
Mean11.810.041.4572.7729.731.90
Std.3.430.010.6016.763.450.83
Max.18.650.072.85108.6739.374.32
Min.5.230.010.3129.7923.110.56
0.3–0.4Sample sizen = 1077 (89 PLR curves)
Mean11.080.041.1165.2128.031.68
Std.3.300.010.5214.383.300.71
Max.17.790.072.5192.5935.583.55
Min.4.700.020.1826.6419.740.78
0.4–0.5Sample sizen = 958 (75 PLR curves)
Mean9.920.041.0160.0028.311.72
Std.2.510.010.5213.783.500.77
Max.15.020.062.1584.9036.073.64
Min.3.210.010.3124.8520.420.65
0.5–0.6Sample sizen = 959 (78 PLR curves)
Mean8.720.040.9155.5827.401.70
Std.2.150.010.4512.163.470.71
Max.13.240.072.2984.2634.543.55
Min.4.410.020.1928.8519.710.67
0.6–0.7Sample sizen = 896 (73 PLR curves)
Mean7.380.040.8350.2427.121.62
Std.1.930.010.3510.333.440.60
Max.13.690.061.6577.5534.203.76
Min.3.070.010.3029.3118.960.79
0.7–0.8Sample sizen = 1001 (81 PLR curves)
Mean6.670.040.7644.2626.711.58
Std.1.960.010.358.873.360.54
Max.14.870.061.9164.2334.203.33
Min.2.890.010.2325.8518.500.75
0.8–0.9Sample sizen = 893 (73 PLR curves)
Mean6.420.040.8439.5926.631.57
Std.1.810.010.447.903.840.51
Max.11.930.072.1354.4933.463.01
Min.3.470.010.2014.2815.450.64
0.9–1.0Sample sizen = 947 (72 PLR curves)
Mean5.490.040.6737.7726.861.59
Std.1.770.010.397.043.550.51
Max.10.990.071.8458.7334.383.07
Min.2.100.010.1723.9817.800.64
Table 2. Summary of the main measured variables. The following variables are given: the photosynthetically active radiation in each pseudowhorl (PARi), incident PAR at the top of the crown (PARt), the solar elevation angle (ψ), leaf area in each pseudowhorl (LAi), relative cumulative leaf area index in each pseudowhorl (RCLAIi). i is the serial number of pseudowhorls belonging to five planted Larix olgensis trees.
StatisticsFitting DataValidation Data
PARiPARtψLAiRCLAIiPARiPARtψLAiRCLAIi
Sample size386523863643161231613643
Mean348143946.922.413.49346148046.421.463.39
Std.30241214.212.130.8335242213.811.980.84
Max.1356193968.437.194.591678193166.937.194.59
Min.518713.20.330.88415519.40.330.88
Table 3. Parameter estimates for the crown photosynthetic light-response (PLR) curves model of planted Larix olgensis trees and the goodness of fit statistics. p-value: the level of significance for the parameter estimations, Std. error: standard error for the parameter estimations, R2: coefficient of determination, RMSE: root mean square error, ME: mean error, P: precision estimation.
ParametersEstimatep-ValueStd. ErrorGoodness of FitValidation
R2RMSE
(μmol m−2 s−1)
R2RMSE
(μmol m−2 s−1)
ME
(μmol m−2 s−1)
P %
a03.436<0.0010.02700.8831.4400.8491.670-0.11493.19
a1−5.448<0.0010.1283
b0−0.014<0.0010.0002
b10.062<0.0010.0009
Rd0.979<0.0010.1931
Table 4. Parameter estimates for the extinction coefficient (k) model of planted Larix olgensis trees and the goodness of fit and validation statistics. p-value: the level of significance for the parameter estimations, Std. error: standard error for the parameter estimations, Tree no.: tree number; R2: coefficient of determination, RMSE: root mean square error, ME: mean error, P%: precision estimation.
ParametersEstimatep-ValueStd. ErrorGoodness of FitValidation
R2RMSER2RMSEMEP%
d00.006<0.0010.0010.5250.1590.6190.1700.03893.15
d1−0.028<0.0010.004
d21.275<0.0010.138
e0−0.0370.02370.014
e12.133<0.00010.449