Abstract
In this study, we aim to advance the optimization of daily large fire containment strategies for ground-based suppression resources by leveraging fire risk assessment results commonly used by fire managers in the western USA. We begin from an existing decision framework that spatially overlays fire risk assessment results with pre-identified potential wildland fire operational delineations (PODs), and then clusters PODs into a response POD (rPOD) using a mixed integer program (MIP) model to minimize expected loss. We improve and expand upon this decision framework through enhanced fire modeling integration and refined analysis of probabilistic and time-sensitive information. Specifically, we expand the set of data inputs to include raster layers of simulated burn probability, flame length probability, fire arrival time, and expected net value change, all calculated using a common set of stochastic weather forecasts and landscape data. Furthermore, we develop a secondary optimization model that, for a given optimal rPOD, dictates the timing of fire line construction activities to ensure completion of containment line prior to fire arrival along specific rPOD edges. The set of management decisions considered includes assignment of PODs to be included in the rPOD, assignment of suppression resources to protect susceptible structures within the rPOD, and assignment of suppression resources to construct fire lines, on specific days, along the perimeter of the rPOD. We explore how fire manager risk preferences regarding firefighter safety affect optimal rPOD characteristics, and use a simple decision tree to display multiple solutions and support rapid assessment of alternatives. We base our test cases on the FSPro simulation of the 2017 Sliderock Fire that burned on the Lolo National Forest in Montana, USA. The overarching goal of this research is to generate operationally relevant decision support that can best balance the benefits and losses from wildfire and the cost from responding to wildfire.
1. Introduction
Wildfire management can be a complex decision-making process involving uncertain and dynamic conditions, and requiring rapid assimilation of multiple types of information from various sources [1,2]. Operations research (OR) models can be used to help integrate fire data, suggest management strategies, and conduct tradeoff analysis to assist fire decision processes [3,4,5,6]. OR models developed for wildfire management can take many forms, ranging from pre-fire applications determining optimal investment portfolios in prevention/suppression activities along with optimal stationing and deployment rules for suppression resources [7,8,9,10,11,12], to post-fire applications determining optimal mitigation strategies for reducing debris flow risk [13].
Of interest here are OR models built for incident-level fire operations that endogenously determine suppression resource demands in relation to fire or landscape characteristics, and that assign suppression resources to support various tactical response decisions. We specifically focus our model on the objective of minimizing economic losses from an escaped fire, which is a common but non-exclusive fire management objective. Operationally, the tactics employed to meet this objective include any combination of direct, indirect or contingency line construction, as well as point protection of highly valued resources or assets. Both ground resources (e.g., fire engines, hand crews, bulldozers) and aerial resources (e.g., helicopters, fixed-wing aircraft) can support these tactics through various tasks, broadly intended to delay, stop, or extinguish a fire. Specific task typically includes advanced preparation and in situ point protection, containment line construction, burnout preparation and implementation, line holding (i.e., improving and patrolling) and mopping up. Delaying fire spread and reinforcing containment lines with aerial resources are also common tasks that help minimize losses. Published OR modeling research is reflective of these realities, focusing on construction of containment lines to manage the extent and location of burned areas [14,15,16], and the allocation of resources to point protect structures such as homes [17,18,19].
Here we present a mixed integer program (MIP) model where the decision variables relate to constructing fire line and protecting structures, and where objective functions could be designed to best balance the positive and negative wildfire effects, the expenditures from responding to wildfire, or the potential hazard to fire responders. Our primary research objectives are to develop OR models that: (1) are relevant to on-the-ground fire operations; (2) readily integrate with existing incident decision support systems; (3) improve assessment of incident-specific wildfire risk; and (4) ultimately, improve upon previous spatial response optimization work by incorporating additional probabilistic and time-sensitive information. Contextually we leveraged decision support products that are widely used by fire managers in the western USA, although the broad contours of the model are likely applicable elsewhere. Furthermore, we grounded our model development in risk management principles, increasingly being adopted by the wildland fire management community, which notably emphasize more proactive assessment and planning as a basis for supporting incident decisions, i.e., “engaging the fire before it starts” [20,21,22].
Regarding our first objective, we developed a network of pre-identified potential wildland fire operational delineations (PODs) as primary management units and decision variables. PODs are landscape polygons whose boundaries are features that are relevant to fire containment operations, such as roads, ridgetops, fuel transitions, water bodies, etc., within which risks, opportunities, and response strategies can be summarized [23]. PODs can be built using a combination of geospatial analysis and local expert knowledge, often with supporting analytical products identifying suppression opportunities and potential control locations (PCLs) [24,25]. PODs have been used to summarize suppression difficulty and protection demand [26], to optimize fuel treatment placement across a landscape [27], and, most relevant for our purposes, to optimize creation of clustered, or aggregated, response PODs (rPODs) for real-time incident support [28]. It is worth emphasizing that PODs are more than an academic concept; locally developed PODs were used for real-time decision support during the 2017 fire season on the Tonto National Forest in Arizona, USA [22,28,29], and analytical products serving as the building blocks of PODs [23,24] were delivered for real-time decision support for fifteen large fires across the western USA during the 2017 fire season [Risk Management Assistance Teams (RMAT) website, https://wfmrda.nwcg.gov/RMAT.html]. Furthermore, as of this writing, POD development to support spatial fire planning has already been carried out or is actively proceeding on National Forest System and adjacent lands in Arizona, California, Colorado, Montana, New Mexico, Oregon, and Washington, USA.
Regarding our second objective, we leveraged functionality from the Wildland Fire Decision Support System (WFDSS), a web-based platform developed in the USA that combines fire behavior modeling, economic principles, geospatial analysis, and information technology to support fire response decisions [30]. Specifically, we used the Fire Spread Probability (FSPro) model, which ingests topography, fuel data and daily fire weather forecasts during a fire event to stochastically simulate fire spread [31]. Results from those simulations are used to predict time-based burn probability contours or polygons, along with fire arrival times across the landscape, which we used as inputs to our MIP model. Although FSPro enables quantification of the exposure of highly valued resources and assets (HVRAs) in relation to burn probability, it does not estimate fire intensity or fire effects, which may inhibit analysis of tradeoffs across firefighter safety, suppression expenditures, and fire impacts to HVRAs [32].
This leads us to our third objective, better characterizing incident risk to HVRAs. As a basis we used a landscape-scale risk assessment framework that evaluates both the hazard (fire likelihood and intensity) and vulnerability (exposure and susceptibility) of HVRAs at every location (i.e., each grid cell) across a landscape [33,34]. The framework outlined in [35] is generalizable and scalable, such that risk assessment results can be used for a variety of purposes, including strategic budgeting, fuel treatment prioritization, and incident decision support [27,28,35,36]. In a pre-fire landscape-scale risk assessment, the fire likelihood and intensity estimates used to calculate expected net value change (eNVC) are commonly generated by a stochastic simulator such as FSim [37]. FSim’s fire behavior results do not model the weather at the time and place of any actual wildfire. Instead, they reflect the full range of weather conditions that exist across a relatively large landscape and during an entire fire season. For a risk assessment on an ongoing wildfire, an improvement could be made by generating fire likelihoods and intensities that are sensitive to the weather conditions likely to occur during the event. As described above, we used FSPro to generate fire likelihoods (burn probabilities), but not flame length probabilities (or intensity results of any kind). Instead, we used a deterministic modeling process called Flep-Gen (for Flame-Length Exceedance Probability Generator [38]) to estimate, for each grid cell, the probability that flame length will fall into each of six fire intensity levels (as is common with risk assessment, see [34]). Flame length classes used here are 0–0.61 m (0–2 ft), 0.61–1.22 m (2–4 ft), 1.22–1.83 m (4–6 ft), 1.83–2.44 m (6–8 ft), 2.44–3.66 m (8–12 ft), and >3.66 m (12 ft). By combining these incident-specific fire behavior simulations with pre-existing risk assessment data that characterize the location, susceptibility, and importance of HVRAs, we are able to calculate incident-specific eNVC values.
Lastly, we aim to capitalize on enhanced fire modeling integration to improve upon earlier work demonstrating the optimal rPOD concept. Our recent study [28] used a deterministic MIP model to integrate point protection decisions with strategic fire containment boundary design by aggregating pre-identified PODs into larger fire containers, i.e., rPODs. That approach defined a response strategy as the combination of fire line construction along rPOD containment boundaries and point protection assignments within that rPOD, and illustrated how optimal strategies varied with fire weather and budget constraint scenarios. However, the model used a conditional net value change layer assuming the entire selected rPOD burns under the specified weather scenario, meaning it did not consider fire spread probabilities. Nor did it consider the timing of line construction in relation to fire arrival times. Here, we expand the set of data inputs to include GIS raster layers of simulated burn probability, flame length (meter) probability, fire arrival time (day), and expected net value change, all calculated using common weather forecast data. To reiterate, the use of common weather data across fire modeling systems ensures that the same set of stochastic weathers were used to support FSPro fire simulations, estimation of expected fire loss/benefit, flame length probability prediction, and to support suppression decisions during a large fire event. Furthermore, we developed a secondary optimization model that, for a given optimal rPOD, dictates the timing of fire line construction activities to encourage completion of containment line prior to fire arrival along specific rPOD edges.
In the following sections we present our methods and results, tailored to a case study based on the simulations of the 2017 Sliderock Fire in Montana, USA. Both the inherent uncertainties in wildfire behaviors and fire manager’s different risk preferences could influence the selection of fire containment strategies. We generated alternative rPOD response strategies that vary with managerial risk preferences around cost and firefighter safety, and present a conceptual decision tree to demonstrate how such a tool could be used to facilitate tradeoff analysis and strategy selection. We further illustrate use of the model to develop a contingency strategy, which is consistent with the idea of re-running the tool in response to changes in factors such as fire weather, line effectiveness, and suppression resource availability. After presenting results we discuss model insights, limitations, and possible extensions. Through this study, we hope to demonstrate the potential of using OR models to integrate probabilistic data and to provide easily accessible response strategy suggestions that accord with fire manager’s risk preferences and that ultimately improve response safety and efficiency.
2. Materials and Methods
2.1. Modeling Overview
Figure 1 presents a general workflow for the model, with three particularly noteworthy elements: (1) grey boxes, which represent primary model outputs from the two MIP formulations; (2) green boxes, which correspond to probabilistic information generated from fire simulation models not incorporated into the original model of [28]; and (3) green arrows, which indicate managerial preferences regarding suppression cost, level of concerns for losing structures, and firefighter safety; we account for the latter by considering both flame length probabilities and fire arrival times along rPOD boundaries. Starting in the upper left-hand corner, fire simulation using FSPro and Flep-Gen is the base input data for MIP model, influencing eNVC calculations, line construction effort along PCLs (i.e., POD edges), point protection effort within rPODs, and timing of fire line construction. Note the two-way arrow between fire consequences and point protection effort, indicating solution-dependency of eNVC values on the allocated level of investment in point protection. Pre-identified PODs are featured in the center of the diagram as major decision variables in the model, and as major determinants of total eNVC and total suppression effort. By allowing managers to restrict fire line construction along POD edges based on safety concerns, the model may be forced to look elsewhere to construct line and bring extra PODs into the rPOD, hence the importance of POD adjacency relationships for construction of an rPOD. Although for completeness we described the generation of fire simulation and other input data, our primary focus here is development and implementation of the MIP models highlighted in the two grey boxes. This entails first the selection of the optimal rPOD and its corresponding suppression resource allocations to line construction and point protection, and then second the timing of fire line construction operations.
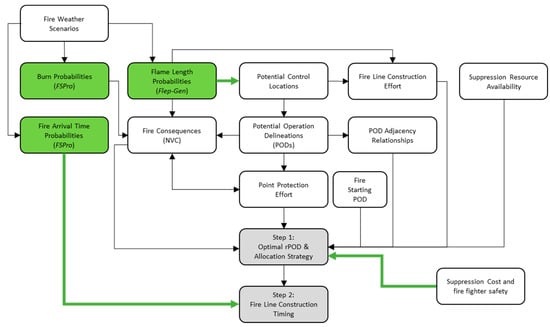
Figure 1.
Model workflow. Grey boxes indicate primary model outputs, green boxes indicate probabilistic information, and green arrows indicate manager risk preferences, white boxes indicate other input data or intermediate model outputs during the analysis.
2.2. Case Study Location and Input Data Generation
Figure 2 displays the case study location in the Northern Rocky Mountains of Montana, USA, encompassing portions of the Lolo and Beaverhead Deerlodge National Forests and the 2017 Sliderock Fire. The fire occurred on the National Forest land, where we were able to leverage pre-existing risk assessment layers. The final fire footprint and corresponding FSPro simulations were largely within National Forest boundaries thereby enabling wall-to-wall eNVC calculations. The fire was a lightning start along a ridge top at approximately 2133 m (7000 ft) elevation in subalpine forest with limited access from two adjacent trail systems in steeply bisected terrain. Located approximately 43 km southeast of Missoula, Montana, the fire was discovered on 13 July and within 24 h had grown to an estimated 30 ac (12 ha). “Access is difficult due to steep and narrow road systems. The course of action decision was made for a Point/Zone suppression strategy given the fire location is in remote, steep, rocky terrain with continuous fuels, and immediate proximity of values at risk. These values are related to private land in-holdings with structures, historical and communication structure on Sliderock Mountain, and BPA powerlines” (from WFDSS documentation). By the end of July, the fire had burned 722 ac (292 ha), and continued to grow slowly, eventually burning 901 ac (365 ha) by the end of August. We used this fire to build test cases to demonstrate how simulated fire spread data can be used to support large fire containment analysis. We used the fuel, vegetation and topography data available in WFDSS (stored as many raster-based GIS layers) to characterize the landscape within and surrounding the fire for all subsequent modeling of landscape and fuel conditions, fire behavior, and risk assessment.
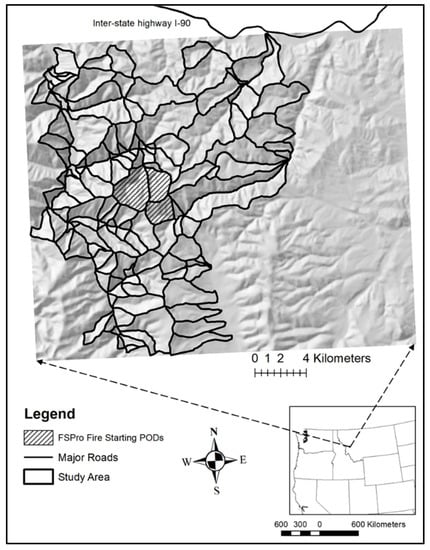
Figure 2.
Case study location including pre-identified POD boundaries, the perimeter of the Sliderock Fire (used as the fire-starting location for FSPro runs), a major highway and the general location of the study site in the USA.
Starting from the estimated perimeter on the morning of 14 July, we used the FSPro model within WFDSS to simulate four thousand 21-day iterations of fire growth to estimate the stochastic fire behaviors and spread patterns. FSPro takes in 3-day forecast weather data (wind speed, wind direction, and fuel moisture content) from a nearby, representative Remote Automated Weather Station (RAWS, ID 241405—Pistol Creek Station), and then generates weather conditions for the remainder of the 21 days by drawing randomly from historical weather data distributions associated with the selected RAWS. FSPro simulation requires a set of GIS raster layers as input data (a 60 m cell size is used here) including the standard Scott and Burgan fuel models [39], fuel conditions (e.g., canopy cover, canopy height, crown base height, crown bulk densities etc.), and terrain (elevation, slope, aspect). [31] The minimum travel time algorithm is used by FSPro to simulate single fire spread, and this process is repeated for each of the four thousand fire simulations. The model tallies the number of times each grid cell burns. The 21-day burn probability (Figure 3a) for each cell is the number of times the cell burned divided by four thousand. In addition to the overall burn probability, FSPro also produces spatial data regarding the frequency distribution of elapsed day of arrival at each grid cell. We used these data to calculate the earliest (minimum) (demonstrated in Figure 3b) and the mean fire arrival days across the landscape. Predicting fire arrival times to all potential control boundaries is necessary to support time specific suppression decisions, specifically so that containment effort (line construction, burn out operation, or reinforcement etc.) can be scheduled before fire arrival. We next used Flep-Gen to estimate the probability distribution of fire flame length falling into each of the six categories (Figure 4a–f) using the same landscape and near-term (3-day) weather data that was input into FSPro. Please note that those categories are commonly used in fire risk assessments for the U.S. National Forests.
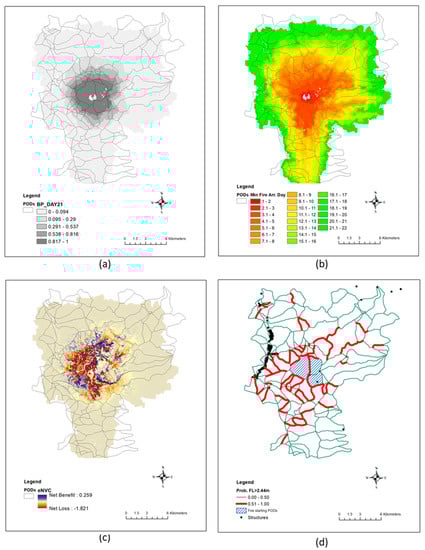
Figure 3.
Simulated fire behavior metrics from FSPro and Flep-Gen. Panel (a) displays burn probabilities for each pixel, over a 21-day horizon; panel (b) displays the minimum fire arrival day for each pixel; panel (c) displays expected net value change for each pixel; panel (d) displays the structures that may need point protection and the POD boundaries with more than 50% of chance of having an average flame length greater than 2.44 m (8 ft). These boundaries are considered as higher risk lines (HRLs) from the fire fighter safety aspect.
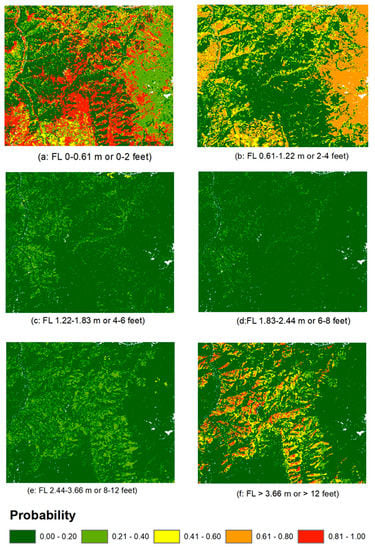
Figure 4.
The probability of fire falling into each flame length category, represented by panel (a–f), based on Flep-Gen results, i.e., “FL 2.44–3.66 m” represents a flame length >2.44 m and ≤3.66 m.
To assess risk, we leveraged existing HVRA susceptibility and relative importance information generated locally for the Lolo National Forest, which was similarly used in [27]. The Forest identified eight categories of HVRAs to include in their assessment: communities, municipal watersheds, structures, timber resources, ecosystems, critical wildlife habitat, recreation sites, and wilderness character. Calculation of eNVC involved four key variables: burn probability, flame length probability, the response (loss/benefit) of the HVRA to fire of various flame lengths, and HVRA-specific relative importance weights. The first two variables were generated through FSPro fire simulation, the third through elicitation of expert judgement from resource specialists, and the fourth through multi-criteria decision analysis with local leadership (see [34,36,40] for more details on the process). The eNVC calculations across the study site are demonstrated in Figure 3c. To quantify the benefit from point protection of structures potentially impacted by the fire, the probability of fire reaching each structure was multiplied with the HVRA value at the location of that structure to calculate the expected value change from point protection (). We measured the benefit of point protection by assuming that point protection allows the fire to occur without the impacts otherwise expected.
Our intention was to choose major roads, ridge lines, and rivers as POD boundaries in this study. However, because no defensible roads existed within the study site, the road layer was not used in delineating PODs except where local roads overlapped with rivers or ridge lines. To reiterate, POD boundaries are potential fire control locations. Flame length estimation and associated probabilities from Flep-Gen along each POD boundary is used as a firefighter safety indicator. We calculated required line construction efforts to contain fire along each POD boundary based on the flame length probabilities along that boundary. Flame lengths >1.22 m are generally considered unsafe for crew to build hand lines; flame lengths >2.44 m are considered unsafe for engines or other ground-based equipment [41]. We classified POD boundaries with a 50% or more chance of having flame lengths >2.44 m as high-risk lines (HRLs) that might still be considered a PCL if the level of fire fighter risk is deemed acceptable, or that could be excluded from use when risk is deemed unacceptable. We depict the locations of HRLs in Figure 3d. For demonstration purposes, we excluded the use of aerial resources to dampen fire intensity and thereby expand opportunities by reducing the length of HRLs across the landscape, although this could be an important direction for future model development.
We calculated fire line construction rates depending on the expected flame length along each POD boundary. For simplicity, we used 20-person Type I hand-crew hour (referred to as “crew hour”) as the measurement unit to quantify fire containment and point protection efforts. Referring to the production table in [41], we selected the line construction rate that equates one crew hour with building 191 m of containment line along boundaries when the average fire flame length is ≤1.22 m. The assumption is that the line production rate for fire with low flame length would be similar to the line production rate for short grass or open timber grass fuel types. If flame lengths exceed this threshold, fire line width likely needs to increase [42] to ensure containment. We used the methodology from [43] to calculate the necessary line width to contain fire of known flame length with 99% confidence following the logic that the probability of the line holding increases as the width of the line increases, and also as the fire’s flame length decreases. We assumed that crew hours to build a one-unit length of fire line would be proportional to the required fire line width. More specifically, we used the average flame length from all raster cells intersecting with a control line across all FSPro fire simulations to calculate the crew hours needed to contain the fire along the line. In reality, line production rates on or near non-burnable surfaces such as rock, agricultural lands, rivers, or major roadways can be significantly higher than in short grass. Under these conditions, the suppression effort to create or fortify POD boundaries could be substantially reduced. This model also needs to assign resources for point protection. Quantifying point protection resource requirements is challenging due to limited empirical research. For testing purposes, we assumed two fire fighters are needed to provide sufficient point protection for each structure, which can be converted to approximately one-tenth of a 20-person crew hour per day.
2.3. Mathematical Formulation for rPOD Selection (the First Step Optimization)
We designed and ran two MIP models sequentially to optimize large fire containment decisions. Solution from the first step optimization identifies the optimal containment boundary (rPOD) mainly focused on minimizing the expected fire losses. The second step optimization readjusts the timings of line construction along the pre-selected rPOD boundaries to expand time gaps between line construction and fire arrival along the rPOD boundary under the assumption that larger time gaps equate to increased safety for suppression actions. The corresponding denotation for both steps of optimization are listed in Table 1 (for the first step optimization) and Table 2 (for the second step optimization).

Table 1.
Denotations used in the first step optimization model.
Table 2.
Denotations used in suppression timing adjustments in the second step model.
Subject to:
The objective function (Equation (1)) is designed to simultaneously optimize three fire suppression objectives: maximizing the total eNVC in the selected rPOD to contain fire (positive eNVC represents expected net fire benefit; negative eNVC represents expected net fire loss), reducing the expected weighted fire losses by point protection, and minimizing the weighted crew hours spent. Each objective could be weighted differently. For example, a penalty weight is multiplied with crew hours spent to encourage saving of suppression effort (the third objective). Equation (2) ensures that all fire-starting PODs would be part of the selected rPOD. Equation (3) assumes that fire line along each boundary needs to be finished within one suppression management period (defined here as one day, although the MIP formulation is generic such that other management periods could be defined). Equation (4) sets up two types of line-construction restrictions. The first one excludes line constructions along any boundary in planning period if the predicted fire arrival time to (denoted as ) is earlier than t. Estimating is not always simple. In our tested scenarios, we used either the earliest or the average fire arrival time to each boundary from four thousand fire simulations to estimate . Other arrival time assumptions could also be adopted to reflect fire manager’s different risk preferences. The second component of Equation (4) further excludes line building along any boundary that is deemed to be unsafe or ineffective for line construction due to the higher probability of fire flame length above a certain threshold, or due to other potential fire fighter safety concerns, e.g., snag falling after insect infestation.
Equation (5) uses a pair of equations to capture the logic that containment effort is needed at the boundary between POD i and j to stop fire spreading between them only if fire is already in one of them. Equation (6) ensures that fire could spread out from POD i only after it burns i. Equation (7) ensures that if fire reaches POD i, it must have spread into it from one of its adjacent PODs j unless i is one of the fire-starting PODs. Fire spotting beyond adjacent PODs is not modeled in this model. Equation (8) assumes that all fire lines built would hold. This is a known over-estimate, in that we know some lines will not hold [20]. In some of the test cases of this study, we relaxed this assumption by building contingent suppression strategies to prevent fireline breaching. Please note that any POD boundary deemed unsafe or ineffective in containing fire would have been excluded by Equation (4). Equation (9) allows for point protection to be applied to structures within POD if that POD is part of the selected rPOD. Each of the connected fire-starting PODs would be assigned a sequence number (for example, 0, 1 and 2…) by Equation (10). In the current formulation, disconnected fire-starting PODs are not allowed. Equations (11) use auxiliary variable to ensure that the selected PODs would form a contiguous rPOD. Please note that Equation (11) assigns the value of the auxiliary variable to be if fire line is not built along the boundary (when , would be zero); otherwise, the value of will only be bounded by the value of M (when , becomes M). Selecting a large positive value for M would leave practically unrestricted when . Details of this set of equations can be found in [28]. Equation (12) uses bookkeeping variable to track the total resource time (i.e., crew hours) spent during each suppression operational period (e.g., a fire day). Equation (13) sets up an upper bound reflecting the available resource time in each period.
2.4. Mathematical Formulation for Suppression Timing Adjustment (Second Step Optimization)
The solution from the first step optimization identifies the boundary of the rPOD fire container and structures within the container that need point protection. Contingent on this selection, managers can run a follow-up model to improve the safety and effectiveness of suppression operations by allowing more time on line construction along the selected rPOD boundary. We built a second MIP model to support this additional optimization.
Subject to:
Equations (12) and (13) need to be carried over to this second step model.
Objective Function (14) maximizes: (1) the narrowest temporal gap between fire arrival time and line construction time along all the pre-selected rPOD boundaries (weighted by ), and (2) the sum of temporal gaps along all pre-selected rPOD boundaries (weighted by ). Equations (15) and (16) simply make sure the rPOD selection and point protection location decisions from the first step model will be carried over to the second step model. The original Equations (12) and (13) from the first step model would still be included in the second step model. Equation (17) tracks the temporal gap for each selected rPOD boundary and sets the temporal gap for the other not selected POD boundaries to zero. Equation (18) tracks the smallest temporal gaps along all selected rPOD boundaries.
2.5. Scenarios Used for Model Assessment
Upon the occurrence of a fire, there could be many possible fire suppression scenarios. Containment strategies can be configured under each scenario using corresponding fire simulation and landscape fire risk analysis results. We selected five scenarios for demonstration by varying the weights and penalties () in the objective function (Equation (1)) and designing constraints to reflect various fire risk and firefighter safety concerns. Containment strategies include the locations and times when containment line should be built. The setups of the five scenarios are listed in Table 3. We also demonstrated how to use a decision tree to organize and support faster reference to different scenarios.
Table 3.
Model parameters of five tested scenarios.
We built test scenario A and C by assuming that fire managers have less firefighter safety concern (higher risk tolerance level); therefore, suppression can be scheduled along all preidentified POD boundaries. The other three scenarios, B, D and E, assume higher firefighter safety concern (lower risk tolerance level), in which line construction is not allowed along HRL (boundaries with >50% probability of flame length >2.44 m). In scenarios C, D and E, we set the cost for each crew hour at low ( = 0.0001 in Equation (1)); in the other two scenarios A and B, we assumed = 1 to represent a higher crew hour cost. A very low but positive value for would still create incentives for the model to save crew hours, but at a lower priority level compared to the other objective of maximizing expected net value increasing. To emphasize structure protection, in scenario C, we assigned a higher weight ( = 100, Equation (1)) for point protection benefit; in the other scenarios A, B, D and E, we kept = 1. Different fire arrival time estimates are also tested. For all scenarios except E, we used the average fire arrival time to all raster cells along each POD boundary from all FSPro simulations; for scenario E, we instead used the average of the minimum fire arrival time to all raster cells along each boundary from FSPro fire simulations. For all scenarios, we set = 10 and = 1 (in Equation (14)) during the second step optimization to expand both the smallest and the total time gaps between fire arrival time and fire suppression time along the identified rPOD boundary to allow fire fighters more time to finish line construction, reinforcement or burnout the line before the flaming front arrives. In all test scenarios, we assumed there are enough crew hours available in each fire day to finish line construction along any single POD boundary (see [28] for illustration of how resource availability can influence optimal solutions). However, there may not be enough crew to build multiple lines and protect all structures simultaneously in each day. This assumption allows us to test scenarios with a moderate level of resource availability; other resource availability assumptions can be easily set up and tested if needed.
3. Results
3.1. Test Scenarios and Corresponding Containment Strategies
Following the two-step optimization procedure, we first run the optimal rPOD selection model to find the best fire container and associated point protection locations within it according to the modeled scenario; we then run the second step model with a hope to create more time for firefighters to finish containment lines before fire arrival. For the five scenarios evaluated, we selected C to map line construction solutions (Figure 5). Panel (a) in Figure 5 displays fire arrival day to rPOD boundaries; panel (b) demonstrates time gaps (the number of days) between the day of suppression and the expected day of fire arrival along rPOD boundaries. Results show that following the model suggested suppression strategy after the second step optimization, we can expect four or more days for crew to finish the fire lines before fire arrival along most of the selected rPOD boundaries.
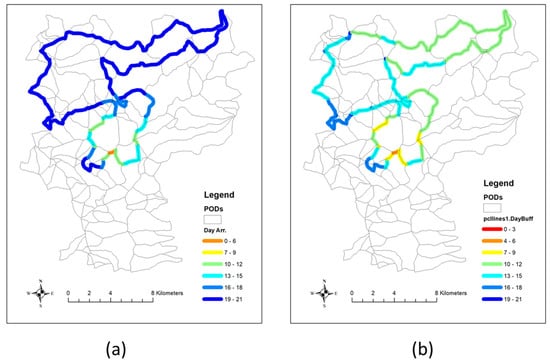
Figure 5.
Mapping the optimal response strategies in Scenario C using fire arrival days (a) and the arrival time gap (b), i.e., the number of days between suppression actions and expected fire arrival.
Summary results of all the five scenarios A to E are presented in Table 4. Each scenario suggests a different rPOD size and shape (Figure 6). Suggested rPODs vary substantially in both area (optimal rPOD size in scenario E is ~12 times the area of that under scenario A), and line construction length (optimal rPOD length in scenario D is ~7 times the length of that under scenario A). Not allowing containment lines to be built along HRLs almost doubles the size of selected rPOD (test scenario C vs. scenario D). Setting a higher benefit of structure protection (scenario C), which is a common objective for large fire suppression, results in managers shifting a substantial amount of crew time to protect structures (Table 4; 123 structures protected versus 19 in scenarios D/E and 0 in scenarios A/B). We also reported the average probability of flame length >2.44 m (or 8 ft) along all selected firelines as an indicator for fire fighter safety (Table 4; the last column). As expected, the average probability of flame length >2.44 m is much higher (between 33% and 50%) when HRL is allowed in forming rPOD compared to the average probability (between 14% and 17%) when suppression is not allowed along HRLs.
Table 4.
Solution characteristics for the tested scenarios A through E in the decision tree (Figure 6).
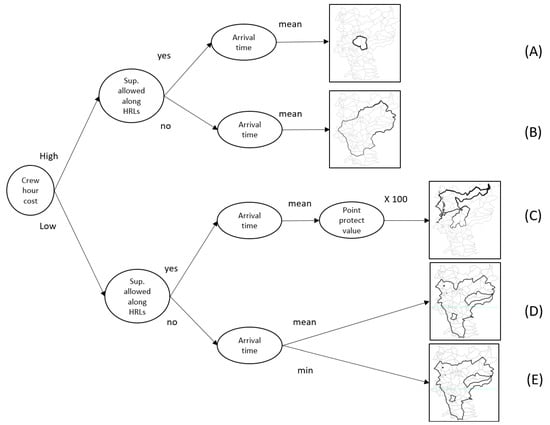
Figure 6.
A conceptual decision tree illustrating incorporation of manager risk preferences into development of optimal solution. Scenarios (A–E) correspond to the solutions presented in Table 3. The displayed points in scenarios C, D and E are structures protected through point protection.
The rPOD selected from scenario B (Figure 6) has a relatively compact shape (lower perimeter to area ratio) due to the assumed higher crew hour penalty ( = 1). In this scenario, none of the structures residing in the selected rPOD is protected through point protection due to the lower point protection weight ( = 1) and higher crew hour penalty. In contrast, scenario D shares the same set of assumptions as B except a much lower suppression hour penalty = 0.0001, which results in a less compact rPOD. Test scenario C (Figure 6) also demonstrates an irregularly shaped rPOD with relatively higher perimeter to area ratio. Test scenario C also shows that most structures within the selected rPOD would be point protected because of the high point protection benefits = 100 along with the low crew hour penalty = 0.0001. The shape of the rPOD in scenario C is driven by maximizing eNVC because of point protection and selection of PODs that avoid negative eNVC.
We conducted additional sensitivity analyses by varying the penalty for crew hour spent on suppressions ( in Equation (1)) or point protection using scenarios A and B as examples (Table 5). All model runs based on scenario B with different values propose rPOD that is ~2 to 13 times larger than the corresponding runs proposed in scenario A, because the former requires containment lines backing off farther from the starting fire footprint. This also allows crews more time to finish the lines along the rPOD before fire arrival. Decreasing crew hour penalty gives managers more flexibility of using crew hours, which sometimes means letting a fire grow larger to achieve more fire benefits. For test scenarios A and B, we discover only 5 to 8 percent increase of eNVC when crew hour penalty decreases from 1 to 0.0001. This may be because the potential fire benefit in the given study location is relatively small compared to the potential fire losses. The selected rPOD size increases more than 10 times during the sensitivity tests based on scenario A, but only increases by about 10 percent during the tests based on scenario B, which may be because there are fewer options of building lines from scenario B than A.
Table 5.
Sensitivity analysis varying manager preferences around suppression cost and suppression activity in high flame length areas.
To facilitate the understanding and presentation of model results for different scenarios, we can organize different containment strategies into a decision tree format (see Figure 6 for an example). While exploring different potential fire containment options, fire managers could follow the decision tree from left to right, specifying suppression assumptions and risk preferences, until they reach a suppression strategy at the end of the decision tree. A decision tree format also helps us compare the suppression strategies between management scenarios. For example, although Figure 6 only shows a decision tree with five scenarios, we can still identify two simple trends from it: (1) higher suppression cost clearly encourages more aggregated POD selection when building rPOD; (2) not allowing line construction along HRLs causes substantial increase of rPOD size.
3.2. Development of Contingent rPOD Container
During large fire suppression, there is the potential risk of fire breaching primary firelines due to multiple factors, such as spotting, rolling logs, and inadequate or incomplete line construction. Fire managers often need to have contingency plans in case of line breaching at critical locations. In this study, we used the test scenario B to demonstrate how this analysis approach could be used to provide contingency containment strategies (Figure 7) assuming fire breached containment lines at five locations along the model selected primary rPOD boundary. We selected those five fire breaching locations along the rPOD boundaries because FSPro and Flep-Gen simulation indicated they have the next highest probabilities (ranging from 45.3% to 48.3%) of having fire flame lengths >2.44 m after the HRLs. Based on the previously selected rPOD boundary from test scenario B and the location of potential of fire breaching locations, we set up the model and reran the two-step optimization. New model results show that additional POD boundaries outside the primary rPOD boundary can be selected to form a contingent fire container in case the fire escaped from the primary rPOD container. Systematically identifying likely line breach locations and potential contingency line locations is often an important task during large fire suppression process.
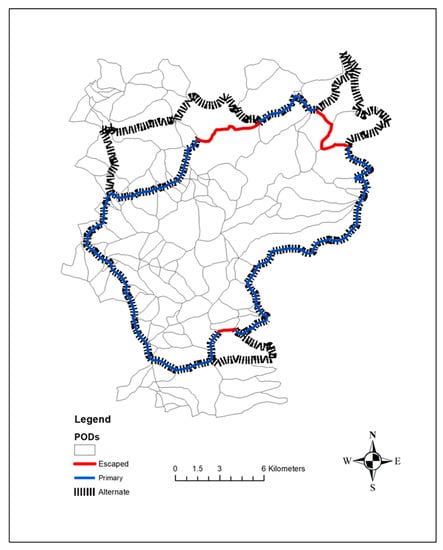
Figure 7.
Development of contingency strategy for test scenario B after some POD boundaries associated with the primary strategy were breached.
4. Discussion
Large fire managers must make response decisions in a timely manner, limiting opportunities to examine an extensive suite of rPOD options. Additionally, large fire suppression decisions often involve stakeholders with different values, incentives and risk preferences and suppression decisions could be heavily influenced by social-political factors, public opinions, media reports, etc. [44]. In this study, we tested several fire manager’s preference scenarios. Fire managers could design and evaluate more scenarios by extending the use of this model to preseason fire risk analyses or fire management training programs, for example, considering a range of possible landscapes, ignition locations, weather conditions, risk preferences, and resource availability situations (see [28]). Important variables to consider in pre-season, cross-boundary fire planning may also include ownership patterns, the extent and proximity of community and structures, the degree of pre-existing collaboration, and potential for conflict. Adopting thematic “archetypes” for community attributes [45] along with fire transmission and exposure pathways [46] could also prove useful for guiding and informing such planning efforts. Integrating those considerations into scenarios and using OR models to provide alternative containment suggestions would allow managers to understand the tradeoffs of different management policies and actions on various stakeholders. Ultimately, this may help provide better communication and facilitate negotiations between stakeholders as optimal response strategies are determined. A strength of the scenario-based planning is that it provides an opportunity to infuse and enrich discussions with a broader set of qualitative concerns in relation to a frontier of response options. In a recent fire planning workshop hosted in Estes Park, Colorado, USA, for example, responders from a variety of response agencies considered potential scenarios where a fire that ignited in Rocky Mountain National Park could spread into adjacent communities. The team collectively discussed fire containment options, structure density and protection need, evacuation concerns, smoke exposure, and tourism impacts, all in relation to design of large fire containment strategies.
Our goal is to keep improving the OR model and eventually to integrate it into or use it as an extension of the existing wildfire decision support systems to support transparent and data driven large fire suppression decisions. WFDSS is the most extensively used large fire decision support system in the U.S. OR approaches such as the two-step model described herein will remain external to this system at this time given WFDSS’ structure and capability, but by explicitly using data products already integrated in WFDSS to support our model would be relatively easy as an external extension. For example, WFDSS already uses FSPro runs and predicts probabilistic fire spread and intensity maps. Fire analysts with GIS or fire behavior background could run FSPro multiple times across multiple weeks during a large fire event to provide updated fire simulation information. They could potentially generate the probability of fire at different intensity levels using tools such as Flep-Gen, which is currently not available within WFDSS. By combining burn probability and fire intensity probability with existing quantitative wildfire risk assessments we could calculate the expected fire loss and benefits for a specific fire event using consistent information used by local and regional fire staff. Our OR model could use these data layers to provide large fire containment suggestions by iteratively running the two-step containment optimization at multiple decision points during the incident. The model would then provide fire suppression suggestions at the beginning of the incident as well as at key strategic decision points. Each iteration builds on updated fire footprints, fire probabilities, fire intensity distributions, fire weather forecast, or changing resource availability situations. Consistency in use of decision support information reduces confusion and limits the potential for decision makers to disregard model results during the decision process. An advantage of keeping the OR model as an external extension of WFDSS is that the model could more easily access GIS data that are not embedded in WFDSS, for example, landscape risk layers, potentially SDI and PCL layers, in the future, and improved POD delineation data. Regardless of the different implementation pathways, future development of this model would require close collaboration with fire managers. We are currently testing the model based on two other fires, the Lolo Fire [28] and the Ferguson Fire [47]. More tests would be required to further improve the model.
In addition to creating an operationally relevant OR model aligned with existing decision support tools and systems, we were interested in improving upon previous spatial response optimization research. This study accomplishes this by considering firefighter safety through expanding time buffers between line construction and fire arrival (larger buffer mimics indirect attack; zero or very smaller time buffer allows direct attack) and allowing explicit consideration of fire fighter safety by using flame length probability data along potential control lines. By organizing different fire containment alternatives through a decision tree, we were able to reflect various fire management scenarios. Despite these improvements, alternative modelling strategies may also produce valuable results. For example, one could use a stochastic programming (SP) model to incorporate multiple future fire development scenarios and corresponding probabilities directly into the model formulation. Building and solving a large SP model with many stochastic scenarios would be computationally challenging but could provide one robust containment option suitable for all considered scenarios. Fire suppression SP models [10,16,47,48,49,50,51] have been built to solve small- to moderate-sized problems; they often rely on heuristics to control model size and find “good” instead of optimal solutions. A potential future research direction could be building SP models to capture fire uncertainties and implement efficient solution algorithms to solve those models. Alternatively, one could also design and test heuristic methods. For example, we may build and solve many smaller SP models to identify different line construction strategies and integrate those selected control lines by voting to form a selected rPOD. We can then test a large set of stochastic fire scenarios to evaluate the overall effectiveness of the selected rPOD by referencing certain large fire suppression key performance indicators (KPIs) [52], such as expected fire losses, rate of fire line engaged, held, and burned over, or fire fighter exposure rate to high flame length lines etc. Another simpler future model improvement to deal with the line holding uncertainty could be expanding the objective function of the current model to minimize the probability of any line breaching along the entire rPOD boundary using the PCL estimates.
Future improvements are still needed to make the model and its supporting data better reflect the real-world fire suppression practices. For example, the current model assumes that line construction along each boundary between two adjacent PODs needs to be finished within one suppression management period (i.e., one day). During actual fire suppression, however, night shift and multiday lines are possible. From the input data management perspective, delineating a landscape into smaller PODs or splitting POD boundaries into shorter control line segments can help alleviate this model limitation. Using smaller PODs would also give the model more options of forming better rPODs. Another way to address this model limitation would be directly revising the model formulation to allow for multiday lines, which we believe is viable but needs more investigations.
Many of the challenges in using OR models to support fire suppression are related with data availability and quality. For example, one of the key data requirements in building suppression models is the productivity of suppression resources along potential fire containment lines. Line construction productivity varies by crew type and capacity, topography, vegetation, accessibility, weather and fire intensity situations [53]. As suppression decisions can be highly sensitive to the rates of fireline production [54,55], it would be necessary to collect verified, locally specific empirical suppression data to more accurately parameterize decision support models [56]. In this study, many simplifications were made, for instance, using the availability of Type I hand crew only as the resource availability measurement. Large fire suppression, however, often involves the collaboration between multiple types of crew, engines, helicopters and aircrafts. Data currently collected on the synergies between firefighting resources and resource effectiveness are very limited [54]. A potential future research could focus on classifying the line construction or point protection tasks into more specific subtasks, i.e., spraying water, removing fuels, burning out, wrapping, setting up sprinkler system, etc.; we can then build statistics models to predict the productivity rate of using each resource type to achieve each subtask under different fire suppression situations such as terrain, weather, or fuel types. Future rPOD optimization model would then be able to focus on how to most efficiently assign resources to finish the more specific subtasks in order to build firelines and achieve point protect objectives. Future refinements of input data could also focus on better reflecting the relative workload associated with line width. There may be a non-linear relationship, where more sawyers are necessary for wider lines, and this could be informed by local data on vegetation as well.
Similar challenges exist with fire behavior modeling, including improving spatially explicit fuel modeling, diversifying wind and weather conditions across landscapes, and improving fire behavior algorithms. Fire arrival time is a key factor influencing the selection of timing and locations of fire line construction. Validation of fire arrival time modeling based on locally collected data either by fire fighters on the ground or through satellites or drones would be an important future research direction to improve the reliability of data and the model suggested suppression decisions based on those data.
Leveraging existing networks of PODs created by the U.S. National Forest fire and land management planners for spatial response optimization research offers a new frontier in OR modeling with direct relevance to on-the-ground management. In this study, we used a network of existing PODs built from prominent ridges and major water features. Fire and forest staff continue to develop POD networks across forested landscapes in the western USA, offering new insights and innovations not currently used in our model. For example, suppression difficulty index (SDI) [24] and potential control line atlases (PCLs) [25] are routinely integrated with local knowledge to determine POD boundaries with the highest likelihood of holding as a containment line. These risk analysis products and the resulting POD boundaries more accurately represent expected large fire response, will help parameterize large fire optimization models, and help identify those lines at highest risk of breaching for contingency planning. We expect to continue to observe improvements in creating POD networks and as these model inputs continue to improve, so too will the results from our OR model. We cannot overstate the importance of integrating advanced analytics with local, field-based knowledge to determine optimal response strategies that balance firefighter safety, probability of control, and protection of values at risk.
5. Conclusions
This study introduces a two-step optimization approach using MIP models that integrates pre-season fire risk analyses, incident-level fire simulations, manager’s risk preferences, and safety concerns to provide spatially and temporally explicit large fire containment strategies. The first step optimization identifies a large fire container (rPOD), and associated internal point protection locations, to minimize total expected fire loss and weighted suppression costs. The second step optimization carries along the rPOD selection and point protection locations, and further adjusts the timing of fire line construction to expand the time gap between expected fire arrival time and the line construction time along each rPOD boundary to improve firefighter safety and containment line effectiveness. By using scenario-based test cases, we demonstrated how large fire containment strategies may vary under different management contexts, and the potential of using this approach to select contingent suppression locations during line breaching events. Many future research directions are identified to make this model more relevant to large fire suppression practice. The three most important research directions include modeling aviation resources to support ground-based suppression activities, modeling the joint operation among multiple resources, and explicitly considering fireline breaching probabilities in the OR model formulation. Collaborating with local fire managers is critical to make this model more operationally relevant.
Author Contributions
Conceptualization, Y.W. and M.P.T.; Data curation, J.H.S. and C.D.O.; Formal analysis, Y.W. and M.P.T.; Investigation, Y.W. and M.P.T.; Methodology, Y.W. and M.P.T.; Project administration, Y.W. and M.P.T.; Software, Y.W.; Supervision, M.P.T.; Validation, C.D.O. and C.J.D.; Visualization, Y.W.; Writing—original draft, Y.W., M.P.T. and J.H.S.; Writing—review & editing, C.D.O. and C.J.D.
Funding
This research was funded by USDA Forest Service Rocky Mountain Research Station, grant number 14-JV-11221636-029.
Acknowledgments
We are grateful to Jon Rieck, April Brough, and Greg Dillon for assistance with risk data from the Lolo National Forest.
Conflicts of Interest
The authors declare no conflict of interest.
References
- Thompson, M.P. Modeling wildfire incident complexity dynamics. PLoS ONE 2013, 8, e63297. [Google Scholar] [CrossRef]
- McLennan, J.; Holgate, A.M.; Omodei, M.M.; Wearing, A.J. Decision making effectiveness in wildfire incident management teams. J. Conting. Crisis Manag. 2006, 14, 27–37. [Google Scholar] [CrossRef]
- Martell, D.L. A review of recent forest and wildland fire management decision support systems research. Curr. For. Rep. 2015, 1, 128–137. [Google Scholar] [CrossRef]
- Duff, T.J.; Tolhurst, K.G. Operational wildfire suppression modelling: A review evaluating development, state of the art and future directions. Int. J. Wildl. Fire 2015, 24, 735–748. [Google Scholar] [CrossRef]
- Petrovic, N.; Carlson, J.M. A decision-making framework for wildfire suppression. Int. J. Wildl. Fire 2012, 21, 927–937. [Google Scholar] [CrossRef]
- Dunn, C.J.; Calkin, D.E.; Thompson, M.P. Towards enhanced risk management planning, decision making and monitoring of US wildfire response. Int. J. Wildl. Fire 2017, 26, 551–556. [Google Scholar] [CrossRef]
- Pacheco, A.P.; Claro, J. Operational flexibility in forest fire prevention and suppression: A spatially explicit intra-annual optimization analysis, considering prevention, (pre) suppression, and escape costs. Eur. J. For. Res. 2018, 137, 895–916. [Google Scholar] [CrossRef]
- Minas, J.; Hearne, J.; Martell, D. An integrated optimization model for fuel management and fire suppression preparedness planning. Ann. Oper. Res. 2015, 232, 201–215. [Google Scholar] [CrossRef]
- Chow, J.Y.; Regan, A.C. Resource location and relocation models with rolling horizon forecasting for wildland fire planning. INFOR 2011, 49, 31–43. [Google Scholar] [CrossRef]
- Ntaimo, L.; Gallego-Arrubla, J.A.; Gan, J.; Stripling, C.; Young, J.; Spencer, T. A simulation and stochastic integer programming approach to wildfire initial attack planning. For. Sci. 2013, 59, 105–117. [Google Scholar] [CrossRef]
- Wei, Y.; Thompson, M.E.; Calkin, D.E.; Stonesifer, C.S. A simulation and optimisation procedure to model daily suppression resource transfers during a fire season in Colorado. Int. J. Wildl. Fire 2017, 26, 630–641. [Google Scholar] [CrossRef]
- Belval, E.J.; Calkin, D.E.; Wei, Y.; Stonesifer, C.S.; Thompson, M.P.; Masarie, A. Examining dispatching practices for Interagency Hotshot Crews to reduce seasonal travel distance and manage fatigue. Int. J. Wildl. Fire 2018, 27, 569–580. [Google Scholar] [CrossRef]
- Krasko, V.; Rebennack, S. Two-stage stochastic mixed-integer nonlinear programming model for post-wildfire debris flow hazard management: Mitigation and emergency evacuation. Eur. J. Oper. Res. 2017, 263, 265–282. [Google Scholar] [CrossRef]
- Wei, Y.; Rideout, D.B.; Hall, T.B. Toward efficient management of large fires: A mixed integer programming model and two iterative approaches. For. Sci. 2011, 57, 435–447. [Google Scholar]
- Belval, E.J.; Wei, Y.; Bevers, M. A mixed integer program to model spatial wildfire behavior and suppression placement decisions. Can. J. For. Res. 2015, 45, 384–393. [Google Scholar] [CrossRef]
- Belval, E.J.; Wei, Y.; Bevers, M. A stochastic mixed-integer program to model spatial wildfire behavior and suppression placement decisions with uncertain weather. Can. J. For. Res. 2016, 46, 234–248. [Google Scholar] [CrossRef]
- Van der Merwe, M.; Minas, J.P.; Ozlen, M.; Hearne, J.W. A mixed integer programming approach for asset protection during escaped wildfires. Can. J. For. Res. 2014, 45, 444–451. [Google Scholar] [CrossRef]
- Van der Merwe, M.; Ozlen, M.; Hearne, J.W.; Minas, J.P. Dynamic rerouting of vehicles during cooperative wildfire response operations. Ann. Oper. Res. 2017, 254, 467–480. [Google Scholar] [CrossRef]
- Roozbeh, I.; Ozlen, M.; Hearne, J.W. An Adaptive Large Neighbourhood Search for asset protection during escaped wildfires. Comp. Oper. Res. 2018, 97, 125–134. [Google Scholar] [CrossRef]
- Thompson, M.P.; MacGregor, D.G.; Calkin, D. Risk Management: Core Principles and Practices, and Their Relevance to Wildland Fire. General Technical Report RMRS-GTR-350; US Department of Agriculture, Forest Service, Rocky Mountain Research Station: Fort Collins, CO, USA, 2016; Volume 29, p. 350.
- Dunn, C.J.; Thompson, M.P.; Calkin, D.E. A framework for developing safe and effective large-fire response in a new fire management paradigm. For. Ecol. Manag. 2017, 404, 184–196. [Google Scholar] [CrossRef]
- Thompson, M.P.; MacGregor, D.G.; Dunn, C.J.; Calkin, D.E.; Phipps, J. Rethinking the Wildland Fire Management System. J. For. 2018, 116, 382–390. [Google Scholar] [CrossRef]
- Thompson, M.P.; Bowden, P.; Brough, A.; Scott, J.H.; Gilbertson-Day, J.; Taylor, A.; Anderson, J.; Haas, J.R. Application of wildfire risk assessment results to wildfire response planning in the southern Sierra Nevada, California, USA. Forests 2016, 7, 64. [Google Scholar] [CrossRef]
- O’Connor, C.D.; Thompson, M.P.; Rodríguez, Y.; Silva, F.R. Getting ahead of the wildfire problem: Quantifying and mapping management challenges and opportunities. Geosciences 2016, 6, 35. [Google Scholar] [CrossRef]
- O’Connor, C.D.; Calkin, D.E.; Thompson, M.P. An empirical machine learning method for predicting potential fire control locations for pre-fire planning and operational fire management. Int. J. Wildl. Fire 2017, 26, 587–597. [Google Scholar]
- Thompson, M.P.; Liu, Z.; Wei, Y.; Caggiano, M.D. Analyzing Wildfire Suppression Difficulty in Relation to Protection Demand. In Environmental Risks; IntechOpen: London, UK, 2018. [Google Scholar] [CrossRef]
- Thompson, M.P.; Riley, K.L.; Loeffler, D.; Haas, J.R. Modeling fuel treatment leverage: Encounter rates, risk reduction, and suppression cost impacts. Forests 2017, 8, 469. [Google Scholar] [CrossRef]
- Wei, Y.; Thompson, M.P.; Haas, J.R.; Dillon, G.K.; O’Connor, C.D. Spatial optimization of operationally relevant large fire confine and point protection strategies: Model development and test cases. Can. J. For. Res. 2018, 48, 480–493. [Google Scholar] [CrossRef]
- O’Connor, C.D.; Calkin, D.E. Engaging the fire before it starts: A case study from the 2017 Pinal Fire (Arizona). Wildfire 2019, 28, 14–18. [Google Scholar]
- Noonan-Wright, E.K.; Opperman, T.S.; Finney, M.A.; Zimmerman, G.T.; Seli, R.C.; Elenz, L.M.; Calkin, D.E.; Fiedler, J.R. Developing the US wildland fire decision support system. J. Combust. 2011. [Google Scholar] [CrossRef]
- Finney, M.A.; Grenfell, I.C.; McHugh, C.W.; Seli, R.C.; Trethewey, D.; Stratton, R.D.; Brittain, S. A method for ensemble wildland fire simulation. Environ. Model. Assess. 2011, 16, 153–167. [Google Scholar] [CrossRef]
- Calkin, D.E.; Thompson, M.P.; Finney, M.A.; Hyde, K.D. A real-time risk assessment tool supporting wildland fire decision making. J. For. 2011, 109, 274–280. [Google Scholar]
- Finney, M.A. The challenge of quantitative risk analysis for wildland fire. For. Ecol. Manag. 2005, 211, 97–108. [Google Scholar] [CrossRef]
- Scott, J.H.; Thompson, M.P.; Calkin, D.E. A wildfire risk assessment framework for land and resource management. In General Technical Report RMRS-GTR-315; U.S. Department of Agriculture, Forest Service, Rocky Mountain Research Station: Fort Collins, CO, USA, 2013; 83p. [Google Scholar]
- Calkin, D.E.; Ager, A.; Thompson, M.P.; Finney, M.A.; Lee, D.C.; Quigley, T.M.; McHugh, C.W.; Riley, K.L.; Gilbertson-Day, J.M. A comparative risk assessment framework for wildland fire management: The 2010 cohesive strategy science report. In General Technical Report RMRS-GTR-262; U.S. Department of Agriculture, Forest Service, Rocky Mountain Research Station: Fort Collins, CO, USA, 2011; 63p. [Google Scholar]
- Thompson, M.P.; Haas, J.R.; Gilbertson-Day, J.W.; Scott, J.H.; Langowski, P.; Bowne, E.; Calkin, D.E. Development and application of a geospatial wildfire exposure and risk calculation tool. Environ. Model. Softw. 2015, 63, 61–72. [Google Scholar] [CrossRef]
- Finney, M.A.; McHugh, C.W.; Grenfell, I.C.; Riley, K.L.; Short, K.C. A simulation of probabilistic wildfire risk components for the continental United States. Stoch. Environ. Res. Risk Assess. 2011, 25, 973–1000. [Google Scholar] [CrossRef]
- Scott, J.; Gilbertson-Day, J. Deterministic Generation of Flame-Length Probabilities for Use in Risk Assessments. Fire Continuum Conference. 21–24 May 2018. Missoula, MT. S11.2. Available online: http://firecontinuumconference.org/wp-content/uploads/2017/05/FINAL-Special-Session-Presentation-Abstracts-Fire-Continuum.pdf (accessed on 16 February 2019).
- Scott, J.H.; Burgan, R.E. Standard fire behavior fuel models: A comprehensive set for use with Rothermel’s surface fire spread model. In General Technical Report RMRS-GTR-153; U.S. Department of Agriculture, Forest Service, Rocky Mountain Research Station: Fort Collins, CO, USA, 2005; 72p. [Google Scholar]
- Thompson, M.P.; Scott, J.; Helmbrecht, D.; Calkin, D.E. Integrated wildfire risk assessment: Framework development and application on the Lewis and Clark National Forest in Montana, USA. Integr. Environ. Assess. Manag. 2013, 9, 329–342. [Google Scholar] [CrossRef] [PubMed]
- Broyles, G. Fireline production rates. In Fire Management Report; USDA Forest Service, National Technology & Development Program: San Dimas, CA, USA, 2011; pp. 1151–1805. [Google Scholar]
- Andrews, P.L.; Heinsch, F.A.; Schelvan, L. How to generate and interpret fire characteristics charts for surface and crown fire behavior. In General Technical Report RMRS-GTR-253; USDA Forest Service, Rocky Mountain Research Station: Fort Collins, CO, USA, 2011. [Google Scholar] [CrossRef]
- Mees, R.; Strauss, D.; Chase, R. Modeling wildland fire containment with uncertain flame length and fireline width. Int. J. Wildl. Fire 1993, 3, 179–185. [Google Scholar] [CrossRef]
- Canton-Thompson, J.; Gebert, K.M.; Thompson, B.; Jones, G.; Calkin, D.; Donovan, G. External Human Factors in Incident Management Team Decision making and Their Effect on Large Fire Suppression Expenditures. J. For. 2008, 106, 416–424. [Google Scholar] [CrossRef]
- Paveglio, T.B.; Moseley, C.; Carroll, M.S.; Williams, D.R.; Davis, E.J.; Paige, F.A. Categorizing the social context of the Wildland Urban Interface: Adaptive capacity for wildfire and community “archetypes”. For. Sci. 2015, 61, 298–310. [Google Scholar] [CrossRef]
- Evers, C.R.; Ager, A.A.; Nielsen-Pincus, M.; Palaiologou, P.; Bunzel, K. Archetypes of community wildfire exposure from national forests of the western US. Landsc. Urban Plan. 2019, 182, 55–66. [Google Scholar] [CrossRef]
- Wei, Y.; Thompson, M.P.; Scott, J.; O’connor, C. Test an Optimization Model to Support Multi-Day Large Fire Containment Decisions—A Case Study for the Ferguson Fire. In Proceedings of the 19th Symposium on Systems Analysis in Forest Resources, Puerto Varas, Chile, 3–7 March 2019; Available online: http://www.ssafr2019.cl/13/default/inicio (accessed on 3 April 2019).
- Haight, R.G.; Fried, J.S. Deploying Wildland Fire Suppression Resources with a Scenario-Based Standard Response Model. Informatioin 2007, 45, 31–39. [Google Scholar] [CrossRef]
- Ntaimo, L.; Arrubla, J.A.G.; Stripling, C.; Young, J.; Spencer, T. A stochastic programming standard response model for wildfire initial attack planning. Can. J. For. Res. 2012, 42, 987–1001. [Google Scholar] [CrossRef]
- Wei, Y.; Belval, E.; Bevers, M. Designing seasonal initial attack resource deployment and dispatch rules using a two-stage stochastic programming procedure. For. Sci. 2015, 61, 1021–1032. [Google Scholar]
- Wei, Y.; Bevers, M.; Belval, E.; Bird, B. A chance-constrained programming model to allocate wildfire initial attack resources for a fire season. For. Sci. 2015, 61, 278–288. [Google Scholar]
- Thompson, M.P.; Lauer, C.J.; Calkin, D.E.; Rieck, J.D.; Stonesifer, C.S.; Hand, M.S. Wildfire Response Performance Measurement: Current and Future Directions. Fire 2018, 1, 21. [Google Scholar] [CrossRef]
- Plucinski, M.P. Fighting Flames and Forging Firelines: Wildfire Suppression Effectiveness at the Fire Edge. Curr. For. Rep. 2019. [Google Scholar] [CrossRef]
- Smith, L.E. Sensitivity of fire size to fireline construction rates in a simulation model. Fire Technol. 1986, 22, 136–147. [Google Scholar] [CrossRef]
- Hirsch, K.G.; Martell, D.L. A review of initial attack fire crew productivity and effectiveness. Int. J. Wildl. Fire 1996, 6, 199–215. [Google Scholar] [CrossRef]
- Riley, K.; Thompson, M.; Scott, J.; Gilbertson, J. A Model-Based Framework to Evaluate Alternative Wildfire Suppression Strategies. Resources 2018, 7, 4. [Google Scholar] [CrossRef]
© 2019 by the authors. Licensee MDPI, Basel, Switzerland. This article is an open access article distributed under the terms and conditions of the Creative Commons Attribution (CC BY) license (http://creativecommons.org/licenses/by/4.0/).