The Relationship between Stem Diameter Shrinkage and Tree Bole Moisture Loss Due to Transpiration
Abstract
1. Introduction
2. Materials and Methods
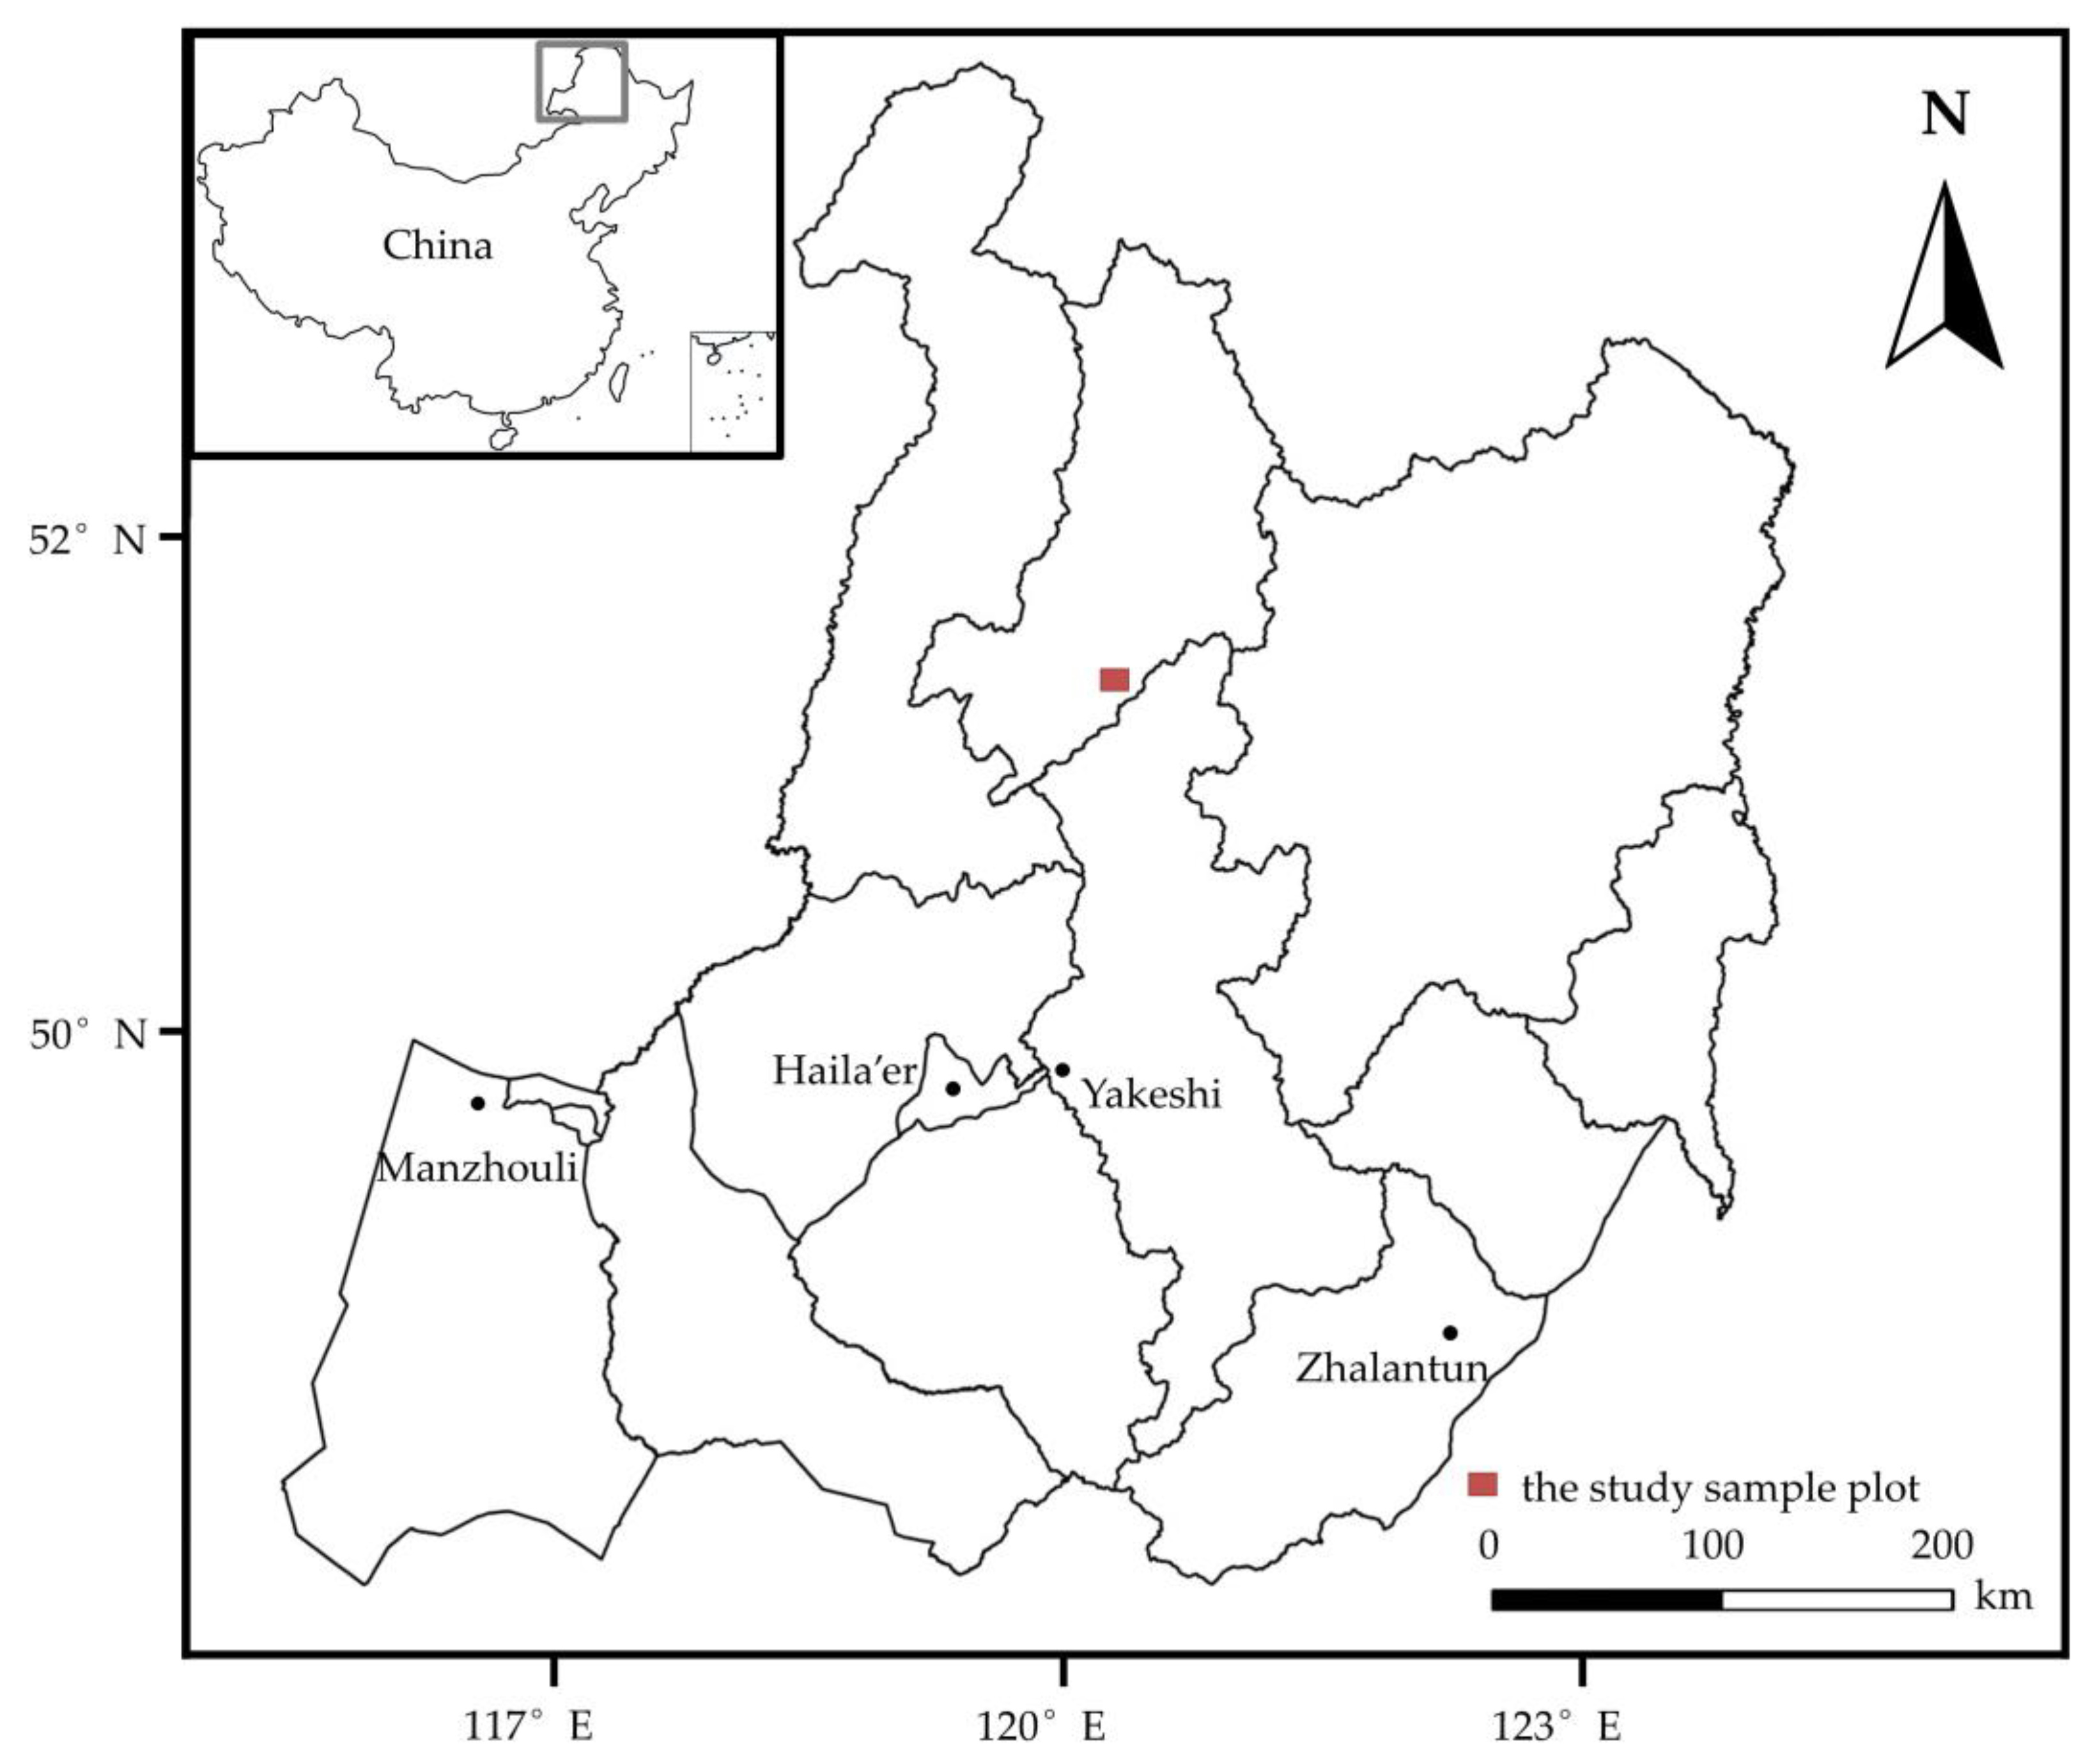
2.1. Study Area
2.2. Data Measurement of Stem Diameter Variations, Sap Flow, and Environmental Factors
2.3. Data Analysis
3. Results
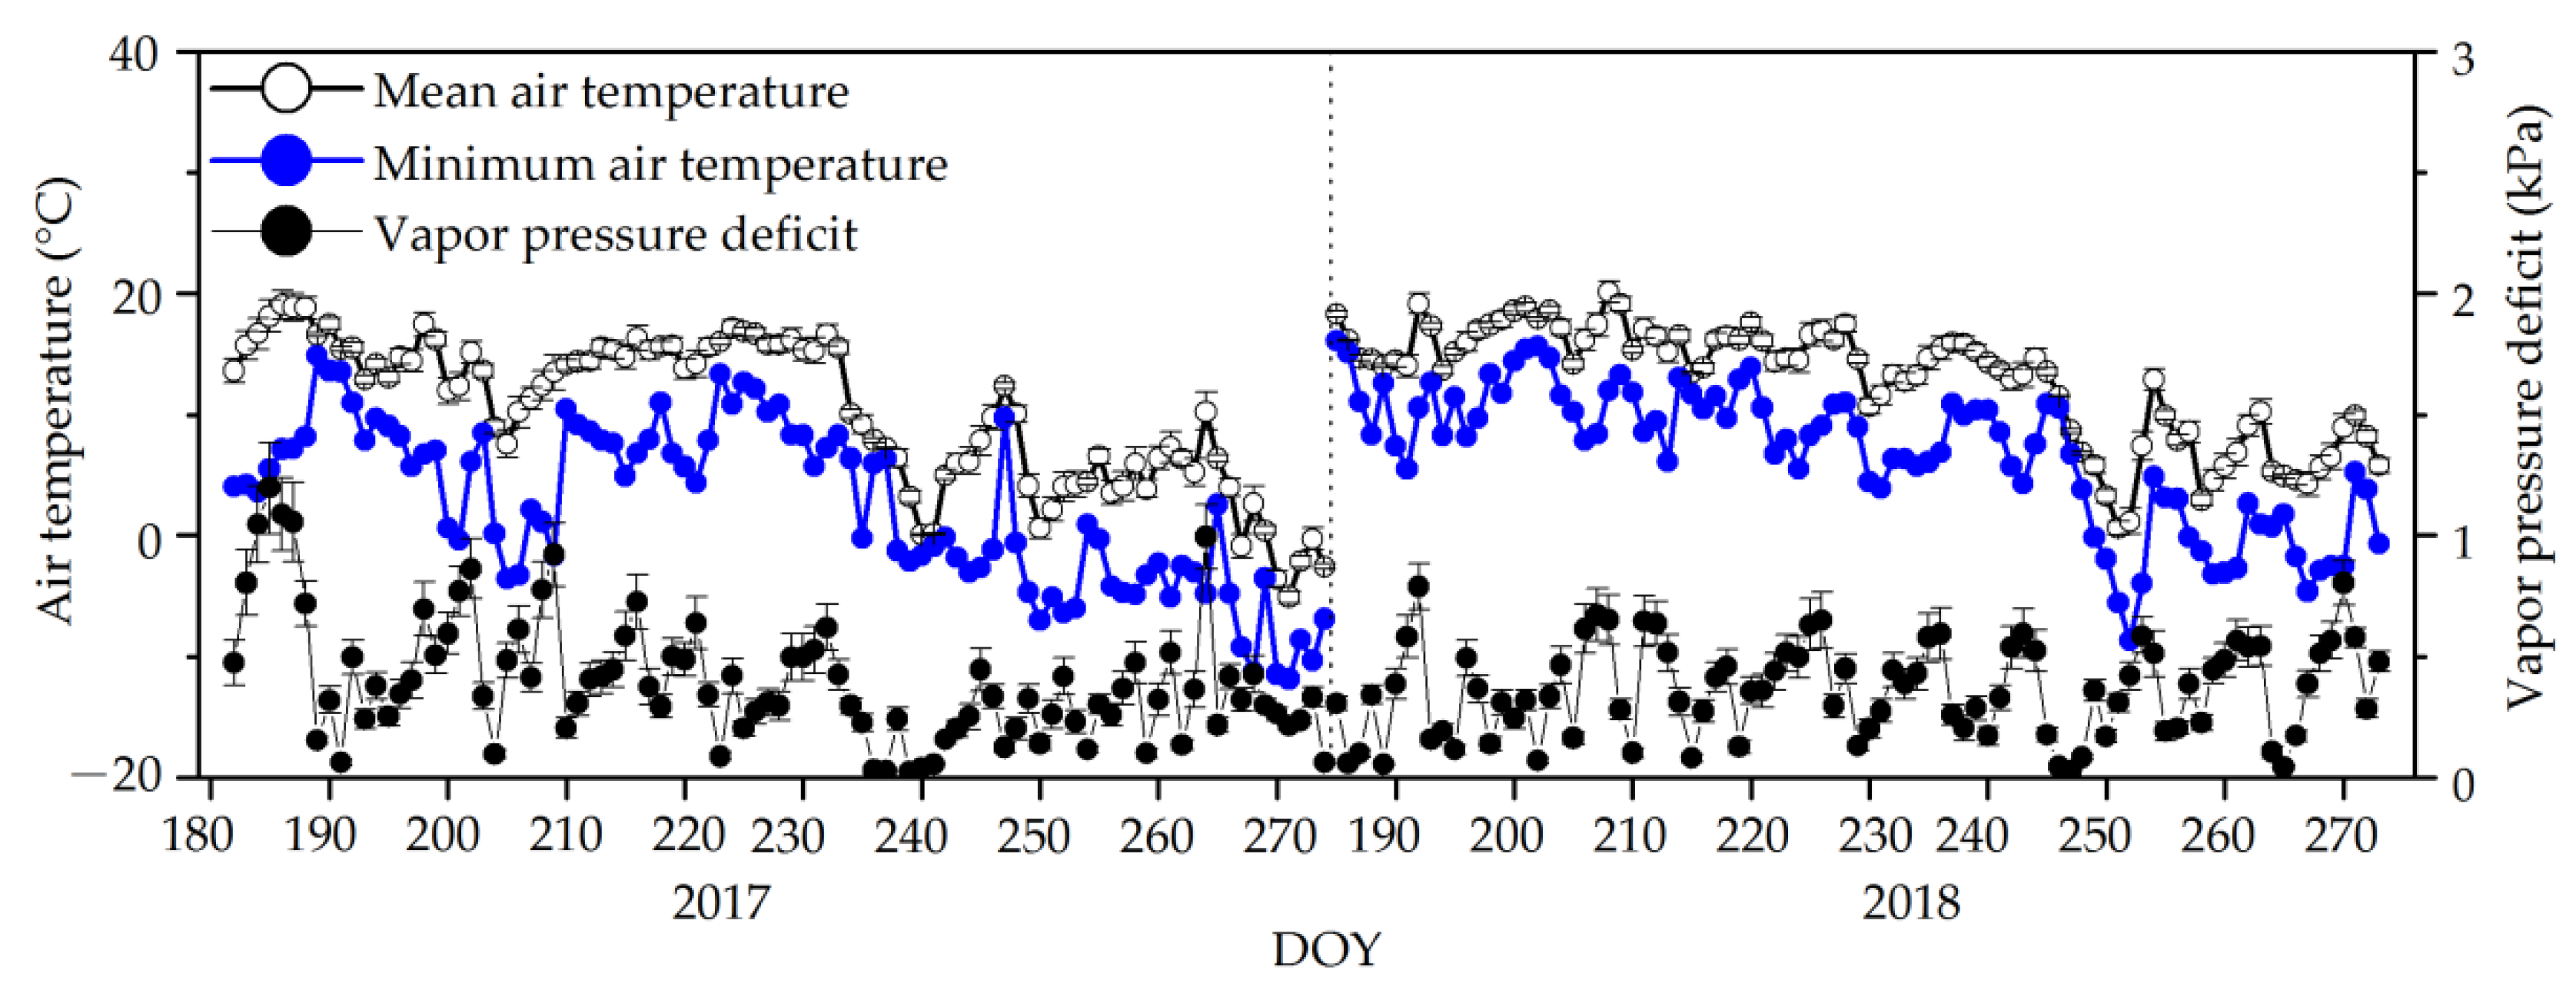
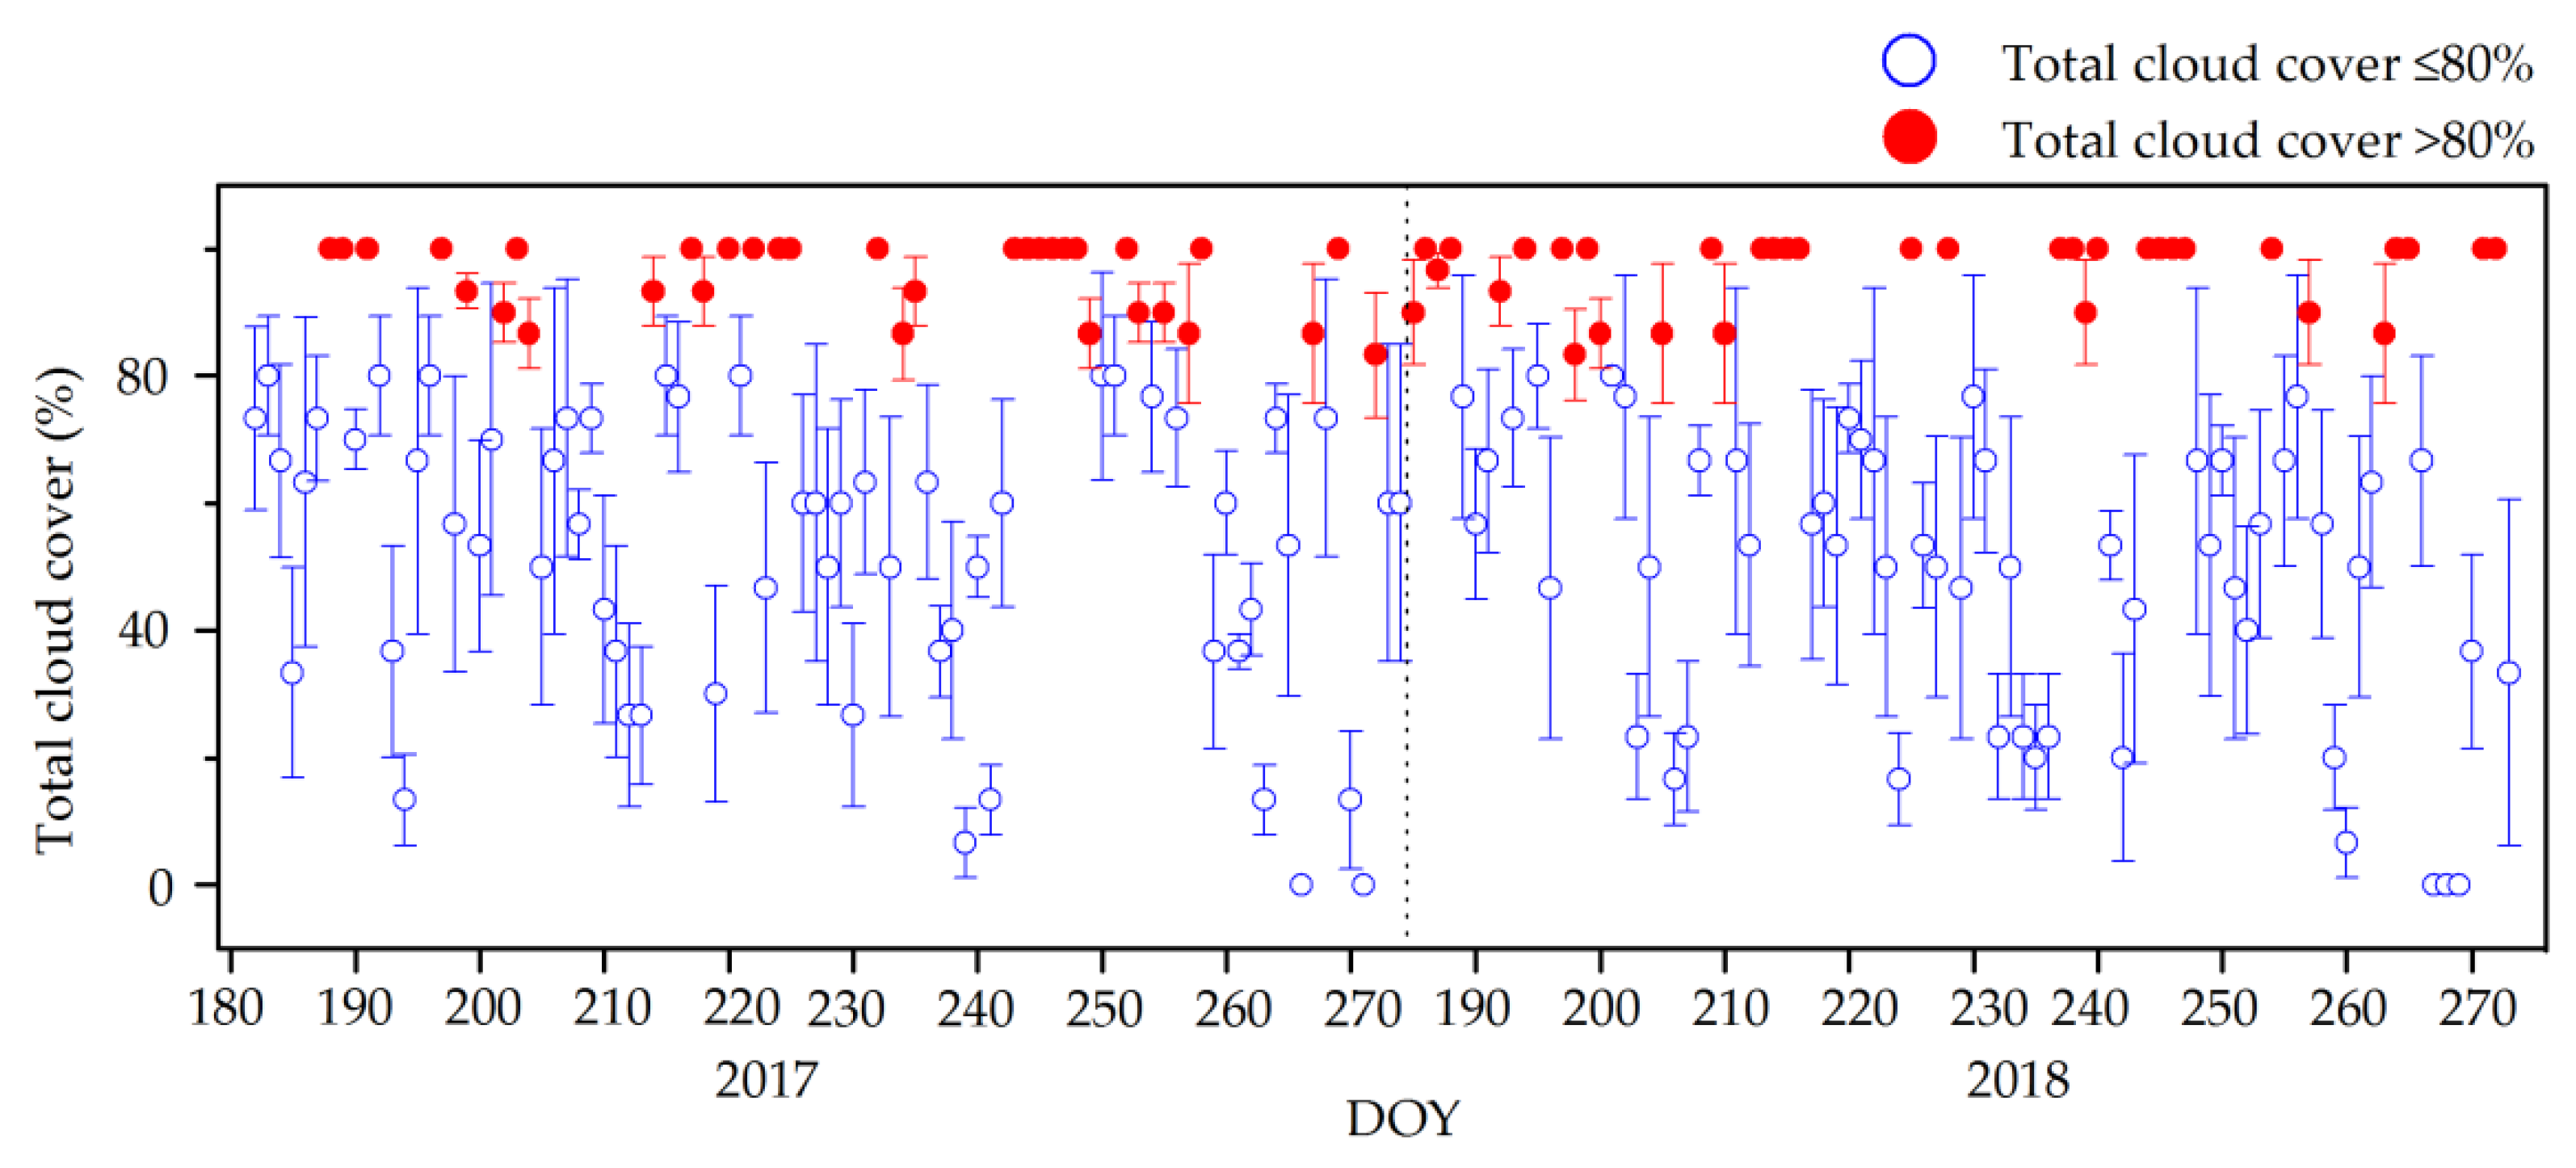
3.1. Environmental Conditions
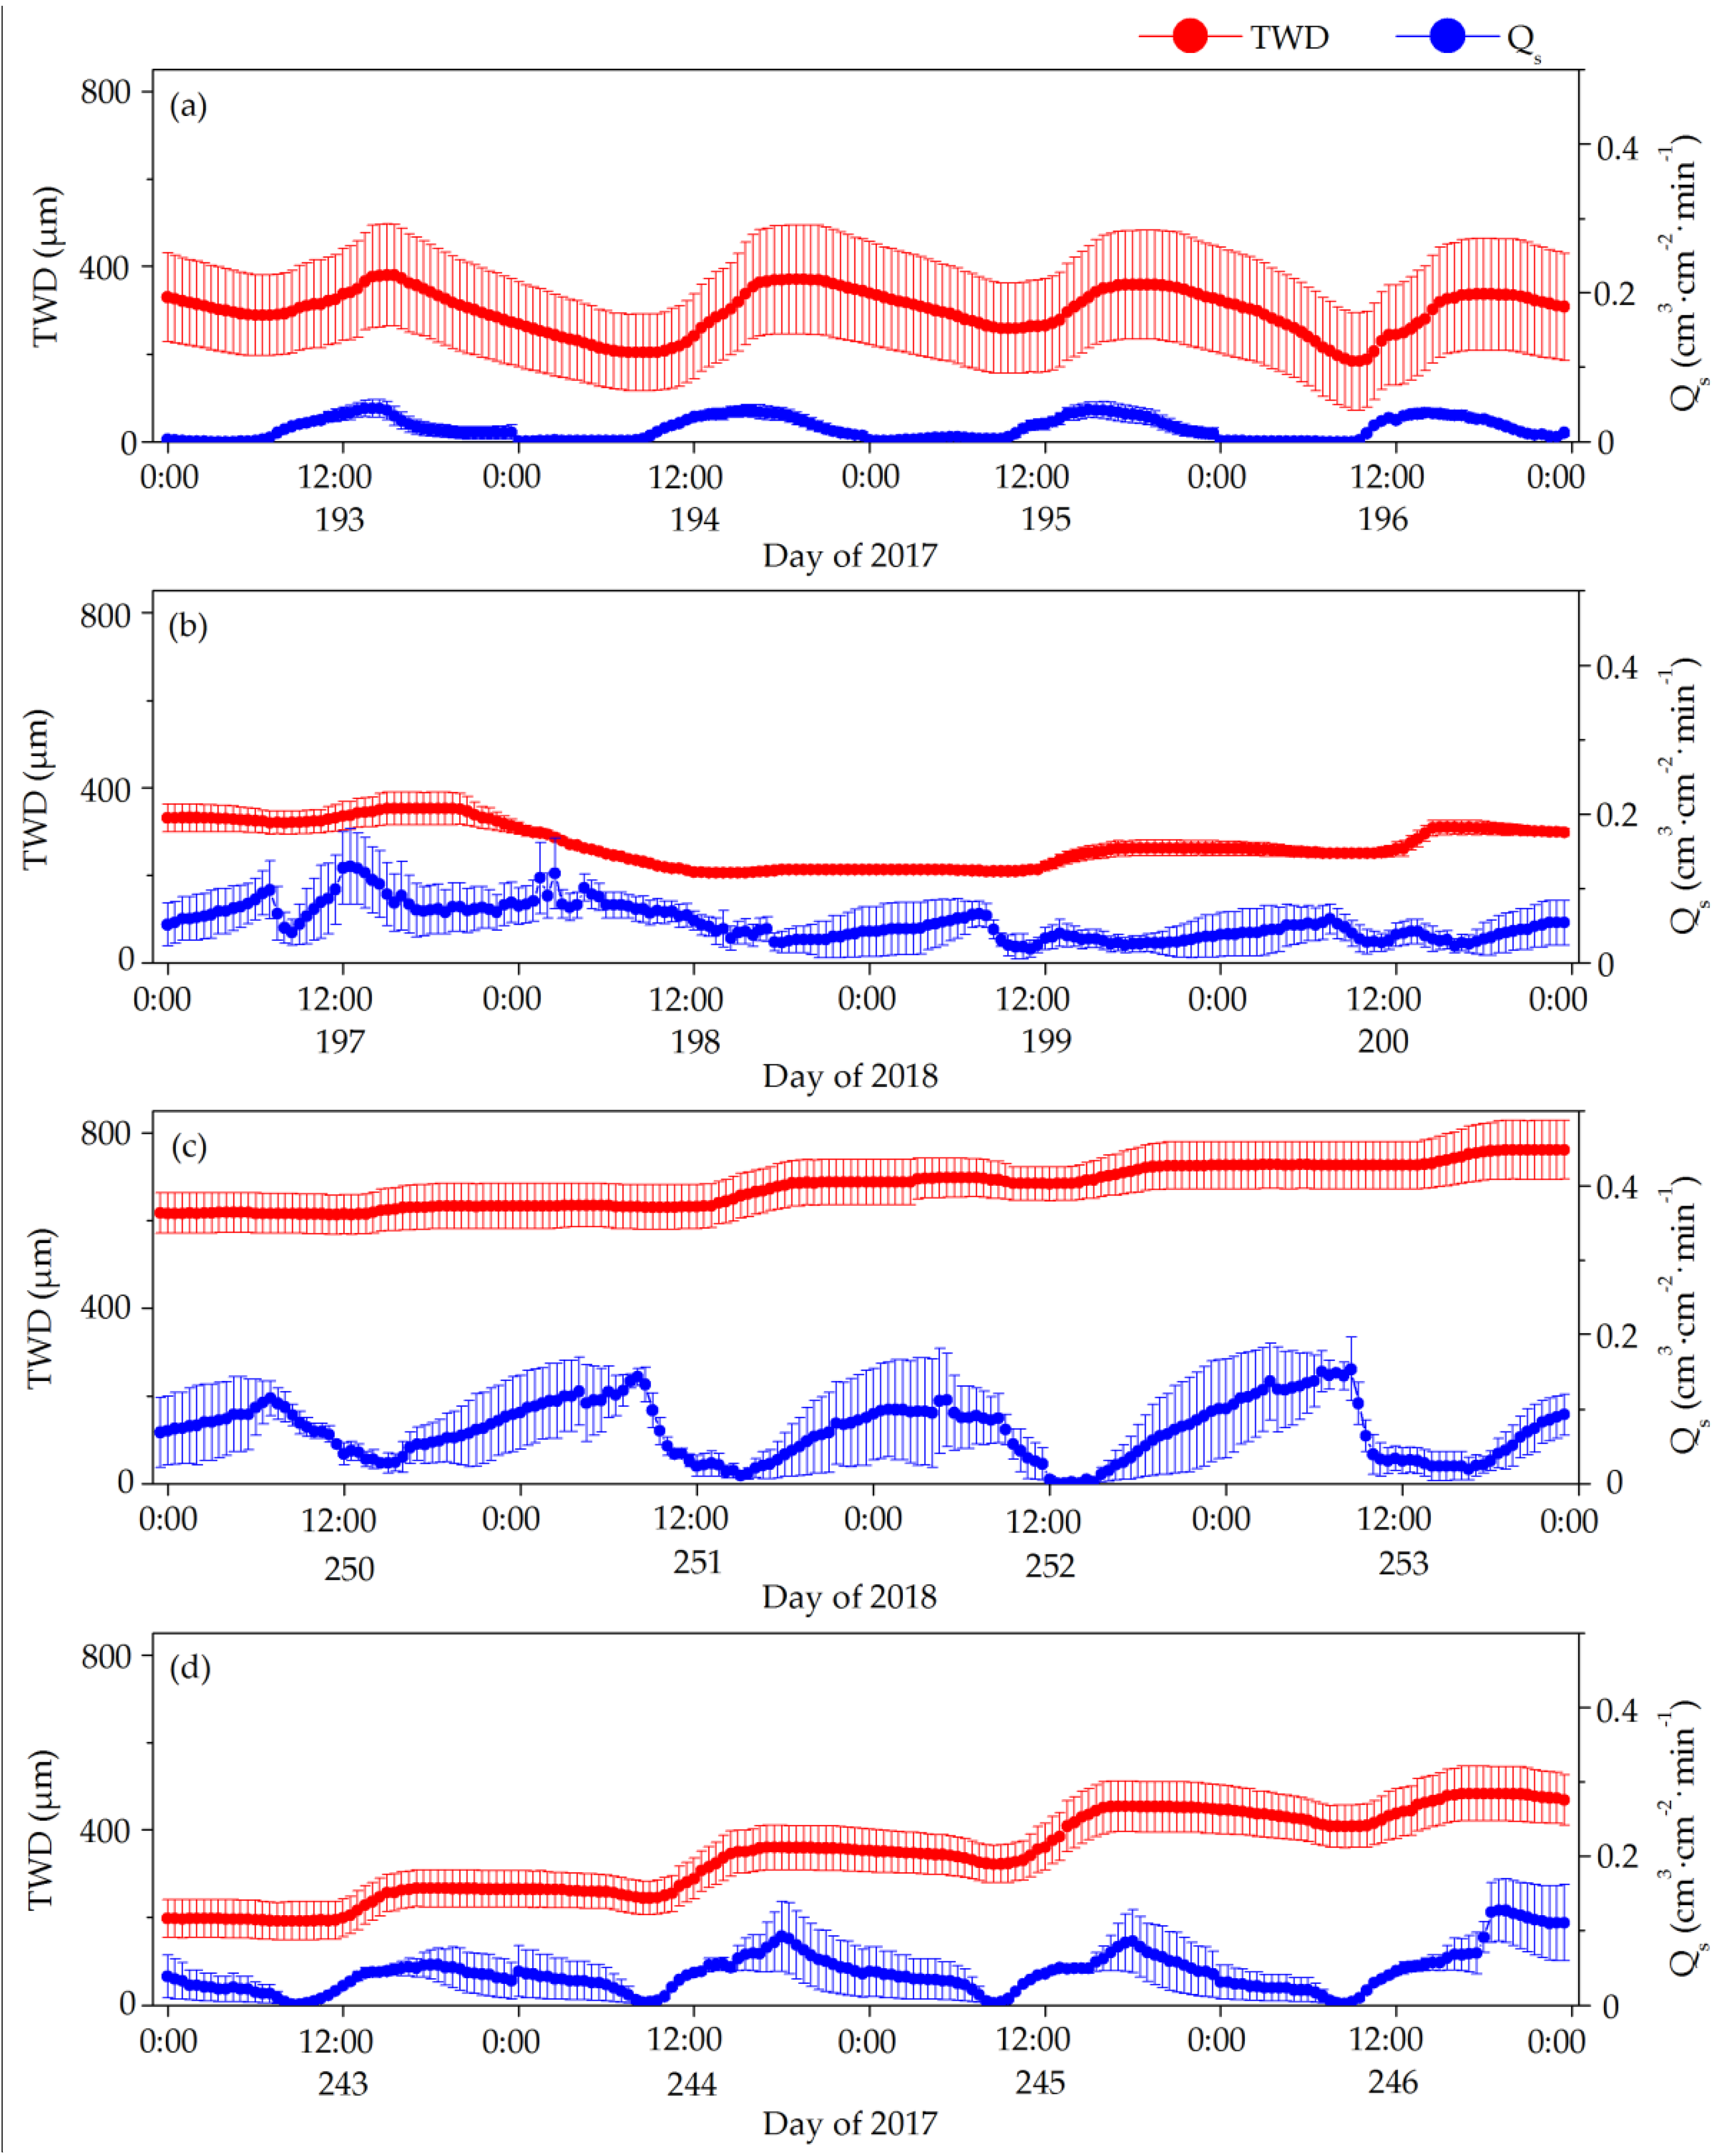
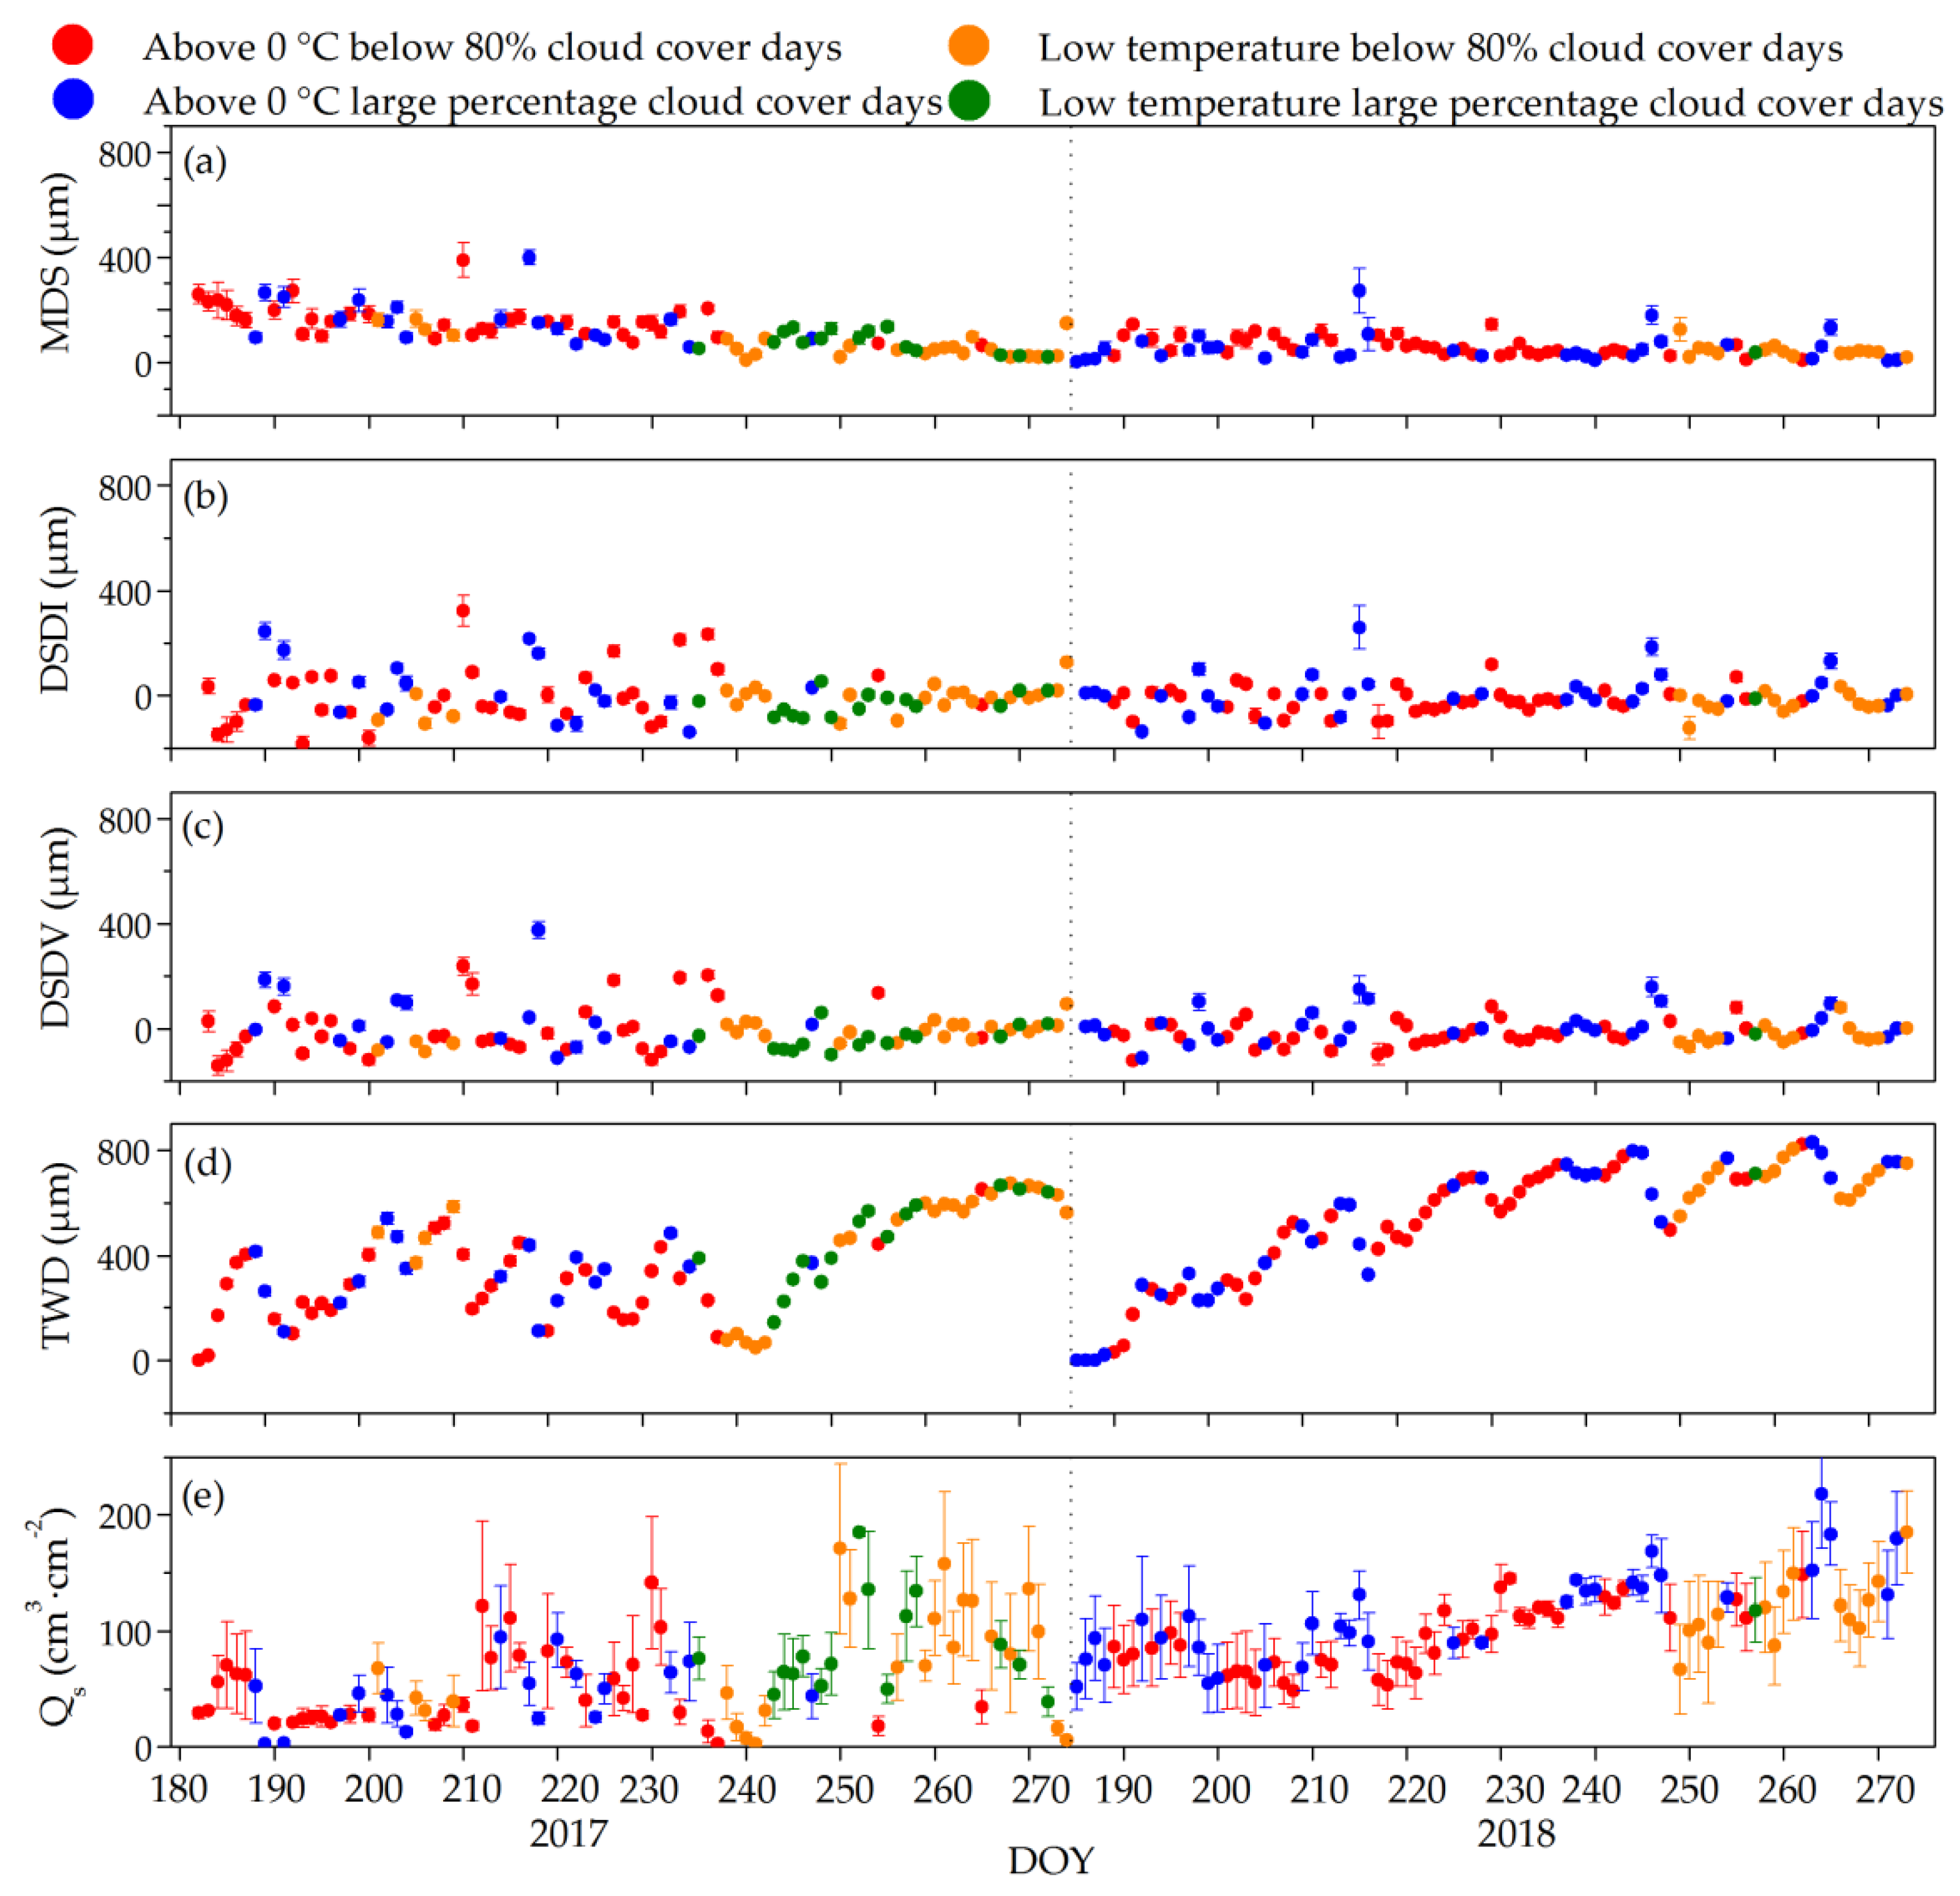
3.2. Daily Variation Trend of TWD and Sap Flow in the Dahurian Larch
3.3. Change Trends in Stem Diameter Shrinkage Indicators and Sap Flow Under Daily Time Resolution
4. Discussion
5. Conclusions
Author Contributions
Funding
Acknowledgments
Conflicts of Interest
References
- Perämäki, M.; Nikinmaa, E.; Sevanto, S.; Ilvesniemi, H.; Siivola, E.; Hari, P.; Vesala, T. Tree stem diameter variations and transpiration in Scots pine: An analysis using a dynamic sap flow model. Tree Physiol. 2001, 21, 889–897. [Google Scholar] [CrossRef]
- Sarris, D.; Siegwolf, R.; Körner, C. Inter- and intra-annual stable carbon and oxygen isotope signals in response to drought in Mediterranean pines. Agric. For. Meteorol. 2013, 168, 59–68. [Google Scholar] [CrossRef]
- Cocozza, C.; Tognetti, R.; Giovannelli, A. High-resolution analytical approach to describe the sensitivity of tree–environment dependences through stem radial variation. Forests 2018, 9, 134. [Google Scholar] [CrossRef]
- Dietrich, L.; Zweifel, R.; Kahmen, A. Daily stem diameter variations can predict the canopy water status of mature temperate trees. Tree Physiol. 2018, 38, 941–952. [Google Scholar] [CrossRef]
- Steppe, K.; Der Crone, J.S.V.; De Pauw, D.J.W. TreeWatch.net: A water and carbon monitoring and modeling network to assess instant tree hydraulics and carbon status. Front. Plant Sci. 2016, 7, 993. [Google Scholar] [CrossRef] [PubMed]
- Ortuño, M.F.; Conejero, W.; Moreno, F.; Moriana, A.; Intrigliolo, D.S.; Biel, C.; Mellisho, C.D.; Pérez-Pastor, A.; Domingo, R.; Ruiz-Sánchez, M.C.; et al. Could trunk diameter sensors be used in woody crops for irrigation scheduling? A review of current knowledge and future perspectives. Agric. Water Manag. 2010, 97, 1–11. [Google Scholar] [CrossRef]
- Meng, Z.J.; Duan, A.W.; Chen, D.L.; Dassanayake, K.B.; Wang, X.S.; Liu, Z.G.; Liu, H.; Gao, S.G. Suitable indicators using stem diameter variation-derived indices to monitor the water status of greenhouse tomato plants. PLoS ONE 2017, 12, e0171423. [Google Scholar] [CrossRef]
- Steppe, K.; Sterck, F.; Deslauriers, A. Diel growth dynamics in tree stems: Linking anatomy and ecophysiology. Trends Plant Sci. 2015, 20, 335–343. [Google Scholar] [CrossRef] [PubMed]
- Siegmund, J.F.; Sanders, T.G.M.; Heinrich, I.; Der Maaten, E.V.; Simard, S.; Helle, G.; Donner, R.V. Meteorol.ogical drivers of extremes in daily stem radius variations of beech, oak, pine in northeastern Germany: An event coincidence analysis. Front. Plant Sci 2016, 7, 733. [Google Scholar] [CrossRef]
- Tian, Y.; Zhang, Q.L.; Liu, X.; Meng, M. Stem radius variation in response to hydro-thermal factors in larch. Forests 2018, 9, 602. [Google Scholar] [CrossRef]
- Butz, P.; Raffelsbauer, V.; Graefe, S.; Peters, T.; Cueva, E.; Hölscher, D.; Bräuning, A. Tree responses to moisture fluctuations in a neotropical dry forest as potential climate change indicators. Ecol. Indic. 2017, 83, 559–571. [Google Scholar] [CrossRef]
- González-Rodríguez, Á.M.; Brito, P.; Lorenzo, J.R.; Gruber, A.; Oberhuber, W.; Wieser, G. Seasonal cycles of sap flow and stem radius variation of Spartocytisus supranubius in the alpine zone of Tenerife, Canary Islands. Alp. Bot. 2017, 127, 97–108. [Google Scholar] [CrossRef]
- Berry, Z.C.; Looker, N.; Holwerda, F.; Gómez Aguilar, L.R.; Colin, P.O.; Martínez, T.G.; Asbjornsen, H. Why size matters: The interactive influences of tree diameter distribution and sap flow parameters on upscaled transpiration. Tree Physiol. 2018, 38, 263–275. [Google Scholar] [CrossRef] [PubMed]
- Fernández, J.E.; Cuevas, M.V. Irrigation scheduling from stem diameter variations: A review. Agric. For. Meteorol. 2010, 150, 135–151. [Google Scholar] [CrossRef]
- Zweifel, R.; Häsler, R. Frost-induced reversible shrinkage of bark of mature subalpine conifers. Agric. For. Meteorol. 2000, 102, 213–222. [Google Scholar] [CrossRef]
- Daley, M.J.; Phillips, N.G. Interspecific variation in nighttime transpiration and stomatal conductance in a mixed New England deciduous forest. Tree Physiol. 2006, 26, 411–419. [Google Scholar] [CrossRef] [PubMed]
- Lapa, G.; Morandini, F.; Ferrat, L. Sap flow and photosynthetic response to climate and drought of Pinus nigra in a Mediterranean natural forest. Trees 2017, 31, 1711–1721. [Google Scholar] [CrossRef]
- Irvine, J.; Grace, J. Continuous measurements of water tensions in the xylem of trees based on the elastic properties of wood. Planta 1997, 202, 455–461. [Google Scholar] [CrossRef]
- Zhang, J.G.; He, Q.Y.; Shi, W.Y.; Otsuki, K.; Yamanaka, N.; Du, S. Radial variations in xylem sap flow and their effect on whole-tree water use estimates. Hydrol. Processes 2016, 29, 4993–5002. [Google Scholar] [CrossRef]
- King, G.; Fonti, P.; Nievergelt, D.; Büntgen, U.; Frank, D. Climatic drivers of hourly to yearly tree radius variations along a 6°C natural warming gradient. Agric. For. Meteorol. 2013, 168, 36–46. [Google Scholar] [CrossRef]
- Sevanto, S.; Nikinmaa, E.; Riikonen, A.; Daley, M.; Pettijohn, J.C.; Mikkelsen, T.N.; Phillips, N.; Holbrook, N.M. Linking xylem diameter variations with sap flow measurements. Plant Soil 2008, 305, 77–90. [Google Scholar] [CrossRef]
- Zweifel, R. Radial stem variations—A source of tree physiological information not fully exploited yet. Plant Cell Environ. 2016, 39, 231–232. [Google Scholar] [CrossRef] [PubMed]
- Körner, C.; Basler, D.; Hoch, G.; Kollas, C.; Lenz, A.; Randin, C.F.; Vitasse, Y.; Zimmermann, N.E. Where, why and how? Explaining the low-temperature range limits of temperate tree species. J. Ecol. 2016, 104, 1076–1088. [Google Scholar] [CrossRef]
- Zweifel, R.; Häsler, R. Dynamics of water storage in mature subalpine Picea abies: Temporal and spatial patterns of change in stem radius. Tree Physiol. 2001, 21, 561–569. [Google Scholar] [CrossRef] [PubMed]
- Granier, A. Evaluation of transpiration in a Douglas-fir stand by means of sap flow measurements. Tree Physiol. 1987, 3, 309–320. [Google Scholar] [CrossRef]
- Eliades, M.; Bruggeman, A.; Djuma, H.; Lubczynski, M.W. Tree water dynamics in a semi-arid, Pinus brutia forest. Water 2018, 10, 1039. [Google Scholar] [CrossRef]
- Hu, L.F.; Fan, Z.X. Stem radial growth in response to microclimate in an Asian tropical dry karst forest. Acta Ecol. Sin. 2016, 36, 401–409. [Google Scholar] [CrossRef]
- Intrigliolo, D.S.; Castel, J.R. Continuous measurement of plant and soil water status for irrigation scheduling in plum. Irrig. Sci. 2004, 23, 93–102. [Google Scholar] [CrossRef]
- Zweifel, R.; Haeni, M.; Buchmann, N.; Eugster, W. Are trees able to grow in periods of stem shrinkage? New Phytol. 2016, 211, 839–849. [Google Scholar] [CrossRef]
- Espadafor, M.; Orgaz, F.; Testi, L.; Lorite, I.J.; González-Dugo, V.; Fereres, E. Responses of transpiration and transpiration efficiency of almond trees to moderate water deficits. Sci. Hortic. 2017, 225, 6–14. [Google Scholar] [CrossRef]
- Janbek, B.M.; Stockie, J.M. Asymptotic and numerical analysis of a porous medium model for transpiration-driven sap flow in trees. Siam J. Appl. Math. 2017, 78, 2028–2056. [Google Scholar] [CrossRef]
- Mencuccini, M.; Salmon, Y.; Mitchell, P.; Hölttä, T.; Choat, B.; Meir, P.; O’Grady, A.; Tissue, D.; Zweifel, R.; Sevanto, S.; et al. An empirical method that separates irreversible stem radial growth from bark water content changes in trees: Theory and case studies. Plant Cell Environ. 2017, 40, 290–303. [Google Scholar] [CrossRef]
- Chen, Y.J.; Bongers, F.; Tomlinson, K.; Fan, Z.X.; Lin, H.; Zhang, S.B.; Zheng, Y.L.; Li, Y.P.; Cao, K.F.; Zhang, J.L. Time lags between crown and basal sap flows in tropical lianas and co-occurring trees. Tree Physiol. 2016, 36, 736–747. [Google Scholar] [CrossRef]
- Zegaoui, Z.; Planchais, S.; Cabassa, C.; Djebbar, R.; Belbachir, O.A.; Carol, P. Variation in relative water content, proline accumulation and stress gene expression in two cowpea landraces under drought. J. Plant Physiol. 2017, 218, 26–34. [Google Scholar] [CrossRef]
- Wang, Z.; Zhou, Z.X.; Wang, X.M.; Chen, Z.J. Relationships between transpiration, water loss, and air conditions during physiological drying. Dry Technol. 2018, 36, 245–254. [Google Scholar] [CrossRef]
- Bitterlich, M.; Sandmann, M.; Graefe, J. Arbuscular mycorrhiza alleviates restrictions to substrate water flow and delays transpiration limitation to stronger drought in tomato. Front. Plant Sci. 2018, 9, 154. [Google Scholar] [CrossRef] [PubMed]
- Mares, R.; Barnard, H.R.; Mao, D.Q.; Revil, A.; Singha, K. Examining diel patterns of soil and xylem moisture using electrical resistivity imaging. J. Hydrol. 2016, 536, 327–338. [Google Scholar] [CrossRef]
- Shen, Q.; Gao, G.Y.; Fu, B.J.; Lü, Y.H. Sap flow and water use sources of shelter-belt trees in an arid inland river basin of Northwest China. Ecohydrology 2016, 8, 1446–1458. [Google Scholar] [CrossRef]
- Matheny, A.M.; Bohrer, G.; Garrity, S.R.; Morin, T.H.; Howard, C.J.; Vogel, C.S. Observations of stem water storage in trees of opposing hydraulic strategies. Ecosphere 2015, 6, 1–13. [Google Scholar] [CrossRef]
- Zweifel, R.; Drew, D.M.; Schweingruber, F.; Downes, G.M. Xylem as the main origin of stem radius changes in Eucalyptus. Funct. Plant Biol. 2014, 41, 520–534. [Google Scholar] [CrossRef]
- Oberhuber, W.; Gruber, A. Climatic influences on intra-annual stem radial increment of Pinus sylvestris (L.) exposed to drought. Trees 2010, 24, 887–898. [Google Scholar] [CrossRef] [PubMed]
- Conesa, M.R.; Torres, R.; Domingo, R.; Navarro, H.; Soto, F.; Pérez-Pastor, A. Maximum daily trunk shrinkage and stem water potential reference equations for irrigation scheduling in table grapes. Agric. Water Manag. 2016, 172, 51–61. [Google Scholar] [CrossRef]
- Gallardo, M.; Thompson, R.B.; Valdez, L.C.; Fernández, M.D. Use of stem diameter variations to detect plant water stress in tomato. Irrig. Sci. 2006, 24, 241–255. [Google Scholar] [CrossRef]
- De Swaef, T.; Steppe, K.; Lemeur, R. Determining reference values for stem water potential and maximum daily trunk shrinkage in young apple trees based on plant responses to water deficit. Agric. Water Manag. 2009, 96, 541–550. [Google Scholar] [CrossRef]
- Wang, X.S.; Meng, Z.J.; Chang, X.; Deng, Z.; Li, Y.; Lv, M. Determination of a suitable indicator of tomato water content based on stem diameter variation. Sci. Hortic. 2017, 215, 142–148. [Google Scholar] [CrossRef]
- Chiu, C.W.; Komatsu, H.; Katayama, A.; Otsuki, K. Scaling-up from tree to stand transpiration for a warm-temperate multi-specific broadleaved forest with a wide variation in stem diameter. J. For. Res. 2016, 21, 161–169. [Google Scholar] [CrossRef]
- Deslauriers, A.; Anfodillo, T.; Rossi, S.; Carraro, V. Using simple causal modeling to understand how water and temperature affect daily stem radial variation in trees. Tree Physiol. 2007, 27, 1125–1136. [Google Scholar] [CrossRef] [PubMed]
- Brinkmann, N.; Eugster, W.; Zweifel, R.; Buchmann, N.; Kahmen, A. Temperate tree species show identical response in tree water deficit but different sensitivities in sap flow to summer soil drying. Tree Physiol. 2016, 36, 1508–1519. [Google Scholar] [CrossRef] [PubMed]
- Sánchez-Costa, E.; Poyatos, R.; Sabaté, S. Contrasting growth and water use strategies in four co-occurring Mediterranean tree species revealed by concurrent measurements of sap flow and stem diameter variations. Agric. For. Meteorol. 2015, 207, 24–37. [Google Scholar] [CrossRef]
- Drew, D.M.; Richards, A.E.; Downes, G.M.; Cook, G.D.; Baker, P. The development of seasonal tree water deficit in Callitris intratropica. Tree Physiol. 2011, 31, 953–964. [Google Scholar] [CrossRef] [PubMed]
- Köcher, P.; Horna, V.; Leuschner, C. Environmental control of daily stem growth patterns in five temperate broad-leaved tree species. Tree Physiol. 2012, 32, 1021–1032. [Google Scholar] [CrossRef] [PubMed]

| Statistics | Breast Height Diameters (cm) | Tree Height (m) |
|---|---|---|
| maximum value | 46.3 | 25.5 |
| minimum value | 4.3 | 4.2 |
| mean ± SD | 19.6 ± 9.5 | 16.7 ± 5.7 |
| N | 62 | 62 |
| Air Temperature and Cloudiness Conditions | Air Temperature (°C) | Total Cloud Cover (%) | Stem Sap Flow (cm3·cm−2) | Maximum Daily Shrinkage (µm) | Daily Stem Diameter Increment (µm) | Daily Stem Diameter Variation (µm) | Tree Water Deficit-induced Stem Shrinkage (µm) |
|---|---|---|---|---|---|---|---|
| Above 0 °C below 80% cloud cover days | 14.5 | 55 | 71.89 | 110 | −10 | −9 | 399 |
| Above 0 °C large percentage cloud cover days | 14.4 | 97 | 89.96 | 92 | 19 | 20 | 441 |
| Low temperature below 80% cloud cover days | 4.4 | 43 | 90.23 | 58 | −19 | −17 | 548 |
| Low temperature large percentage cloud cover days | 5.2 | 94 | 86.42 | 78 | −29 | −37 | 470 |
| Stem Diameter Shrinkage Index | Above 0 °C Below 80% Cloud Cover Days | Above 0 °C Large Percentage Cloud Cover Days | Low Temperature Below 80% Cloud Cover Days | Low Temperature Large Percentage Cloud Cover Days | ||||||||
|---|---|---|---|---|---|---|---|---|---|---|---|---|
| r | p | n | r | p | n | r | p | n | r | p | n | |
| Tree water deficit-induced stem shrinkage | 0.371 | ≤0.001 | 3648 | 0.468 | ≤0.001 | 2448 | 0.389 | ≤0.001 | 1872 | 0.317 | ≤0.001 | 768 |
| Stem Diameter Shrinkage Indexes | Above 0 °C Below 80% Cloud Cover Days | Above 0 °C Large Percentage Cloud Cover Days | Low Temperature Below 80% Cloud Cover Days | Low Temperature Large Percentage Cloud Cover Days | ||||||||
|---|---|---|---|---|---|---|---|---|---|---|---|---|
| r | p | n | r | p | n | r | p | n | r | p | n | |
| MDS | −0.545 | ≤0.001 | 76 | −0.385 | ≤0.01 | 51 | −0.417 | ≤0.01 | 39 | −0.058 | >0.05 | 16 |
| DSDI | −0.236 | ≤0.05 | 76 | −0.049 | >0.05 | 51 | −0.224 | >0.05 | 39 | −0.064 | >0.05 | 16 |
| DSDV | −0.267 | ≤0.05 | 76 | −0.134 | >0.05 | 51 | −0.153 | >0.05 | 39 | −0.102 | >0.05 | 16 |
| TWD | 0.601 | ≤0.001 | 76 | 0.677 | ≤0.001 | 51 | 0.652 | ≤0.001 | 39 | 0.454 | >0.05 | 16 |
© 2019 by the authors. Licensee MDPI, Basel, Switzerland. This article is an open access article distributed under the terms and conditions of the Creative Commons Attribution (CC BY) license (http://creativecommons.org/licenses/by/4.0/).
Share and Cite
Tian, Y.; Zhang, Q.; Liu, X.; Meng, M.; Wang, B. The Relationship between Stem Diameter Shrinkage and Tree Bole Moisture Loss Due to Transpiration. Forests 2019, 10, 290. https://doi.org/10.3390/f10030290
Tian Y, Zhang Q, Liu X, Meng M, Wang B. The Relationship between Stem Diameter Shrinkage and Tree Bole Moisture Loss Due to Transpiration. Forests. 2019; 10(3):290. https://doi.org/10.3390/f10030290
Chicago/Turabian StyleTian, Yuan, Qiuliang Zhang, Xuan Liu, Meng Meng, and Bing Wang. 2019. "The Relationship between Stem Diameter Shrinkage and Tree Bole Moisture Loss Due to Transpiration" Forests 10, no. 3: 290. https://doi.org/10.3390/f10030290
APA StyleTian, Y., Zhang, Q., Liu, X., Meng, M., & Wang, B. (2019). The Relationship between Stem Diameter Shrinkage and Tree Bole Moisture Loss Due to Transpiration. Forests, 10(3), 290. https://doi.org/10.3390/f10030290


