Article

Leaf Enzyme and Plant Productivity Responses to Environmental Stress Associated with Sea Level Rise in Two Asian Mangrove Species

Institute of Tropiccal Agriculture and Forestry, Hainan University, Haikou 570228, China
*
Author to whom correspondence should be addressed.
Forests 2019, 10(3), 250; https://doi.org/10.3390/f10030250
Submission received: 31 January 2019 / Revised: 4 March 2019 / Accepted: 4 March 2019 / Published: 12 March 2019
(This article belongs to the Section Forest Ecophysiology and Biology)

Abstract

:
As the only forests situated at the transition between land and sea, mangrove forests are one of the first ecosystems vulnerable to rising sea levels. When the sea level rises, plants are exposed to increased salinity, as well as tidal flooding. The responses of mangrove forests to changing sea levels depend on the synergistic effects of tidal flooding and salinity on plants, especially seedlings. The focus of this paper is to assess the ability of different tide position on mangrove Aegiceras corniculatum (A. corniculatum) and Bruguiera sexangula (B. sexangula) seedlings to withstand tidal flooding and seawater salinity, and to investigate the effects of tidal flooding and salinity on plant growth. To accomplish this, a controlled experiment was initiated to examine the synergistic effects of tidal flooding and salinity on the growth and physiology of A. corniculatum and B. sexangula seedlings subjected to four tidal flooding times and four levels of salinity over a course of six months. The results showed that the biomass and antioxidant enzymes of A. corniculatum and B. sexangula seedlings were significantly affected by the increase in salinity and flooding time. Changes in biomass, SOD, and CAT activity of A. corniculatum seedlings show that they are more adapted to grow in an environment with high salinity and long flooding time than B. sexangula. Our results show that species growing in middle- to low-tide levels were better adapted to sea level rise than those growing at high-tide levels.

1. Introduction

Mangrove communities are woody plants communities that are distributed on tidal flats in tropical and subtropical coasts [1]. They play an important role in windbreak formation and wave elimination, beach and dam protection, sea water purification and protection of benthic biodiversity. As the only forests situated at the transition between land and sea, mangrove forests are the first to experience the effects of sea level rise, especially plants in the seedling stage [2,3]. Sea level rise affects the growth, development, and distribution of mangrove plants, causing dynamic changes of mangrove communities and forcing the mangroves to move away from the sea and towards land [4,5]. However, the landward side of many mangrove is often hardened, making landward movement challenging for mangrove communities. In this situation, mangroves face a serious threat [4,5,6,7]. Therefore, research on the effects of sea level rise on mangroves and the adaptability of mangrove plants to this type of change has drawn an increasing amount of attention [8]. Both single factor [9,10,11] and double factor [6,12] studies have shown that seawater salinity and tidal flooding time are important factors affecting mangrove forests [13,14,15,16]. In fact, mangrove communities in the same area form an ecosystem distributed from low–medium to high tidal positions due to the varied adaptability of mangroves to different tidal positions [17]. With sea level rise, several important questions remain, i.e., how will the growth and physiological indicators of mangroves at different tidal positions change as sea levels rise? At which tidal position will mangroves be more seriously affected by sea level rise?
The response of plants under stress can be directly observed for changes in their growth and development [1]. Measurements of physiological responses to stress are generally determined by measuring the physiological indicators of resistance to stress, including antioxidant enzyme activity and membrane system damage [18,19,20]. Because the indicators of plant physiological resistance to stress will change along with stress, they reflect the degree of damage that occurs to cell structure and function, and also the adaptive changes that occur in plants under adverse conditions [21]. Catalase (CAT) and superoxide dismutase (SOD) are important antioxidant enzymes in plants. When plants are stressed, the activity of CAT and SOD will be enhanced to resist stress [22,23] and to some extent, stress injury can be alleviated. However, CAT and SOD activity will also reduce and this can cause damage or even death of plants when the stress exceeds the tolerance level of the plants [18,24,25,26,27,28]. Malondialdehyde (MDA) is the end-product of membrane lipid peroxidation. Numerous studies have shown that MDA levels increase with an increase in stress and injury [29,30].
A. corniculatum is a typical species growing in Hainan island, China, at middle to low tidal position, and B. sexangulais is a typical species growing at the high tidal position. In the present study, the potential effects of sea-level rise on the growth and ecophysiology of the two species were examined. The aim was to assess the ability of A. corniculatum and B. sexangula seedlings to withstand tidal flooding and salinity, given different flooding time and seawater salinities. To accomplish this, a control experiment was initiated to examine the combined effects of tidal inundation and salinity on the growth and physiology of A. corniculatum and B. sexangulais samples subjected to four flooding times (2 h, 4 h, 6 h, and 8 h simulated semidiurnal tide, twice daily) and four levels of water salinity (10, 20, 30, and 40 ppt [part per thousand]) during a six-month experimental period. This study describes a case of growth and ecophysiology effect to sea level rise for two species typically growing at different tidal positions; the study also provides theoretical support for the protection and restoration of mangroves during sea level rise.

2. Materials and Methods

2.1. Materials

Developed seedlings of A. corniculatum and B. sexangulais were collected from Dongzhaigang National Nature Reserve, Hainan, China (19°56’53” N, 110°34’49” E). The plant height of seedlings was generally between 20–25 cm. The tide in this area is semidiurnal and seawater salinity is generally 15–17 ppt. Tidal changes in the main distribution area of the two species were measured. The tidal time in the main distribution area of A. corniculatum is 8–11 h per day, and in B. sexangula is 4–6 h per day.

2.2. Methods

2.2.1. Experimental System Settings

The seedlings were grown in a temporary greenhouse at an internship farm at Hainan University. A cross-experimental system was established with a total of 16 groups using four salinity levels: 10 ppt (S1), 20 ppt (S2), 30 ppt (S3) and 40 ppt (S4) and four flooding time: 2 h (T1), 4 h (T2), 6 h (T3), 8 h (T4) (Table 1). Each group had three seedlings and three replicates, a total of 144 plants per species. Salinity treatment was carried out using sea salt (from Dongfang city saltwork) and tap water. Salinity levels were checked and adjusted weekly. The tide flooding time was simulated into semidiurnal tides and divided into two injection/discharge cycles per day (Table 2). The flooding and draining for each group were controlled with mini water pumps (Type: HQB-2000, rated power: 24 W, pump head:1.8 m and pump flow: 1400 L/h). The experiment was conducted from January 2017 to July 2017. At the end of the experiment, mature leaves without damage were collected for the determination of various physiological indices.

2.2.2. Measurements Method

Seedling biomass was measured as oven dried weight at 80 °C [31]. The biomass of seedlings was weighed with electronic scales (ARA520, Ohaus Corporation, Shanghai, China; Measuring accuracy: 0.01 g).
500 mg of fresh leaf samples (n = 3) taken from the plant were pulverized with a mortar and pestle in liquid nitrogen before adding 0.05 M phosphate buffer (pH = 7.0) for further grinding. Then, the suspension was collected in a test tube and diluted with the same buffer to 10 mL for testing enzyme activity. The activity of SOD was determined by nitro-blue tetrazolium colorimetric (NBT) assay; the activity of CAT was determined by the ultraviolet absorption method; the MDA level was measured by the thiobarbituric acid method [31,32]. The SOD, CAT, and MDA were measured with a UV/VIS Spectrometer (Lambda 35, Perkin Elmer, CT, USA).

2.2.3. Data analysis method

Mean and standard error (SE) of three replicates were calculated. Data on all biomass of seedlings, SOD activity, CAT activity, and MDA content were analyzed for differences in flooding treatments and between salinity treatments by analysis of variance. If the difference was significant at p < 0.05, Duncan test was employed to determine the potential source of the difference. All statistical analyses were performed with SPSS, version 16.0 (SPSS Inc., Chicago, IL, USA). Statistical significance was defined as p < 0.05.

3. Results

3.1. Effects of Salinity and Flooding Time on the Biomass of Seedlings

Salinity and flooding time had a significant effect on the variability of the biomass of seedlings (p < 0.01; Table 3), and the combination of salinity and flooding time had a significant effect (p < 0.01; Table 3).
In the T1, T2, T3, and T4 treatments groups, salinity increased the biomass of A. corniculatum seedlings; they increased first and then decreased. The seedlings cultured in S2 had the highest value and in S4 had the lowest value (Figure 1a). However, the biomass of B. sexangula seedlings showed a decreased trend; the seedlings cultured in S1 had the highest value and in S4 the lowest value (Figure 1b). Because of the effect of flooding time on salinity stress, the biomass of A. corniculatum seedlings in the T3 treatment group under different salinity treatments was higher than that under corresponding salinity treatments in the T1, T2 and T4 treatment groups, and the decrease of A. corniculatum biomass in T3 flooding group were lower than those in the T1, T2, and T4 flooding groups. But in the T1 treatment group, the biomass of B. sexangula seedlings under different salinity treatments was higher than that under the corresponding salinity treatments in the T2, T3, and T4 treatment groups and the decrease of B. sexangula biomass in T1 flooding group were lower than those in the T2, T3, and T4 flooding groups.
In the S1, S2, S3, and S4 treatments groups, as flooding time increased the biomass of A. corniculatum seedlings, all increased first and then decreased; the seedlings cultured in T3 had the highest (Figure 1a). The biomass of B. sexangula seedlings decreased and the seedlings cultured in the S1 treatment grew the most (Figure 1b). Due to the effect of salinity on the flooding stress, the biomass of A. corniculatum seedlings in the S2 salinity group under each flooding treatment was higher than that in the S1, S3, and S4 treatment group under corresponding flooding treatment and the decrease of biomass in the S2 salinity group was lower than those in the S1, S3, and S4 salinity groups. But the biomass of B. sexangula seedlings under each flooding treatment in the S1 salinity group was higher than that under corresponding flooding treatment in the S2, S3, and S4 treatment groups and the decrease of biomass in the S1 salinity group was lower than those in the S2, S3, and S4 salinity groups.

3.2. Effects of Salinity and Flooding Time on SOD Activity in Seedlings Leaves

Salinity and flooding time had a significant effect on the variability of SOD activity in leaves (p < 0.01; Table 3), and the combination of salinity and flooding time also had a significant effect (p < 0.01; Table 3).
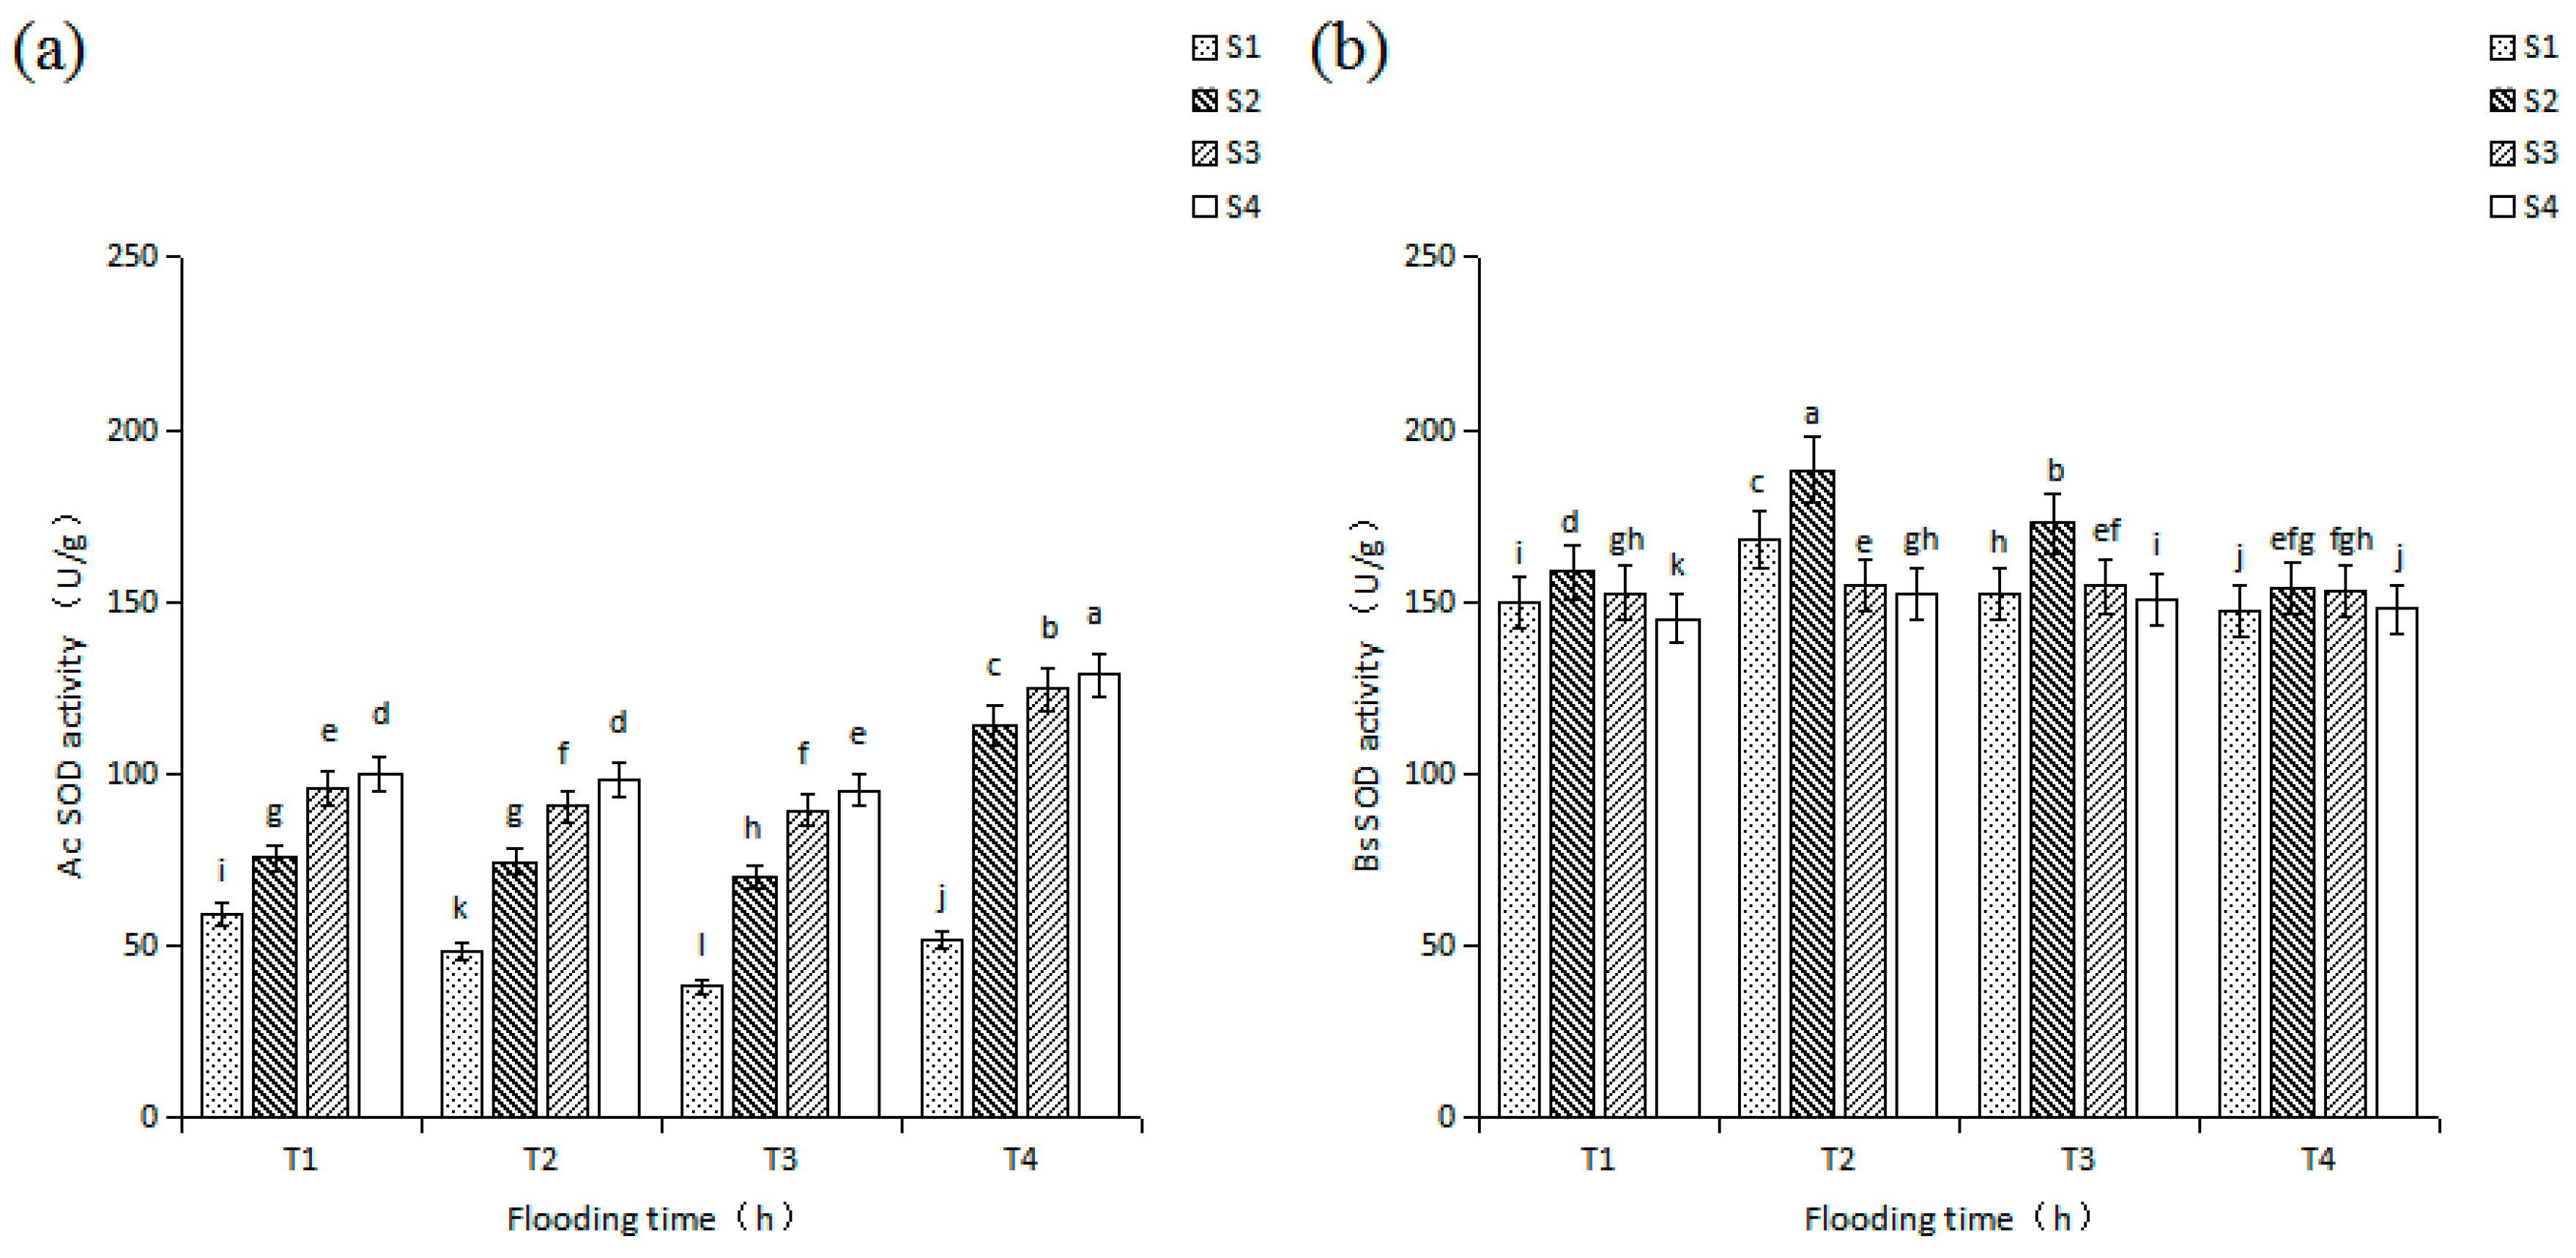
As salinity increased, SOD activity in the leaves of A. corniculatum seedlings showed a gradually increasing trend, and seedlings cultured in S4 had the highest value in the same flooding time treatment (Figure 2a). While SOD activity in the leaves of B. sexangula seedlings increased first and then decreased, the seedlings in S2 had the highest value (Figure 2b). Due to the effect of flooding time on salinity stress, in the leaves of A. corniculatum seedlings, SOD activity of different salinity treatment in the T1, T2, and T3 flooding groups was lower than that of the corresponding salinity treatment in the T4 flooding group. However, in the leaves of B. sexangula seedlings, SOD activity of different salinity treatments in the T1, T3, and T4 groups was lower than those of corresponding salinity treatment in the T2 group.
As flooding time increased, SOD activity in the leaves of A. corniculatum seedlings decreased first and then increased; the seedlings cultured in T3 had the lowest value and the seedlings cultured in T4 had the highest (Figure 2a). While SOD activity in the leaves of B. sexangula seedlings increased first and then decreased, the seedlings cultured in T1 had a lower value and the seedlings in T2 had the highest value (Figure 2b). Due to the effect of salinity on flooding stress, in the leaves of A. corniculatum seedlings, SOD activity of different flooding treatment in the S1, S2, and S3 salinity groups was lower than that of the corresponding flooding treatment in the S4 salinity group. But in the leaves of B. sexangula seedlings, SOD activity of different flooding treatments in the S1, S3, and S4 salinity groups was lower than that of corresponding flooding treatment in the S2 salinity group.

3.3. Effects of Salinity and Flooding Time on CAT Activity in Seedlings Leaves

Salinity and flooding time had a significant effect on the variability of CAT activity in A. corniculatum and B. sexangula seedlings leaves (p < 0.01; Table 3), and the combination of salinity and flooding time had a significant effect (p < 0.01; Table 3).
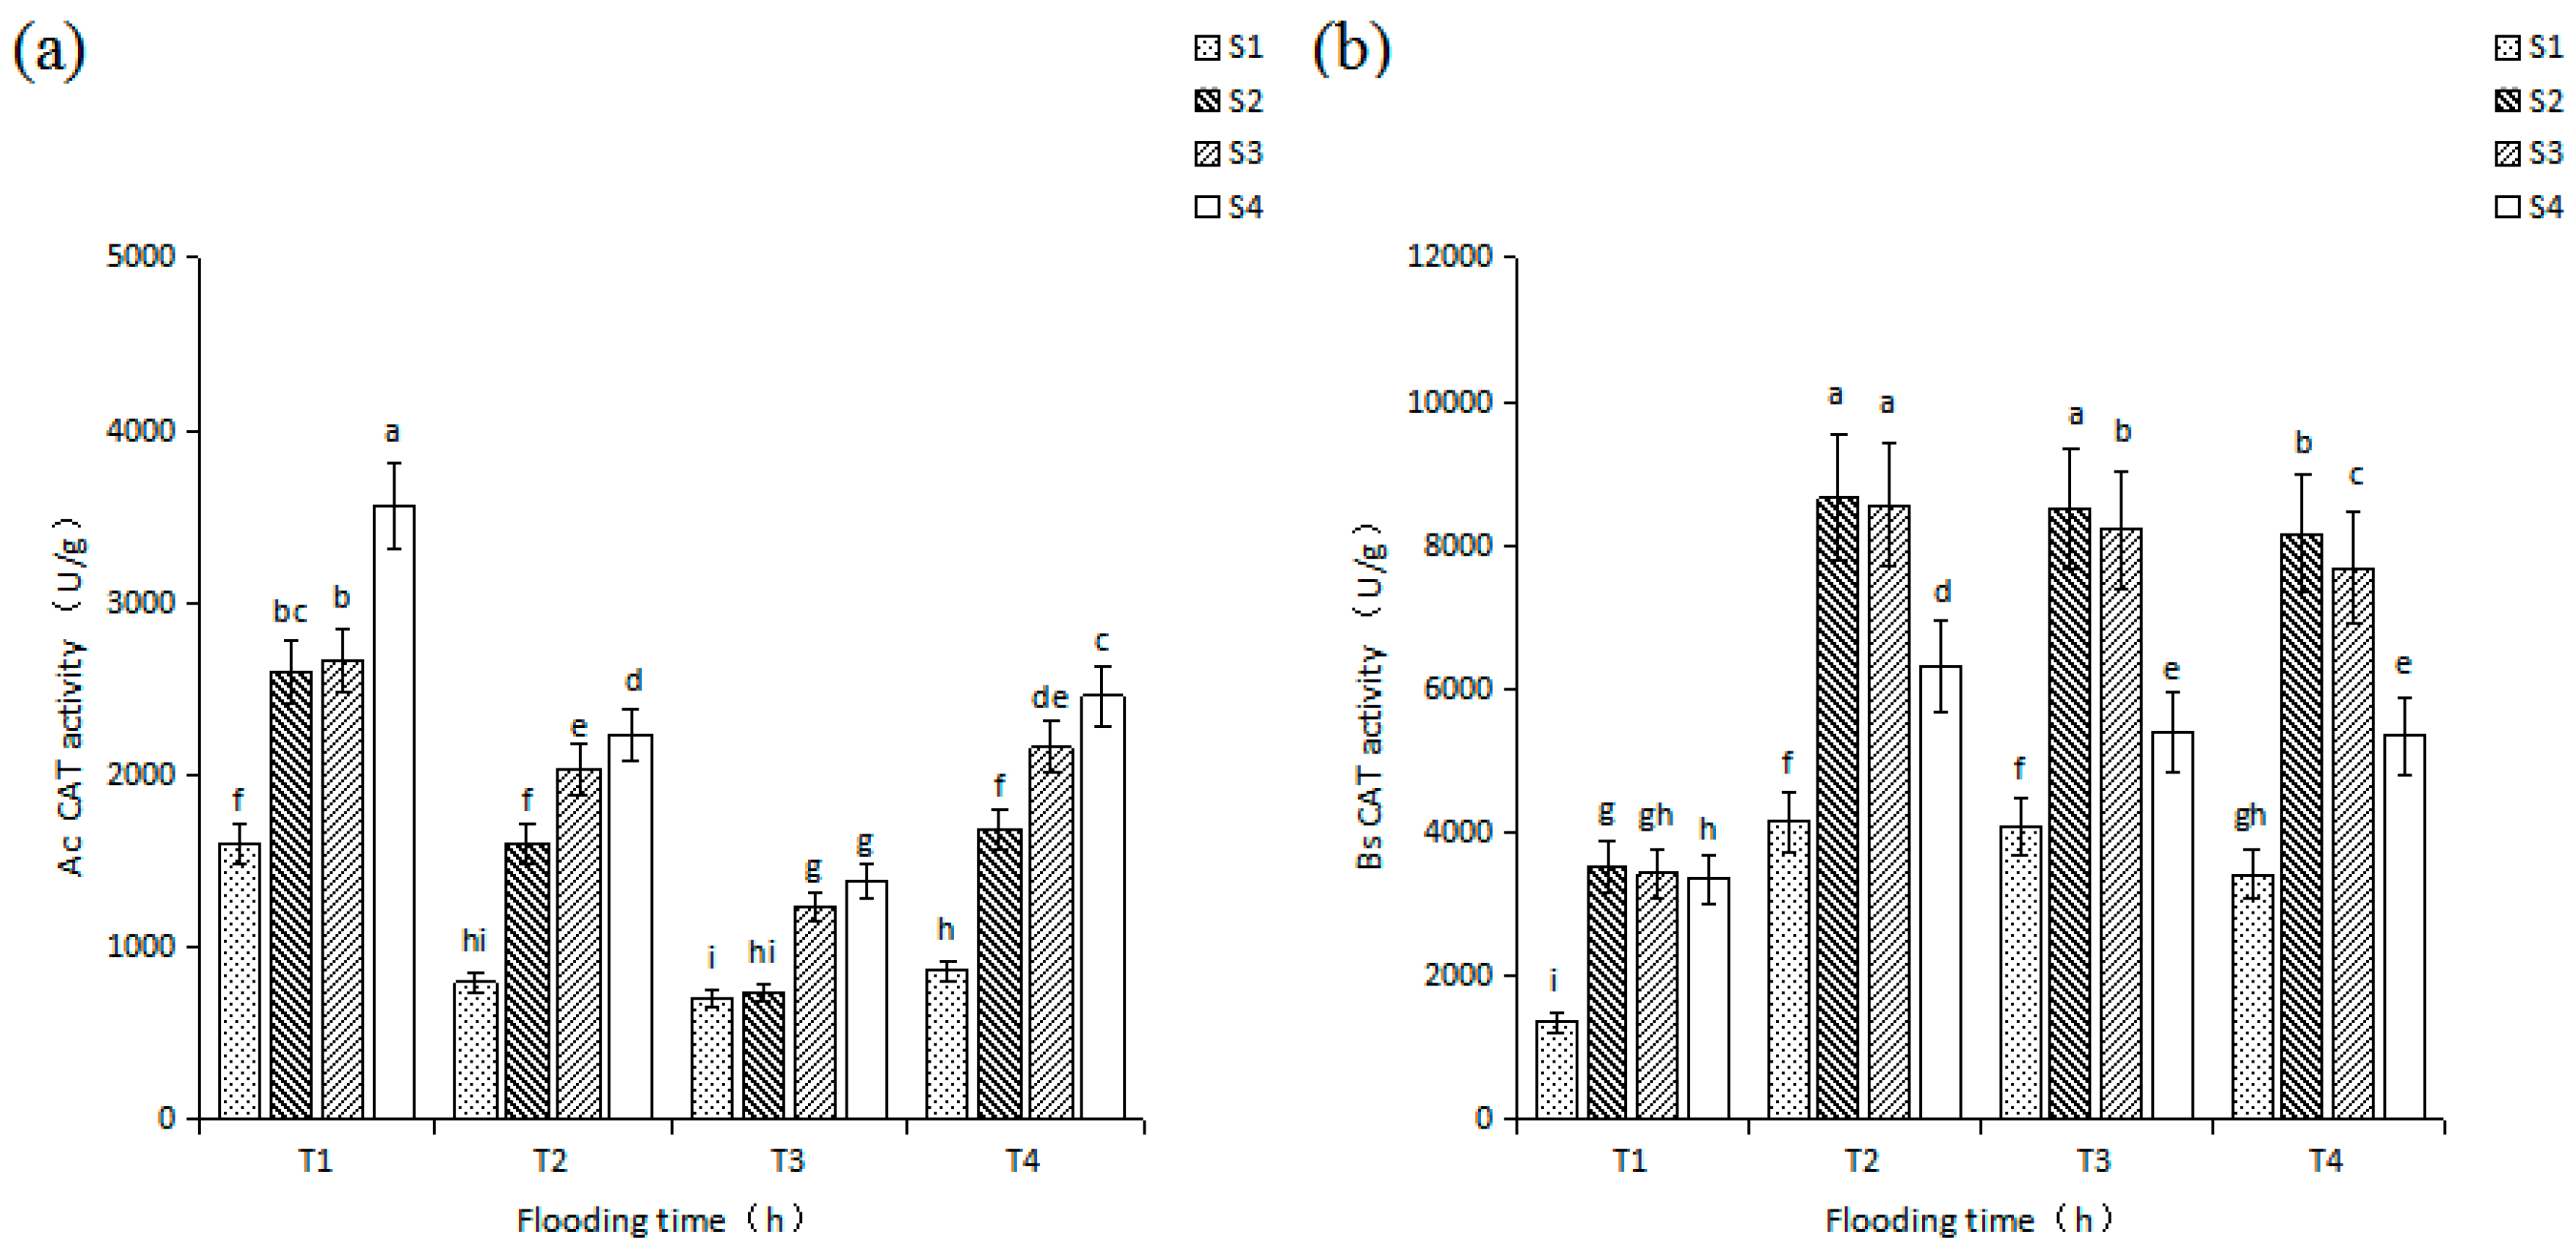
In the T1, T2, T3, and T4 treatments groups, with the increase of salinity, CAT activity in the leaves of A. corniculatum seedlings had a gradual increasing trend and seedlings in S4 had the highest value (Figure 3a). While CAT activity in the leaves of B. sexangula seedlings all increased first and then decreased, seedlings in S2 had the highest value (Figure 3b). Due to the effect of flooding time on salinity stress, in the leaves of A. corniculatum seedlings, CAT activities of different salinity treatments in the T1, T2, and T4 flooding groups were higher than that of corresponding salinity treatments in the T3 flooding group. But in the leaves of B. sexangula seedlings, CAT activities of different salinity treatments in the T2, T3 and T4 flooding groups were higher than that of corresponding salinity treatments in the T1 flooding group.
In the S1, S2, S3, and S4 treatments groups, with increase of flooding time, CAT activity in the leaves of A. corniculatum seedlings all decreased first and then increased; the seedlings in T3 had the lowest value (Figure 3a). While CAT activity in the leaves of B. sexangula seedlings all increased first and then decreased, the seedling in T1 had the lowest value (Figure 3b). Due to the effect of salinity on flooding stress, in the leaves of A. corniculatum seedlings, CAT activity of different flooding treatments in the S1, S2, and S3 salinity groups was lower than that of corresponding flooding treatment in the S4 salinity group. But in the leaves of B. sexangula seedlings, CAT activities of each flooding treatments in S1, S3 and S4 salinity groups were lower than those of corresponding flooding treatments in the S2 salinity group.

3.4. Effects of Salinity and Flooding Time on MDA Level in Seedlings Leaves

Salinity and flooding time had an extremely significant effect on the variability of MDA content in A. corniculatum and B. sexangula seedlings leaves (p < 0.01; Table 3), and the combination of salinity and flooding time had significant effects (p < 0.01; Table 3).
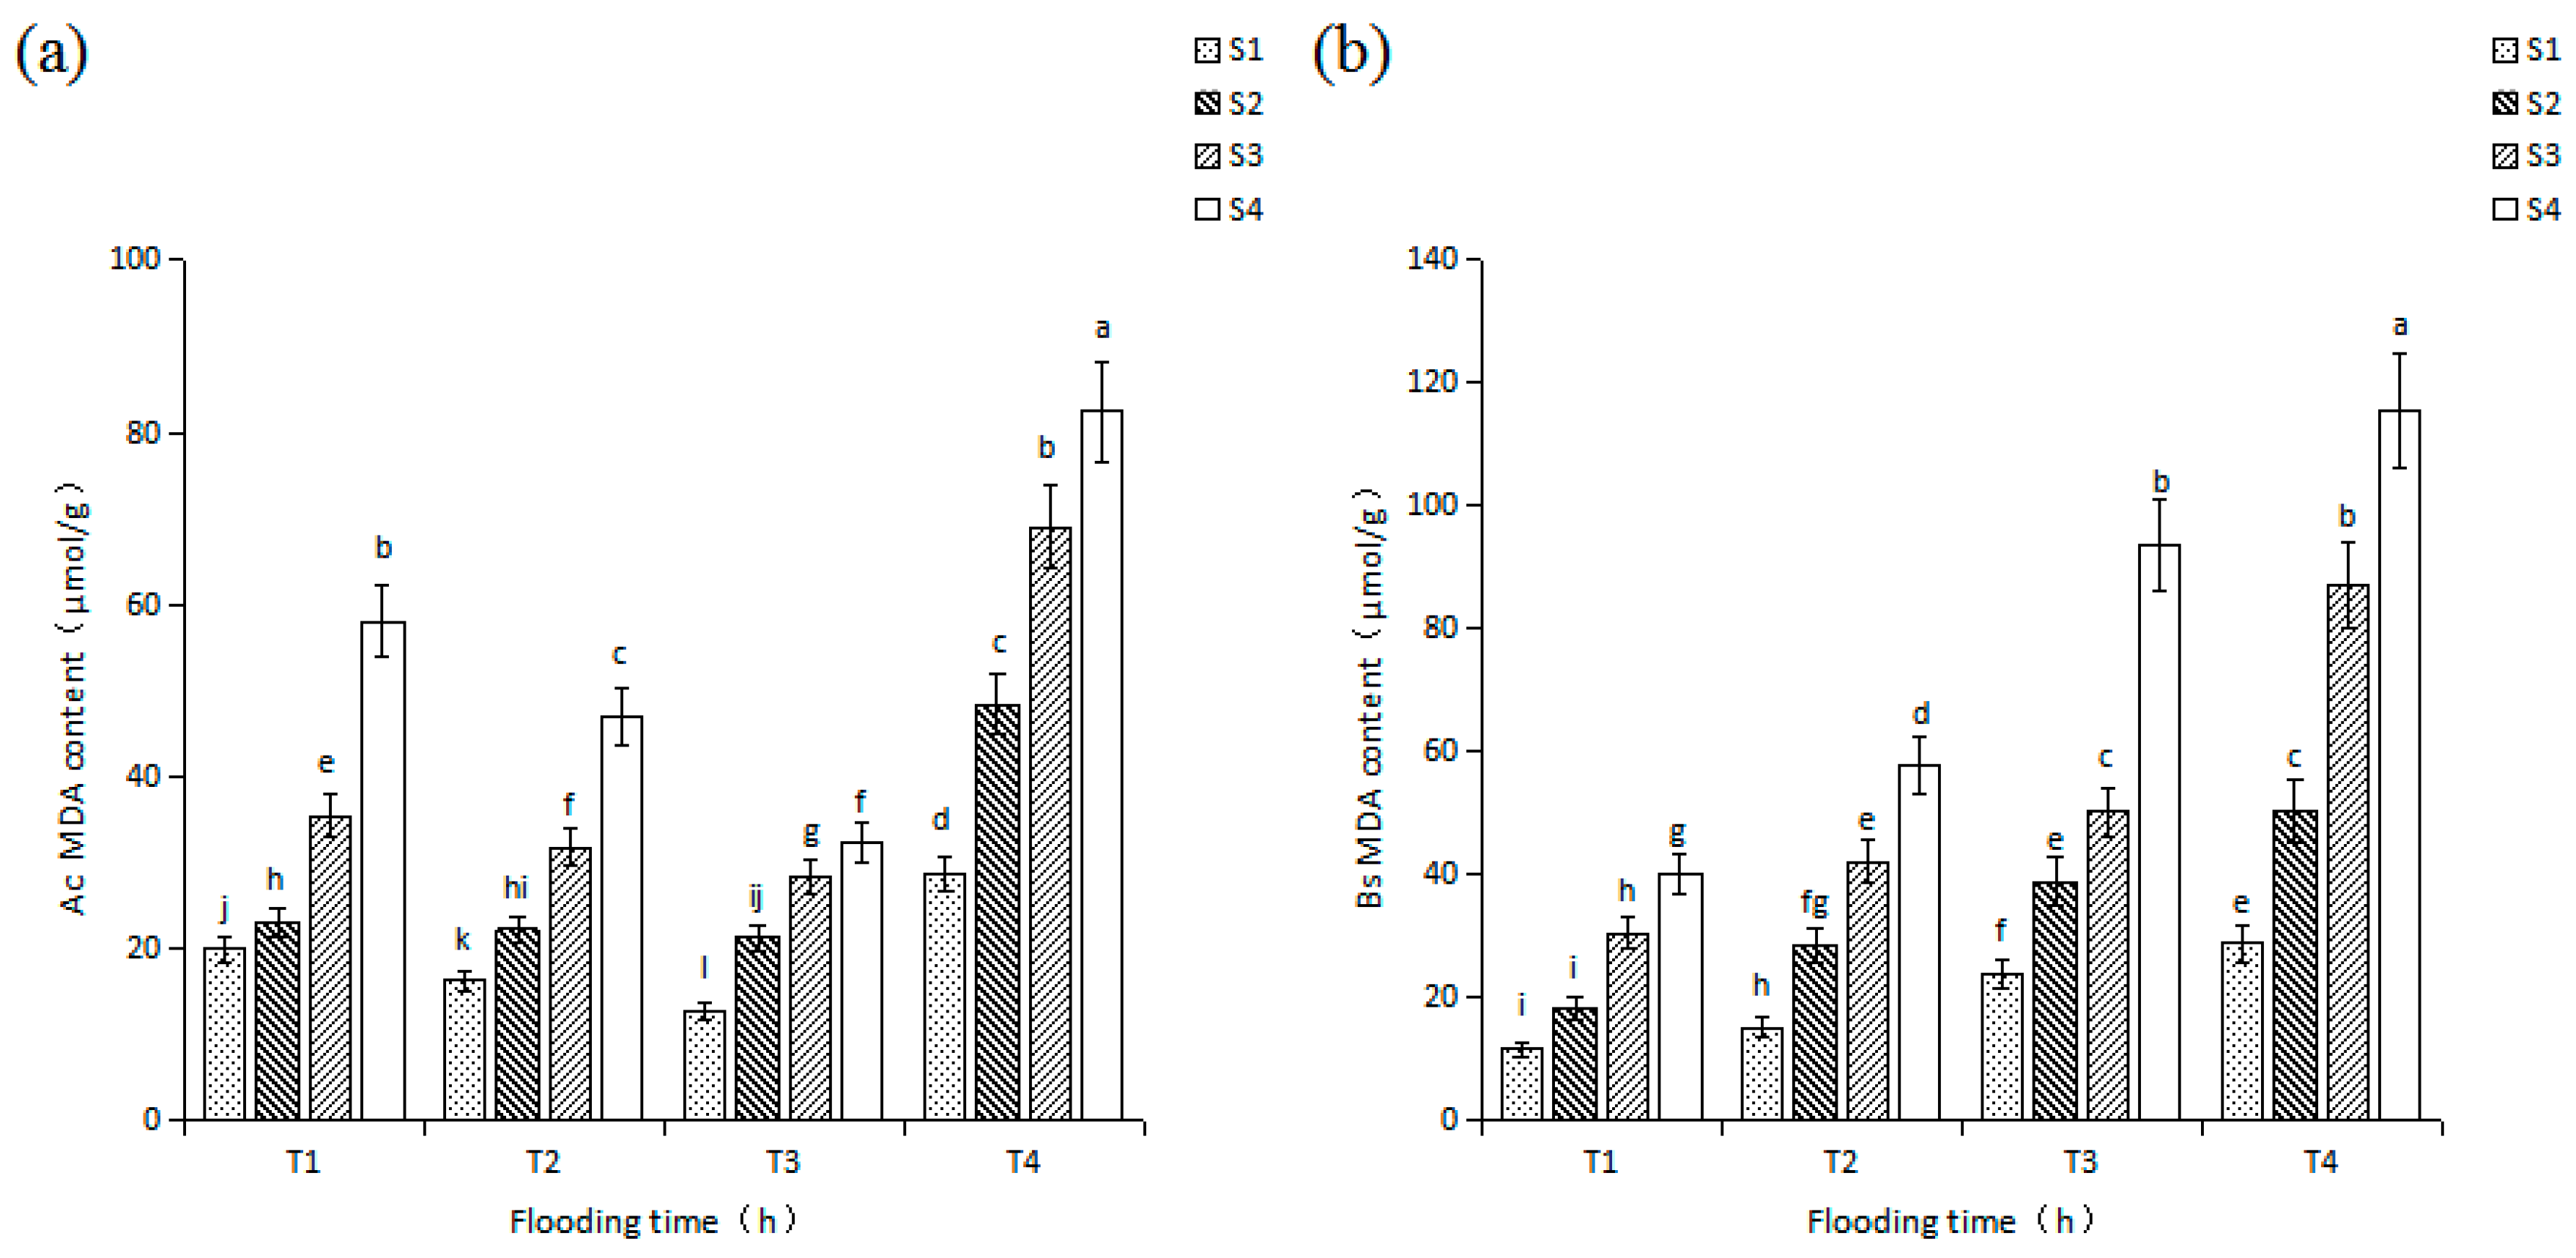
As the increase of salinity, MDA content in the leaves of A. corniculatum seedlings was a gradually increasing trend and the seedlings in S1 had the lowest value (Figure 4a). However, MDA content in the leaves of B. sexangula seedlings was a gradually increasing trend and the seedlings in S1 had the lowest value (Figure 4b). Because of the effect of flooding time on the salinity stress, in the leaves of A. corniculatum seedlings, MDA contents of different salinity treatments in the T1, T2, and T4 flooding groups were higher than that of corresponding salinity treatments in the T3 flooding group. But in the leaves of B. sexangula seedlings, MDA contents of different salinity treatments in the T2, T3, and T4 flooding groups were higher than that of corresponding salinity treatments in the T1 flooding group. MDA contents rangeability of A. corniculatum seedlings in each flooding groups were lower than that of B. sexangula seedlings.
With increase of flooding time, MDA content in the leaves of A. corniculatum seedlings decreased first and then increased; seedlings in T3 had the lowest value (Figure 4a). However, MDA content in the leaves of B. sexangula seedlings was a gradually increasing trend and the seedlings in T1 had the lowest value (Figure 4b). Because of the effect of salinity on the flooding stress, in the leaves of A. corniculatum seedlings, MDA contents of different flooding treatments in the S2, S3, and S4 salinity groups were higher than that of corresponding flooding treatment in the S1 salinity group. But in the leaves of B. sexangula seedlings, MDA contents of different flooding treatments in the S2, S3, and S4 salinity groups were higher than that of corresponding flooding treatments in the S1 salinity group.

4. Discussion

The effects of sea level rise on mangrove plants have been recorded worldwide [4,33,34]. Scientists have also conducted research on this topic with the goal of understanding the mechanism mangrove plants use to adapt to sea level rise, especially the mechanism used in response to increased salinity and prolonged flooding time [2,15,35]. Because humans have little control over salinity and flooding time in most coastal seawaters, quantitatively analyzing the relationship between the factors affecting mangroves is challenging. Therefore, most past experiments were conducted using laboratory simulations of salinity and flooding time gradients of seawater [6,9,36]. The studies range from those that control a single factor or two factors and explore the negative effect of flooding time and salinity of seawater on mangrove plants to physiological responses [8,37,38,39,40]. It is critically important to characterize the response mechanism of mangrove plant seedlings with different distributions along the shoreline to sea level rise. In this study, a two-factor-based method was used to assess the growth of mangrove plants in different tidal positions. The results showed that both the selected mangroves, B. sexangula (a species distributed in high tidal positions) and A. corniculatum (a species distributed in low tidal positions) provide good examples of the mechanism mangroves use to respond to sea level rise.
Regarding salinity, the results showed that B. sexangula seedlings were more prone to salinity stress and damage, and A. corniculatum seedlings showed stronger tolerance. The B. sexangula seedlings were more suitable for growth in 10 ppt (S1), and the increased salinity inhibits seedling growth. The A. corniculatum seedlings were more suitable for growth in 20 ppt (S2), and both increased and reduced salinity inhibits seedling growth. Previous studies have shown that different mangrove species had a suitable salinity for growth, and higher or lower salinities would inhibit its growth [41,42]. Both biomass changes suggested that the A. corniculatum seedlings were more suitable for growth in higher salinity than the B. sexangula seedlings. Regarding the physiological index, in the leaves of B. sexangula seedlings, the indices (change of MDA content and SOD and CAT activities) showed that the salinity stress of the seedlings was within the range of their tolerance and the seedlings could grow normally in 10–20 ppt (S1–S2); however, in 30–40 ppt (S3–S4), the seedlings were subjected to salinity stress exceeding their tolerance, inhibiting seedling growth. However, physiological markers for A. corniculatum showed that the salinity stress of the seedlings was within the range of their tolerance and the seedlings could grow normally in 10–40 ppt (S1–S4). Liao et al. (2007) studied the effects of salinity stress on the growth of Rhizophora stylosa seedlings at mid-tidal positions, and the results showed that CAT and SOD activity in leaves of R. stylosa seedlings increased gradually in 30 ppt. When salinity was higher than 40 ppt, SOD activity decreased significantly, while CAT activity continuously increased [38]. Combined with our results, this shows that the salt tolerance of mangrove plants grown in three different tidal zones was A. corniculatum > R. stylosa > B. sexangula.
With respect to flooding time, the results showed that B. sexangula seedlings growing at high tide levels were more prone to flooding stress and damage, but the A. corniculatum seedlings growing in the middle and low tides showed stronger flooding tolerance. The B. sexangula seedlings had a higher growth in 2 h (T1), and the increased flooding time inhibits seedling growth. The A. corniculatum seedlings were more suitable for growth in 6 h (T2), and both increased and reduced flooding time inhibits seedling growth. Previous studies had shown that different mangrove species had a suitable flooding time for growth—too long or too short with modifications of flooding time in both senses inhibiting their growth. [43,44,45]. Both biomass changes suggested that the A. corniculatum seedlings were more suitable for growing in longer flooding time than the B. sexangula seedlings. In terms of physiological indicators, in the leaves of B. sexangula seedlings, the changes of three physiological indices showed that the flooding stress of the seedlings was within the range of their tolerance and the seedlings could grow normally in 2–4 h (T1-T2). However, in 6–8 h (T3-T4), the seedlings were subjected to flooding stress exceeding their tolerance, and seedling growth is inhibited. But in the leaves of A. corniculatum seedlings, the changes of physiological indices showed that the flooding stress of the seedlings was within the range of their tolerance and the seedlings could grow normally in 2–8 h (T1-T4) in our setting flooding time range. Chen et al. (2005) studied the effects of tidal flooding on seedlings of Kandelia cbovata at mid-low tidal positions. They found that when the flooding time exceeded 4 h, SOD activity of K. cbovatac seedling leaves increased significantly. In the 6 h flooding environment, when flooding time was prolonged, no decrease in SOD activity was observed [6]. Combined with our results, we conclude that flooding tolerance was K. cbovatac > B. sexangula.
However, as sea level rises, the main influencing factors of mangrove plants under stress or damage are the increase of flood time and salinity [13,14,15,16]. Our experimental results further indicate that the B. sexangula seedlings were more seriously stressed under the synergistic effect of increased salinity and flooding time. The biomass of B. sexangula seedlings was highest in 10 ppt & 2 h (S1T1), and the smallest in the environment of 40 ppt & 8 h (S4T4). The changes in biomass showed that the seedlings were suitable for growth in 10 ppt & 2 h (S1T1) and with the increase of salinity and flooding time, the growth of seedlings was inhibited. The increase of salinity or flooding time could exacerbate each other’s influence on seedling growth. The biomass accumulation of A. corniculatum seedlings was highest in the environment of 20 ppt & 6 h (S2T3) and the smallest in the environment of 40 ppt & 2 h (S4T1). The changes of biomass showed that the seedlings were suitable for growth in 20 ppt & 6 h (S2T3) and with increased or reduced salinity and flooding time, the growth of seedlings were inhibited. The increased and reduced salinity or flooding time could exacerbate each other’s influence on seedling growth.
In terms of physiological indices, MDA content of B. sexangula seedlings increased in the synergistic effect of salinity 10–20 ppt and flooding 2–4 h. SOD and CAT activities of the leaves increased, and the seedlings could also resist the double stress of salinity and flooding. But in an environment of salinity 30–40 ppt or flooding 6–8 h, MDA content increased significantly, but SOD and CAT activities in the leaves decreased; the B. sexangula seedlings could not resist the double stress of salinity and flooding time. The changes of MDA content, SOD and CAT activity showed that the seedlings were suitable for growth in salinity 10–20 ppt and flooding 2–4 h (S1–S2 & T1-T2); with an increase of salinity and flooding time, the growth of seedlings were inhibited. In an environment of salinity 20 ppt and 6 h, A. corniculatum seedlings were subjected to lower stress, and MDA content, SOD activity, and CAT activity were lower. With increase or decrease of salinity and flooding time, the stress of A. corniculatum seedlings was increased; MDA content increased and SOD and CAT activities increased. However, there was no decrease within the setting of salinity and flooding time range of experiments. The changes of MDA content, SOD and CAT activity showed that the seedlings were suitable for growth in salinity 10–40 ppt and flooding 2–8 h (S1–S4 & T1-T4); with the increase of salinity and flooding time, the growth of seedlings were not inhibited. Ye et al. (2010) analyzed the effects of increasing tide and salinity caused by sea level rise on K. cbovatac seedlings and found that the seedlings grew normally at 8 h and 25 ppt. K. cbovatac seedlings grew normally but SOD activity increased significantly [39]. This indicates that K. cbovatac growing in the medium and low tidal positions has a stronger resistance to increased flooding time and salinity. Therefore, under the stress of increasing salinity and flooding time, B. sexangula seedlings, growing at high tidal positions, were more vulnerable than A. corniculatum and K. cbovatac seedlings growing at a low tidal position.
Sea level rise leads to increase in flooding time and salinity for mangroves. Although mangrove plants can adapt to an environment with salt water flooding, their physiological characteristics show that mangrove plants cannot be immersed in seawater for a long time [6,7]. This leads to a retreat of mangrove forest toward the land. However, in many areas, coastal hardening often blocks the inland retreat of mangrove plants [34,46]. In this case, they are subject to the effects or even injury from a combination of increased flooding time and higher salinity. The results of this study show that plants growing at high tidal positions, such as B. sexangula, were more sensitive to increase in both salinity and flooding time. Therefore, sea level rise is expected to initially affect mangrove plants at high tidal positions.

5. Conclusions

This study showed that the biomass and physiological responses of A. corniculatum and B. sexangula seedlings were significantly affected by the increase of salinity and flooding time. Under the stress of increased salinity and flooding time of seedlings, the changes of seedling biomass were basically consistent with the change trend of physiological response. It was found that A. corniculatum seedlings were more suitable than B. sexangula seedlings for growth in environments that had high salinity and long flooding time. The study showed that, in the process of rising sea level, species growing at middle- to low-tide levels were better adapted to increasing salinity and flooding time than those growing at high tide levels. As a result, the mangrove plants that grow at high tidal positions are the first affected by the process. In this paper, the above conclusions were obtained only through measurement and analysis of changes in the biomass of seedlings and changes in antioxidant enzymes in the leaves. Other adaptive mechanisms of mangrove seedlings in response to sea level rise need to be furthered investigated.

Author Contributions

Conceptualization, X.L., and X.Y.; Data curation, X.L., and Q.D.; Funding acquisition, D.L.; Investigation, X.L. and M.Z.; Methodology, X.L.; Project administration, X.Y.; Resources, D.L.; Writing—original draft, X.L.; Writing—review & editing, X.L., and X.Y.

Funding

This work was financially supported by the National Natural Science Foundation of China (31760170; 31460120).

Acknowledgments

This work was financially supported by the National Natural Science Foundation of China (31760170; 31460120). We thank LetPub (https://www.letpub.com.cn/) for editing this manuscript.

Conflicts of Interest

The authors declare no conflict of interest.

References

  1. Wang, W.Q.; Wang, M. The Mangroves of China; Science Press: Beijing, China, 2007; pp. 10–19. [Google Scholar]
  2. Ken, W.K.; Karen, L.M.; Catherine, E.L.; Donald, R.C.; Neil, S.; Ruth, R.; Luzhen, C. How mangrove forests adjust to rising sea level. New Phytol. 2014, 202, 19–34. [Google Scholar]
  3. Semeniuk, V. Predicting the Effect of Sea-Level Rise on Mangroves in Northwestern Australia. J. Coast. Res. 1994, 10, 1050–1076. [Google Scholar]
  4. Gilman, E.L.; Ellison, J.; Duke, N.C.; Field, C. Threats to mangroves from climate change and adaptation options: A review. Aquat. Bot. 2008, 89, 237–250. [Google Scholar] [CrossRef]
  5. Gopal. Future of wetlands in tropical and subtropical Asia, especially in the face of climate change. Aquat. Sci. 2013, 75, 39–61. [Google Scholar] [CrossRef]
  6. Chen, L.; Wang, W.; Peng, L. Photosynthetic and physiological responses of Kandelia candel L. Druce seedlings to duration of tidal immersion in artificial seawater. Environ. Exp. Bot. 2005, 54, 256–266. [Google Scholar]
  7. He, B.; Lai, T.; Fan, H.; Wang, W.; Zheng, H. Comparison of flooding-tolerance in four mangrove species in a diurnal tidal zone in the Beibu Gulf. Estuar. Coast. Shelf Sci. 2007, 74, 254–262. [Google Scholar] [CrossRef]
  8. Chen, L.; Wang, W. Ecophysiological Responses of Viviparous Mangrove Rhizophora stylosa Seedlings to Simulated Sea-Level Rise. J. Coast. Res. 2016, 336. [Google Scholar] [CrossRef]
  9. Chen, L.Z.; Tam, N.F.Y.; Wang, W.Q.; Zhang, Y.H.; Lin, G.H. Significant niche overlap between native and exotic Sonneratia mangrove species along a continuum of varying inundation periods. Estuar. Coast. Shelf Sci. 2013, 117, 22–28. [Google Scholar] [CrossRef]
  10. Ellison, A.M.; Farnsworth, E.J. Simulated sea level change alters anatomy, physiology, growth, and reproduction of red mangrove (Rhizophora mangle L.). Oecologia 1997, 112, 435–446. [Google Scholar] [CrossRef] [PubMed]
  11. McKee, K.L. Soil Physicochemical Patterns and Mangrove Species Distribution--Reciprocal Effects? J. Ecol. 1993, 81, 477–487. [Google Scholar] [CrossRef]
  12. Ye, Y.; Tam, N.F.Y.; Wong, Y.S.; Lu, C.Y. Growth and physiological responses of two mangrove species (Bruguiera gymnorrhiza and Kandelia candel) to waterlogging. Environ. Exp. Bot. 2003, 49, 209–221. [Google Scholar] [CrossRef]
  13. Satyanarayana, B.; Idris, I.F.; Mohamad, K.A.; Husain, M.L.; Shazili, N.A.M.; Dahdouh-Guebas, F. Mangrove species distribution and abundance in relation to local environmental settings: A case-study at Tumpat, Kelantan Delta, east coast of peninsular Malaysia. Bot. Marina 2010, 53, 79–88. [Google Scholar] [CrossRef]
  14. Knight, J.M.; Dale, P.E.R.; Dunn, R.J.K.; Broadbent, G.J.; Lemckert, C.J. Patterns of tidal flooding within a mangrove forest: Coombabah Lake, Southeast Queensland, Australia. Estuar. Coast. Shelf Sci. 2008, 76, 580–593. [Google Scholar] [CrossRef] [Green Version]
  15. Lugo, A.E.; Snedaker, S.C. The Ecology of Mangroves. Aunu. Rev. Ecol. Syst. 1974, 5, 39–64. [Google Scholar] [CrossRef]
  16. Piou, C.; Feller, I.C.; Berger, U.; Chi, F. Zonation Patterns of Belizean Offshore Mangrove Forests 41 Years After a Catastrophic Hurricane. Biotropica 2010, 38, 365–374. [Google Scholar] [CrossRef]
  17. Watson, J.G. Mangrove forests of the Malay Peninsula. Malayan For. Records 1928, 6, 1–275. [Google Scholar]
  18. Bowler, C.; Montagu, M.V.; Inze, D. Superoxide Dismutase and Stress Tolerance. Annu. Rev. Plant Physiol. Plant Mol. Biol. 1992, 43, 83–116. [Google Scholar] [CrossRef]
  19. Wang, B.S. Biological Free Radicals and Membrane Damage of Plants. Plant Physiol. Commun. 1988, 2, 12–16. [Google Scholar]
  20. Hodgson, R.A.J.; Orr, G.R.; Raison, J.K. Inhibition of photosynthesis by chilling in the light. Plant Sci. 1987, 49, 75–79. [Google Scholar] [CrossRef]
  21. Munns, R.; Tester, M. Mechanisms of salinity tolerance. Annu. Rev. Plant Biol. 2008, 59, 651–681. [Google Scholar] [CrossRef] [PubMed]
  22. Tam, N.F.Y.; Yao, M.W.Y. Concentrations of PCBs in coastal mangrove sediments of Hong Kong. Mar. Poll. Bull. 2002, 44, 642–651. [Google Scholar] [CrossRef]
  23. Rahim, A.A.; Rocca, E.; Steinmetz, J.; Kassim, M.J.; Ibrahim, M.S.; Osman, H. Antioxidant activities of mangrove Rhizophora apiculata bark extracts. Food Chem. 2008, 107, 200–207. [Google Scholar] [CrossRef]
  24. Rychter, A.M. Antioxidants and reactive oxygen species in plants. Ann. Bot. 2006, 98, 1114. [Google Scholar] [CrossRef]
  25. Noctor, G.; Foyer, C.H. A re-evaluation of the ATP:NADPH budget during C3 photosynthesis: A contribution from nitrate assimilation and its associated respiratory activity? J. Exp. Bot. 1998, 49, 1895–1908. [Google Scholar] [CrossRef]
  26. Blokhina, O.; Virolainen, E.; Fagerstedt, K.V. Antioxidants, Oxidative Damage and Oxygen Deprivation Stress: A Review. Ann. Bot. 2003, 91, 179–194. [Google Scholar] [CrossRef] [PubMed]
  27. Wang, W.; Lin, P. Study on the membrane lipid peroxidation of the leaves of Kandelia candel seedlings to long-term and short-term salinity. Acta Oceanol. Sinica, 2000. [Google Scholar]
  28. Modarresi, M.; Moradian, F.; Nematzadeh, G.A. Antioxidant responses of halophyte plant Aeluropus littoralis under long-term salinity stress. Biologia 2014, 69, 478–483. [Google Scholar] [CrossRef] [Green Version]
  29. Ben Amor, N.; Jimenez, A.; Megdiche, W.; Lundqvist, M.; Sevilla, F.C. Response of antioxidant systems to NaCl stress in the halophyte Cakile maritima. Physiol. Plant. 2010, 126, 446–457. [Google Scholar] [CrossRef]
  30. Pang, C.H.; Zhang, S.J.; Gong, Z.Z.; Wang, B.S. NaCl treatment markedly enhances H2O2 - scavenging system in leaves of halophyte Suaeda salsa. Physiol. Plant. 2010, 125, 490–499. [Google Scholar]
  31. Zhang, Z.L.; Qu, W.J. Experimental Guidance for Plant Physiology; Higher Educated Press: Beijing, China, 2003; pp. 40–45. [Google Scholar]
  32. Qi, Z. Experimental Instruction of Plant Physiology; Agricultural Press of China: Beijing, China, 2004; pp. 26–56. [Google Scholar]
  33. Giri, C.; Ochieng, E.; Tieszen, L.L.; Zhu, Z.; Singh, A.; Loveland, T.; Masek, J.; Duke, N. Status and distribution of mangrove forests of the world using earth observation satellite data. Glob. Ecol. Biogeogr. 2015, 20, 154–159. [Google Scholar] [CrossRef]
  34. Ellison, J.C. Vulnerability assessment of mangroves to climate change and sea-level rise impacts. Wetl. Ecol. Manag. 2015, 23, 115–137. [Google Scholar] [CrossRef]
  35. Yáñez-Espinosa, L.; Terrazas, T.; López-Mata, L. Effects of flooding on wood and bark anatomy of four species in a mangrove forest community. Trees 2001, 15, 91–97. [Google Scholar] [CrossRef]
  36. Youssef, T.; Saenger, P. Anatomical adaptive strategies to flooding and rhizosphere oxidation in mangrove seedlings. Aust. J. Bot. 1996, 44, 297–313. [Google Scholar] [CrossRef]
  37. Krauss, K.W.; Twilley, R.R.; Doyle, T.W.; Gardiner, E.S. Leaf gas exchange characteristics of three neotropical mangrove species in response to varying hydroperiod. Tree Physiol. 2006, 26, 959–968. [Google Scholar] [CrossRef] [Green Version]
  38. Liao, Y.; Lan, Z. The effect of salt stress on membrane protection system for roots, stems and leaves of Rhizophora stylosa seedlings. Ecol. Environ. 2007, 16, 1449–1454. [Google Scholar]
  39. Ye, Y.; Gu, Y.T.; Gao, H.Y.; Lu, C.Y. Combined effects of simulated tidal sea-level rise and salinity on seedlings of a mangrove species, Kandelia candel (L.) Druce. Hydrobiologia 2010, 641, 287–300. [Google Scholar] [CrossRef]
  40. Hoppe-Speer, S.C.L.; Adams, J.B.; Rajkaran, A.; Bailey, D. The response of the red mangrove Rhizophora mucronata Lam. to salinity and inundation in South Africa. Aquat. Bot. 2011, 95, 71–76. [Google Scholar] [CrossRef]
  41. Baowen, L. The Adaptability of Seedlings of Three Mangrove Species to Tide-Flooding and Water Salinity. Ph.D. Thesis, Chinese Academy of Forestry, Beijing, China, 2010. [Google Scholar]
  42. Meijuan, L. Studies on the Aegiceras Corniculation Seedings in Response to Simulated Tidal Flooding Stress. Ph.D. Thesis, Chinese Academy of Forestry, Beijing, China, 2012. [Google Scholar]
  43. Ball, M.C. Interactive effects of salinity and irradiance on growth: Implications for mangrove forest structure along salinity gradients. Trees 2002, 16, 126–139. [Google Scholar] [CrossRef]
  44. Burchett, M.D.; Field, C.D.; Pulkownik, A. Salinity, growth and root respiration in the grey mangrove, Avicennia marina. Physiol. Plant. 2010, 60, 113–118. [Google Scholar] [CrossRef]
  45. Liang, S.; Zhou, R.C.; Dong, S.S.; Su, H. Adaptation to salinity in mangroves: Implication on the evolution of salt-tolerance. Chin. Sci. Bull. 2008, 53, 1708–1715. [Google Scholar] [CrossRef] [Green Version]
  46. Doyle, T.W.; Krauss, K.W.; Conner, W.H.; From, A.S. Predicting the retreat and migration of tidal forests along the northern Gulf of Mexico under sea-level rise. For. Ecol. Manag. 2010, 259, 770–777. [Google Scholar] [CrossRef]
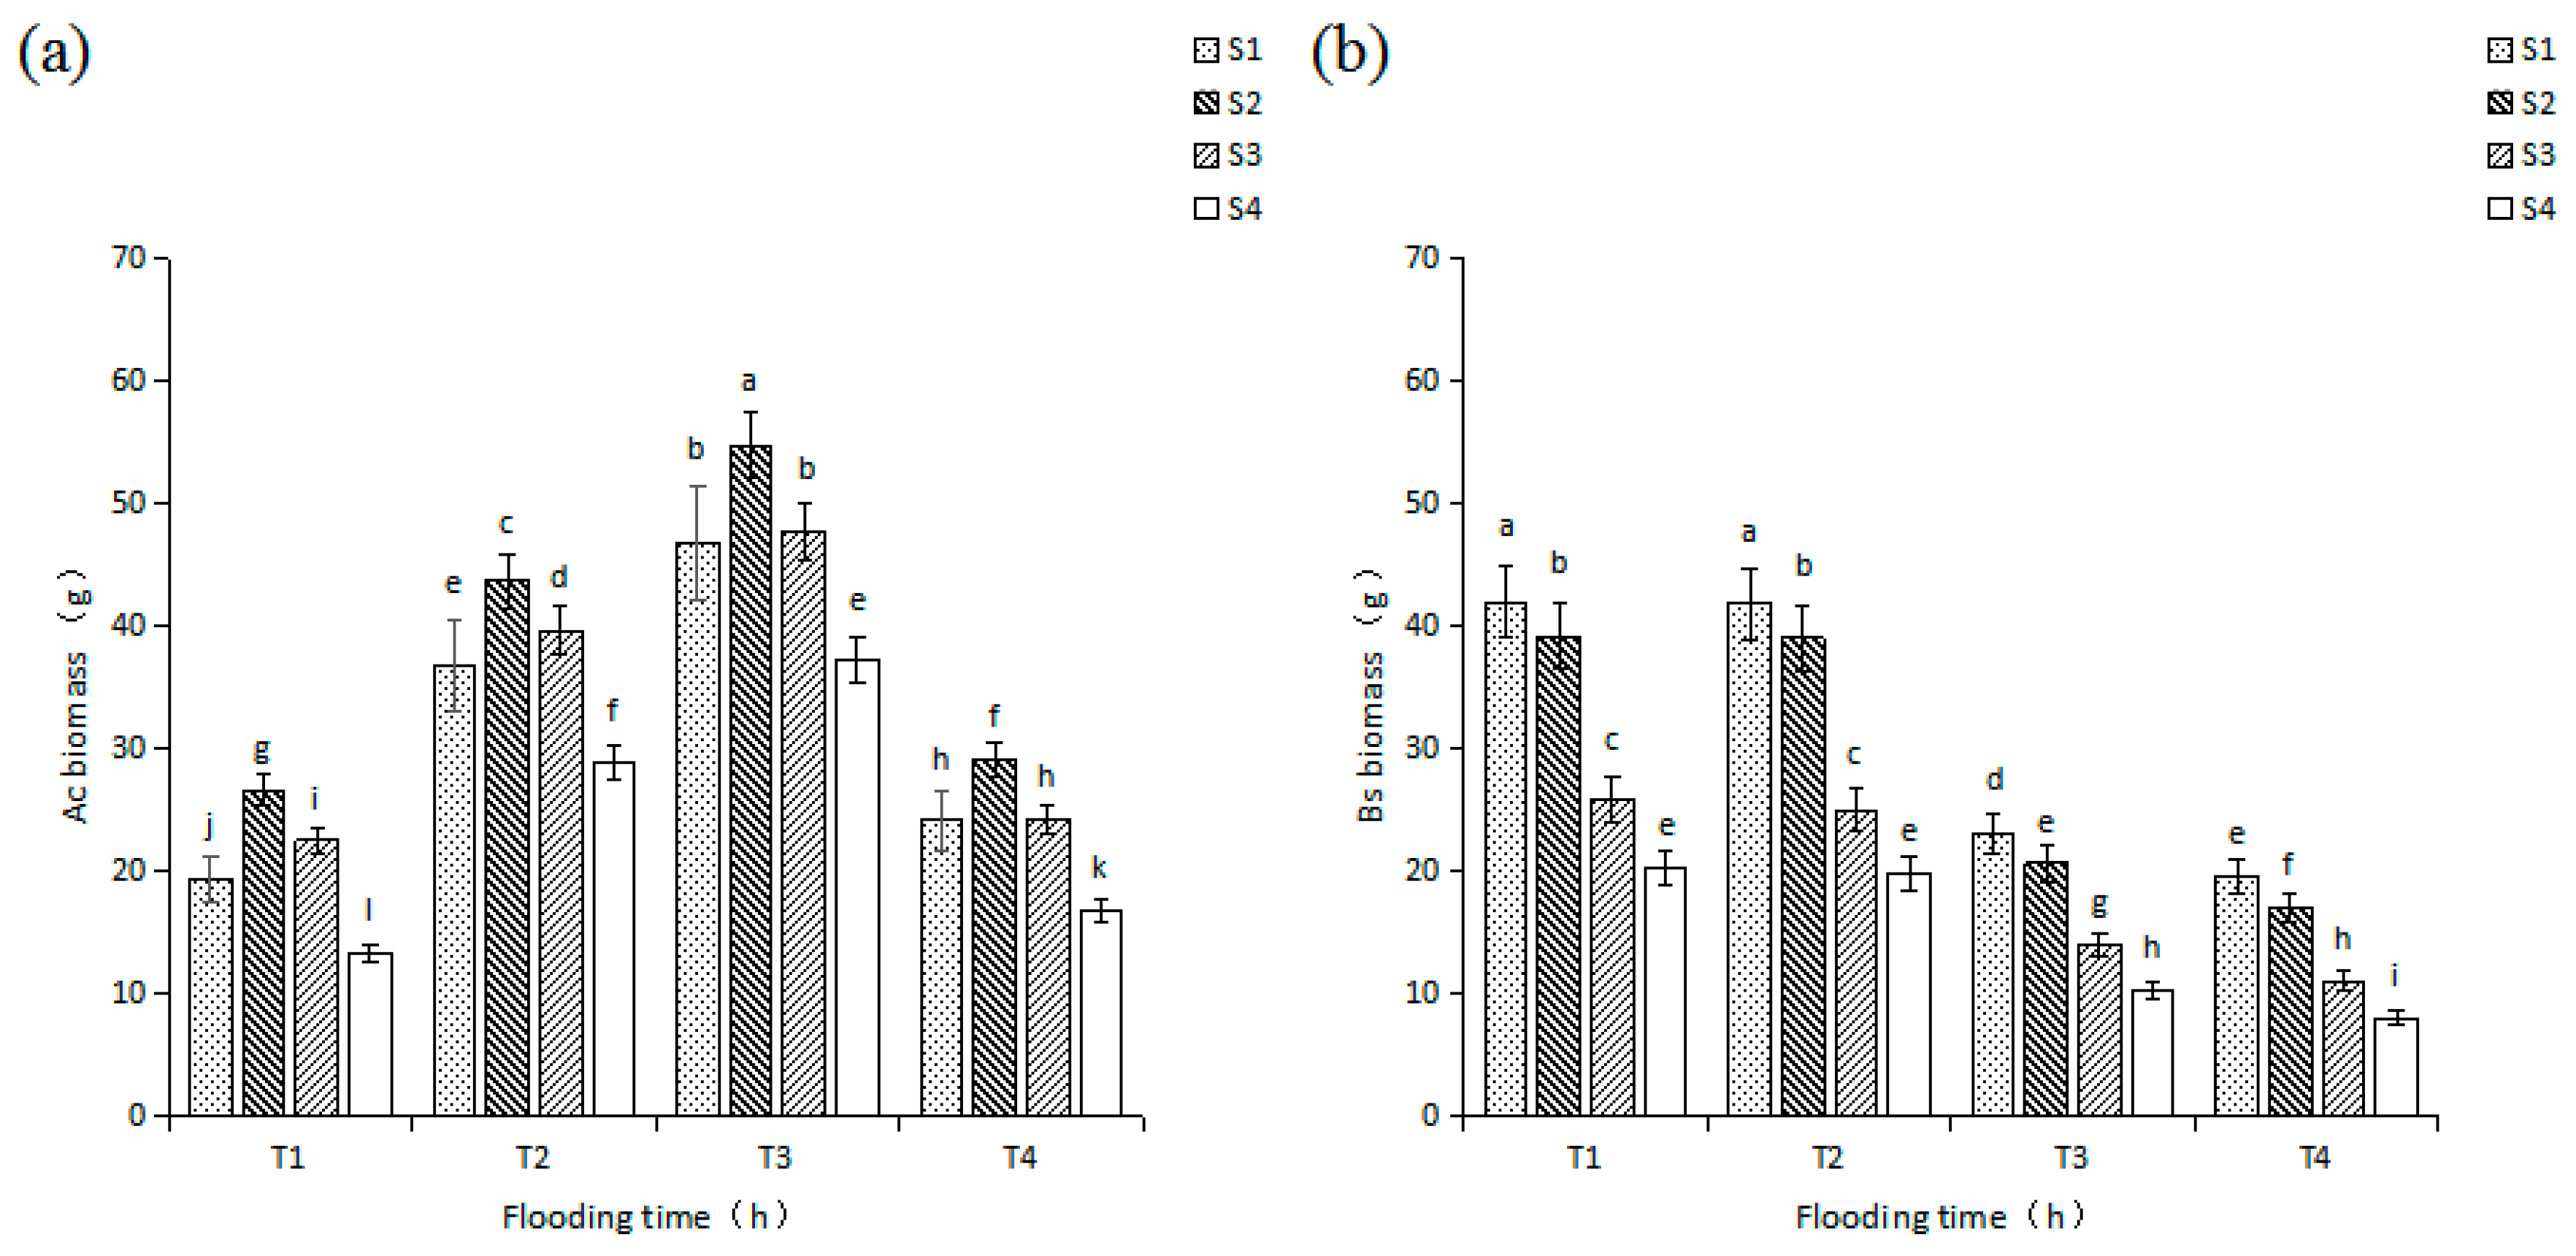
Figure 1. Effects of salinity and flooding time on the biomass of seedlings; Ac: A. corniculatum; Bs: B. sexangula; (a): The change of Ac seedlings biomass, (b): The change of Bs seedlings biomass; flooding time treatment: T1:2 h, T2: 4 h, T3:6 h, T4:8 h; salinity treatment: S1:10 ppt, S2:20 ppt, S3: 30 ppt, S4:40 ppt; the vertical bars are standard errors. Different letters indicate significant differences (p < 0.05).
Forests 10 00250 g001
Figure 2. Effects of salinity and flooding time on SOD activity in seedlings leaves; Ac: A. corniculatum; Bs: B. sexangula; (a): The change of Ac seedlings SOD activity, (b): The change of Bs seedlings SOD activity; Flooding time treatment: T1:2 h, T2: 4 h, T3:6 h, T4:8 h; Salinity treatment: S1:10 ppt, S2:20 ppt, S3: 30 ppt, S4:40 ppt; Vertical bars are the standard errors. Different letters indicate significant differences (p < 0.05).
Forests 10 00250 g002
Figure 3. The changes of CAT activity in leaves of Ac and Bs seedlings under the effect of salinity and flooding time; Ac: A. corniculatum; Bs: B. sexangula; (a): The change of Ac seedlings CAT activity, (b): The change of Bs seedlings CAT activity; Flooding time treatment: T1:2 h, T2: 4 h, T3:6 h, T4:8 h; Salinity treatment: S1:10 ppt, S2:20 ppt, S3: 30 ppt, S4:40 ppt; Vertical bars are the standard errors. Different letters indicate significant differences (p < 0.05).
Forests 10 00250 g003
Figure 4. The changes of MDA content in leaves of Ac seedling under the effect of salinity and flooding time; Ac: A. corniculatum; Bs: B. sexangula; (a): The change of Ac seedlings biomass, (b): The change of Bs seedlings biomass; Flooding time treatment: T1: 2 h, T2: 4 h, T3: 6 h, T4: 8 h; Salinity treatment: S1:10 ppt, S2:20 ppt, S3: 30 ppt, S4:40 ppt; Vertical bars are the standard errors. Different letters indicate significant differences (p < 0.05).
Forests 10 00250 g004
Table 1. The treatment details of seedlings.
TreatmentSalinity (ppt)Flooding Time (h)TreatmentSalinity (ppt)Flooding Time (h)
S1T1102S3T1306
S1T2102S3T2306
S1T3102S3T3306
S1T4102S3T4306
S2T1204S4T1408
S2T2204S4T2408
S2T3204S4T3408
S2T4204S4T5408
Table 2. Time of injection and discharge water per day.
Flooding Time (h)Injection Water TimeDischarge Water Time
2 (T1)07:00; 19:0009:00: 21:00
4 (T2)07:00; 19:0011:00; 23:00
6 (T3)07:00; 19:0013:00; 01:00
8 (T4)07:00; 19:0015:00; 03:00
Table 3. Results of Analysis of Variance tests showing the effects of salinity, flooding time, and their combined effects on seedlings’ biomass, SOD activity, CAT activity and MDA content in the leaves of A. corniculatum and B. sexangula seedlings.
SpeciesFactorIndicesdfF ValuePartial eta SquaredSig.
SBiomass3432.0990.976***
SOD37686.6180.999***
CAT3437.3850.976***
MDA32853.1140.996***
AcTBiomass31784.2570.994***
SOD32330.5020.995***
CAT3515.1130.98***
MDA32582.5680.996***
S*TBiomass93.8240.518***
SOD9227.1490.985***
CAT919.4960.846***
MDA9158.5780.978***
SBiomass3779.3860.986***
SOD3846.4070.988***
CAT34091.5130.997***
MDA37272.1510.999***
BsTBiomass31063.3820.99***
SOD3599.5980.983***
CAT34063.5030.997***
MDA34639.6920.998***
S*TBiomass925.0340.876***
SOD9139.9750.975***
CAT9152.4870.977***
MDA9452.4770.992***
S: Salinity, T: Flooding time, S*T: the synergy effects of salinity and flooding time, p < 0.05:** p < 0.01:***, Ac: Aegiceras corniculatum, s: Bruguiera sexangula.