Effects of Experimental Nitrogen Addition on Nutrients and Nonstructural Carbohydrates of Dominant Understory Plants in a Chinese Fir Plantation

 ,
, 
Abstract
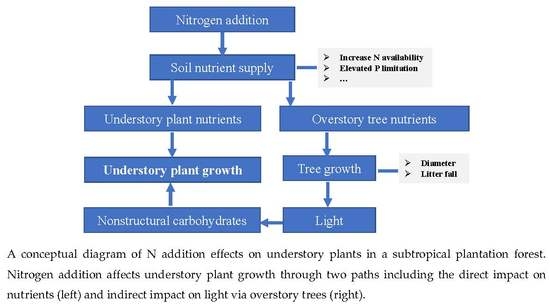
1. Introduction
2. Materials and Methods
2.1. Study Region
2.2. Experimental Treatments and Sample Collection
2.3. Soil Nutrient and Enzyme Measurement
2.4. Understory Plant Nutrient Measurement
2.5. Overstory Tree Growth and Litterfall Production Measurement
2.6. Data Analysis
3. Results
3.1. Plant Growth and Soil Nutrients
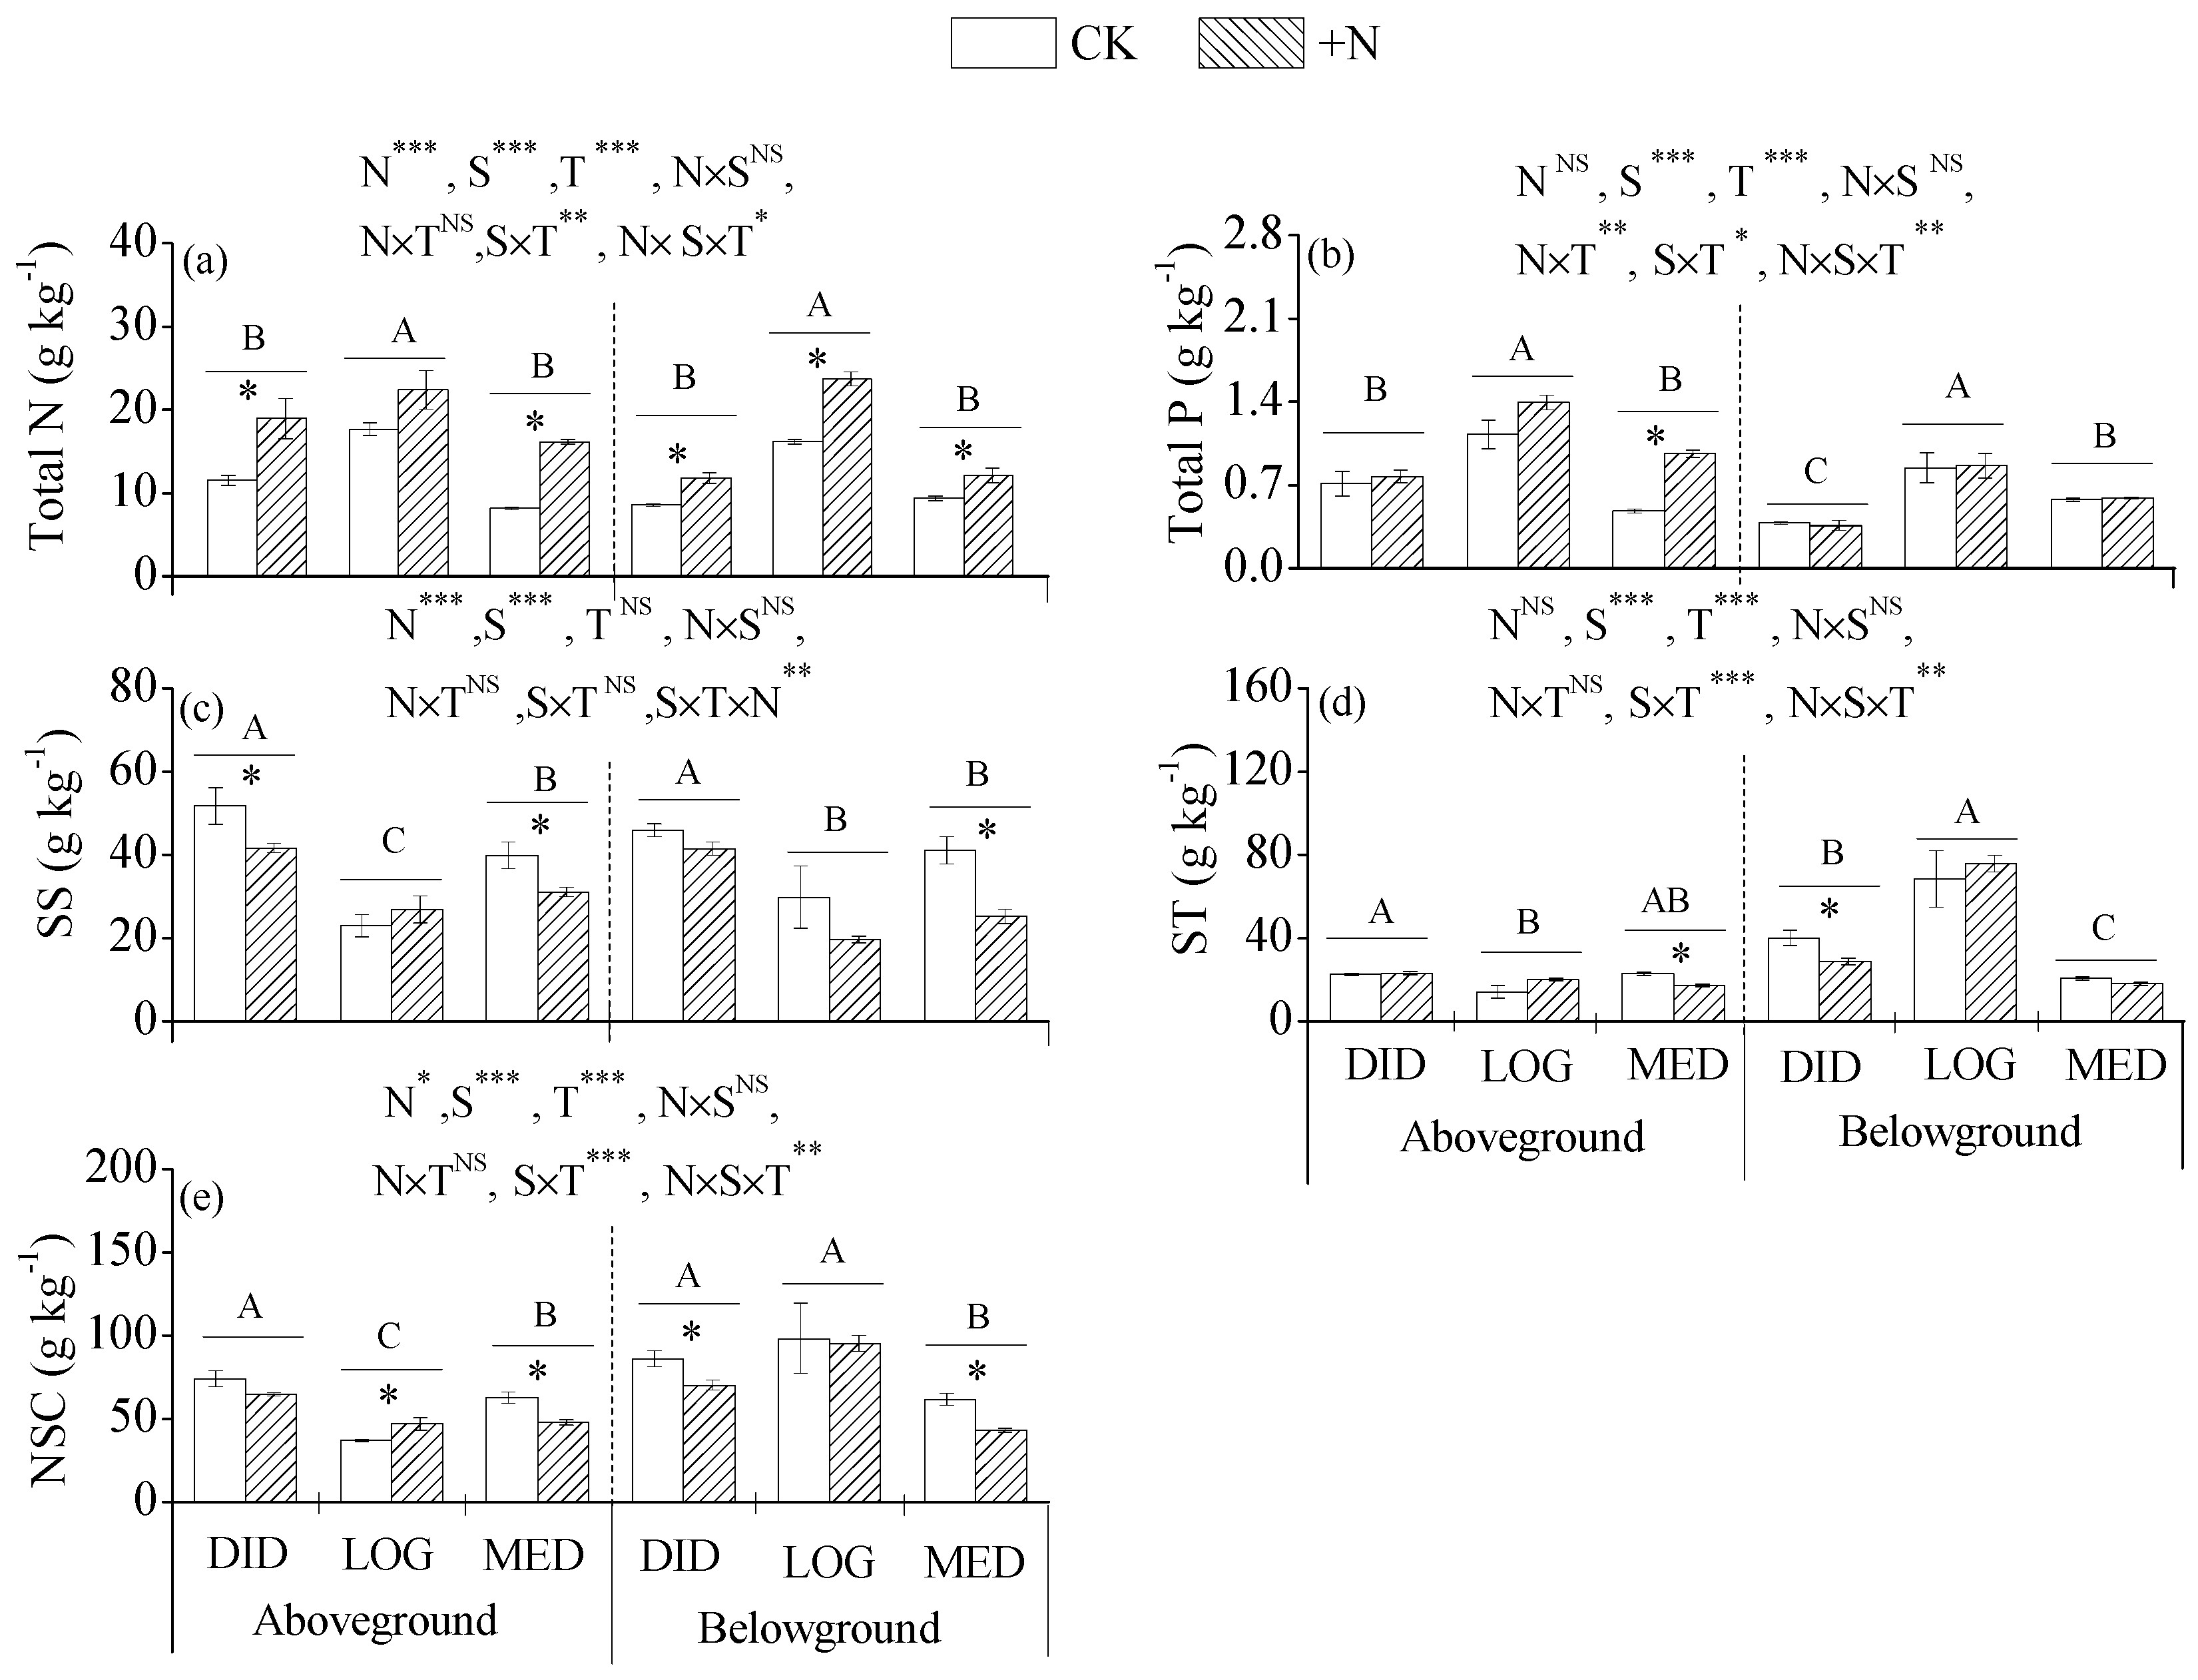
3.2. Nutrients and NSCs in Plant Tissues
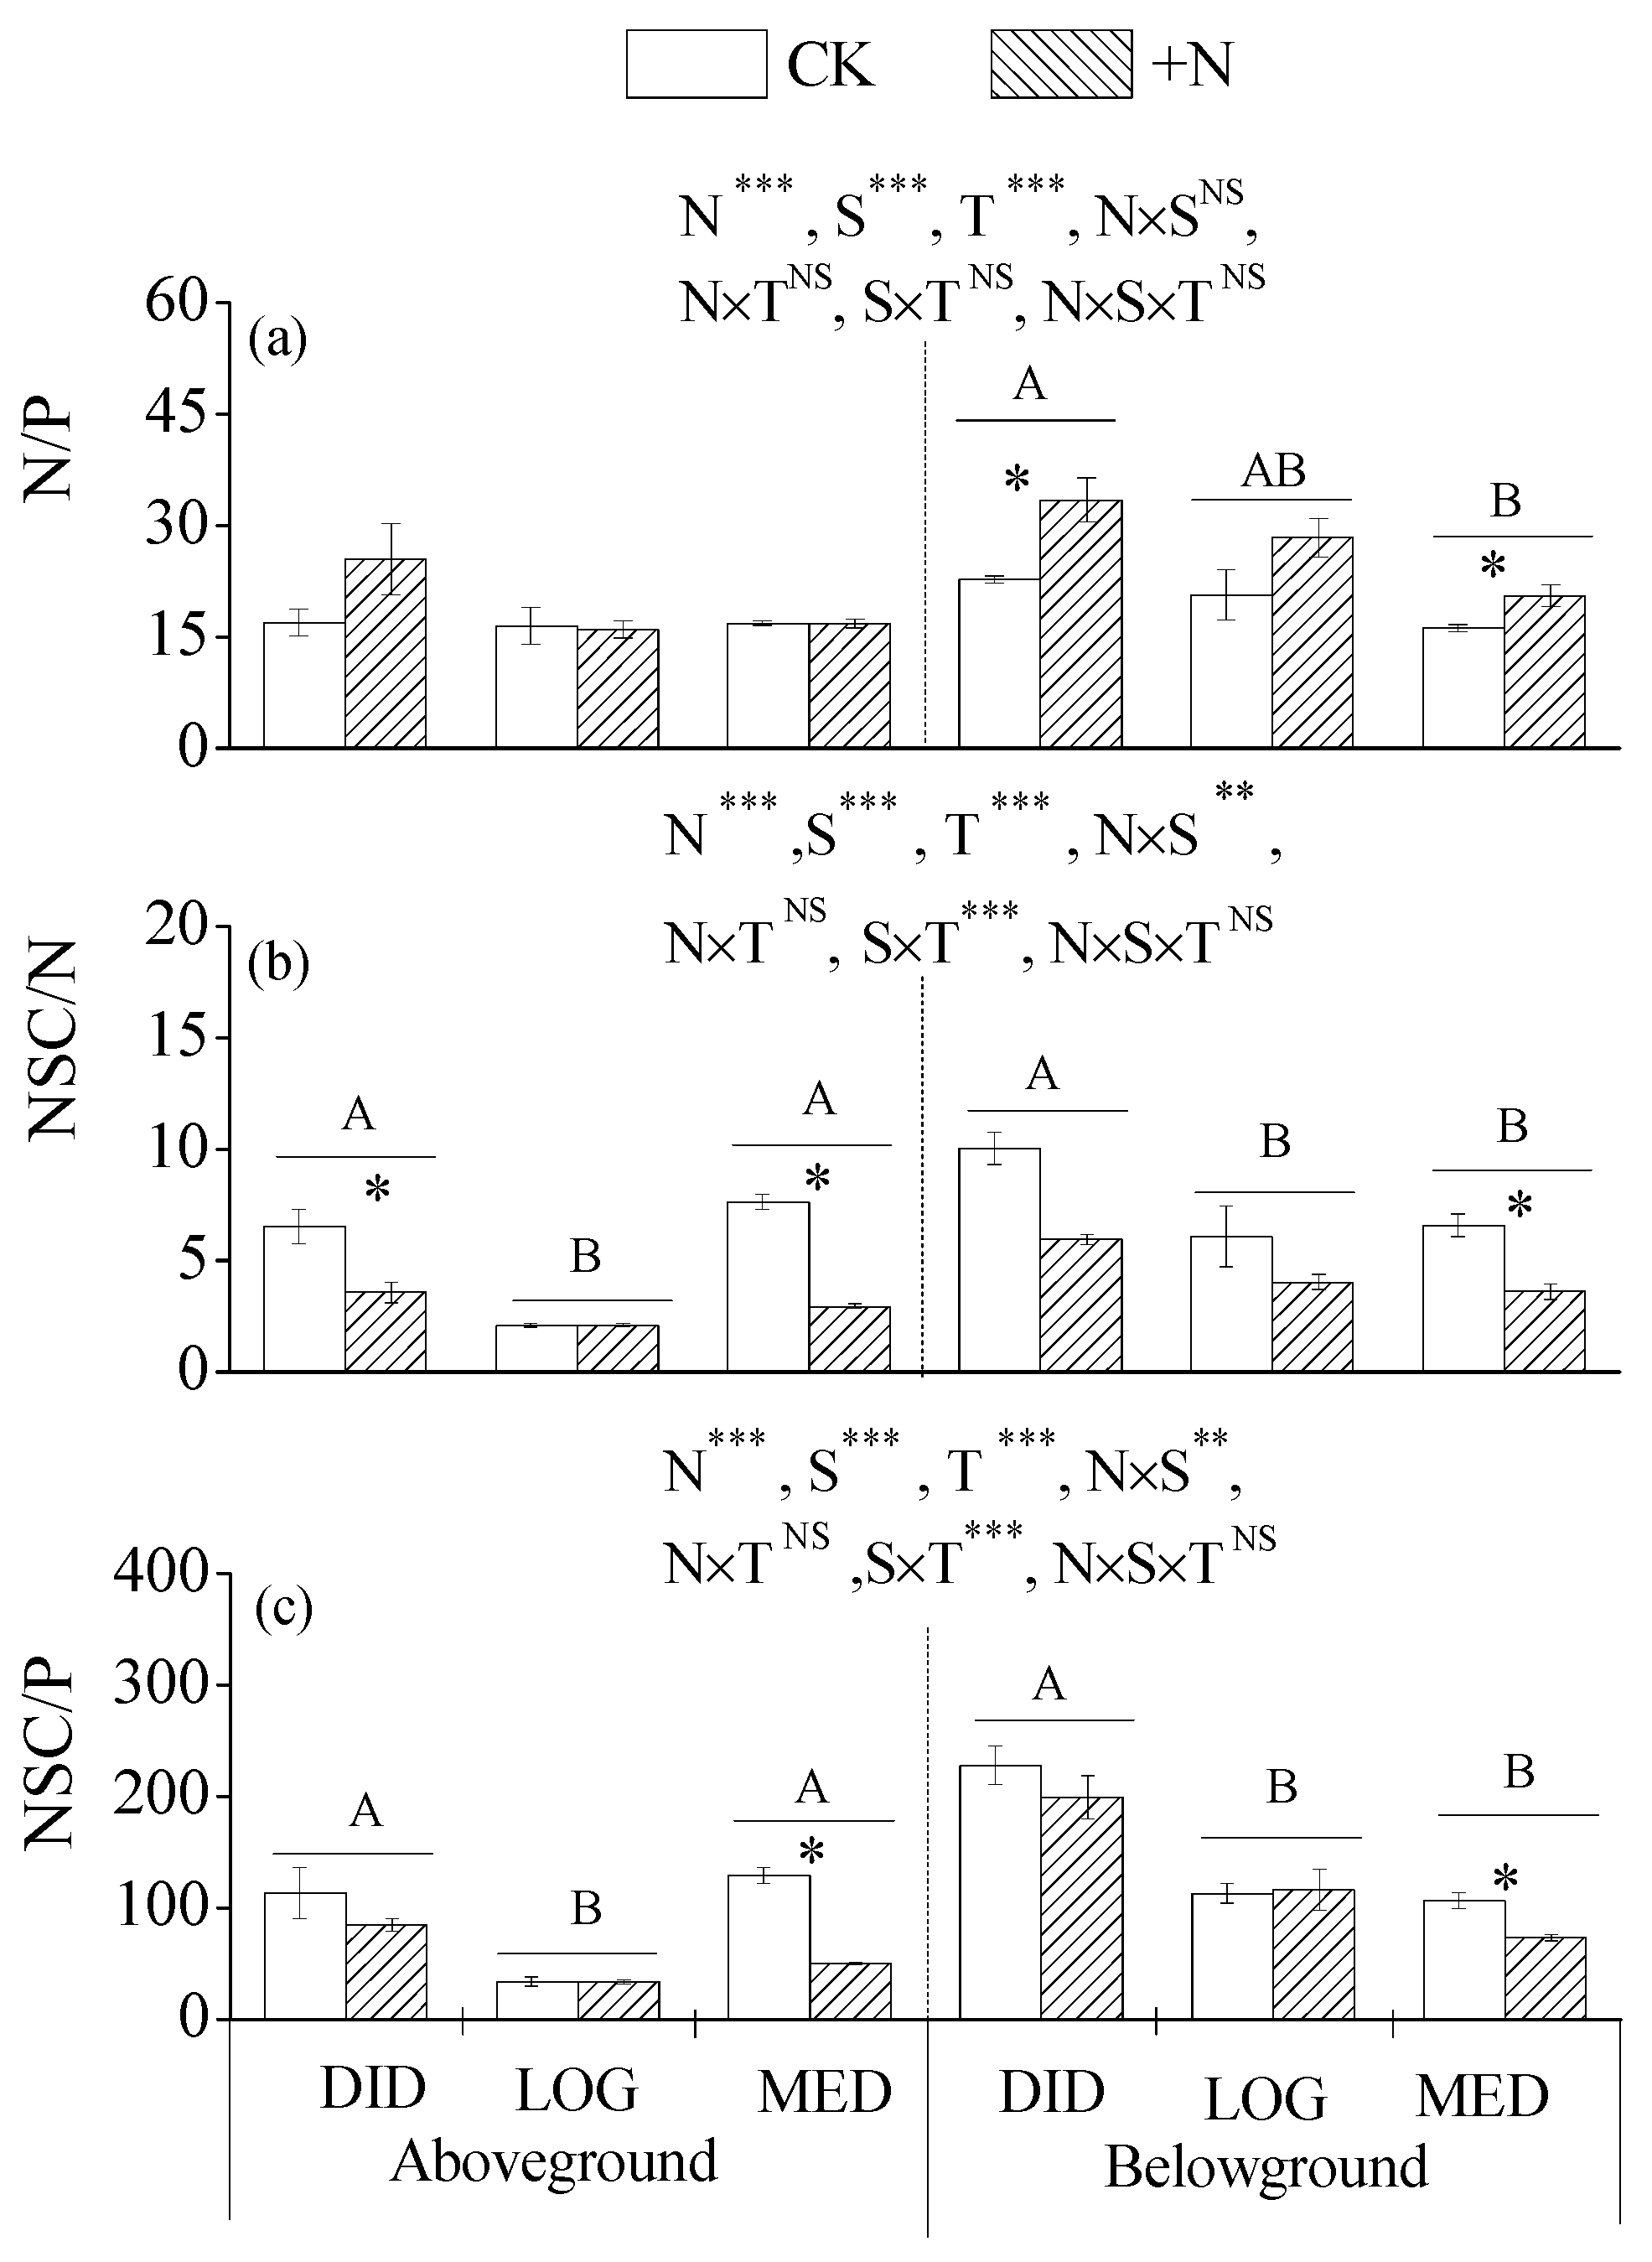
3.3. The Ratios of N, P, and NSCs in Plant Tissues
3.4. Linkages between Plant Tissue Acquirement and Rhizosphere Soil Supply
4. Discussion
4.1. Links between Plant Tissue Acquirement and Rhizosphere Soil Supply
4.2. Effects of N Addition on Understory Plant Growth and NSC Allocation
5. Conclusions
Author Contributions
Funding
Acknowledgments
Conflicts of Interest
Appendix A

| Variables | Control | Nitrogen Addition | T-test |
|---|---|---|---|
| Soil | |||
| Bulk density (g cm−3) | 1.22 ± 0.03 | 1.25 ± 0.03 | ns |
| pH | 4.43 ± 0.04 | 4.40 ± 0.08 | ns |
| Organic carbon (g kg−1) | 21.20 ± 2.2 | 22.41 ± 1.62 | ns |
| Total nitrogen (g kg−1) | 1.29 ± 0.13 | 1.26 ± 0.09 | ns |
| Total phosphorus (g kg−1) | 0.29 ± 0.02 | 0.31 ± 0.03 | ns |
| Stand | |||
| Density (ha−1) | 2250 ± 45 | 2150 ± 62 | ns |
| Average DBH (cm) | 12.2 ± 0.2 | 11.9 ± 0.3 | ns |
| Average height (m) | 8.5 ± 0.2 | 8.7 ± 0.2 | ns |
| Variables | Control | Nitrogen Addition | T-test |
|---|---|---|---|
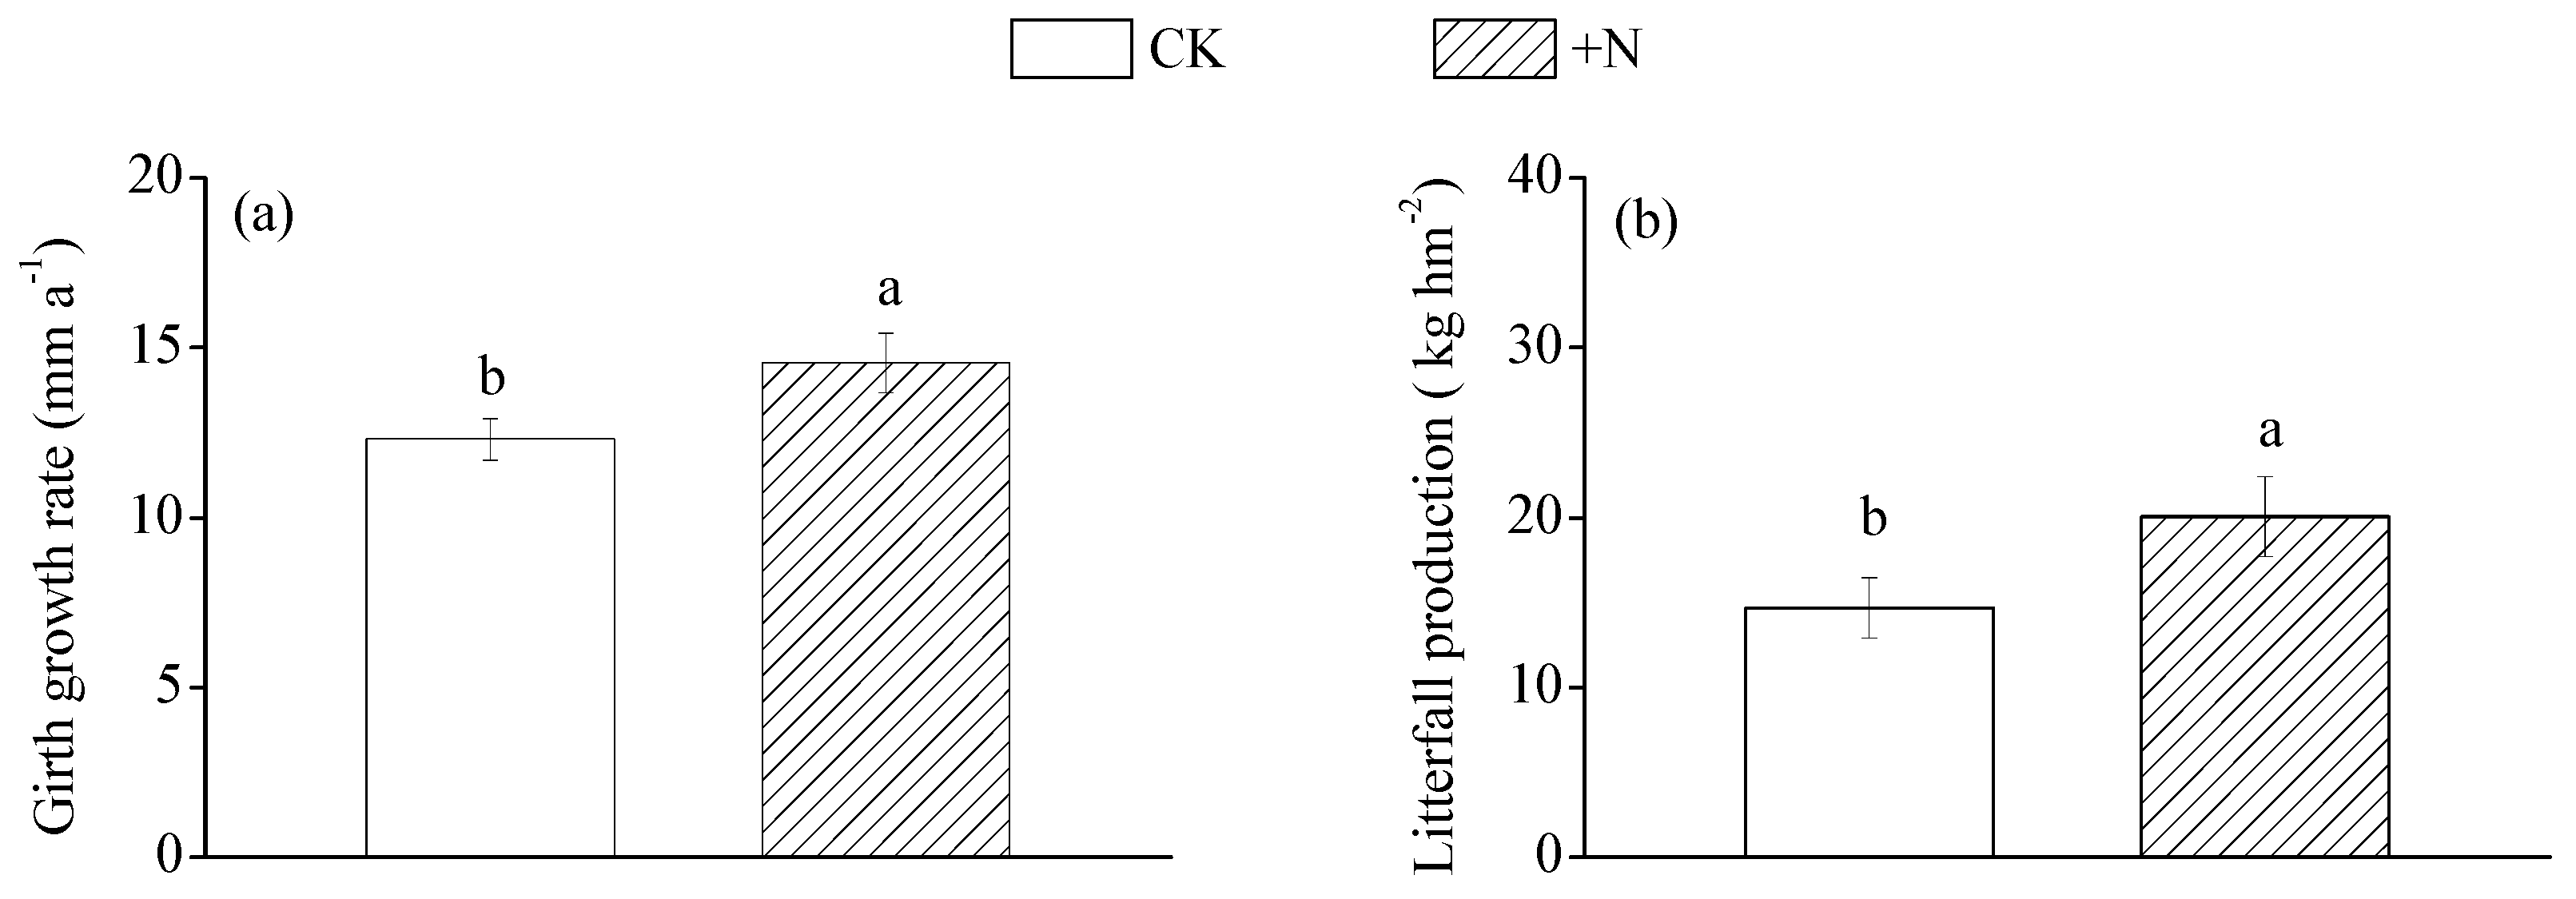
| Girth growth rate | |||
| 1-year (mm year−1) | 10.89 ± 0.69 | 13.69 ± 1.14 | p < 0.05 |
| 2-year (mm year−1) | 15.13 ± 0.70 | 18.64 ± 1.18 | p < 0.05 |
| 3-year (mm year−1) | 9.50 ± 0.57 | 10.66 ± 0.60 | ns |
| 4-year (mm year−1) | 13.72 ± 1.15 | 15.23 ± 1.14 | ns |
| Average (mm year−1) | 12.31 ± 0.61 | 14.56 ± 0.88 | p < 0.05 |

References
- Galloway, J.N.; Townsend, A.R.; Erisman, J.W.; Bekunda, M.; Cai, Z.; Freney, J.R.; Sutton, M.A. Transformation of the nitrogen cycle, recent trends, questions, and potential solutions. Science 2008, 320, 889–892. [Google Scholar] [CrossRef] [PubMed]
- Liu, X.; Zhang, Y.; Han, W.; Tang, A.; Shen, J.; Cui, Z.; Fangmeier, A. Enhanced nitrogen deposition over China. Nature 2013, 494, 459–462. [Google Scholar] [CrossRef] [PubMed]
- Chen, F.S.; Niklas, K.J.; Liu, Y.; Fang, X.M.; Wan, S.Z.; Wang, H. Nitrogen and phosphorus additions alter nutrient dynamics but not resorption efficiencies of Chinese fir leaves and twigs differing in age. Tree Physiol. 2015, 35, 1106–1117. [Google Scholar] [CrossRef] [PubMed]
- Lu, X.; Mao, Q.; Gilliam, F.S.; Luo, Y.; Mo, J. Nitrogen deposition contributes to soil acidification in tropical ecosystems. Glob. Chang. Biol. 2014, 20, 3790–3801. [Google Scholar] [CrossRef] [PubMed]
- Wang, M.; Zhang, W.W.; Li, N.; Liu, Y.Y.; Zheng, X.B.; Hao, G.Y. Photosynthesis and growth responses of Fraxinus mandshurica Rupr. seedlings to a gradient of simulated nitrogen deposition. Ann. For. Sci. 2018, 75, 1. [Google Scholar] [CrossRef]
- Kumar, P.; Chen, H.Y.; Thomas, S.C.; Shahi, C. Linking resource availability and heterogeneity to understory species diversity through succession in boreal forest of Canada. J. Ecol. 2018, 106, 1266–1276. [Google Scholar] [CrossRef]
- Bobbink, R.; Hicks, K.; Galloway, J.; Spranger, T.; Alkemade, R.; Ashmore, M.; Emmett, B. Global assessment of nitrogen deposition effects on terrestrial plant diversity: A synthesis. Ecol. Appl. 2010, 20, 30–59. [Google Scholar] [CrossRef]
- Gilliam, F.S.; Hockenberry, A.W.; Adams, M.B. Effects of atmospheric nitrogen deposition on the herbaceous layer of a central Appalachian hardwood forest. J. Torry. Bot. Soc. 2006, 133, 240–254. [Google Scholar] [CrossRef]
- Lu, X.; Mo, J.; Gilliam, F.S.; Zhou, G.; Fang, Y. Effects of experimental nitrogen additions on plant diversity in an old-growth tropical forest. Glob. Chang. Biol. 2010, 16, 2688–2700. [Google Scholar] [CrossRef]
- Gilliam, F.S. Response of the herbaceous layer of forest ecosystems to excess nitrogen deposition. J. Ecol. 2006, 94, 1176–1191. [Google Scholar] [CrossRef]
- Hurd, T.M.; Brach, A.R.; Raynal, D.J. Response of understory vegetation of Adirondack forests to nitrogen additions. Can. J. For. Res. 1998, 28, 799–807. [Google Scholar] [CrossRef]
- Strengbom, J.; Näsholm, T.; Ericson, L. Light, not nitrogen, limits growth of the grass Deschampsia flexuosa in boreal forests. Can. J. Bot. 2004, 82, 430–435. [Google Scholar] [CrossRef]
- Kou, L.; Chen, W.; Jiang, L.; Dai, X.; Fu, X.; Wang, H.; Li, S. Simulated nitrogen deposition affects stoichiometry of multiple elements in resource-acquiring plant organs in a seasonally dry subtropical forest. Sci. Total. Environ. 2018, 624, 611–620. [Google Scholar] [CrossRef] [PubMed]
- Mao, Q.; Lu, X.; Mo, H.; Gundersen, P.; Mo, J. Effects of simulated N deposition on foliar nutrient status, N metabolism and photosynthetic capacity of three dominant understory plant species in a mature tropical forest. Sci. Total. Environ. 2018, 610, 555–562. [Google Scholar] [CrossRef] [PubMed]
- Elser, J.J.; Bracken, M.E.; Cleland, E.E.; Gruner, D.S.; Harpole, W.S.; Hillebrand, H.; Smith, J.E. Global analysis of nitrogen and phosphorus limitation of primary producers in freshwater, marine and terrestrial ecosystems. Ecol. Lett. 2007, 10, 1135–1142. [Google Scholar] [CrossRef] [PubMed]
- Ibrahim, M.H.; Jaafar, H.Z.; Rahmat, A.; Rahman, Z.A. The relationship between phenolics and flavonoids production with total non-structural carbohydrate and photosynthetic rate in Labisia pumila Benth. under high CO2 and nitrogen fertilization. Molecules 2011, 16, 162–174. [Google Scholar] [CrossRef] [PubMed]
- Xiao, L.; Liu, G.; Li, P.; Xue, S. Nitrogen addition has a stronger effect on stoichiometries of non-structural carbohydrates, nitrogen and phosphorus in Bothriochloa ischaemum than elevated CO2. Plant Growth Regul. 2017, 83, 325–334. [Google Scholar] [CrossRef]
- Lü, X.T.; Reed, S.; Yu, Q.; He, N.P.; Wang, Z.W.; Han, X.G. Convergent responses of nitrogen and phosphorus resorption to nitrogen inputs in a semiarid grassland. Glob. Chang. Biol. 2013, 19, 2775–2784. [Google Scholar] [CrossRef]
- Knox, K.J.E.; Clarke, P.J. Nutrient availability induces contrasting allocation and starch formation in resprouting and obligate seeding shrubs. Funct. Ecol. 2005, 19, 690–698. [Google Scholar] [CrossRef]
- Xiong, Y.; Xu, X.; Zeng, H.; Wang, H.; Chen, F.; Guo, D. Low Nitrogen Retention in Soil and Litter under Conditions without Plants in a Subtropical Pine Plantation. Forests 2015, 6, 2387–2404. [Google Scholar] [CrossRef]
- Kou, L.; Zhang, X.; Wang, H.; Yang, H.; Zhao, W.; Li, S. Nitrogen additions inhibit nitrification in acidic soils in a subtropical pine plantation: Effects of soil pH and compositional shifts in microbial groups. J. For. Res. 2017, 29, 1–10. [Google Scholar] [CrossRef]
- Lü, C.; Tian, H. Spatial and temporal patterns of nitrogen deposition in China: Synthesis of observational data. J. Geophys. Res. Atmos. 2007, 112, 10–15. [Google Scholar] [CrossRef]
- Hu, X.F.; Chen, F.S.; Wine, M.L.; Fang, X.M. Increasing acidity of rain in subtropical tea plantation alters aluminum and nutrient distributions at the root-soil interface and in plant tissues. Plant Soil 2017, 417, 261–274. [Google Scholar] [CrossRef]
- Woodruff, D.R.; Meinzer, F.C. Water stress, shoot growth and storage of non-structural carbohydrates along a tree height gradient in a tall conifer. Plant Cell Environ. 2011, 34, 1920–1930. [Google Scholar] [CrossRef] [PubMed]
- Allen, S.E. Chemical Analysis of Ecological Materials; Blackwell Scientific Publications: Oxford, UK, 1989. [Google Scholar]
- Dong, W.Y.; Zhang, X.Y.; Liu, X.Y.; Fu, X.L.; Chen, F.S.; Wang, H.M.; Wen, X.F. Responses of soil microbial communities and enzyme activities to nitrogen and phosphorus additions in Chinese fir plantations of subtropical China. Biogeosciences 2015, 12, 5537–5546. [Google Scholar] [CrossRef]
- Dubois, M.; Gilles, K.A.; Hamilton, J.K.; Rebers, P.T.; Smith, F. Colorimetric method for determination of sugars and related substances. Anal. Chem. 1956, 28, 350–356. [Google Scholar] [CrossRef]
- Liu, J.F.; Arend, M.; Yang, W.J.; Schaub, M.; Ni, Y.Y.; Gessler, A.; Li, M.H. Effects of drought on leaf carbon source and growth of European beech are modulated by soil type. Sci. Rep. 2017, 7, 42462. [Google Scholar] [CrossRef]
- Song, X.; Peng, C.; Zhou, G.; Gu, H.; Li, Q.; Zhang, C. Dynamic allocation and transfer of non-structural carbohydrates, a possible mechanism for the explosive growth of Moso bamboo (Phyllostachys heterocycla). Sci. Rep. 2016, 6, 25908. [Google Scholar] [CrossRef] [PubMed]
- Zhu, B.; Panke-Buisse, K.; Kao-Kniffin, J. Nitrogen fertilization has minimal influence on rhizosphere effects of smooth crabgrass (Digitaria ischaemum) and bermudagrass (Cynodon dactylon). J. Plant Ecol. 2014, 8, 390–400. [Google Scholar] [CrossRef]
- Mao, Q.; Lu, X.; Wang, C.; Zhou, K.; Mo, J. Responses of understory plant physiological traits to a decade of nitrogen addition in a tropical reforested ecosystem. For. Ecol. Manag. 2017, 401, 65–74. [Google Scholar] [CrossRef]
- Nordin, A.; Näsholm, T.; Ericson, L. Effects of simulated N deposition on understorey vegetation of a boreal coniferous forest. Funct. Ecol. 1998, 12, 691–699. [Google Scholar] [CrossRef]
- Talhelm, A.F.; Pregitzer, K.S.; Burton, A.J. No evidence that chronic nitrogen additions increase photosynthesis in mature sugar maple forests. Ecol. Appl. 2011, 21, 2413–2424. [Google Scholar] [CrossRef] [PubMed]
- Gurmesa, G.A.; Lu, X.; Gundersen, P.; Mao, Q.; Zhou, K.; Fang, Y.; Mo, J. High retention of 15N-labeled nitrogen deposition in a nitrogen saturated old-growth tropical forest. Glob. Chang. Bio. 2016, 22, 3608–3620. [Google Scholar] [CrossRef] [PubMed]
- Jia, Y.; Yu, G.; He, N.; Zhan, X.; Fang, H.; Sheng, W.; Wang, Q. Spatial and decadal variations in inorganic nitrogen wet deposition in China induced by human activity. Sci. Rep. 2014, 4, 3763. [Google Scholar] [CrossRef] [PubMed]
- Ma, Z.; Zhang, X.; Zhang, C.; Wang, H.; Chen, F.; Fu, X.; Lei, Q. Accumulation of residual soil microbial carbon in Chinese fir plantation soils after nitrogen and phosphorus additions. J. For. Res. 2018, 29, 953–962. [Google Scholar] [CrossRef]
- Tang, Y.; Zhang, X.; Li, D.; Wang, H.; Chen, F.; Fu, X.; Yu, G. Impacts of nitrogen and phosphorus additions on the abundance and community structure of ammonia oxidizers and denitrifying bacteria in Chinese fir plantations. Soil. Biol. Biochem. 2016, 103, 284–293. [Google Scholar] [CrossRef]
- Jones, A.G.; Power, S.A. Field-scale evaluation of effects of nitrogen deposition on the functioning of heathland ecosystems. J. Ecol. 2012, 100, 331–342. [Google Scholar] [CrossRef]
- Kou, L.; Jiang, L.; Fu, X.; Dai, X.; Wang, H.; Li, S. Nitrogen deposition increases root production and turnover but slows root decomposition in Pinus elliottii plantations. New. Phytol. 2018, 218, 1450–1461. [Google Scholar] [CrossRef] [PubMed]
- Yang, H. Effects of nitrogen and phosphorus addition on leaf nutrient characteristics in a subtropical forest. Trees 2018, 32, 383–391. [Google Scholar] [CrossRef]
- Nakaji, T.; Fukami, M.; Dokiya, Y.; Izuta, T. Effects of high nitrogen load on growth, photosynthesis and nutrient status of Cryptomeria japonica and Pinus densiflora seedlings. Trees 2001, 15, 453–461. [Google Scholar]
- Schulze, E.D. Air pollution and forest decline in a spruce (Picea abies) forest. Science 1989, 244, 776–783. [Google Scholar] [CrossRef] [PubMed]
- Li, L.; McCormack, M.L.; Chen, F.; Wang, H.; Ma, Z.; Guo, D. Different responses of absorptive roots and arbuscular mycorrhizal fungi to fertilization provide diverse nutrient acquisition strategies in Chinese fir. For. Ecol. Manag 2019, 433, 64–72. [Google Scholar] [CrossRef]
- Güsewell, S. N: P ratios in terrestrial plants: Variation and functional significance. New Phytol. 2004, 164, 243–266. [Google Scholar] [CrossRef]
- Kang, H.; Xin, Z.; Berg, B.; Burgess, P.J.; Liu, Q.; Liu, Z.; Liu, C. Global pattern of leaf litter nitrogen and phosphorus in woody plants. Ann. For. Sci. 2010, 67, 811. [Google Scholar] [CrossRef]
- Li, Y.; Niu, S.; Yu, G. Aggravated phosphorus limitation on biomass production under increasing nitrogen loading: A meta-analysis. Glob. Chang. Biol. 2016, 22, 934–943. [Google Scholar] [CrossRef] [PubMed]
- Yuan, Z.Y.; Chen, H.Y. Decoupling of nitrogen and phosphorus in terrestrial plants associated with global changes. Nat. Clim. Chang. 2015, 5, 465. [Google Scholar] [CrossRef]
- Yue, K.; Fornara, D.A.; Yang, W.; Peng, Y.; Li, Z.; Wu, F.; Peng, C. Effects of three global change drivers on terrestrial C: N: P stoichiometry: A global synthesis. Glob. Chang. Biol. 2017, 23, 2450–2463. [Google Scholar] [CrossRef]
- Ai, Z.M.; Xue, S.; Wang, G.L.; Liu, G.B. Responses of non-structural carbohydrates and C: N: P Stoichiometry of Bothriochloa ischaemum to nitrogen addition on the Loess Plateau, China. J. Plant Growth Regul. 2017, 36, 714–722. [Google Scholar] [CrossRef]
- Ai, Z.; He, L.; Xin, Q.; Yang, T.; Liu, G.; Xue, S. Slope aspect affects the non-structural carbohydrates and C: N: P stoichiometry of Artemisia sacrorum on the Loess Plateau in China. Catena 2017, 152, 9–17. [Google Scholar] [CrossRef]
- Hedwall, P.O.; Nordin, A.; Brunet, J.; Bergh, J. Compositional changes of forest-floor vegetation in young stands of Norway spruce as an effect of repeated fertilisation. For. Ecol. Manag. 2010, 259, 2418–2425. [Google Scholar] [CrossRef]
- Hedwall, P.O.; Strengbom, J.; Nordin, A. Can thinning alleviate negative effects of fertilization on boreal forest floor vegetation? For. Ecol. Manag. 2013, 310, 382–392. [Google Scholar] [CrossRef]
- Li, M.H.; Xiao, W.F.; Wang, S.G.; Cheng, G.W.; Cherubini, P.; Cai, X.H.; Zhu, W.Z. Mobile carbohydrates in Himalayan treeline trees I. Evidence for carbon gain limitation but not for growth limitation. Tree Physiol. 2008, 28, 1287–1296. [Google Scholar] [CrossRef] [PubMed]
- Dicranopteris dichotoma. Available online: http://frps.eflora.cn/frps/Dicranopteris%20dichotoma (accessed on 12 September 2018).
- Lophatherum gracile. Available online: http://frps.eflora.cn/frps/Lophatherum%20gracile (accessed on 12 September 2018).
- Melastoma dodecandrum. Available online: http://frps.eflora.cn/frps/Melastoma%20dodecandrum (accessed on 12 September 2018).


| Variables | Control | Nitrogen Addition | T-test |
|---|---|---|---|
| Dicranopteris dichotoma | |||
| Biomass (kg ha−1) | 652.51 ± 83.71 | 117.37 ± 38.49 | p < 0.05 |
| Richness | 4.00 ± 1.01 | 2.25 ± 0.63 | ns |
| Lophatherum gracile | |||
| Biomass (kg ha−1) | 205.73 ± 16.15 | 67.84 ± 33.96 | p < 0.05 |
| Richness | 7.67 ± 1.15 | 4.00 ± 2.45 | ns |
| Melastoma dodecandrum | |||
| Biomass (kg ha−1) | 34.33 ± 16.40 | 14.80 ± 8.22 | ns |
| Richness | 3.57 ± 0.81 | 3.67 ± 1.20 | ns |
| Variables | Control | Nitrogen Addition | T-test |
|---|---|---|---|
| Rhizosphere Soil | |||
| Dicranopteris dichotoma | |||
| NH4+-N (mg kg−1) | 16.03 ± 0.52 | 34.22 ± 0.89 | p < 0.05 |
| NO3−-N (mg kg−1) | 1.68 ± 0.11 | 2.93 ± 0.35 | p < 0.05 |
| Available P (mg kg−1) | 3.81 ± 0.19 | 3.57 ± 0.57 | ns |
| NAG activity (mmol g−1 h−1) | 30.5 ± 8.47 | 14.3 ± 3.45 | ns |
| AP activity (mmol g−1 h−1) | 358.3 ± 57.33 | 419.8 ± 39.29 | ns |
| Lophatherum gracile | |||
| NH4+-N (mg kg−1) | 9.95 ± 0.66 | 19.56 ± 0.23 | p < 0.05 |
| NO3−-N (mg kg−1) | 1.85 ± 0.31 | 3.04 ± 0.85 | ns |
| Available P (mg kg−1) | 3.82 ± 0.36 | 3.40 ± 0.15 | ns |
| NAG activity (mmol g−1 h−1) | 3 ± 2.38 | 20.8 ± 5.15 | p < 0.05 |
| AP activity (mmol g−1 h−1) | 231.5 ± 52.34 | 303.5 ± 32.75 | ns |
| Melastoma dodecandrum | |||
| NH4+-N (mg kg−1) | 7.83 ± 0.71 | 12.49 ± 0.74 | p < 0.05 |
| NO3−-N (mg kg−1) | 1.16 ± 0.06 | 2.21 ± 0.37 | p < 0.05 |
| Available P (mg kg−1) | 3.02 ± 0.42 | 3.77 ± 0.27 | ns |
| NAG activity (mmol g−1 h−1) | 22.5 ± 4.575 | 28.5 ± 7.89 | ns |
| AP activity (mmol g−1 h−1) | 272 ± 15.44 | 356.3 ± 56.79 | ns |
| Bulk Soil | |||
| Dicranopteris dichotoma | |||
| NH4+-N (mg kg−1) | 12.68 ± 3.09 | 31.99 ± 0.76 | p < 0.05 |
| NO3−-N (mg kg−1) | 1.55 ± 0.17 | 2.74 ± 0.84 | ns |
| Available P (mg kg−1) | 3.16 ± 0.14 | 3.46 ± 0.36 | ns |
| NAG activity (mmol g−1 h−1) | 26.01 ± 12.45 | 33.81 ± 3.04 | ns |
| AP activity (mmol g−1 h−1) | 344.82 ± 88.11 | 372.31 ± 29.19 | ns |
| Lophatherum gracile | |||
| NH4+-N (mg kg−1) | 9.66 ± 0.81 | 18.66 ± 1.20 | p < 0.05 |
| NO3−-N (mg kg−1) | 1.39 ± 0.09 | 3.23 ± 0.26 | p < 0.05 |
| Available P (mg kg−1) | 4.06 ± 0.45 | 3.06 ± 0.41 | ns |
| NAG activity (mmol g−1 h−1) | 12.80 ± 7.98 | 19.55 ± 6.88 | ns |
| AP activity (mmol g−1 h−1) | 237.8 ± 21.17 | 317.3 ± 20.07 | ns |
| Melastoma dodecandrum | |||
| NH4+-N (mg kg−1) | 8.18 ± 1.47 | 14.88 ± 0.52 | p < 0.05 |
| NO3−-N (mg kg−1) | 0.92 ± 0.08 | 2.48 ± 0.37 | p < 0.05 |
| Available P (mg kg−1) | 3.77 ± 0.27 | 3.54 ± 0.24 | ns |
| NAG activity (mmol g−1 h−1) | 13.34 ± 7.78 | 29.51 ± 10.51 | ns |
| AP activity (mmol g−1 h−1) | 361.3 ± 36.82 | 314.3 ± 19.26 | ns |
| Plant Variables | N | P | NSCs | N/P | NSCs/N | NSCs/P |
|---|---|---|---|---|---|---|
| Belowground Tissue | ||||||
| Dicranopteris dichotoma | ||||||
| NH4+-N | 0.88 ** | −0.15 ns | −0.74 * | 0.81 * | −0.89 ** | −0.41 ns |
| NO3−-N | 0.93 ** | 0.18 ns | −0.53 ns | 0.61 ns | −0.81 * | −0.53 ns |
| Available P | 0.29 ns | 0.93 ** | 0.22 ns | −0.53 ns | −0.04 ns | −0.66 ns |
| Lophatherum gracile | ||||||
| NH4+-N | 0.95 ** | 0.04 ns | −0.04 ns | 0.60 ns | −0.50 ns | 0.10 ns |
| NO3−-N | 0.64 ns | 0.77 * | 0.16 ns | −0.30 ns | −0.12 ns | −0.54 ns |
| Available P | −0.33 ns | 0.76 * | 0.73 * | 0.81 * | 0.01 ns | −0.84 ** |
| Melastoma dodecandrum | ||||||
| NH4+-N | 0.68 ns | 0.66 ns | −0.79 * | 0.60 ns | −0.78 * | −0.83 * |
| NO3−-N | 0.25 ns | 0.11 ns | −0.62 ns | 0.25 ns | −0.55 ns | −0.59 ns |
| Available P | 0.06 ns | 0.15 ns | −0.16 ns | −0.12 ns | −0.17 ns | 0.03 ns |
| Aboveground Tissue | ||||||
| Dicranopteris dichotoma | ||||||
| NH4+-N | 0.75 * | 0.16 ns | −0.57 ns | 0.57 ns | −0.76 * | −0.39 ns |
| NO3−-N | 0.90 ** | 0.16 ns | −0.60 ns | 0.71 * | −0.83 * | −0.42 ns |
| Available P | 0.51 ns | −0.16 ns | −0.15 ns | −0.32 ns | −0.02 ns | 0.56 ns |
| Lophatherum gracile | ||||||
| NH4+-N | 0.59 ns | 0.61 ns | 0.71 * | −0.10 ns | 0.11 ns | −0.06 ns |
| NO3−-N | 0.84 ** | 0.75 * | 0.86 ** | 0.03 ns | −0.31 ns | −0.06 ns |
| Available P | −0.20 ns | 0.37 ns | −0.14 ns | 0.33 ns | −0.55 ns | −0.53 ns |
| Melastoma dodecandrum | ||||||
| NH4+-N | 0.85 ** | 0.89 ** | −0.88 ** | −0.30 ns | −0.92 ** | −0.94 ** |
| NO3−-N | 0.77 * | 0.83 * | −0.45 ns | −0.38 ns | −0.70 ns | −0.72 * |
| Available P | 0.52 ns | 0.51 ns | −0.64 ns | −0.58 ns | −0.56 ns | 0.10 ns |
© 2019 by the authors. Licensee MDPI, Basel, Switzerland. This article is an open access article distributed under the terms and conditions of the Creative Commons Attribution (CC BY) license (http://creativecommons.org/licenses/by/4.0/).
Share and Cite
Wang, F.; Chen, F.; Wang, G.G.; Mao, R.; Fang, X.; Wang, H.; Bu, W. Effects of Experimental Nitrogen Addition on Nutrients and Nonstructural Carbohydrates of Dominant Understory Plants in a Chinese Fir Plantation. Forests 2019, 10, 155. https://doi.org/10.3390/f10020155
Wang F, Chen F, Wang GG, Mao R, Fang X, Wang H, Bu W. Effects of Experimental Nitrogen Addition on Nutrients and Nonstructural Carbohydrates of Dominant Understory Plants in a Chinese Fir Plantation. Forests. 2019; 10(2):155. https://doi.org/10.3390/f10020155
Chicago/Turabian StyleWang, Fangchao, Fusheng Chen, G. Geoff Wang, Rong Mao, Xiangmin Fang, Huimin Wang, and Wensheng Bu. 2019. "Effects of Experimental Nitrogen Addition on Nutrients and Nonstructural Carbohydrates of Dominant Understory Plants in a Chinese Fir Plantation" Forests 10, no. 2: 155. https://doi.org/10.3390/f10020155
APA StyleWang, F., Chen, F., Wang, G. G., Mao, R., Fang, X., Wang, H., & Bu, W. (2019). Effects of Experimental Nitrogen Addition on Nutrients and Nonstructural Carbohydrates of Dominant Understory Plants in a Chinese Fir Plantation. Forests, 10(2), 155. https://doi.org/10.3390/f10020155