Review

Can Existing Estimates for Ecosystem Service Values Inform Forest Management?

1
School for Agricultural, Forest and Food Sciences HAFL, Division Forest Sciences, Bern University of Applied Sciences, Länggasse 85, CH-3052 Zollikofen, Switzerland
2
TUM School of Life and Food Sciences Weihenstephan, Technical University of Munich, Hans-Carl-von-Carlowitz-Platz 2, D-85354 Freising, Germany
3
WSL Swiss Federal Institute for Forest, Snow and Landscape Research, Environmental and Resource Economics, Zürcherstrasse 111, CH-8903 Birmensdorf, Switzerland
*
Author to whom correspondence should be addressed.
Forests 2019, 10(2), 132; https://doi.org/10.3390/f10020132
Submission received: 8 January 2019 / Revised: 28 January 2019 / Accepted: 2 February 2019 / Published: 6 February 2019

Abstract

:
This paper aims at analyzing whether existing economic value estimates for forest ecosystem services (ES) might be transferred and used for valuation purposes elsewhere, and whether these data are appropriate for application in forest management. Many forest ES are public goods or positive externalities, and as a consequence they do not have a market price. The valuation of forest ES can provide important information for decision making in forest management and planning as well as in political processes, especially by allowing the comparison of different alternatives and helping set priorities for practical actions, as well as developing financial incentives or support mechanisms. We analyze whether an integrated economic valuation model for forest ES can be developed based on existing published data. To achieve this, we assess to which extent a benefit transfer could be expedient, and which challenges must be addressed. Based on a literature search, we compiled an extensive database of forest ES values. Given that these values vary substantially for the same ES, such a database alone does not seem useful to serve as a decision and management support tool. In addition, the available information mainly focuses on forests as such, and does not include desirable forest composition and management targets. If existing estimates should be transferred and used for forest management decisions, both the background conditions of the primary studies and the indicators used for valuation need to be specified in detail. The most expedient approach in this context seemed to be a valuation function transfer based on a broad set of indicators, offering the possibility to adapt the valuation function to changing background conditions.

1. Introduction

Many ecosystem services (ES) are public goods, which are defined by non-rivalry and a non-excludability (e.g., the opportunity to use forests for recreation), or positive externalities (e.g., the sequestration of carbon in forest biomass). Such goods and services are not traded on markets, and thus do not have a market price based on the interaction of supply and demand. This situation can lead to inefficient over-exploitation or under-provisioning of ES [1]. To assure an efficient and sustainable provisioning of ES, it is useful to integrate them into management and planning processes. ES valuation can be informative in different ways [2,3]:
  • Assessing and evaluating the impact of alternative actions and therefore serving as a decision support instrument to assess whether an intervention is economically reasonable.
  • Examining the distribution of costs and benefits generated by an ecosystem or intervention to identify winners and losers and allocate scarce resources among competing demands.
  • Identifying potential financing sources, e.g., for conservation purposes to help make them financially sustainable.
  • Providing a tool for improving decision-making processes.
Concerning the last point, the valuation of ES can be a useful gateway for addressing forest management issues [4,5]. In this light, Pearce [6] (p. 284) stated that assigning “… economic values to nonmarketed benefits has the potential to change radically the way we look at all forests…”. However, only few studies have achieved a transparent integration of ES into forest-related decision making [7,8,9,10]. Especially regarding public forests, it is essential to consider ES in forest planning and decision-making, because beyond timber production, it is a decisive requirement that these forests support public welfare. For example, in Switzerland, about two-thirds of the forest area are under public ownership (mainly cantons and communes) [11], and many foresters and forest owners regard the supply of forest ES, e.g., recreation or protection, as public obligation [12].
Still, there is a lack of studies on the consequences of integrating the growing knowledge on ES and implementing the ES concept into actual decision making [13]. Here, we will (i) critically review the principle opportunities of how to integrate ES into forest decision making, (ii) present an attempt to do so based on existing data, (iii) show the problems with using available data on ES values, and (iv) discuss the advantages of integrating forest ES into decision making despite several hurdles on the road to success.
Figure 1 shows the interaction of ecosystem structures and processes as well as ecosystem services and human well-being. To make well-founded management decisions, it is important to determine the costs and benefits of changes in the provisioning of various ES and integrate this information into forest planning. So far, research dealing with the (economic) valuation of ES has often focused on the supply side [14].
According to Plieninger et al. [16], demand is defined by people’s general preferences and value orientations, as well as by the sociodemographic and socioeconomic characteristics of different groups. The interaction of the supply and demand factors determines the use of ES, as illustrated by Hegetschweiler et al. [17] for cultural ecosystem services, such as recreation (Figure 2). Nevertheless, it must be considered that many ES are regarded as public goods with a lack of marketability, which in turn leads to market failure [18]. Comparing the demand and supply of forest ecosystem services might lead to an adaptation of the ES supply portfolio in forest planning processes.
To be able to react on future changes in the demand of ES, it is essential to maintain multiple options in ES management. It can help to incorporate and combine different perspectives [19], e.g., by integrative approaches building on multi-criteria methods. However, information on how to integrate different ES into forest-related decision making is quite rare, especially when it comes to forest optimization and the influence on forest composition and management. The economic valuation provides an opportunity to express ES values in monetary units, and thus, to make them comparable.
When valuing and comparing ES, it must be considered that valuation attempts are mostly based on values or prices. The value of a good is determined by a person’s attitude toward it. It depends on how well a good or service satisfies an individual’s needs. Given that utility is not directly measurable, the willingness to pay (WTP) for a good or service can be used as a second-best indicator. This means the value of a good or service can vary for different people. In contrast, the price is determined through the market mechanism. Thus, the interaction between supply (the marginal cost of producing the good or service) and demand (marginal willingness to pay) leads to the market price, which is equal for all customers [20].
WTP is the amount of money that somebody is willing to pay for a good or service, e.g., a fee for enjoying a recreational area. Willingness to accept (WTA) is the respective amount that somebody would request as a compensation for an intervention, for example for being excluded from enjoying a good or service [21]. Existing value estimates based on WTP/WTA are frequently transferred to other study regions (benefit transfer, BT) [22]. BT is used to enable a valuation even if no primary data exists or a primary valuation of ES in a study region is not feasible or impossible.
Depending on which approach is chosen, different estimates result. The key question is: how and to which extent can a valuation of forest ES based on the above-described approaches support decision-making and planning processes? Therefore, we first present two attempts how ES can be integrated in decision-making processes, and briefly introduce different valuation approaches. Afterwards, we describe our attempt to develop forest ES values via BT based on a forest ES database. Finally, we discuss the consequences related to the initial question of how forest ES can be included in decision-making processes and forest management.

2. Methods: Integration of ES in Decision Making, Analysis of Secondary Data, and Transferability of Results

Basically, ES can be integrated in decision-making processes in two ways, via multiple-criteria decision analysis (MCDA) or economic valuation. MCDA offers the possibility to solve complex problems [23] by evaluating multiple aspects, e.g., various ES [24] and by integrating diverse data, information, models, and methods [25]. Furthermore, trade-offs between different approaches can be assessed, which can be critical for the effectiveness of forest management planning [ebd.]. MCDA is based on the principle that different alternatives are evaluated by a defined set of criteria [26], which can, on the one hand cover different perspectives, such as an economic, environmental, or a social point of view [27], and on the other hand consider temporal as well as spatial interactions within an ecosystem, e.g., different forest stands [28]. MCDA helps to objectively evaluate management alternatives as well as trade-offs [ebd.]. The analysis of these trade-offs “may provide further insight about the forest management planning problem and help set adequate levels of achievement for various objectives” ([29], p. 64). Furthermore, MCDA facilitates a ranking of different alternatives based on their performance measured by a set of decision criteria [30] in situations where decision problems and decision-making processes show a high variation. It fits in cases requiring a strong interaction of theory and practice [31]. MCDA offers the possibility of combining different approaches and methods, with the great advantage of complementing each other [32]. Figure 3 gives a schematic example:
A special form of multi-criteria optimization, especially when there are competitive objectives, are Pareto frontier methods, as described by Borges et al. [29] and Tóth et al. [33]. As an alternative to MCDA methods, the economic valuation is aimed at making comparable various ES by expressing their value in monetary units. In this way, ES can be considered in decision making, planning, and optimization processes. So far, there are only a few studies that have used economic ES values for forest optimization (e.g., [10]), while others have applied economic values to demonstrate the effects of including ES in land-use planning (e.g., [34,35]). One of the most frequently used methods to determine economic values of ES is benefit transfer.
To be able to integrate ES in forest planning and optimization, several aspects must be considered, e.g., the demand for ES and indicators for the economic valuation. Therefore, we compiled a database of forest ES values with the aim of generating a pool of values from which the appropriate estimates can be selected to build a suitable subset for the respective decision situation. For this purpose, the background conditions of the primary studies (e.g., political framework, social context, forest composition etc.). Further, the indicators used for valuation need to be specified in detail. Primary studies investigate ecosystem service values based on either of the below described valuation methods: travel cost method, hedonic pricing, contingent valuation, or choice experiments. Based thereon, one could in a first step identify a set of potentially important ES. Second, these can be restricted to a subset of key ES. Third, stakeholders and their influence must be identified as well as stressors and drivers of the ES provision. Fourth, linkages and interactions must be considered [13].
If an economic valuation of ES should be used for planning and management decisions at the enterprise level, the indicators should be elements, which can be influenced by forest management. For illustration, let’s assume a forest close to a growing city, where many people go for recreational purposes, and they demand infrastructure elements such as downhill trails, barbecue areas, fitness trails, stroller-friendly footpaths, and so on. Due to the increasing demands of the population, the forest manager must decide on a reorientation of forest management currently focusing on wood production, only. If concrete economic values for the desirable characteristics of a recreational forest ES were available, she could better compare costs and benefits when turning from a wood production-oriented to a recreation-oriented forest management. In addition, she could also illustrate the outlays associated with the population’s demand for recreational infrastructure.

2.1. Valuation of ES

For determining the values of ecosystem goods and services that are not traded on markets or are not directly related to markets (i.e., non-market goods and services), different valuation methods exist, which can generally be divided into three categories: (i) revealed preferences using surrogate markets (travel cost method (TCM) and hedonic pricing (HP)); (ii) stated preferences using surveys (contingent valuation method (CVM) and choice experiments (CE)); and (iii) benefit transfer (BT). In the following, we briefly describe all of the methods, while later focusing on BT as an approach to make use of the valuation results generated by the other methods.

2.1.1. Travel Cost Method (TCM)

TCM is an often-used indirect technique for the valuation of non-marketed ES [36]. It is particularly used to estimate recreational values considering revealed preferences [37]. The calculation is based on the travel expenses (in terms of money and time) that people are willing to bear to reach an area where the desired ES can be enjoyed [38]. This could, for example, be a nature reserve or a local recreation area. Basically, two different approaches of TCM exist. According to Hanley and Barbier [37], it can either be based on the number of visits and related costs or focus on how recreationalists choose their destination among different options or substitute sites.

2.1.2. Hedonic Pricing (HP)

This method uses the market results of private goods to determine the value of non-marketed goods or services [38]. More precisely, the value of an ecosystem good or service is defined by its influence on a marketed good or service. HP is most often applied by using housing prices to determine the value of the ES of the surrounding area. A property in attractive surroundings is expected to have a higher price than an identical property in a less attractive area. The price difference of otherwise identical properties reveals buyers’ preferences and can be assigned as a monetary value to the ES (e.g., landscape value).

2.1.3. Contingent Valuation Method (CVM)

CVM is aimed at directly determining the willingness to pay for, or the willingness to accept, a marginal environmental change. This method is based on interviews or questionnaires, and is quite similar to classical market research methods [39]. CVM can either estimate the minimum amount of compensations that people claim for a loss of ecosystem services (willingness to accept) or the maximum willingness to pay for an ES improvement. In principle, CVM collects information about the benefits from ecosystem services by building up theoretical markets and eliciting the willingness-to-pay/accept for this service on a random basis. Since its first use in 1963, CVM “has become the most widely used (and perhaps most controversial discussed) of all the environmental valuation techniques” [36].

2.1.4. Choice Experiments (CE)

Similar to CVM, choice experiments belong to the stated preference approaches, which can be used to determine the willingness to pay for, or the willingness to accept, environmental changes [40]. In contrast to CVM, respondents can choose among different options consisting of several attributes with different levels, often including a monetary (price) attribute and an opt-out/status quo option [41]. The aim is to determine the importance of and willingness-to-pay (WTP) for specific attributes of an ES, e.g., the duration and effectiveness of protection from environmental hazards.

2.1.5. Benefit Transfer (BT)

The basic idea of BT is to use and transfer results from existing (primary) studies, e.g., found by use of the methods mentioned above, to generate and determine monetary values for new and unstudied but comparable sites and valuation situations (secondary studies) [42].
BT could be a suitable method to acquire data and provide information for forest management planning or optimization at relatively low costs [36,42]. According to Czajkowski et al. [43], BT is the most commonly applied method for valuing non-marketable goods and services, especially if the aim of the valuation is practical policy application. Principally, BT can be based on two approaches [44]: (i) transferring value estimates 1:1, or adapting value units and (ii) transferring values based on statistical functions considering covariates such as income levels or median values derived from a meta-analysis. The following examples illustrate the two options:
Value transfer: Assume that in a primary study A, it was revealed that a forest of 100 hectares near a big city has a recreational value of 50 United States dollars (USD) per hectare and year. Accordingly, its overall recreational value is 5000 USD (50 USD/hectare/year × 100 hectares). Suppose that in a second, comparable region B, the recreational value of a forest of 50 hectares near another city should be valued. Transferring the estimates of the primary study to the second region results in a recreational value of 2500 USD (50 USD/ha/year × 50 ha).
Function transfer: Assume that the recreational value of the forest in study region A was calculated based on a more complex function including independent variables such as gross domestic product (GDP) per capita, population density, the number of residents, frequency of visits, etc. Now, instead of using the final value per hectare, the entire valuation function is transferred and applied to the secondary study B by adapting the variables to the respective background conditions of study region B.
There is no general rule about which approach is more appropriate or advantageous. Czajkowski et al. [43] showed how value transfer leads to acceptable results if the background conditions of the primary and secondary study site are similar. If this is not the case, function transfer seems to be more suitable.
When checking the study sites for comparability, the following aspects should be considered (based on [45]):
  • The specific services in question (extent, quality) and type of change that was analyzed (e.g., marginal improvement or avoidance of deterioration).
  • The valuation question: willingness to pay (e.g., to avoid negative changes or achieve positive changes) or willingness to accept (e.g., to accept a negative change or the non-occurrence of a positive change).
  • The addressee of the study (national, regional, or local sample; private persons, enterprises, or experts).
  • The characteristics of the population.
  • The geographical location.
  • The time the survey was conducted (considering inflation and changes in exchange rates).
Johnston et al. [42] described three major problems and restrictions that regularly occur in BT:
  • Scaling: Unit values must be adjusted when they are transferred to larger geographic areas or scales [46].
  • Site, context, and commodity similarity, e.g., the similarity between available substitutes and complements of the good or service in question.
  • Additional challenges for international BT, e.g., currency conversion, user attributes.
  • Accurate understanding of welfare-influencing quantities and qualities of goods at affected sites.
  • Data sources and selectivity: It is necessary that the primary studies are of high quality (e.g., appropriate reporting of data and methods) and offer an unbiased sample of the population’s empirical estimates; these in turn must provide an unbiased representation of true resource values.
The suitability of the different methods for economic valuation purposes depends on the valuation context, e.g., it is recommended to not just rely on one single method, but to use different methods complementarily. However, such a procedure would require substantial additional efforts and costs. When taking account of all these requirements, comparing the results of different studies and transferring them from one study region to another is expected to be a promising way of determining the values of ecosystem services in general.
In this paper, we set our focus on BT and explored to which extent it can be used to value forest ecosystem services at the enterprise level. Therefore, a database of valuation studies was compiled considering the following forest ecosystem services:
  • Biodiversity promotion and conservation
  • Carbon sequestration and storage
  • Recreation
  • Protection from natural hazards
  • Quality and quantity of drinking water

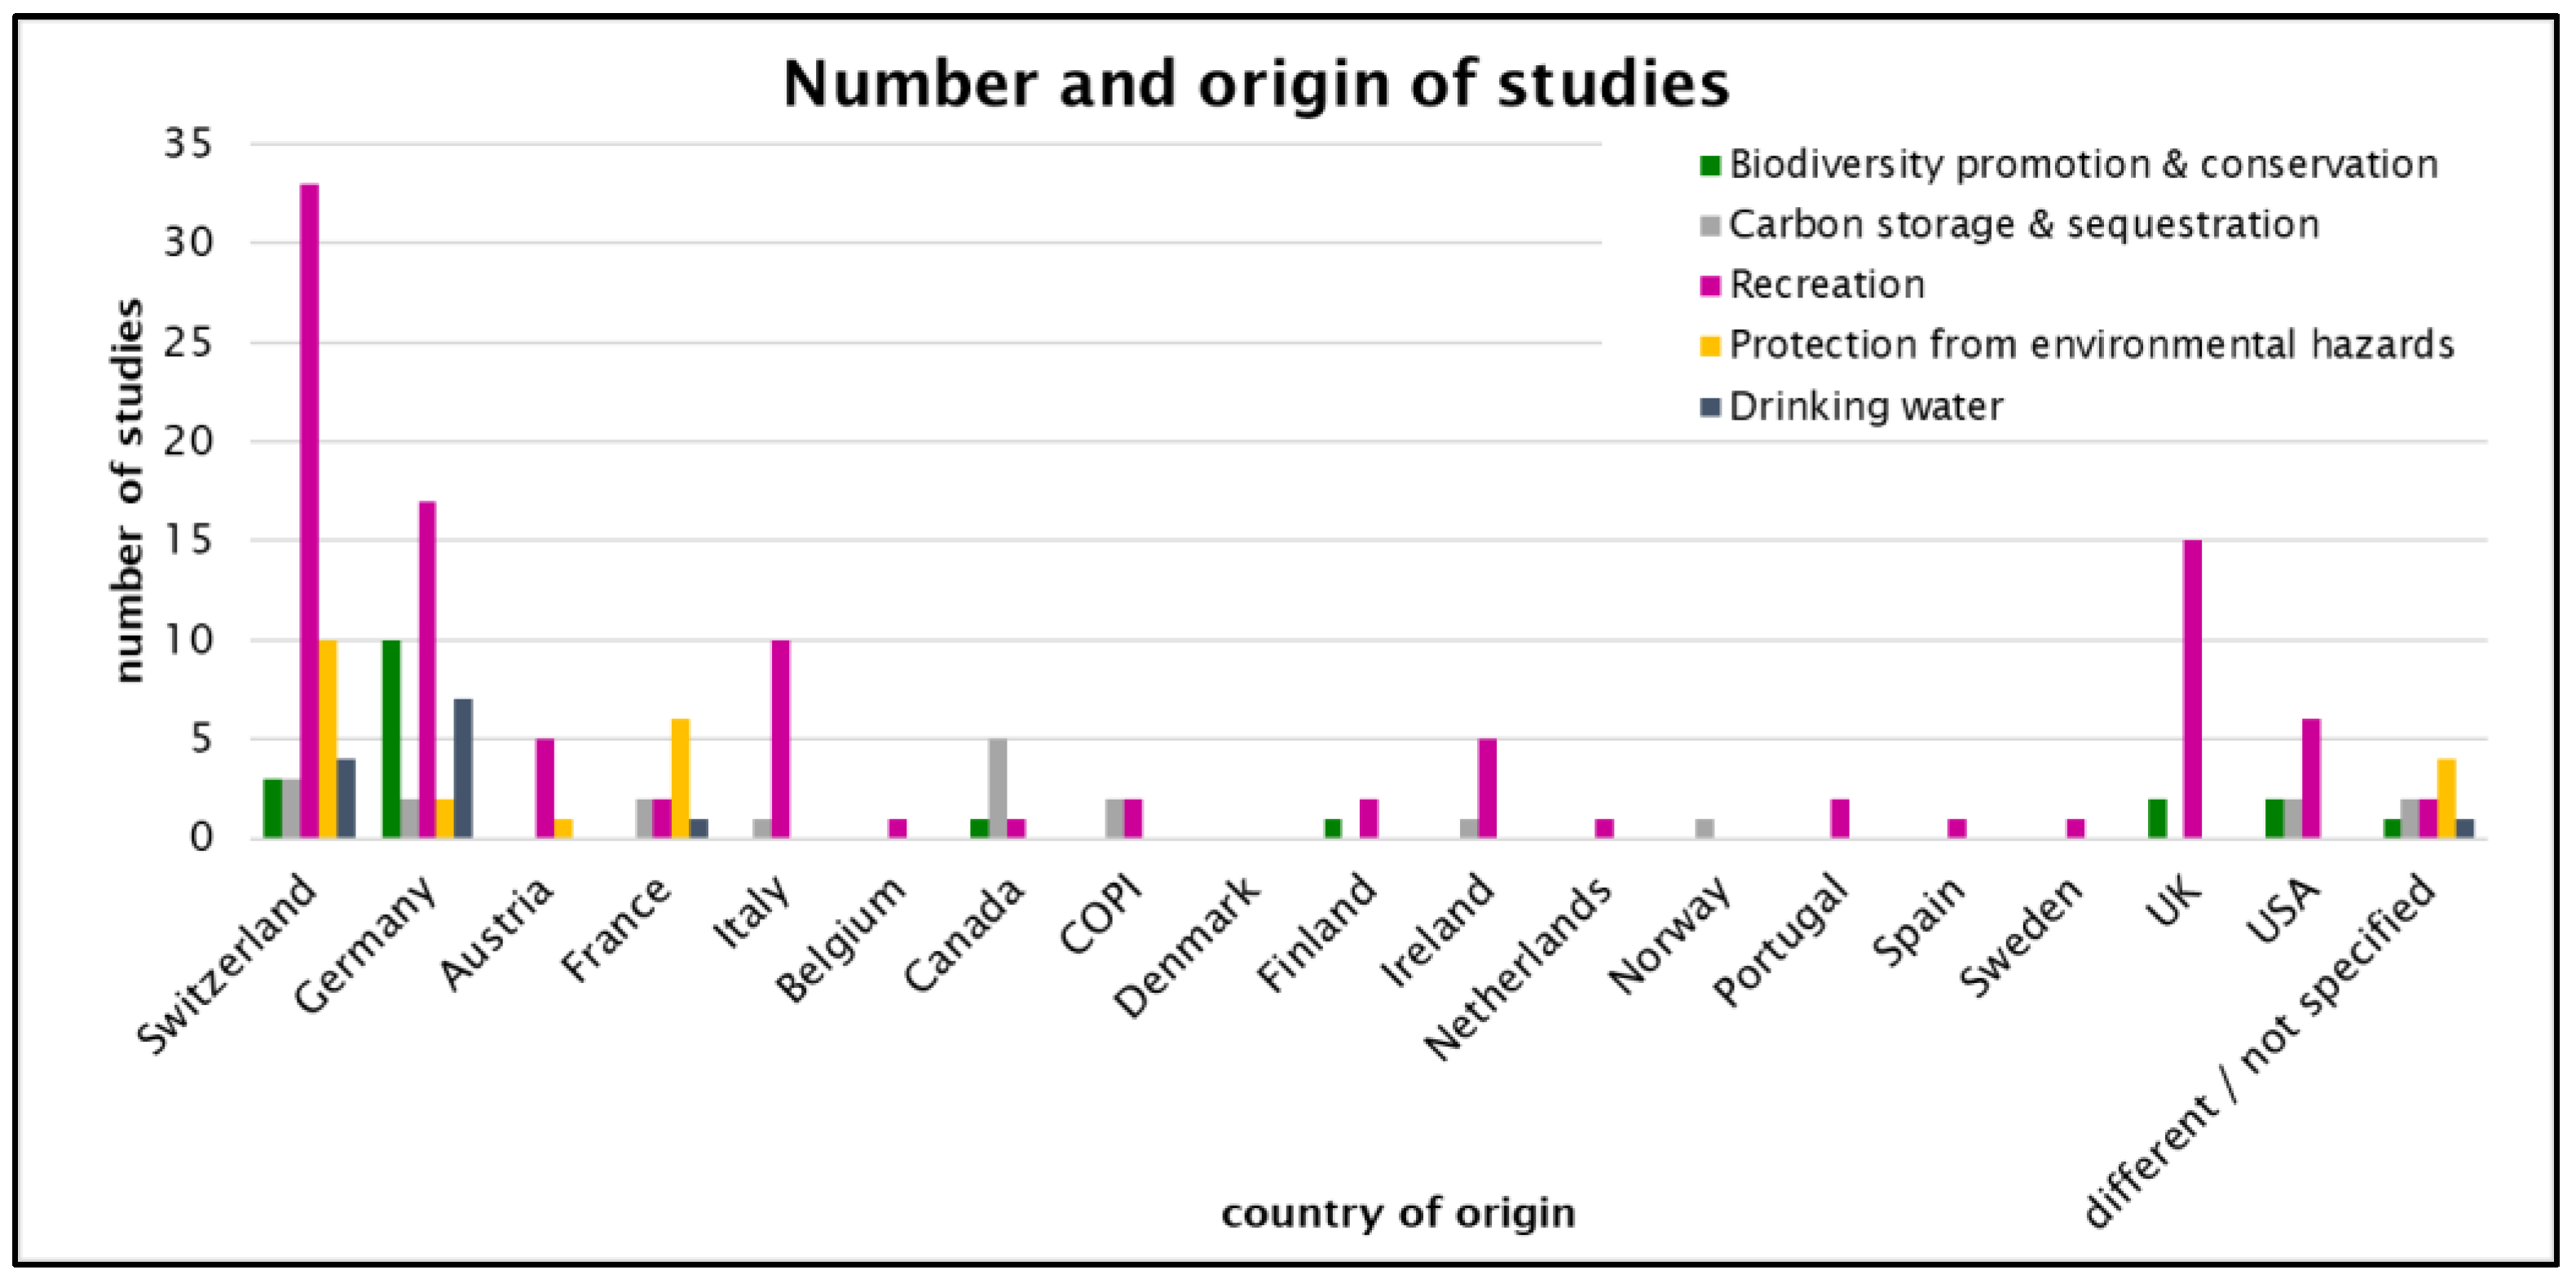
2.2. Data Collection

To support an assessment of available ES value information, we conducted a literature review, resulting in a database of forest ES values. The literature review was based on databases such as CAB abstracts, ScienceDirect, and snowball-like cross-referencing from different large studies, such as the Millennium Ecosystem Assessment or TEEB (TEEB = The Economics of Ecosystems and Biodiversity). We focused on Switzerland as a case study, because ES play a major role and are part of federal policy (e.g., [47]). Consequently, the investigation started with Swiss studies and was then extended to other countries to put the Swiss results into an international context. When searching in literature databases, keywords such as “forest”, “ecosystem service” (we used both forest ES, and ES in general), “value/valuation of (forest) ecosystem services”, and combinations between “valuation of” and names of ES (e.g., protection from natural hazards) were used as well.
The database currently comprises 108 valuation studies (the complete list of references is included as Supplementary Information) and considers the following forest ecosystem services and studies’ publications years:
  • Biodiversity promotion and conservation: 2008–2015
  • Carbon sequestration and storage: 2001–2016
  • Recreation: 2001–2016
  • Protection from natural hazards: 2009–2015
  • Quality and quantity of drinking water: 2009–2014
Figure 4 shows the countries of origin and number of studies of the different forest ecosystem services.
In cases where studies were based on other studies without major adaptions, e.g., recalculations based on other spatial units, we only kept the primary study. To facilitate the comparability of the studies, the results were converted to US dollars where possible (Appendix A).

3. Results

The database analysis showed a wide range of valuation results for all of the forest ES categories. Figure 5 provides an overview of the high dispersion of valuation results.
This high dispersion limits the meaningfulness of calculating average values. Even if extremely high or low values are ignored, mean values based on the remaining data are still difficult to interpret, and it is uncertain how robust and useful valuation results really are, if they show such a wide range. That does not mean that existing valuations are inappropriate. It just indicates that valuation is highly context-specific, so it is difficult to transfer the results of existing studies to other valuation cases. In the following subsections, we present and explain our findings separately for the different forest ecosystem services.

3.1. Biodiversity Promotion and Conservation

Ecosystems provide essential habitats for plants and animals [48]. For the studies included in the database, the focus was on the valuation of biodiversity conservation and the promotion of such habitats. Our analysis showed that the most common method to determine the value of habitat services was CVM. In the database, 12 out of 21 values had been derived based on this method. Another three values of biodiversity were also based on the willingness to pay, but the applied method was not indicated. Most values ranged between 100–800 USD/ha/year. There were several values above the major scatter, especially regarding biodiversity conservation. Two of them were around 9000 USD/ha/year; they referred to very specific cases: rarely visited remote forests in the United Kingdom (UK) and a conservation program in the United States.
As biodiversity is one of the core elements of all ecosystems, research is at odds as to which extent it can be valued. There is no consensus on whether biodiversity itself is an ES or not. According to Mace et al. [49], biodiversity can be regarded from three different perspectives. First, it can be a regulator of ecosystem processes, e.g., top predators as population regulators. Second, elements of biodiversity can be a final ES, e.g., pollinators securing food crops. Third, biodiversity can be a good, e.g., animals or plants that are recognized for their charisma or aesthetic appeal. In addition, biodiversity may have a direct influence on the net primary production of an ecosystem [50]. Keeping these aspects in mind, biodiversity can be regarded as a crucial component at all levels of the ES spectrum, and can therefore not be valued comprehensively. Nevertheless, biodiversity should be considered, if the economic valuation is going to serve as guidance for forest management and planning, even if only single components of biodiversity or their influence on other ES can be valued [51].
Especially in the case of benefits generated from regulatory and habitat functions, several problems arise, as described by Barbier [52]. First, habitats might be non-renewable resources, although providing renewable service flows. Second, these services are usually not marketed, which makes valuation more difficult and often leads to an underestimation of their value. Third, their benefits are threatened by the disappearance of natural ecosystems and habitats due to land conversion and land-use changes. Spangenberg and Settele [53] as well as Barbier [52] emphasized that a valuation of these services helps distinguish the costs related to options of action, and is therefore important for efficiently managing natural ecosystems and their services, especially when it comes to managing critical environmental assets and the assessment of decisions about land use involving trade-offs and their consequences [50]. A precondition is that the chosen valuation methods are “scientifically sound and solid, based on (objective) biophysical measurements of the object to be valued, including aggregate error margin information, from the natural science assessments through to the monetary valuation” [53] (p. 107).

3.2. Carbon Sequestration and Storage
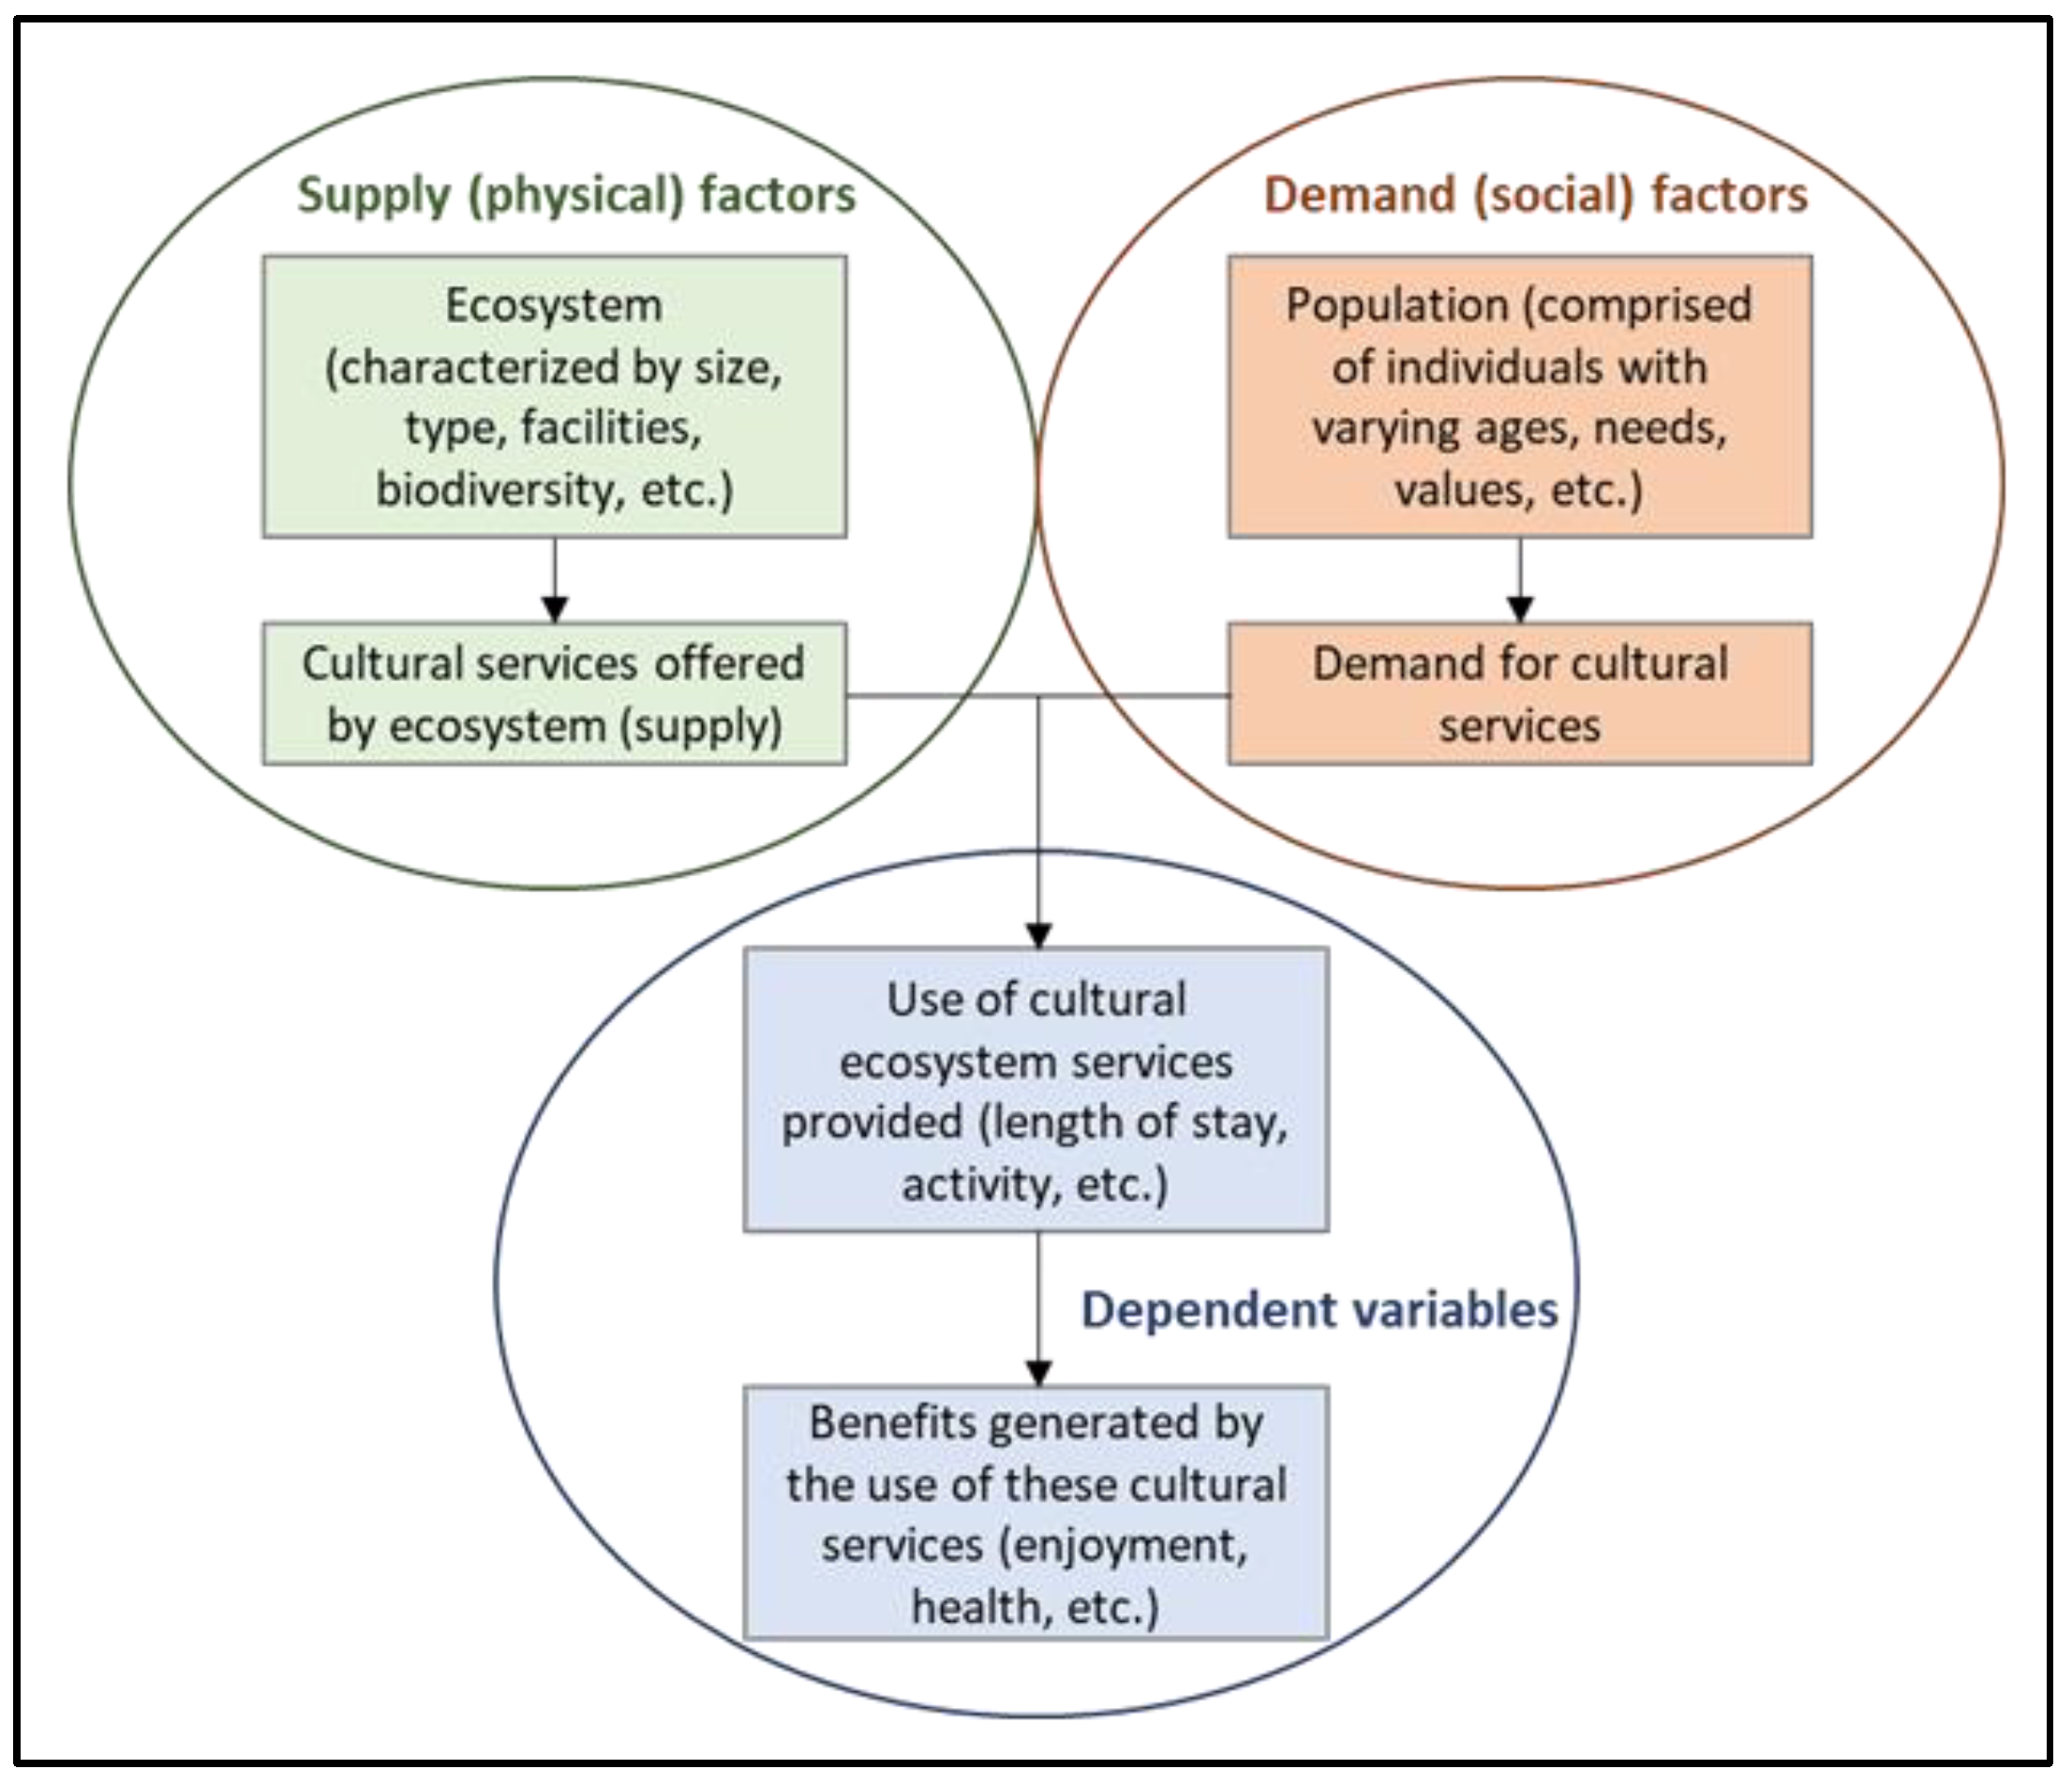
Concerning the impact of forests on atmospheric carbon dioxide concentration, the main aspects to be valued are storage and sequestration. The focus of the studies included in the database is on temperate mixed forests and was, for comparison, extended to boreal forests. Most values have been derived through estimations based on market prices. Another approach to be mentioned is to determine the social cost of the carbon emissions, resulting in a much higher values per ton of carbon (e.g., [54]). Nevertheless, concerning our database, this approach did not generally result in higher values.
Especially concerning sequestration, the distribution of values shows a wide range between 16 USD/ha/year (Canada) and 658 USD/ha/year (France). Furthermore, the database includes an outlier of about 9500 USD/ha/year, which has been excluded from the further analysis. This value is forecasted for the year 2050, and is the mean value of an estimated lower and upper limit. The low per-hectare values compared to other forest ES show that this service is at present either economically less attractive than often assumed or possibly not valued comprehensively.

3.3. Recreation

Recreation usually shows relatively high economic values in the existing scientific studies (e.g., [30]). The most widely used valuation methods for recreation are CVM and TCM, both of which result in a wide range of valuation results, as described by Mayer and Woltering [55]. In addition, due to the lack of necessary secondary information, it was not possible to convert all the values found into one common dimension. Therefore, the values in Table 1 are reported separately according to the categories: USD/person/year, USD/ha/year, and USD/visit.
The range of results can be explained by the valuation of recreational services being usually related to local examples under quite unique specific conditions. The following list provides some examples:
  • Type of recreation (e.g., biking, walking, etc.)
  • Infrastructure and substitutes in the area (e.g., existing recreational facilities such as bike trails, fireplaces, etc.)
  • Distance to areas of high population density (e.g., cities, hotspots for tourism, etc.)
  • Personal interests (e.g., existence of a forest essential or less important to recreation)
  • Conflicting elements (e.g., use intensity and diversity of type, number, and size of user groups (bikers, hikers, horseback riders))
As a result, the integration of recreational services into a general valuation system is challenging. Even when considering similar background conditions, the values still show a wide range. However, this is not surprising, since it can be assumed that not just recreational benefits but cultural ES in general are fundamentally determined by unique local characteristics and people’s perceptions, and thus cannot be predicted solely based on the background conditions of the forest area. In fact, the recreational value of forest can be regarded as a conglomerate of natural and social influences on people. This finding is basically valid for all forest ES, but is particularly evident for cultural ES, given that most people have a direct relation to these services or are directly influenced by them.
Notwithstanding, the valuation of recreational forest ES can provide useful information for forest management. Especially in public forests, where the needs and well-being of the population must be addressed as a core task, recreational values can feed into adapting management strategies, while taking the specific local conditions into account. However, knowledge about which attributes influence the forest recreation value would be important when considering recreation in forest decision making. Additionally, recreational values are not only difficult to determine but also challenging to communicate to other local or regional stakeholders, as recreational ES are often supposed to mainly generate “’paper benefits’ that do not generate tangible payments flows” [55] (p. 383). Nevertheless, “neglecting the consumer surplus of recreation and tourism […] would lead to a significant underestimation of the cultural ecosystem services” (ibid.).

3.4. Protection from Natural Hazards

According to our database, the values for protection from natural hazards showed an even wider range (21–37,000 USD/ha/year) than those of the other services. This is because protection from environmental hazards, similar to recreational services, usually has an impact on the local level and depends on a specific situation (e.g., the damage potential). Regarding the valuation of such services, several aspects must be kept in mind. First, the population is often highly aware and well informed of the protective function of forests [56,57], which is important to the reliability of survey answers, as it is more likely that the valuation topic will be well understood. Second, the often-used scenario “without forest” is not realistic. If forests disappeared, authorities would be obliged by law to provide protection by other measures. Furthermore, in the long term, other biophysical functions would be affected as well if forests disappeared, e.g., soil conditions would change (such as erosion or ground roughness). Third, future development should be considered, e.g., the possibility of more frequent natural hazards due to climate change, which might change the value of protective forests. Given these considerations, it is plausible that the values reported for protection from natural hazards tend to be high compared to the values of other ES.

3.5. Drinking Water Quality and Quantity

Forests can have a positive influence on groundwater quality (e.g., [58]). In Switzerland, more than 80% of the drinking water is obtained directly from groundwater [59,60]. The valuation results showed a wide range from 25–2227 USD/ha/year, with most values between 25 USD/ha/year and 211 USD/ha/year. All of the analyzed studies are price-based. The values in the database come from a small number of valuation studies and describe bundles of actions improving or ensuring groundwater quality. Furthermore, most of the values result from contractual agreements, which define compensations for different actions, e.g., the limitation of pesticide application. The main problem concerning these database entries is the often-strong correlation between them, given that some describe sets of measures, which are interlinked but valued individually. The generally rather low values for providing clean drinking water may also be influenced by the usually high available quantity of clean water, resulting in a low willingness to pay. Exceptionally high payments could be motivated by their supposed positive influence on a company’s or organization’s public image.

4. Discussion and Conclusions

As described in the previous section, the valuation results show a wide range within and among all of the service categories. Therefore, we intended to find a pattern explaining the range of values as a basis for clustering. First, the valuation results were grouped according to the valuation method applied. This approach did not effectively reduce the dispersion of the ES values that were found. Second, we intended to group the values according to the valuation backgrounds. This attempt turned out to be unsuccessful, because there are hardly any studies with fully comparable backgrounds. In consequence, integrating forest ES values in decision-making and planning processes using the BT of existing data seems difficult. Nevertheless, the ES concept is expected to become more and more important in public and private decision making, and the population’s awareness of forest ES is supposed to grow [61]. In addition, sustainable forest management as it is promoted and practiced today aims at satisfying the needs of the population as well as preserving the forests for future generations. Consequently, ES should be an integral part of forest management and planning, and their values should be considered in decision-making processes. In this regard, Nelson et al. [62] emphasized that assessments and incentives for landowners to provide ES are necessary to bring them on the agenda of those making land-use and land-management decisions.
However, when different interests and interest groups encounter each other, conflicts are likely to appear. Especially in multifunctional forestry, where different forest ES should be provided in the same area at the same time, dissonances can be expected. Turkelboom et al. [63] defined five principal types of trade-offs:
  • Change in land use
  • Change in management objective
  • Technical versus nature-based solutions
  • Use of natural resources
  • Management of conflict species
All of these trade-offs don’t arise from the ES themselves, but rather are related to humans interacting with their environment. In this regard, interviews with forest practitioners are revealing. When assessing the importance of different ES and possible conflicts influencing management decisions, one important finding from those interviews was that many conflicts get inflated by the lobbying of interest groups. In this case, a transparent communication is essential, and an economic valuation of ES could serve as an argumentation aid.
A further important aspect concerning forest ES in Switzerland and other countries is the public good dilemma. As there is free access to most forests and the related ES, many people regard them as free, and are not aware of the provision being often interlinked with costs for forest owners and enterprises. The economic valuation of forest ES can help make their value visible and raise awareness in the society. Nevertheless, the results of an economic ES valuation should always be scrutinized critically. First, they depend on the study context and background (social, cultural, and economic), which must be kept in mind when interpreting them [37]. Second, valuation results depend on the chosen valuation method and the perspective taken, because the perception of ES has a significant impact on the valuation process [64]. Third, individual preferences are likely to change over time. Consequently, the value of a good or service is also subject to change, driven by the social or cultural context as well as changes in the public opinion or changing technologies [65]. The three mentioned aspects imply that valuation is always subjective, and can only provide value estimates at one point in time.
Besides being influenced by the perspective of the assessing persons and the point in time of the valuation, the value of a service can also change due to supply-side changes, e.g., in case the provision of ES becomes more difficult due to limited access or increasing costs etc. [66]. In addition, research on ecosystems always involves uncertainties; the exact scope of current and future services is often unknown. Therefore, possible variations in the expected levels of these services must be considered when making management decisions [67].
Further, ecosystems are interlinked in many ways, and influence each other [68]. These interlinkages can lead to positive or negative spillover effects. As an example, diverse forest edges offer habitats for pollinating insects, which in turn are essential for food production. Basically, the spillover effect is larger from such species-rich ecosystems to species-poorer ecosystems than vice versa, even if these effects vary among species [69]. One essential aspect of enabling spillovers is the presence of corridors, which help species migrate from one ecosystem to another. Concerning ES valuation, one can argue that the spillover effects increase the risk of double-counting ES. However, spillovers between different ecosystems are important to demonstrate their economic value and show that ES are part of highly complex systems that cannot be viewed delineated from each other. Besides having an “own” value, ES normally also have value-inducing effects on other ES [68], which on the one hand should not be neglected, but on the other hand makes a valuation even more complex (ibid.).
Related to the double-counting issue are problems when aggregating values of multiple ecosystem services. Just summing up single values for different forest ES can lead to ambiguous value estimations, as shown by the following example. If we consider the minimum, average, and maximum database values for non-further specified services in the categories biodiversity/habitat services, carbon sequestration, recreation, and protection from environmental hazards, we obtain values between two USD/ha/year and 35,108 USD/ha/year (mean: 2883 USD/ha/year).
Using our database entries, we analyzed to which extent a value transfer is possible for forest ecosystem services in Switzerland, with the goal of developing an economic valuation model at the enterprise level. It turned out that no underlying pattern concerning the distribution of values for single forest ES can be found: neither regional differences, nor the valued service nor the applied valuation method can explain the wide range of values. Nevertheless, it is essential for forest management to take ES into consideration. Therefore, valuing local ES by primary studies seems to be a promising way of making the different ES comparable, and thereby facilitating decision-making processes in that specific area. Furthermore, the economic valuation of forest ES is a helpful tool to raise awareness, showing that forest ES are appreciated by the population but also that their provision generates costs. Comparing the costs and benefits of different forest management alternatives could be a basis for welfare-improving decisions related to the provisioning of ES. However, when it comes to transferring values to other regions, a basic requirement is the similarity of background conditions. Our results show that the transfer of specific values is hardly possible, given that the scale, dimension, and perspective of valuation studies widely differ. This makes a transfer of concrete values to a specific forest enterprise or even to the stand level infeasible.
A more expedient approach might be function transfer, provided that the above-mentioned requirements for a function transfer are fulfilled. In this case, BT offers an opportunity for researchers and policy-makers facing time and budget constraints [70], and can contribute to the design of policies that improve future developments, e.g., offering a spectrum of possibilities and different scenarios [71]. Function transfer uses a value function, which considers important variables that influence the value of an ES. It can be based on meta-analyses or on preference functions estimated for specific sites [72]. In this way, a monetary valuation based on BT can help prioritize practical actions and develop financial incentives or support mechanisms [70].
In conclusion, the valuation results of primary studies can provide useful information for comparison and decision making in a specific study area. However, their possible contribution to secondary analyses is rather limited, and BT is often restricted to function transfer, only being feasible in case specific conditions are fulfilled.

Author Contributions

All of the authors have approved the submitted version and agree to be personally accountable for the author’s own contributions and for ensuring that questions related to the accuracy or integrity of any part of the work, even ones in which the author was not personally involved, are appropriately investigated, resolved, and documented in the literature. Each author has made substantial contributions to the conception of the work and the interpretation of data, and has substantively revised it.

Funding

This research was funded by the Swiss Federal Office for the Environment

Conflicts of Interest

The authors declare no conflict of interest. The sponsors had no role in the design, execution, interpretation, or writing of the study.

Appendix A

Table A1. Conversion rates for database values * (Source: http://www.in2013dollars.com/2016-dollars-in-2016?amount=1).
EUR–
USD
CHF–
USD
ATS–
USD
DM–
USD
CAD–
USD
USD–
USD (Inflation)
1980 0.600.080.55 2.97
1981 0.510.060.44 2.69
1982 0.490.060.41 2.53
1983 0.480.060.39 2.46
1984 0.430.050.35 2.35
1985 0.410.050.34 2.27
1986 0.560.060.46 2.23
1987 0.670.070.56 2.15
1988 0.690.080.57 2.07
1989 0.610.070.53 1.97
1990 0.720.090.62 1.87
1991 0.700.090.60 1.80
1992 0.710.090.64 1.74
1993 0.680.090.61 1.69
1994 0.730.090.62 1.65
1995 0.850.100.71 1.60
1996 0.810.100.67 1.56
1997 0.690.080.58 1.52
1998 0.690.080.57 1.50
19991.070.670.080.550.671.47
20000.920.59Newer values in EUR0.470.671.42
20010.900.59 0.460.651.38
20020.950.64 Newer values in EUR0.641.36
20031.130.74 0.721.33
20041.240.81 0.771.29
20051.240.80 0.831.25
20061.260.80 0.881.21
20071.370.83 0.941.18
20081.470.93 0.941.14
20091.390.92 0.881.14
20101.330.96 0.971.12
20111.391.13 1.011.09
20121.281.07 1.001.07
20131.331.08 0.971.05
20141.331.09 0.911.03
20151.111.04 0.781.03
20161.111.02 0.761.02
20171.071.00 0.751.00
* EUR = Euro, USD = US dollar, ATS = Austrian schilling, DM = German mark, CHF = Swiss frank, CAD = Canadian dollar.

References

  1. Helm, D.; Hepburn, C. The economic analysis of biodiversity: An assessment. Oxf. Rev. Econ. Policy 2012, 28, 1–21. [Google Scholar] [CrossRef]
  2. Pagiola, S.; von Ritter, K.; Bishop, J. Assessing the Economic Value of Ecosystem Conservation: The World Bank Environment Department; Environment Department Paper No. 101; The World Bank: Washington, DC, USA, 2004. [Google Scholar]
  3. Merlo, M.; Croitoru, L. Concepts and Methodology: A First Attempt Towards Quantification: Chapter 3. In Valuing Mediterranean Forests: Towards Total Economic Value; Merlo, M., Croitoru, L., Eds.; CABI Publishing: Wallingford, UK, 2005; pp. 17–36. [Google Scholar]
  4. Milcu, A.I.; Hanspach, J.; Abson, D.; Fischer, J. Cultural ecosystem services—A literature review and prospects for future research. Ecol. Soc. 2013, 18, 44. [Google Scholar] [CrossRef]
  5. Andersen, H.B.; Klinker, C.D.; Toftager, M.; Pawlowski, C.S.; Schipperijn, J. Objectively measured differences in physical activity in five types of schoolyard area. Landsc. Urban Plan. 2015, 134, 83–92. [Google Scholar] [CrossRef]
  6. Pearce, D.W. The Economic Value of Forest Ecosystems. Ecosyst Health 2001, 7, 284–296. [Google Scholar] [CrossRef]
  7. Bagdon, B.A.; Huang, C.-H.; Dewhurst, S. Managing for ecosystem services in northern Arizona ponderosa pine forests using a novel simulation-to-optimization methodology. Ecol. Model. 2016, 324, 11–27. [Google Scholar] [CrossRef]
  8. Ferrier, S.; Ninan, K.N.; Leadley, P.; Alkemande, R.; Akçakaya, H.R.; Brotons, L.; Cheung William, W.L.; Christensen, V.; Harhash, K.A.; Kabubo-Mariara, J.; et al. The Methodological Assessment Report on Scenarios and Models of Biodiversity and Ecosystem Services; Secretariat of the Intergovernmental Science-Policy Platform on Biodiversity and Ecosystem Services: Bonn, Germany, 2016. [Google Scholar]
  9. Diaz-Balteiro, L.; Alonso, R.; Martínez-Jaúregui, M.; Pardos, M. Selecting the best forest management alternative by aggregating ecosystem services indicators over time: A case study in central Spain. Ecol. Indic. 2017, 72, 322–329. [Google Scholar] [CrossRef]
  10. Ovando, P.; Caparrós, A.; Diaz-Balteiro, L.; Pasalodos, M.; Beguería, S.; Oviedo, J.L.; Montero, G.; Campos, P. Spatial Valuation of Forests’ Environmental Assets: An Application to Andalusian Silvopastoral Farms. Land Econ. 2017, 93, 87–108. [Google Scholar] [CrossRef]
  11. Federal Statistical Office (FSO). STAT-TAB—Interactive Tables. Available online: https://www.pxweb.bfs.admin.ch/pxweb/de/px-x-0703010000_106/-/px-x-0703010000_106.px/table/tableViewLayout2/?rxid=606bb117-c4e8-49df-80f2-72ffaf30017a (accessed on 8 January 2019).
  12. Roschewitz, A.; Holthausen, N. Wald in Wert setzen für Freizeit und Erholung: Situationsanalyse; Federal Office for the Environment (FOEN): Bern, Switzerland, 2007. [Google Scholar]
  13. Bennett, E.M.; Cramer, W.; Begossi, A.; Cundill, G.; Díaz, S.; Egoh, B.N.; Geijzendorffer, I.R.; Krug, C.B.; Lavorel, S.; Lazos, E.; et al. Linking biodiversity, ecosystem services, and human well-being: Three challenges for designing research for sustainability. Curr. Opin. Environ. Sustain. 2015, 14, 76–85. [Google Scholar] [CrossRef]
  14. Daw, T.M.; Hicks, C.C.; Brown, K.; Chaigneau, T.; Januchowski-Hartley, F.A.; Cheung, W.W.L.; Rosendo, S.; Crona, B.; Coulthard, S.; Sandbrook, C.; et al. Elasticity in ecosystem services: Exploring the variable relationship between ecosystems and human well-being. Ecol. Soc. 2016, 21. [Google Scholar] [CrossRef]
  15. Burkhard, B.; Kroll, F.; Nedkov, S.; Müller, F. Mapping ecosystem service supply, demand and budgets. Ecol. Indic. 2012, 21, 17–29. [Google Scholar] [CrossRef]
  16. Plieninger, T.; Dijks, S.; Otero-Rozas, E.; Bieling, C. Assessing, mapping, and quantifying cultural ecosystem services at community level. Land Use Policy 2013, 33, 118–129. [Google Scholar] [CrossRef]
  17. Hegetschweiler, K.T.; de Vries, S.; Arnberger, A.; Bell, S.; Brennan, M.; Siter, N.; Olafsson, A.S.; Voigt, A.; Hunziker, M. Linking demand and supply factors in identifying cultural ecosystem services of urban green infrastructures: A review of European studies. Urban For. Urban Green. 2017, 21, 48–59. [Google Scholar] [CrossRef]
  18. Wirtschafts-Lexikon, G.; Hadeler, T.; Winter, E. Vollständig überarb. und aktualisierte Aufl; Gabler: Wiesbaden, UK, 2000. [Google Scholar]
  19. Pascual, U.; Balvanera, P.; Díaz, S.; Pataki, G.; Roth, E.; Stenseke, M.; Watson, R.T.; Başak Dessane, E.; Islar, M.; Kelemen, E.; et al. Valuing nature’s contributions to people: The IPBES approach. Curr. Opin. Environ. Sustain. 2017, 26, 7–16. [Google Scholar] [CrossRef]
  20. Murphy, R.; Narkiewicz, V. Are Price, Quality, and Value Mutually Exclusive? J. Glob. Bus. Manag. 2012, 8, 40–48. [Google Scholar]
  21. Grutters, J.P.C.; Kessels, A.G.H.; Dirksen, C.D.; van Helvoort-Postulart, D.; Anteunis, L.J.C.; Joore, M.A. Willingness to accept versus willingness to pay in a discrete choice experiment. Value Health 2008, 11, 1110–1119. [Google Scholar] [CrossRef]
  22. Johnston, R.J.; Rosenberger, R.S. Methods, Trends an Controversies in Contemporary Benefit Transfer. J. Econ. Surv. 2009, 26, 1. [Google Scholar] [CrossRef]
  23. Mendoza, G.A.; Prabhu, R. Development of a methodology for selecting criteria and indicators of sustainable forest management: A case study on participatory assessment. Environ. Manag. 2000, 26, 659–673. [Google Scholar] [CrossRef]
  24. Uhde, B.; Hahn, W.A.; Griess, V.C.; Knoke, T. Hybrid MCDA Methods to Integrate Multiple Ecosystem Services in Forest Management Planning: A Critical Review. Environ. Manag. 2015, 56, 373–388. [Google Scholar] [CrossRef]
  25. Garcia-Gonzalo, J.; Bushenkov, V.; McDill, M.; Borges, J. A Decision Support System for Assessing Trade-Offs between Ecosystem Management Goals: An Application in Portugal. Forests 2015, 6, 65–87. [Google Scholar] [CrossRef]
  26. Perman, R. Natural Resource and Environmental Economics, 4th ed.; Addison Wesley: Harlow, UK, 2011. [Google Scholar]
  27. Diaz-Balteiro, L.; Romero, C. Making forestry decisions with multiple criteria: A review and an assessment. For. Ecol. Manag. 2008, 255, 3222–3241. [Google Scholar] [CrossRef]
  28. Marques, S.; Marto, M.; Bushenkov, V.; McDill, M.; Borges, J. Addressing Wildfire Risk in Forest Management Planning with Multiple Criteria Decision Making Methods. Sustainability 2017, 9, 298. [Google Scholar] [CrossRef]
  29. Borges, J.G.; Garcia-Gonzalo, J.; Bushenkov, V.; McDill, M.E.; Marques, S.; Oliveira, M.M. Addressing Multicriteria Forest Management with Pareto Frontier Methods: An Application in Portugal. For. Sci. 2014, 60, 63–72. [Google Scholar] [CrossRef]
  30. Marto, M.; Reynolds, K.; Borges, J.; Bushenkov, V.; Marques, S. Combining Decision Support Approaches for Optimizing the Selection of Bundles of Ecosystem Services. Forests 2018, 9, 438. [Google Scholar] [CrossRef]
  31. Belton, V.; Stewart, T.J. Multiple Criteria Decision Analysis; An Integrated Approach, [Second Print.]; Kluwer: Boston, MA, USA, 2002. [Google Scholar]
  32. Feizizadeh, B.; Blaschke, T. GIS-multicriteria decision analysis for landslide susceptibility mapping: Comparing three methods for the Urmia lake basin, Iran. Nat Hazards 2013, 65, 2105–2128. [Google Scholar] [CrossRef]
  33. Tóth, S.F.; McDill, M.E.; Rebain, S. Finding the Efficient Frontier of a Bi-Criteria, Spatially Explicit, Harvest Scheduling Problem. For. Sci. 2006, 52, 93–107. [Google Scholar] [CrossRef]
  34. Bateman, I.J.; Harwood, A.R.; Mace, G.M.; Watson, R.T.; Abson, D.J.; Andrews, B.; Binner, A.; Crowe, A.; Day, B.H.; Dugdale, S.; et al. Bringing ecosystem services into economic decision-making: Land use in the United Kingdom. Science (New York, N.Y.) 2013, 341, 45–50. [Google Scholar] [CrossRef] [PubMed]
  35. Lawler, J.J.; Lewis, D.J.; Nelson, E.; Plantinga, A.J.; Polasky, S.; Withey, J.C.; Helmers, D.P.; Martinuzzi, S.; Pennington, D.; Radeloff, V.C. Projected land-use change impacts on ecosystem services in the United States. Proc. Natl. Acad. Sci. USA 2014, 111, 7492–7497. [Google Scholar] [CrossRef] [PubMed]
  36. Hanley, N.; Barbier, E. Pricing Nature. Cost-Benefit Analysis and Environmental Policy; Edward Elgar: Cheltenham, UK, 2009. [Google Scholar]
  37. Pascual, U.; Muradian, R.; Brander, L.; Gómez-Baggethun, E.; Martín-Lopez, B.; Verma, M.; Armsworth, P.; Christie, M.; Cornelissen, H.; Eppink, F.; et al. The Economics of Valuing Ecosystem Services and Biodiversity: Chapter 5. In The Economics of Ecosystems and Biodiversity: Ecological and Economic Foundations; Kumar, P., Ed.; Routledge: New York, NY, USA, 2012; pp. 183–256. [Google Scholar]
  38. Heal, G.M.; Barbier, E.B.; Boyle, K.J.; Covich, A.P.; Gloss, S.P.; Hershner, C.H.; Hoehn, J.P.; Pringle, C.M.; Polasky, S.; Segerson, K.; et al. (Eds.) Valuing Ecosystem Services. In Committee on Assessing and Valuing the Services of Aquatic and Related Terrestrial Ecosystems; National Academies Press: Washington, DC, USA, 2004; 291p. [Google Scholar]
  39. Secretariat of the Convention on Biological Diversity SCBD. The Value of Forest Ecosystems; CBD Technical Series no. 4; CBD: Montreal, QC, Canada, 2001; p. 59. [Google Scholar]
  40. Elsasser, P. Umweltökonomische Bewertung der Ökosystemleistungen von Wäldern—Methodik und Anwendungsperspektiven. In Erfassung und Bewertung von Ökosystemdienstleistungen—Erfahrungen insbesondere aus Deutschland und Russland; BfN-Skripten 373; BfN (Bundesamt für Naturschutz): Bad Godesberg, Germany, 2014; pp. 278–292. [Google Scholar]
  41. Johnston, R.J.; Rolfe, J.; Rosenberger, R.S.; Brouwer, R. Introduction to benefit transfer methods. In Benefit Transfer of Environmental and Resource Values: A Guide for Researchers and Practitioners; Johnston, R.J., Rolfe, J., Rosenberger, R.S., Brouwer, R., Eds.; Springer: Berlin, Germany, 2015; pp. 19–59. [Google Scholar]
  42. Uhde, B.; Heinrichs, S.; Stiehl, C.R.; Ammer, C.; Müller-Using, B.; Knoke, T. Bringing ecosystem services into forest planning—Can we optimize the composition of Chilean forests based on expert knowledge? For. Ecol. Manag. 2017, 404, 126–140. [Google Scholar] [CrossRef]
  43. Czajkowski, M.; Ahtiainen, H.; Artell, J.; Meyerhoff, J. Choosing a Functional Form for an International Benefit Transfer: Evidence from a Nine-country Valuation Experiment. Ecol. Econ. 2017, 134, 104–113. [Google Scholar] [CrossRef]
  44. Navrud, S. Comparing Valuation Exercises in Europe and the United States—Challenges for Benefit transfer and some Policy Implications: Chapter 4. In Valuation of Biodiversity Studies: Selected Studies; Organisation for Economic Co-Operation and Development: Paris, France, 2001; pp. 63–78. [Google Scholar]
  45. Spash, C.L.; Vatn, A. Transferring environmental value estimates: Issues and alternatives. Ecol. Econ. 2006, 60, 379–388. [Google Scholar] [CrossRef]
  46. Johnston, R.J.; Duke, J.M. Willingness to pay for land preservation across states and jurisdictional scale: Implications for benefit transfer. Land Econ. 2009, 85, 217–237. [Google Scholar] [CrossRef]
  47. Federal Office for the Environment. Waldpolitik 2020. Visionen, Ziele und Massnahmen für eine nachhaltige Bewirtschaftung des Schweizer Waldes; Federal Office for the Environment (FOEN): Bern, Switzerland, 2013. [Google Scholar]
  48. The Economics of Ecosystems and Biodiversity (TEEB). Ecosystem Services. Available online: http://www.teebweb.org/resources/ecosystem-services/ (accessed on 8 January 2019).
  49. Mace, G.M.; Norris, K.; Fitter, A.H. Biodiversity and ecosystem services: A multilayered relationship. Trends Ecol. Evol. 2012, 27, 19–26. [Google Scholar] [CrossRef]
  50. Liang, J.; Crowther, T.W.; Picard, N.; Wiser, S.; Zhou, M.; Alberti, G.; Schulze, E.-D.; McGuire, A.D.; Bozzato, F.; Pretzsch, H.; et al. Positive biodiversity-productivity relationship predominant in global forests. Science 2016, 354, 196–211. [Google Scholar] [CrossRef] [PubMed]
  51. Hungate, B.A.; Barbier, E.B.; Ando, A.W.; Marks, S.P.; Reich, P.B.; van Gestel, N.; Tilman, D.; Knops, J.M.H.; Hooper, D.U.; Butterfield, B.J.; et al. The economic value of grassland species for carbon storage. Sci. Adv. 2017, 3, e1601880. [Google Scholar] [CrossRef] [PubMed]
  52. Barbier, E.B. Valuing Ecosystem Services as Productive Inputs. Econ. Policy 2007, 22, 178–229. [Google Scholar] [CrossRef]
  53. Spangenberg, J.H.; Settele, J. Value pluralism and economic valuation—Defendable if well done. Ecosyst. Serv. 2016, 18, 100–109. [Google Scholar] [CrossRef]
  54. Interagency Working Group on Social Cost of Carbon, United States Government. Technical Support Document: Technical Update of the Social Cost of Carbon for Regulatory Impact Analysis—Under Executive Order 12866; Interagency Working Group on Social Cost of Carbon, United States Government: Washington, DC, USA, 2016.
  55. Mayer, M.; Woltering, M. Assessing and valuing the recreational ecosystem services of Germany’s national parks using travel cost models. Ecosyst. Serv. 2018, 31, 371–386. [Google Scholar] [CrossRef]
  56. Olschewski, R.; Bebi, P.; Teich, M.; Wissen Hayek, U.; Grêt-Regamey, A. Avalanche protection by forests—A choice experiment in the Swiss Alps. For. Policy Econ. 2012, 15, 108–113. [Google Scholar] [CrossRef]
  57. Hunziker, M.; Frick, J.; Bauer, N.; von Lindern, E.; Graf, O. Die Schweizer Bevölkerung und ihr Wald. Bericht zur zweiten Bevölkerungsumfrage Waldmonitoring Soziokulturell; WaMos2: Bern, Switzerland, 2013. [Google Scholar]
  58. Calder, I.; Hofer, T.; Vermont, S.; Warren, P. Towards a new understanding of forests and water. Unasylva 2007, 58, 3–10. [Google Scholar]
  59. Meylan, B. Der Wald sorgt für sauberes Trinkwasser. GWA 2003, 83, 3–11. [Google Scholar]
  60. Management des Grundwassers in der Schweiz. Leitlinien des Bundesamtes für Umwelt BAFU (FOEN); Federal Office for the Environment (FOEN): Bern, Switzerland, 2008. [Google Scholar]
  61. Olschewski, R.; Sandström, C.; Kasymov, U.; Johansson, J.; Fürst, C.; Ring, I. Challenges and opportunities in developing new forest governance systems—Insights from the IPBES assessment for Europe and Central Asia. For. Policy Econ. 2018, 97, 175–179. [Google Scholar] [CrossRef]
  62. Nelson, E.; Mendoza, G.; Regetz, J.; Polasky, S.; Tallis, H.; Cameron, D.R.; Chan, K.M.A.; Daily, G.C.; Goldstein, J.; Kareiva, P.M.; et al. Modeling multiple ecosystem services, biodiversity conservation, commodity production, and tradeoffs at landscape scales—Nelson—2009—Frontiers in Ecology and the Environment—Wiley Online Library. Front. Ecol. Environ. 2009, 7, 4–11. [Google Scholar] [CrossRef]
  63. Turkelboom, F.; Leone, M.; Jacobs, S.; Kelemen, E.; García-Llorente, M.; Baró, F.; Termansen, M.; Barton, D.N.; Berry, P.; Stange, E.; et al. When we cannot have it all: Ecosystem services trade-offs in the context of spatial planning. Ecosyst. Serv. 2018, 29, 566–578. [Google Scholar] [CrossRef]
  64. Brondízio, E.S.; Gatzweiler, F.W.; Zografos, C.; Kumar, M. The Socio-cultural Context of Ecosystem and Biodiversity Valuation: Chapter 4. In The Economics of Ecosystems and Biodiversity: Ecological and Economic Foundations; Kumar, P., Ed.; Routledge: New York, NY, USA, 2012; pp. 149–181. [Google Scholar]
  65. Binner, A.; Smith, G.; Bateman, I.; Day, B.; Agarwala, M.; Harwood, A. Valuing the Social and Environmental Contribution of Woodlands and Trees in England, Scotland and Wales; Forestry Commission Research Report; Forestry Commission: Edinburgh, UK, 2017; 112p.
  66. White, S.; ten Brink, P.; Simmons, B.; Furuta, N.; Liekens, I.; Ninan, K.; Meire, P.; Shine, C.; Tinch, R.; Wielgus, J. Recognizing the Value of Biodiversity: New Approaches to Policy Assessment. In The Economics of Ecosystems and Biodiversity in National and International Policy Making; Ten Brink, P., Ed.; Earthscan: London, UK, 2011; pp. 129–173. [Google Scholar]
  67. Knoke, T.; Paul, C.; Hildebrandt, P.; Calvas, B.; Castro, L.M.; Hartl, F.; Dollerer, M.; Hamer, U.; Windhorst, D.; Wiersma, Y.F.; et al. Compositional diversity of rehabilitated tropical lands supports multiple ecosystem services and buffers uncertainties. Nat. Commun. 2016, 7, 11877. [Google Scholar] [CrossRef] [PubMed]
  68. Bartkowski, B. Are diverse ecosystems more valuable? Economic value of biodiversity as result of uncertainty and spatial interactions in ecosystem service provision. Ecosyst. Serv. 2017, 24, 50–57. [Google Scholar] [CrossRef]
  69. Brudvig, L.A.; Damschen, E.I.; Tewksbury, J.J.; Haddad, N.M.; Levey, D.J. Landscape connectivity promotes plant biodiversity spillover into non-target habitats. Proc. Natl. Acad. Sci. USA 2009, 106, 9328–9332. [Google Scholar] [CrossRef] [PubMed]
  70. Costanza, R.; de Groot, R.; Sutton, P.; van der Ploeg, S.; Anderson, S.J.; Kubiszewski, I.; Farber, S.; Turner, R.K. Changes in the global value of ecosystem services. Global Environ. Change. 2014, 26, 152–158. [Google Scholar] [CrossRef]
  71. Kubiszewski, I.; Costanza, R.; Anderson, S.; Sutton, P. The future value of ecosystem services: Global scenarios and national implications. Ecosyst. Serv. 2017, 26, 289–301. [Google Scholar] [CrossRef]
  72. Boyle, K.J.; Kuminoff, N.V.; Parmeter, C.F.; Pope, J.C. The Benefit-Transfer Challenges. Annu. Rev. Resour. Econ. 2010, 2, 161–182. [Google Scholar] [CrossRef]
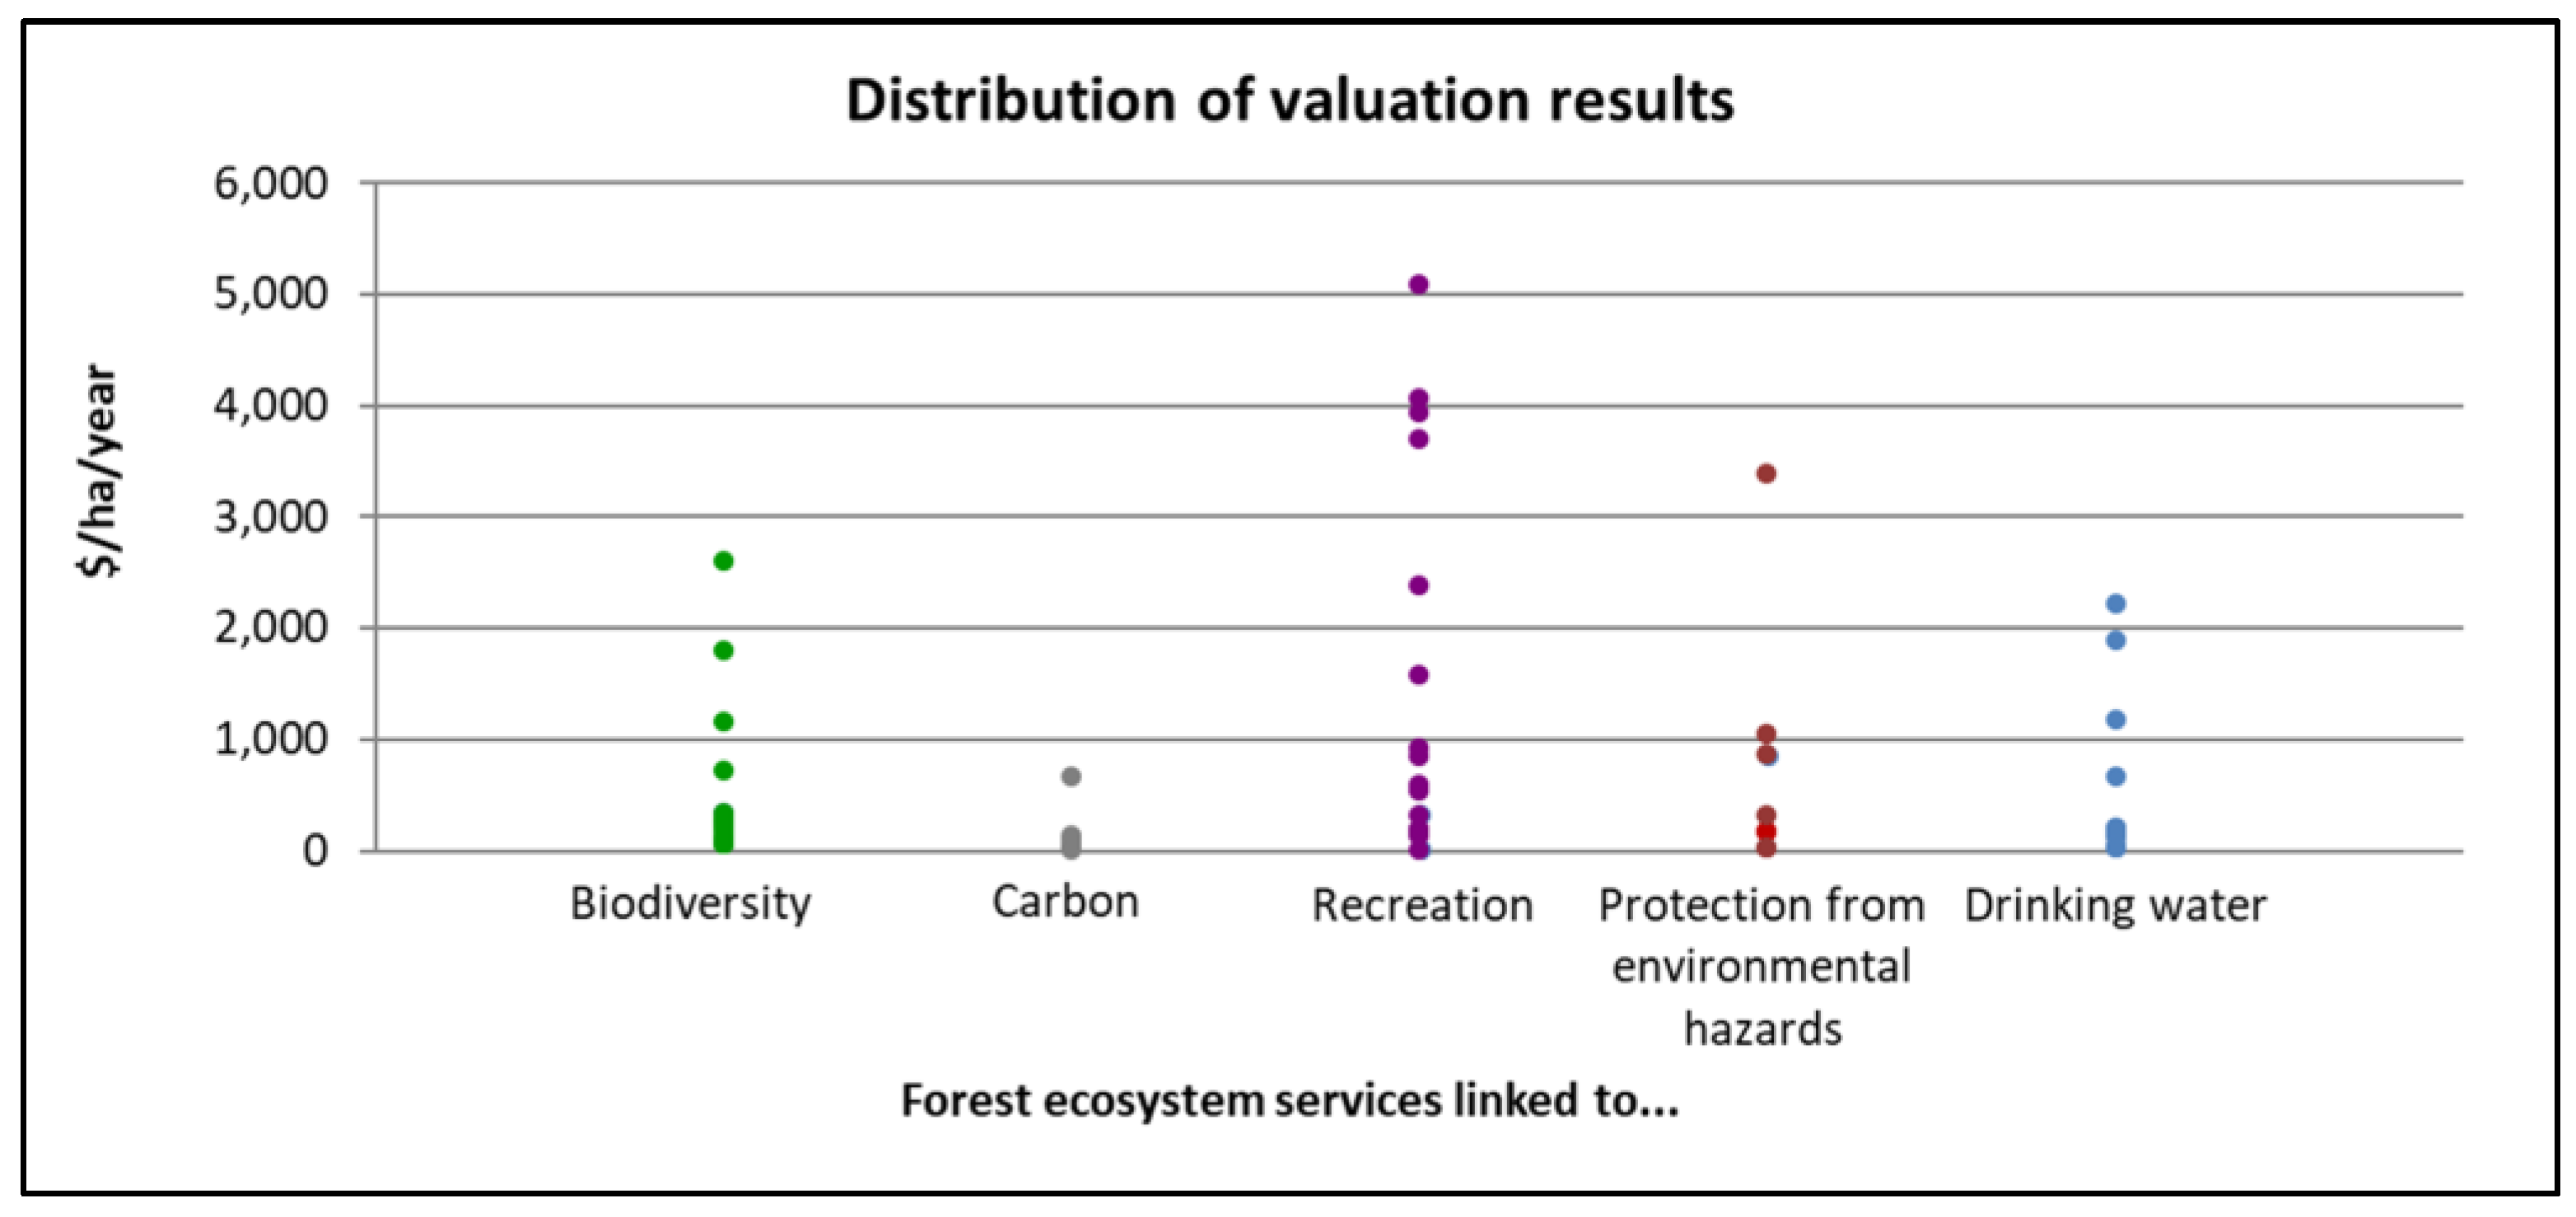
Figure 1. Interaction of ecosystem structures and processes (supply side) as well as ecosystem services and human well-being (demand side) [15] (p. 19, with alterations).
Forests 10 00132 g001
Figure 2. Confluence model: how supply and demand factors determine the use of cultural ecosystem services [17] (p. 49, adapted).
Forests 10 00132 g002
Figure 3. Combining different approaches (e.g., SWOT and multiple-criteria decision analysis, or MCDA) in a planning process [24] (p. 375, with alterations).
Forests 10 00132 g003
Figure 4. Overview of number and origin of the database’s valuation studies.
Forests 10 00132 g004
Figure 5. Distribution of economic valuation results extracted from the developed database. (Existing values above 6000 $/ha/year are omitted in the figure for presentation purposes).
Forests 10 00132 g005
Table 1. Distribution of values for recreational services of forests.
UnitMinimum ValueMaximum ValueRange of Majority of Values
USD/person/year417864–140 (79% of values)
USD/ha/year2507386–910 (58% of values, 21% below 10, 21% between 2177–3970)
USD/visit11471–50 (92%)

