Article

Dendroclimatic Assessment of Ponderosa Pine Radial Growth along Elevational Transects in Western Montana, U.S.A.

1
Department of Geography, Environment, and Society, University of Minnesota, 267 19th Ave S, Minneapolis, MN 55455, USA
2
Department of Geography and Planning, Appalachian State University, P.O. Box 32066, Boone, NC 28608, USA
3
Department of Geography, Environment, and Sustainability, University of North Carolina at Greensboro, 237 Graham Building P.O. Box 26170, Greensboro, NC 27402, USA
4
Department of Geography, Indiana University, 701 E Kirkwood Ave, Bloomington, IN 47405, USA
*
Author to whom correspondence should be addressed.
Forests 2019, 10(12), 1094; https://doi.org/10.3390/f10121094
Submission received: 11 November 2019 / Accepted: 25 November 2019 / Published: 2 December 2019
(This article belongs to the Special Issue Alpine and Polar Treelines in a Changing Environment)

Abstract

:
Ponderosa pine (PP) is the most common and widely distributed pine species in the western United States, spanning from southern Canada to the United States–Mexico border. PP can be found growing between sea level and 3000 meters elevation making them an ideal species to assess the effects of changing climatic conditions at a variety of elevations. Here we compare PP standardized and raw growth responses to climate conditions along an elevational transect spanning 1000 meters in western Montana, U.S.A., a region that experienced a 20th century warming trend and is expected to incur much warmer (3.1–4.5 °C) and slightly drier summers (~0.3 cm decrease per month) by the end on the 21st century. Specifically, we assess if there are climate/growth differences based on relative (i.e., site-specific) and absolute (i.e., combined sites) elevation between groups of trees growing in different elevational classes. We find that values of the Palmer drought severity index (PDSI) in July are most strongly related to radial growth and that within-site elevation differences are a poor predictor of the response of PP to either wet or dry climatic conditions (i.e., years with above or below average July PDSI values). These results suggest that any generalization that stands of PP occurring at their elevational margins are most vulnerable to changing climatic may not be operative at these sites in western Montana. Our results show that when using standardized ring widths, PP growing at the lowest and highest elevations within western Montana exhibit differential growth during extreme climatological conditions with lower-elevation trees outperforming higher-elevation trees during dry years and vice versa during wet years.

1. Introduction

Ponderosa pine (PP; Pinus ponderosa var. ponderosa Lawson and C. Lawson) is a geographically diverse, ecologically significant, and economically important tree species in western North America. In the Northern Rockies, U.S.A., PP occurs from approximately 700–2300 m elevation, making it not only a widespread species but one that also has an extensive altitudinal gradient [1,2]. Along the elevational gradient, significant climatic differences exist, with the warmest and driest conditions occurring at the lowest elevations and progressively cooler and wetter conditions with increasing elevation. Global circulation models for the Northern Rockies predict substantially warmer (3.1–4.5 °C) and slightly drier (~0.3 cm decrease per month) conditions in the next several decades [3,4,5,6,7] and these future conditions create an impetus to examine the historical responses of this dominant coniferous tree to changing climate and atmospheric composition.
If climatic change in the Northern Rockies [5,6,7,8,9] continues, regional PP forests likely will experience more frequent summer drought conditions. Prior work with PP in this region has demonstrated that the growth of PP is positively related to wetter and cooler conditions during the spring and summer months [10,11,12,13]. Thus, warmer conditions and more frequent droughts should negatively impact overall forest productivity. But the question remains as to what degree and, more importantly, which individuals will be most impacted? Are PP growing at the lowest elevations the most prone to growth declines or mortality because they grow along the climatic margin for survivability?
In a broad synthesis of research examining relationships between changing climate and tree mortality, Allen et al. [14] reported that the evidence linking recent increases in temperature and the frequency/severity of drought is associated with increasing tree senescence in multiple ecosystems worldwide. More specifically, McDowell et al. [15] (p. 399) reported that PP growing at lower elevations are more likely to exhibit “chronic water stress” and thus are more likely to die during periods of drought, with long-term implications for PP ecosystem modifications if the vectors for increasing aridity are manifest. Ganey et al. [16], hypothesized similar outcomes to McDowell et al. [15] in that tree senescence would be greatest at the low elevation sites as they are more frequently stressed by a combination of high temperature and limited moisture availability. Ganey et al. [16] examined mortality rates of multiple species within mixed PP forests that had experienced high rates of senescence in recent decades yet found that senescence was not closely linked with elevation. Tague et al. [17] examined rates of PP mortality and productivity along elevational transects to determine if models incorporating carbon allocation and hydroclimatic parameters can be used to understand spatial patterns of drought-induced tree senescence along elevational transects. Their elevation-specific results are mixed. They noted that net primary productivity (NPP) at high sites is greater largely due to higher precipitation rates and greater moisture storage at high elevations. However, the relationship between NPP and precipitation was similarly strong at both high and low elevation sites. They concluded that spatiotemporal patterns of temperature and moisture are strongly controlled by elevation and equally important in modeling the probability of tree senescence. While Lloret et al. [18] noted that climate change, which is manifest through warming and increasing drought frequency, is related to tree senescence globally. They found that rates of radial growth recovery for PP following drought are largely unchanged through time. They concluded that, long-term, climate change-induced senescence is not closely related to decreasing resilience but is rather controlled by tree reactions to specific events (e.g., an individual drought).
Previous work leaves the question: Could it be that many of these low-elevation PP populations already possess distinct characteristics that would confer climatically marginal populations an advantage over those PPs growing in the cooler and wetter conditions that exist with increasing elevation? Elevation has been identified as a key component regulating the growth of PP [19,20] with physiologic plasticity suggested as a means by which individuals adapt to elevational heterogeneity [20]. The degree to which the persistence of a species is influenced by local adaptation and/or phenotypic plasticity across populations could be critical to understanding the impact of climate change on overall populations [21].
Here, we address these climate/growth-response questions and discrepancies in the literature based on a dendrochronological sampling of PP along vertical transects in western Montana. We hypothesize there are differences in the climate-growth response of PP across elevational classes. Specifically, we posit that trees growing at lower elevations will exhibit a greater sensitivity to drought and an overall decline in radial growth. To investigate this hypothesis we: (1) assess drivers of PP radial growth at three study sites in western Montana; (2) compare standardized ring width of PP to climate along study-site specific elevational transects (i.e., relative elevation); and (3) investigate PP growth in response to varying extreme climatic conditions along an integrated elevational transect (i.e., absolute elevation).

2. Materials and Methods
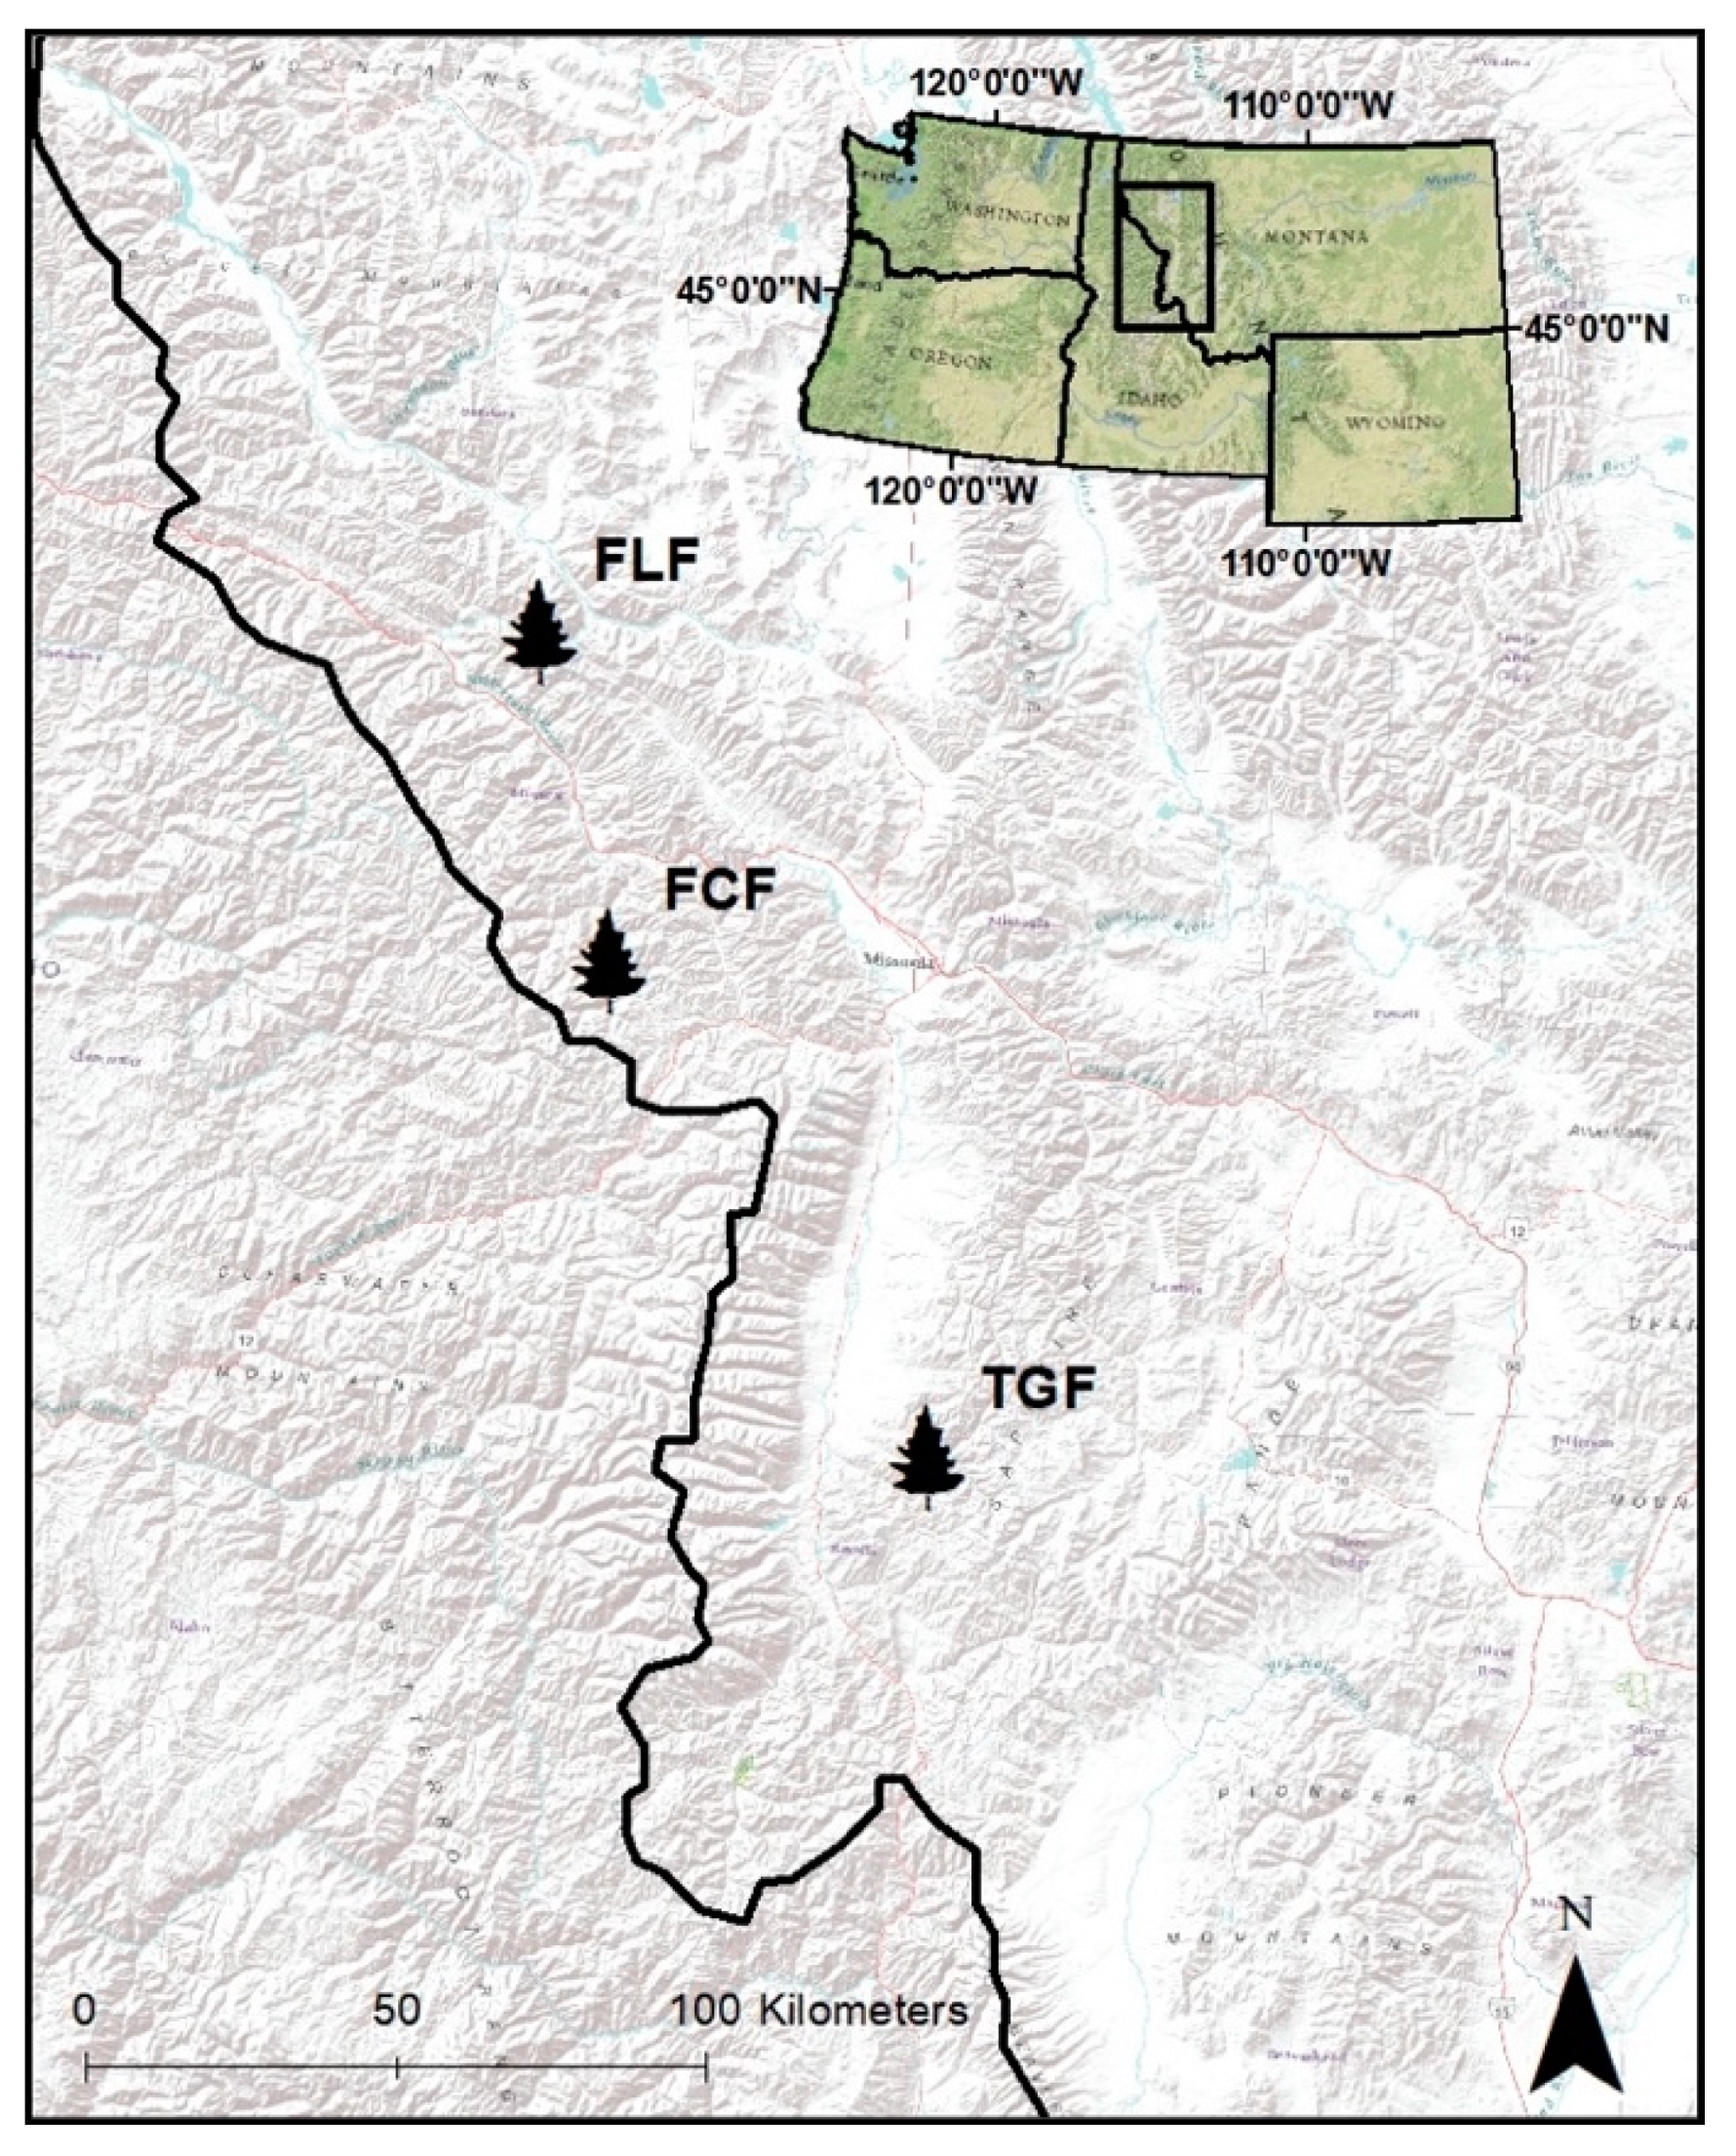
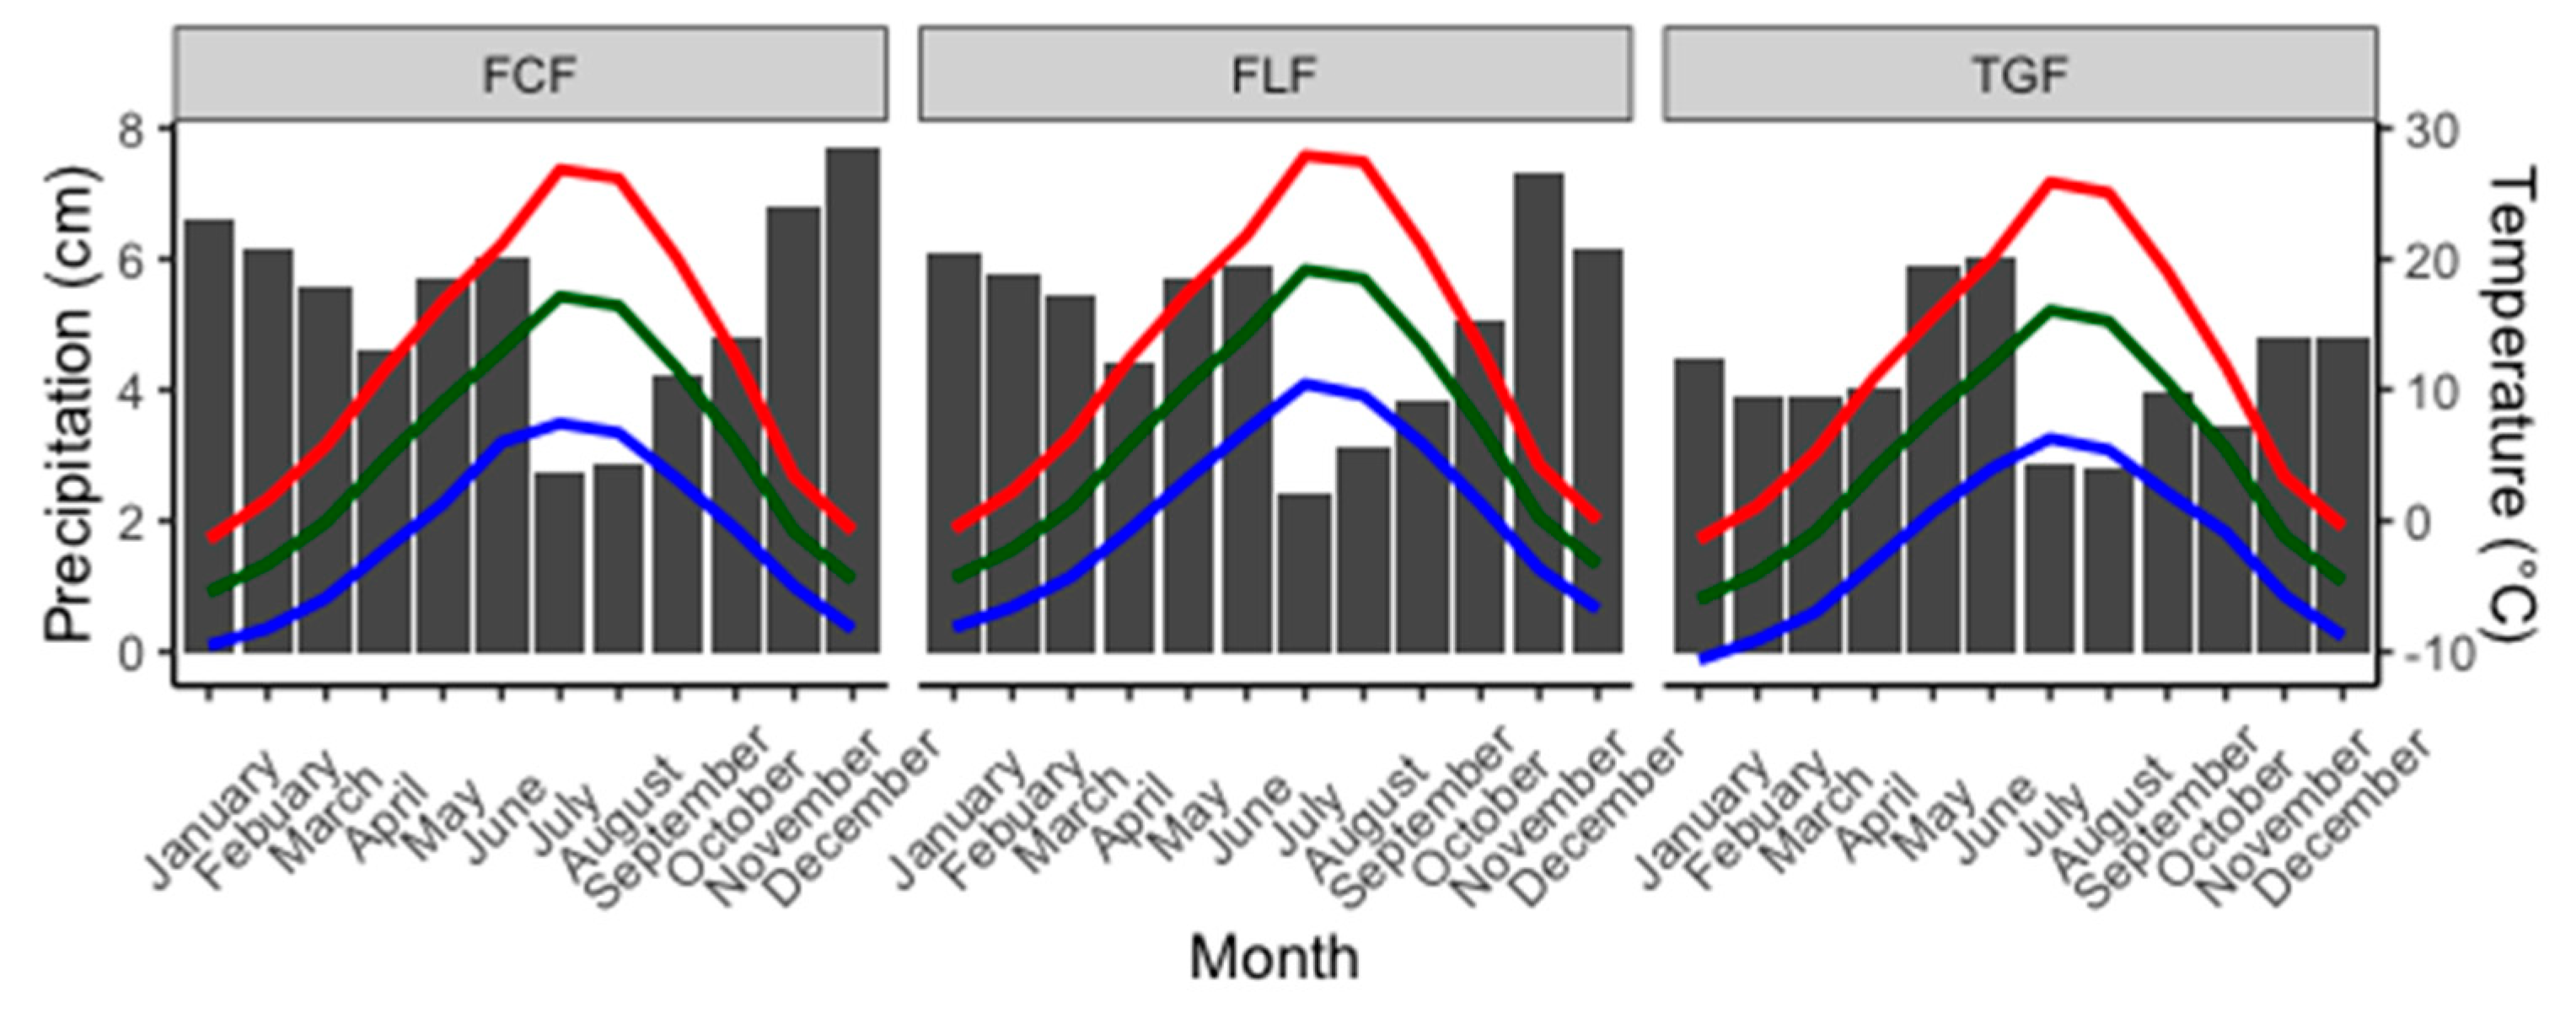
2.1. Study Area

We collected samples from mature PP trees at three south- to southwest-facing sites in the northern Rockies of western Montana (Figure 1). All sites consisted of mixed open-canopy woodlands of PP and Douglas-fir (Pseudotsuga menziesii var. glauca (Mirb.) Franco)) and, when combined, allowed for sampling along an elevational transect of approximately 1020 m. Our sites were selected based on two principal criteria. First, PP growing on southerly slopes are more likely to experience summertime soil-moisture deficits than other aspects. Thus, the potential radial-growth effects of warmer, drier summers should be first apparent at these locations. Second, we sought to minimize the potential effects of human agency that could act as confounding factors in our analysis and selected sites with known histories of limited anthropogenic activity. Ferry Landing (FLF) is designated as a Research Natural Area in part because of a history of minimal disturbance (e.g., logging, grazing) [22], while our two other sites, Fish Creek (FCF) and The Grove (TGF), also have a history of minimal disturbance (personal communication, Steve Shelly—USFS). At each location, we began sampling at the slope base but above the height of permanent water sources and selected trees at approximately equally spaced intervals that allowed for at least 30 trees between the base and the ridgeline. Elevation ranged from ~800 m to ~1500 m at FLF with a mean elevation of ~1125 m, from ~1050 m to ~1500 m at FCF with a mean elevation of ~1250 m, and from ~1350m to ~1800 m at TGF with a mean elevation of ~1550 m. All sites experience Humid Continental climates on the Köppen system, and we present precipitation and temperature data from PRISM [23] to characterize climatic variability between sites. For each tree, we extracted two core samples at breast height (~1.3 m) using increment borers. We selected only trees with no canopy overlap to minimize potentially confounding growth effects from neighboring trees. We also avoided sampling any trees with large fire scars, broken tops, lightning strikes, dwarf mistletoe (Arceuthobium spp.), or other disturbances that could have impacted radial growth.

2.2. Chronology Development

We used standard techniques to process the core samples [24]. We sanded the core samples until the cellular structure was clear under magnification and then used the list method for cross-dating [25]. We measured the individual ring-widths using WinDENDRO to 0.001 mm accuracy [26]. We used COFECHA [27] to confirm the accuracy of cross-dating.
We used a two-thirds smoothing spline to standardize our chronologies based on previous PP tree-ring studies [28,29] and because of potential forest disturbances (i.e., fire) in the region. While the biological growth in western trees is often modeled as negative exponential, stand-specific disturbances have the ability to under- or over-fit such curves. Cook and Peters [30] proposed the smoothing spline as an alternative method to negative exponential curves to accurately model tree growth in closed-canopy or disturbed forest types. In conjunction with our standardized chronologies, we retained raw radial growth rates to examine differences between biological growth at high and low elevations during wet and dry periods.
To assess climate response, we used three standardized chronologies (i.e., FLF_ALL, FCF_ALL, TGF_ALL), which contained as many core samples from the site that we were able to successfully cross-date (Table 1). At each site, we created two elevational classes (i.e., FLF_TOP, FLF_BOTTOM, etc.) that contained samples from the top and bottom ten trees (Table 1). We combined our trees into one elevational chronology using absolute elevation (ALL). From the ALL chronology, we divided the trees into two elevational classes, with 30 trees per group, and created combined chronologies (ALL_TOP and ALL_BOTTOM; Table 1).

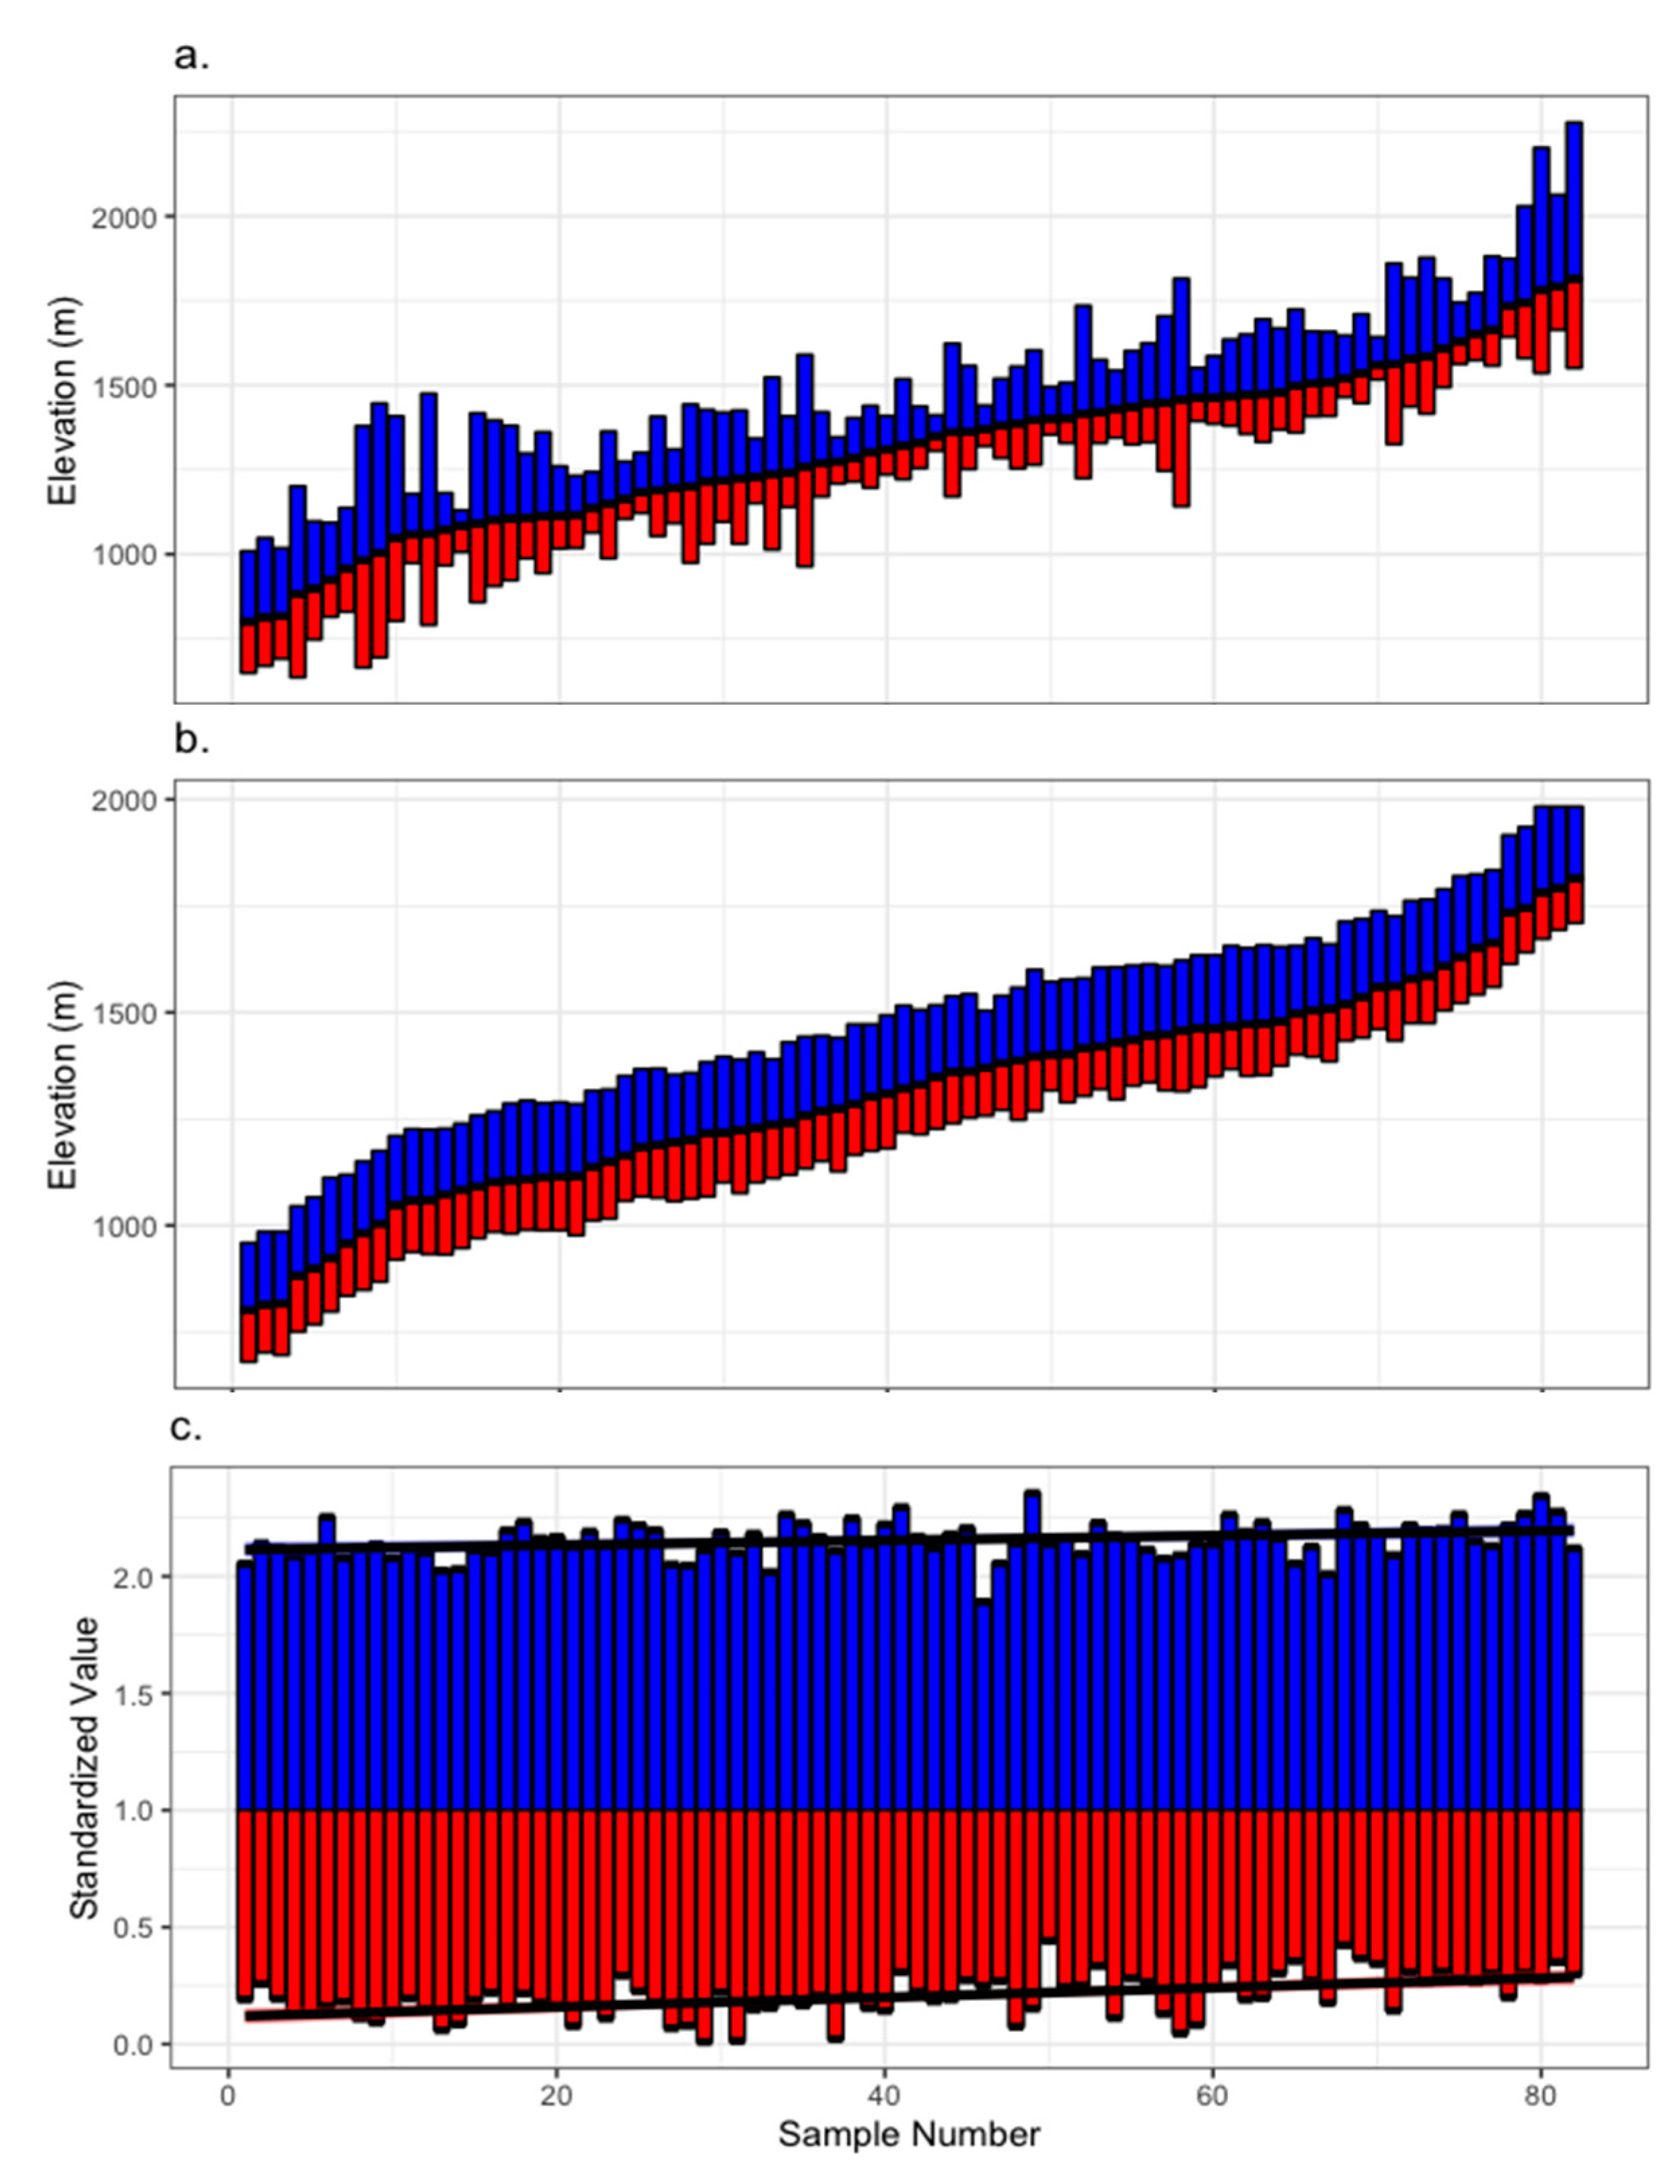
2.3. Statistical Analysis
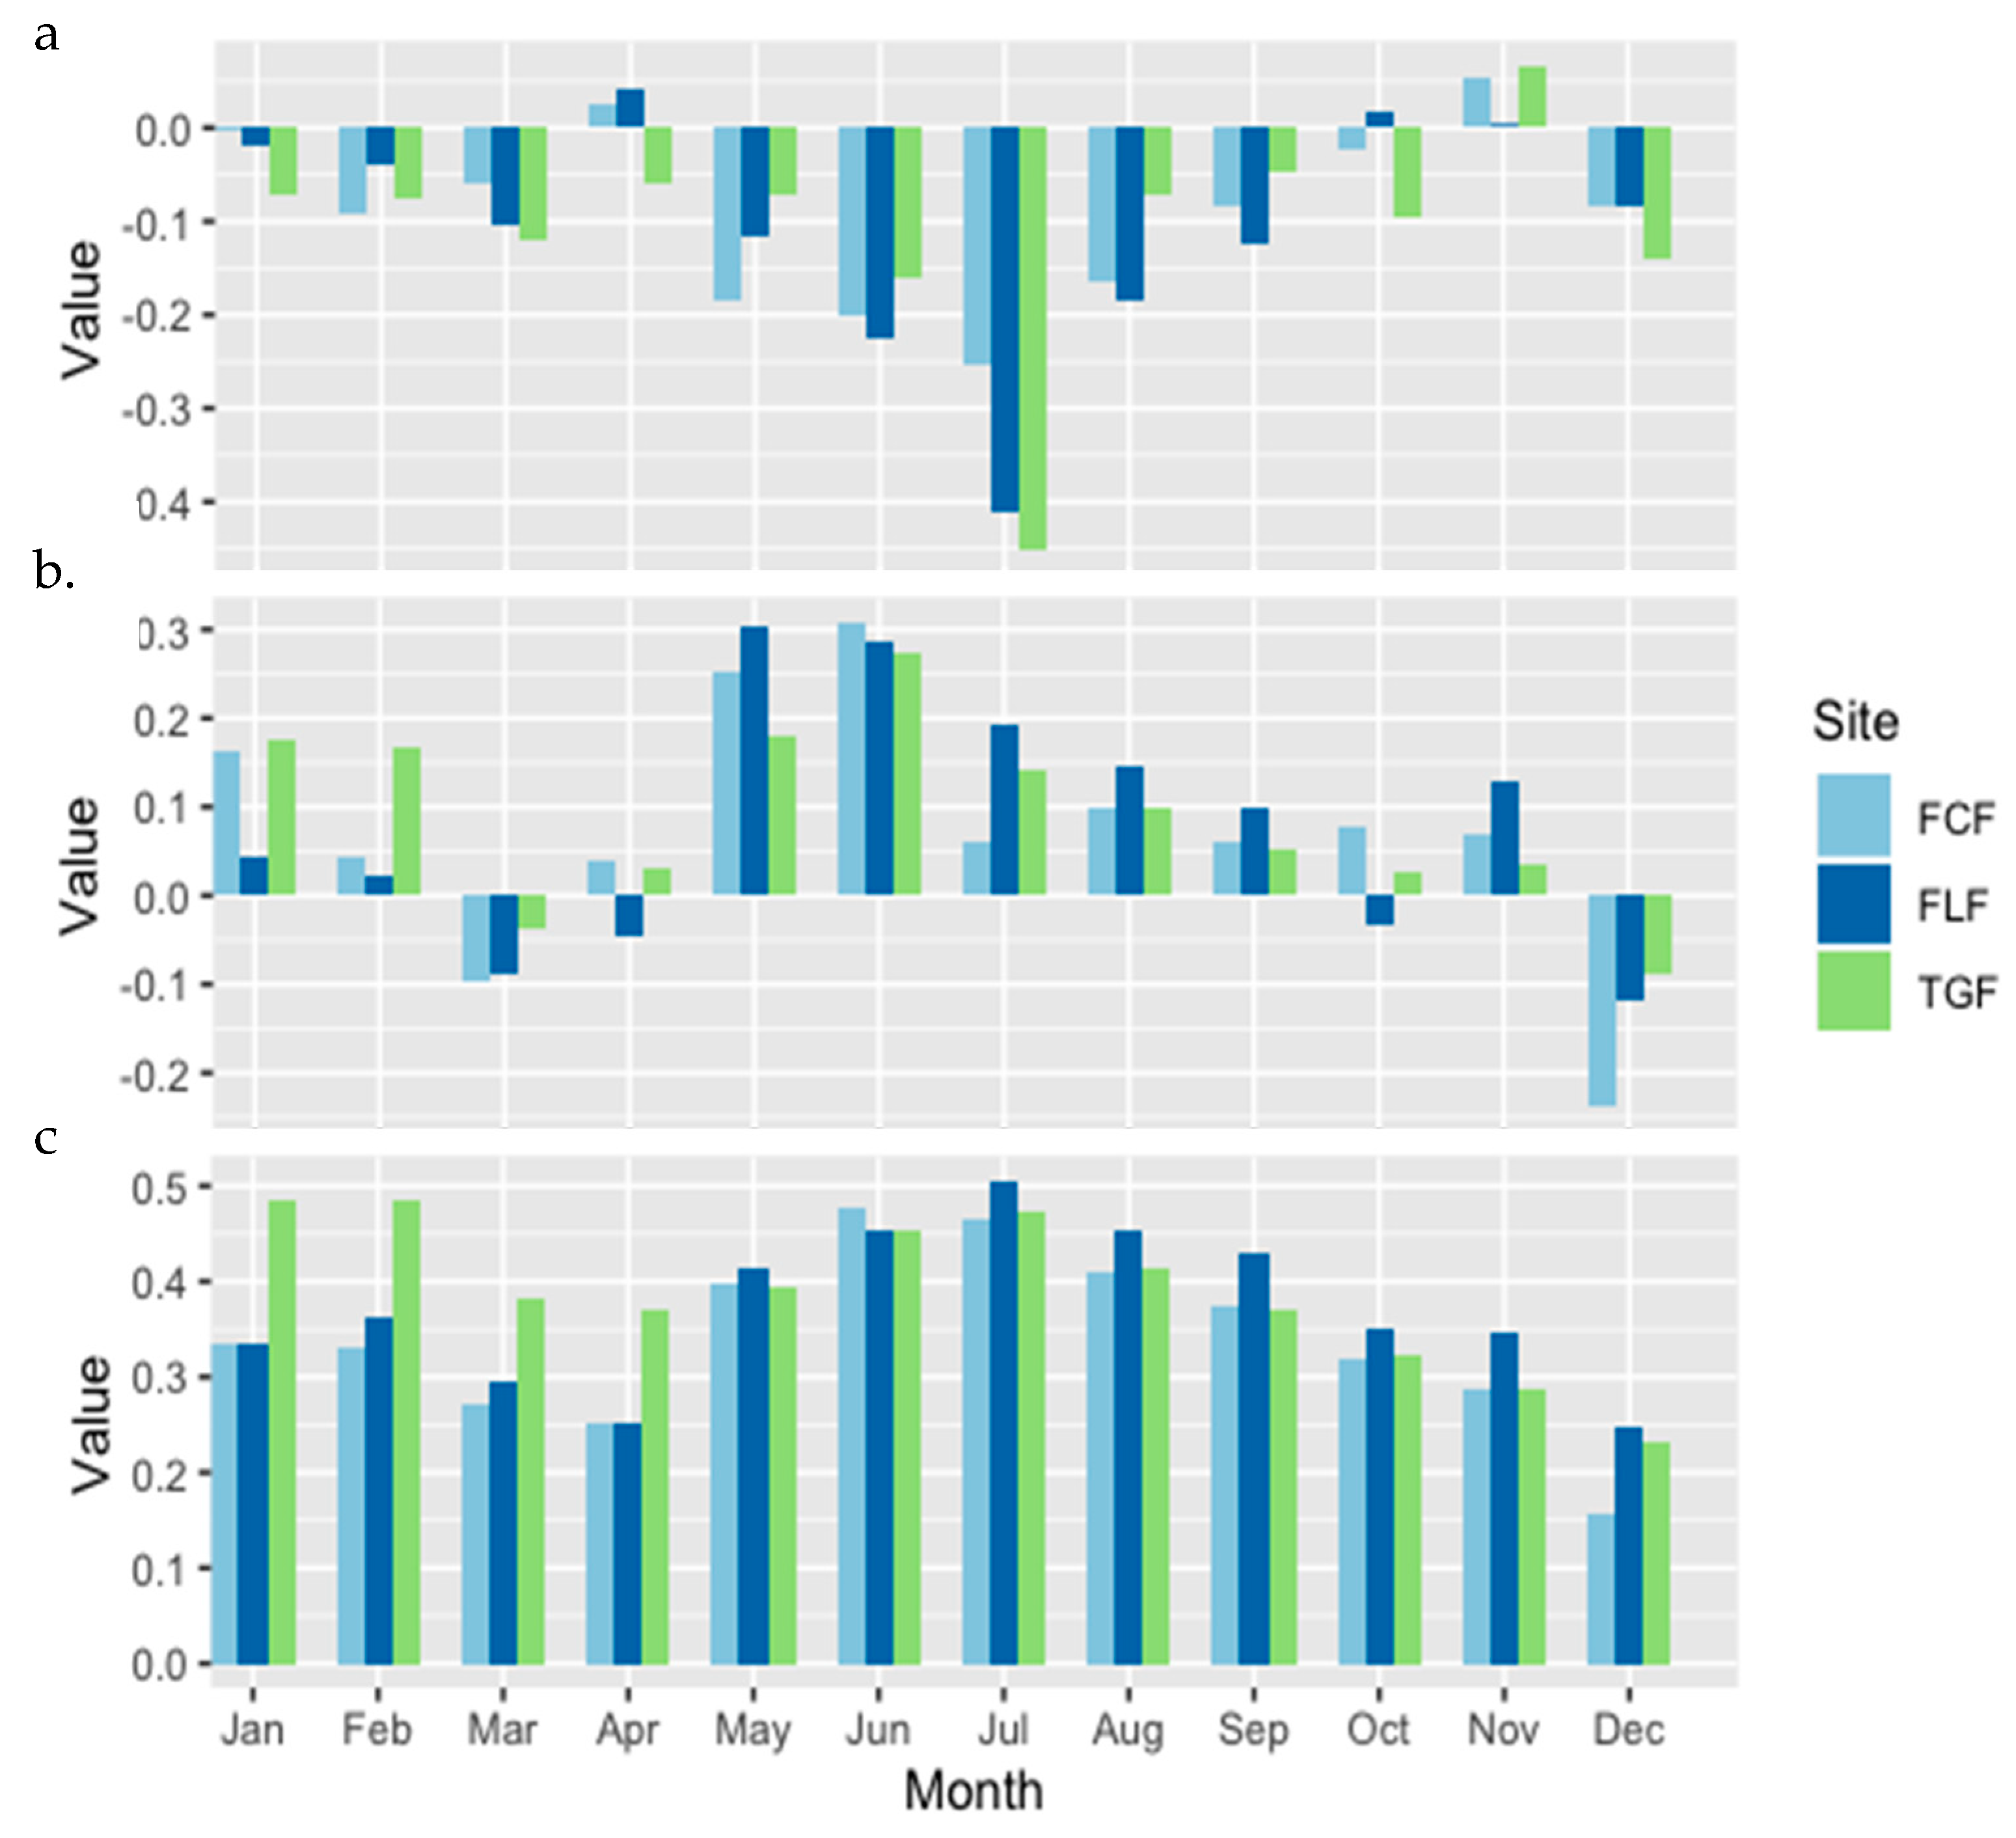
We searched for the primary climate drivers of standardized radial growth at the three sites using Spearman correlation between the ALL chronologies and monthly temperature, precipitation, and Palmer drought severity index (PDSI) data [31] from Montana Climate Division 1 from 1895–2011. The PDSI is a water balance-based measure of drought severity and considers antecedent moisture conditions for several months, with negative values representing dry conditions and positive values representing wet conditions [31]. We then compared the climate response for these primary climate drivers of temperature, precipitation, and PDSI between the TOP and BOTTOM (site-specific and ALL) chronologies using Spearman correlation and determined if there were significant differences in the overall strongest monthly relationships across the three sites using a Fisher’s z-test. Specifically, we tested for significant differences in the climate/growth relationships between TOP and BOTTOM for temperature, precipitation, and PDSI using values from the month that produced the consistently highest Spearman r-values across the three sites (e.g., for PDSI this was the month of July).
We investigated if there was an elevational bias in PP growth (i.e., top trees had a modified growth rate when warm/dry or cool/wet conditions were present) during 1895–2011. To do this, we examined raw radial growth and standardized growth of individual trees during years when the July PDSI value was >2 (wet) and <−2 (dry). Although two cores were collected per tree when field sampling, the inability to cross-date a sample or visible core damage often precludes that core from being included in the final chronology. This creates a scenario in which some trees have one core sample while other trees have two. In instances when two cores were present, we calculated the average growth rate between the two samples during wet and dry periods. We then compared the average raw and standardized growth per tree for wet and dry years to elevational positioning using Spearman correlation. Lastly, we performed a Mann–Whitney U Test between trees growing at the top and bottom portions of our combined elevational transect (i.e., ALL_TOP and ALL_BOTTOM) chronologies during wet and dry periods in Montana Climate Division 1.

3. Results

Minimal differences exist in macroscale climatic conditions among the three study sites (Figure 2). As expected, the highest site (TGF) is the coldest, and the lowest site (FLF) is the warmest. Small differences in monthly precipitation totals are present with FCF receiving the greatest amount of annual precipitation (~63 cm), while TGF receives the least amount of annual precipitation (~51 cm).
Our investigation of the relationships between standardized growth and monthly measures of climate shows that moisture availability in mid-summer (i.e., July PDSI) is the principal driving force of PP growth. PP respond negatively to mid-summer temperatures and positively to precipitation (Table 2; Figure 3). For PDSI, the strongest relationships occur in the month of July. Since PDSI values in each month are partially dependent on moisture supply and demand in the preceding months [31], there is a cumulative component to the climate response for PP.
The overall (i.e., all trees in the site level chronology) climate response is comparable across the three study sites (Table 2). While small differences exist between sites when the analyses are divided into TOP and BOTTOM groupings of trees (Table 2), the Fisher z-test results showed there were no significant differences (p < 0.05) in the climate/growth relationships between TOP and BOTTOM trees for the strongest monthly relationship for each climate variable.
The ALL chronology (i.e., the chronology based on absolute elevation) reveals a significant and similar association with the same climatic variables discussed at the specific site level (Table 3). The Fisher z-test resulted in no significant difference in climate response between ALL_TOP and ALL_BOTTOM groupings along the combined elevational transect. When correlating (Spearman) raw radial growth of trees along the combined transect to elevation during wet and dry (PDSI > 2; PDSI < −2) conditions, we found no significant association. However, for standardized radial growth values, we found that low elevation trees have significantly (p < 0.001) higher radial growth than higher elevation trees during dry periods, and high elevation trees have significantly (p < 0.003) greater radial growth than low elevation trees during wet periods (Figure 4). Lastly, our Mann–Whitney U Test used to compare the difference in means of high and low groupings resulted in significant differences between both dry (p = 0.000) and wet periods (p = 0.014).

4. Discussion

While slight differences exist in site-specific climatic conditions (Figure 2), the temperature patterns are logical (i.e., temperature decreased with elevational increase). We expected the highest annual precipitation at TGF due to the combination of higher elevation and orographic lifting processes, but the PRISM data suggest this location receives slightly less precipitation than FCF and FLF. This is likely a function of the location of TGF, east of the spine of the Bitterroot Mountain range, resulting in a rain shadow effect. (Figure 1). Although there are small site differences in precipitation and temperature, the overall climate response of trees is congruent (Figure 3; Table 2 and Table 3). For change detection, a Mann–Kendall trend test showed that temperatures in Montana Climate Division 1 have a significant positive trend over the last 50-years (1862–2011; p = 0.025), but no trends were evident over both longer (1895–2011; p = 0.439) or shorter periods (1982–2011; p = 0.080). We also found no trends at 30-, 50- or the 117-year periods in precipitation or PDSI in Montana Climate Division 1, so the increasing temperatures have not translated into increasing aridity as measured via a water balance-based metric (i.e., the PDSI). However, summer temperature in the region is projected to continue to increase, and precipitation is projected to decrease [3,4,5,6,7]. If this occurs, PP in the region will experience increasing aridity during the growing season in future decades.
Raw radial growth patterns during dry and wet years in Montana Climate Division 1 have no directional relationship based on elevation (Figure 4a). For example, there is no propensity for lower (higher) elevation trees to grow faster than higher (lower) elevation trees during dry (wet) periods. The only discernible pattern is that trees with the highest rates of radial growth are growing faster than trees with the lowest rates during both wet and dry periods. Although all of our sampled trees were mature, this could be a function of declining radial growth with tree age. However, when assessing standardized radial growth based on absolute elevation during wet and dry years, distinct trends exist within the data (Figure 4b,c). The pattern reveals that, collectively, higher elevation trees outperform lower elevation trees during wet periods, and lower elevation trees outperform higher elevation trees during dry periods (Figure 4).
Both prior work (e.g., [13]) and our results (Figure 3) demonstrate that PP is positively related to wetter and cooler conditions during the spring and summer months. Thus, warmer, drier conditions and more frequent droughts should negatively impact overall forest productivity, and PP growing at the lowest elevations may be the most prone to growth declines or mortality because they grow along the climatic margin for survivability [15]. Conversely, these low-elevation populations may already possess distinct characteristics, such as exceptional water-use efficiency, that would confer climatically marginal populations an advantage over those PPs growing in the cooler and wetter conditions that exist with increasing elevation. Specifically, the ability to withstand xylem cavitation is often a characteristic of individuals growing in the more xeric portion of a species range [32], and individuals may experience decreasing growth response to drought with increasing elevation [33]. Elevation has been identified as a key component regulating the growth of PP, with physiologic plasticity suggested as a means by which individuals adapt to elevational heterogeneity [21]. Our findings suggest this interpretation is correct, but only across wider ranges of elevation than are typically encountered by PP trees growing on site-specific elevational transects.
Previous research has found that increased water stress and aridity are projected to lead to more mortality and senescence of PP growing at low elevations in the western United States [14,34,35]. The results of our study, however, suggest that this generalization may not be operational in the northern Rocky Mountains of western Montana. One plausible explanation for our differing results is the location of our study sites. Lascoux et al. [36] documented a divergence of PP approximately 250,000 years ago into two varieties: eastern and western. These varieties moved northward over time and reconvened in what Latta and Mitton [37] (p. 769) described as “west-central Montana”. Latta and Mitton [37] (p. 769) further noted that at this transition zone, “gene flow between the two varieties will introduce genes to potentially different adaptive regimes. The varieties are interfertile…”. This finding suggests that PP growing in the transition zone may possess certain genetic adaptations that allow for greater resiliency in a changing climate, and this might explain why trees from our study sites reveal differing broader climate responses to changing climatic conditions.
Detecting and/or modeling PP health/mortality, specifically at lower elevations, in response to warmer and drier climate conditions in the western United States, has been successful [15,34]. For example, Van Mantgem et al. [34] modeled tree mortality rates across 76 forest plots in western North America. They found significant increases in mortality rates through time in all regions and species, across all diameter classes of trees, and at all elevations. For elevation, they found the greatest increases in mortality in the mid-elevation ranges (1000–2000 m). However, other investigations of PP health have been unable to either detect or confidently make linkages to large-scale climate change. For example, McCullough et al. [38] investigated the climate response of 161 PP chronologies by grouping sites with similar climate response. They generally found that trees growing in the more western populations were overall less sensitive to climate than eastern populations. More importantly, McCullough et al. [38] suggested that making generalizations about a species that occupies large elevation and spatial gradients comes at the risk of oversimplification. They concluded by saying they believe that most PP ecosystems will experience changing climate regimes, yet the responses of trees will be based on local conditions. Our findings, which show no within-site difference in climate-growth or growth-elevation responses, but do show elevational differences when trees across a wider range of elevations are grouped, suggest that local (i.e., site-specific) environmental differences are less important to PP radial growth rates than those experienced over a wider range.

5. Conclusions

PP occupy large elevational gradients in the western United States, making it an ideal species to investigate the elevational effects of a changing climate. Previous research has indicated that PP exhibit physiologic plasticity, which enables the species to express elevational heterogeneity in climate response [21]. Thus, PP trees growing in lower elevations should be better adapted to withstand warm, dry periods while trees at high elevations are better suited for cool, wet conditions. Our primary conclusions are that: (1) when examining raw ring widths, no elevational bias in growth response occurs during either wet or dry years; (2) standardized radial growth of PP does exhibit significant climate-growth responses that are dependent on elevation, but only when considering broader elevation ranges of trees that are typical of the ranges found from valley bottom to ridge top in Western Montana with lower elevation trees outperforming higher elevation trees during dry periods; and, (3) the results using both raw and standardized data suggest that lower elevation trees may be able to successfully adapt to the projected 21st century summertime climatic changes (i.e., warmer and drier) within the region.

Author Contributions

E.E.M. assisted with methodology development, formal analysis, investigation, writing—original draft preparation and writing—review and editing, as well as visualization. P.T.S. was a part of conceptualization, methodology development, writing—original draft preparation, writing—review and editing, and supervision. P.A.K. assisted with conceptualization, methodology development, writing review and editing, and supervision. J.T.M. assisted with conceptualization, methodology development, and writing—review and editing.

Funding

Funding was provided by a University Research Council grant from Appalachian State University, and by a Proposal Preparation Program grant from the University of North Carolina, Greensboro.

Acknowledgments

We thank Steve Shelly of the United States Forest Service for site selection and fieldwork assistance and David Austin, Lindsay Cummings, Thomas Patterson, and Phil White for fieldwork and laboratory assistance.

Conflicts of Interest

The authors declare no conflict of interest.

References

  1. Pinus ponderosa—The Gymonsperm Database. Available online: https://www.conifers.org/pi/Pinus_ponderosa.php (accessed on 2 September 2019).
  2. Plant Guide. Available online: https://plants.usda.gov/plantguide/pdf/pg_pipo.pdf (accessed on 7 September 2019).
  3. Joyce, L.A.; Talbert, M.; Sharp, D.; Stevenson, J. Historical and Projected Climate in the Northern Rockies Region. In Climate Change and Rocky Mountain Ecosystems. Advances in Global Change Research; Halofsky, J., Peterson, D., Eds.; Springer: New York, NY, USA, 2018; pp. 17–23. [Google Scholar]
  4. Littell, J.S.; McKenzie, D.; Kerns, B.K.; Cushman, S.; Shaw, C.G. Managing uncertainty in climate-driven ecological models to inform adaptation to climate change. Ecosphere 2011, 9, 1–19. [Google Scholar] [CrossRef]
  5. Riley, K.L.; Loehman, R.A. Mid-21st-century climate changes increase predicted fire occurrence and fire season length, Northern Rocky Mountains, United States. Ecosphere 2016, 7, 1–19. [Google Scholar] [CrossRef]
  6. Keane, R.E.; Mahalovich, M.F. Effects of Climate Change on Forest Vegetation in the Northern Rockies Region. Aspen Bibliogr. 2018, 374, 128–273. [Google Scholar]
  7. Whitlock, C.; Cross, W.; Maxwell, B.; Silverman, N.; Wade, A.A. Montana Climate Assessment; Montana Institute on Ecosystems, Montana State University and University of Montana, Bozeman and Missoula: Missoula, MT, USA, 2017. [Google Scholar]
  8. Westerling, A.L.; Hidalgo, H.G.; Cayan, D.R.; Swetnam, T.W. Warming and earlier spring increase western US forest wildfire activity. Science 2006, 5789, 940–943. [Google Scholar] [CrossRef]
  9. Hamlet, A.F.; Lettenmaier, D.P. Effects of 20th century warming and climate variability on flood risk in the western US. Water Resour Res. 2007, 6, 1–17. [Google Scholar]
  10. Soulé, P.T.; Knapp, P.A. Radial Growth Rates of Two Co-occurring Coniferous Trees in the Northern Rockies during the Past Century. J. Arid Environ. 2013, 94, 87–95. [Google Scholar] [CrossRef]
  11. Soulé, P.T.; Knapp, P.A. Analyses of intrinsic water-use efficiency indicate performance differences of ponderosa pine and Douglas-fir in response to CO2 enrichment. J. Biogeogr. 2015, 42, 144–155. [Google Scholar] [CrossRef]
  12. Petrie, M.D.; Wildeman, A.M.; Bradford, J.B.; Hubbard, R.M.; Lauenroth, W.K. A review of precipitation and temperature control on seedling emergence and establishment for ponderosa and lodgepole pine forest regeneration. For. Ecol. Manag. 2016, 361, 328–338. [Google Scholar] [CrossRef]
  13. Marquardt, P.E. Investigation into Climatic Effects on the Growth and Genetic Structure of Sky Island Ponderosa Pine. Ph.D. Thesis, Michigan State University, East Lansing, MI, USA, 2018. [Google Scholar]
  14. Allen, C.D.; Macalady, A.K.; Chenchouni, H.; Bachelet, D.; McDowell, N.; Vennetier, M.; Kitzberger, T.; Rigling, A.; Breshears, D.D.; Hogg, E.T.; et al. A global overview of drought and heat-induced tree mortality reveals emerging climate change risks for forests. For. Ecol. Manag. 2010, 259, 660–684. [Google Scholar] [CrossRef]
  15. McDowell, N.G.; Allen, C.D.; Marshall, L. Growth, carbon-isotope discrimination, and drought-associated mortality across a Pinus ponderosa elevational transect. Glob. Chang. Biol. 2010, 16, 399–415. [Google Scholar] [CrossRef]
  16. Ganey, J.L.; Vojta, S.C. Tree mortality in drought-stressed mixed-conifer and ponderosa pine forests, Arizona, USA. For. Ecol. Manag. 2011, 261, 162–168. [Google Scholar] [CrossRef]
  17. Tague, C.L.; McDowell, N.G.; Allen, C.D. An integrated model of environmental effects on growth, carbohydrate balance, and mortality of Pinus ponderosa forests in the southern Rocky Mountains. PLoS ONE 2013, 8, e80286. [Google Scholar] [CrossRef] [PubMed]
  18. Lloret, F.; Keeling, E.G.; Sala, A. Components of tree resilience: Effects of successive low-growth episodes in old ponderosa pine forests. Oikos 2011, 120, 1909–1920. [Google Scholar] [CrossRef]
  19. Rehfeldt, G.E. Genetic differentiation among populations of Pinus ponderosa from the upper Colorado River Basin. Bot. Gaz. 1990, 1, 125–137. [Google Scholar] [CrossRef]
  20. Zhang, J.; Cregg, B.M. Growth and physiological responses to varied environments among populations of Pinus ponderosa. For. Ecol. Manag. 2005, 1, 1–12. [Google Scholar] [CrossRef]
  21. De Luis, M.; Čufar, K.; Di Filippo, A.; Novak, K.; Papadopoulos, A.; Piovesan, G.; Rathgeber, C.B.; Raventós, J.; Saz, M.A.; Smith, K.T. Plasticity in dendroclimatic response across the distribution range of Aleppo pine (Pinus halepensis). PLoS ONE 2013, 12, e83550. [Google Scholar] [CrossRef]
  22. Evenden, A.G.; Moeur, M.; Shelly, J.S.; Kimball, S.F.; Wellner, C.A. Research natural areas on National Forest System lands in Idaho, Montana, Nevada, Utah, and western Wyoming: A Guidebook for Scientists, Managers, and Educators; General Technical Report RMRS-GTR-69; US Department of Agriculture, Forest Service, Rocky Mountain Research Station: Ogden, UT, USA, 2001; p. 69. [Google Scholar]
  23. PRISM Climate Group, Oregon State University. Available online: http://prism.oregonstate.edu (accessed on 23 October 2019).
  24. Stokes, M.A. An Introduction to Tree-Ring Dating; University of Arizona Press: Tucson, AZ, USA, 1996. [Google Scholar]
  25. Yamaguchi, D.K. A simple method for cross-dating increment cores from living trees. Can. J. For. Res. 1991, 3, 414–416. [Google Scholar] [CrossRef]
  26. Regent Instruments Canada Inc. WINDENDRO for Tree-Ring Analysis; Canada Inc.: Québec, QC, Canada, 2013. [Google Scholar]
  27. Holmes, R.L. Computer-assisted quality control in tree-ring dating and measurement. Tree Ring Bull. 1983, 43, 51–67. [Google Scholar]
  28. Dannenberg, M.P.; Wise, E.K. Seasonal climate signals from multiple tree ring metrics: A case study of Pinus ponderosa in the upper Columbia River Basin. J Geophys. Res. Biogeosci. 2016, 121, 1178–1189. [Google Scholar] [CrossRef]
  29. Zhang, J.; Finley, K.A.; Johnson, N.G.; Ritchie, M.W. Lowering stand density enhances resiliency of ponderosa pine forests to disturbances and climate change. For. Sci. 2019, 65, 496–507. [Google Scholar] [CrossRef]
  30. Cook, E.R.; Peters, K. The smoothing spline: A new approach to standardizing forest interior tree-ring width series for dendroclimatic studies. Tree Ring Bull. 1981, 41, 45–53. [Google Scholar]
  31. Palmer, W.C. Meteorological Drought; Paper 45, 58 pp; US Department of Commerce, Weather Bureau: Washington, DC, USA, 1965. [Google Scholar]
  32. Stout, D.L.; Sala, A. Xylem vulnerability to cavitation in Pseudotsuga menziesii and Pinus ponderosa from contrasting habitats. Tree Physiol. 2003, 23, 43–50. [Google Scholar] [CrossRef] [PubMed]
  33. Affolter, P.; Büntgen, U.; Esper, J.; Rigling, A.; Weber, P.; Luterbacher, J.; Frank, D. Inner Alpine conifer response to 20th century drought swings. Eur. J. For. Res. 2010, 129, 289–298. [Google Scholar] [CrossRef]
  34. Van Mantgem, P.J.; Stephenson, N.L.; Byrne, J.C.; Daniels, L.D.; Franklin, J.F.; Fulé, P.Z.; Harmon, M.E.; Larson, A.J.; Smith, J.M.; Taylor, A.H.; et al. Widespread Increase of Tree Mortality Rates in the Western United States. Science 2009, 323, 521–524. [Google Scholar] [CrossRef]
  35. Knutson, K.C.; Pyke, D.A. Western juniper and ponderosa pine ecotonal climate–growth relationships across landscape gradients in southern Oregon. Can. J. For. Res. 2008, 38, 3021–3032. [Google Scholar] [CrossRef]
  36. Lascoux, M.; Palmé, A.E.; Cheddadi, R.; Latta, R.G. Impact of Ice Ages on the genetic structure of trees and shrubs. Philos. Trans. R. Soc. Lond. Ser. B 2004, 359, 197–207. [Google Scholar] [CrossRef]
  37. Latta, R.G.; Mitton, J.B. Historical separation and present gene flow through a zone of secondary contact in ponderosa pine. Evolution 1999, 53, 769–776. [Google Scholar] [CrossRef]
  38. McCullough, I.M.; Davis, F.W.; Williams, A.P. A range of possibilities: Assessing geographic variation in climate sensitivity of ponderosa pine using tree rings. For. Ecol. Manag. 2017, 402, 223–233. [Google Scholar] [CrossRef]
Figure 1. Study site locations in the Bitterroot National Wilderness of western Montana, USA.
Forests 10 01094 g001
Figure 2. PRISM derived climographs for FCF, FLF, and TGF, respectively. Gray bars indicate average monthly precipitation amounts in centimeters while lines indicate average monthly maximum (red), mean (green), and minimum temperatures (blue) from 1895 to 2011 in Celsius.
Forests 10 01094 g002
Figure 3. Monthly Spearman correlation r-Values between all standardized radial growth samples at FCF (light blue), FLF (dark blue) and TGF (green), and: (a) temperature, (b) precipitation, and (c) Palmer drought severity index for Montana Climate Division 1.
Forests 10 01094 g003
Figure 4. Raw and standardized tree growth along the ALL transect during wet and dry periods. The: (a) relative raw radial growth for wet (blue; PSDI >2) and dry (red; PSDI < −2) periods for each tree along the ALL elevational gradient. The solid black line represents individual tree elevation, and the magnitude of the vertical bars corresponds to the magnitude of average raw radial growth during wet and dry periods for that tree; (b) relative standardized radial growth for wet (blue; PSDI >2) and dry (red; PSDI < −2) periods for each tree along the ALL elevational gradient. The solid black line represents individual tree elevation, and the magnitude of the vertical bars corresponds to the magnitude of average standardized growth during wet and dry periods for that tree.; and (c) standardized growth values during wet (blue; PSDI >2) and dry (red; PSDI < −2) periods for trees organized from lowest (left) to highest (right) elevation. Averaged growth during wet years (blue) have a value of one added to them and average growth for dry years (red) are subtracted by one (i.e., tree one (left) has an average growth value of ~1.05 for wet years and an average growth value ~0.81 for dry years).
Forests 10 01094 g004
Table 1. Descriptive chronology statistics.
ChronologyMean DBH (cm)Number of SamplesMean Age (years)
FLF_ALL73.557182
FLF_TOP73.520208
FLF_BOTTOM72.919145
FCF_ALL64.747233
FCF_TOP63.017241
FCF_BOTTOM65.215230
TGF_ALL75.850223
TGF_TOP78.518171
TGF_BOTTOM78.518275
ALL70.6154213
ALL_TOP74.153211
ALL_BOTTOM69.055193
Table 2. Spearman correlation r-Values between standardized radial growth values (1895–2011) for each elevational grouping at our three study locations and climate variables from Montana Climate Division 1.
July TemperatureJune PrecipitationJuly PSDI
FLF_Top−0.4100.2580.542
p-Value0.0000.0050.000
FLF_Bottom−0.3260.2990.442
p-Value0.0000.0010.000
FCF_Top−0.2970.2860.493
p-Value0.0010.0020.000
FCF_Bottom−0.1930.2870.421
p-Value0.0370.0020.000
TGF_Top−0.4100.3280.461
p-Value0.0000.0000.000
TGF_Bottom−0.4480.2400.452
p-Value0.0000.0090.000
Table 3. Spearman correlations between the standardized ALL chronologies and climate variables from Montana Climate Division 1.
July TemperatureJune PrecipitationJuly PSDI
ALL−0.4400.3070.558
p-Value0.0000.0010.000
ALL_Top−0.4770.2570.533
p-Value0.0000.0050.000
ALL_Bottom−0.3550.3100.489
p-Value0.0000.0010.000

