Article

Assessing the Importance of Tree Cover Threshold for Forest Cover Mapping Derived from Global Forest Cover in Myanmar

1
Graduate School of Bioresource and Bioenvironmental Sciences, Kyushu University, 744 Motooka, Fukuoka 819-0395, Japan
2
Institute of Decision Science for a Sustainable Society, Kyushu University, 744 Motooka, Fukuoka 819-0395, Japan
3
Forestry and Forest Products Research Institute, 1 Matsunosato, Tsukuba, Ibaraki 305-8687, Japan
4
Faculty of Agriculture, Kyushu University, 744 Motooka, Fukuoka 819-0395, Japan
*
Author to whom correspondence should be addressed.
Forests 2019, 10(12), 1062; https://doi.org/10.3390/f10121062
Submission received: 9 September 2019 / Revised: 2 November 2019 / Accepted: 19 November 2019 / Published: 22 November 2019

Abstract

:
Comprehensive forest cover mapping is essential for making policy and management decisions. However, creating a forest cover map from raw remote sensing data is a barrier for many users. Here, we investigated the effects of different tree cover thresholds on the accuracy of forest cover maps derived from the Global Forest Change Dataset (GFCD) across different ecological zones in a country-scale evaluation of Myanmar. To understand the effect of different thresholds on map accuracy, nine forest cover maps having thresholds ranging from 10% to 90% were created from the GFCD. The accuracy of the forest cover maps within each ecological zone and at the national scale was assessed. The overall accuracies of ecological zones other than tropical rainforest were highest when the threshold for tree cover was less than 50%. The appropriate threshold for tropical rainforests was 80%. Therefore, different optimal tree cover thresholds were required to achieve the highest overall accuracy depending on ecological zones. However, in the unique case of Myanmar, we were able to determine the threshold across the whole country. We concluded that the threshold for tree cover for creating a forest cover map should be determined according to the areal ratio of ecological zones determined from large-scale monitoring. Our results are applicable to tropical regions having similar ecological zones.

1. Introduction

Deforestation in tropical forests has been of concern for decades [1]. Because tropical deforestation negatively impacts the global carbon budget [2,3] and biodiversity [4,5,6], forest policy and management need to reverse forest loss. Forest cover maps, which identify forest and non-forest areas, are essential baseline information for tracking forest cover changes; therefore, comprehensive forest cover maps are necessary for policy and management decisions. Remote sensing is one of the tools used to provide complete forest cover maps over extensive land areas, such as entire countries.
Satellite remote sensing is a commonly used to map land cover in a systematic and cost-effective fashion over a variety of spatial extents [7,8]. However, creating a forest cover map from raw remote sensing data can be a barrier for users [9], because it requires expertise in remote sensing and professional software. An alternative solution is to use existing global datasets for forest cover. Currently, there are several freely available land cover map products, which have been developed from various data sources.
The Global Forest Change Dataset (GFCD) developed by Hansen et al. [10] is one of these freely available global datasets. This is a Landsat-derived dataset with 30-m resolution and includes three layers, which are: (1) percent tree cover in 2000 (0%–100%) (hereafter tree cover), (2) annual forest cover loss (2000–2016), and (3) forest cover gain (2000–2016). The GFCD is widely used all over the world (e.g., [11,12,13]). One of the barriers to using the GFCD, however, is that the data do not provide information on forest and non-forest areas. Thus, users must apply knowledge of forest cover from other sources. One practical option is to create a forest cover map from the percent tree cover layer of the GFCD [14,15,16,17,18]. In this option, users distinguish forest and non-forest areas by applying a threshold of tree cover. Because the definition of the threshold directly affects the areas of forest and non-forest, setting an appropriate threshold is very important.
Previous studies have used different thresholds while using the GFCD. For example, Davis et al. [14] and Lonn et al. [16] used a 30% threshold to distinguish forests and non-forests in Cambodia, but Yang et al. [19] used a 10% threshold in China. Lui et al. [20] used a 50% tree cover threshold in accordance with the definition of forest cover gain in the GFCD, for rainforest cover change analysis of Gola National Park (Sierra Leone, West Africa). A case study in Brazil applied different thresholds to create forest cover maps from the GFCD and suggested that a 95% threshold yielded the highest overall accuracy [21]. The various thresholds defined by previous studies imply that the appropriate threshold of tree cover depends on the region of interest. Thus, we may need to pay extra attention to the tree cover threshold to define forest areas, when we use the GFCD for monitoring large areas. To the best of our knowledge, no study has yet evaluated the effect of the tree cover threshold on the accuracy of forest cover detection based on the GFCD for different regions. Although some studies evaluated the accuracy of the GFCD, they have mainly focused on the accuracy of the forest loss or gain layer [22,23,24]. A few studies [18,21] have investigated the effect of the tree cover threshold on the accuracy of the forest cover map derived from the GFCD. However, they did not consider differences in the effect of tree cover thresholds among different regions. Because it is necessary to understand the accuracies of the GFCD within different forest types and various canopy densities to be appropriate for specific local contexts [25], here, we investigated the effect of the tree cover thresholds on the accuracy of forest cover detection from the GFCD over different regions.
The Republic of the Union of Myanmar (hereafter Myanmar) used to be one of the most forested countries in mainland Southeast Asia. However, the forest area in Myanmar has decreased rapidly [26]. Monitoring forest cover changes in Myanmar is crucial for action against such deforestation. The GFCD may be an important option for monitoring, despite Myanmar being a long north–south orientated country. The elevation ranges from sea level to more than 5000 m. In some places the annual rainfall reaches 6000 mm but, in other parts of the country, annual rainfall is below 500 mm. Given these diverse topographic and climatic conditions, Myanmar is divided into five ecological zones. Because of these different ecological zones, we may have to use different zonal thresholds to map forest cover using the GFCD.
In this study, we investigated the accuracy of forest cover maps created from the GFCD using different tree cover thresholds across the different ecological zones based on country-scale evaluation of Myanmar. The specific objectives of the study were: (1) to identify the effect of changing tree cover threshold on the accuracy of forest cover maps from the GFCD, and (2) to examine the influence of different ecological zones on the optimal threshold of tree cover to achieve the highest overall accuracy. We evaluated the importance of the tree cover threshold when using the GFCD for monitoring large areas, such as in Myanmar.

2. Materials and Methods
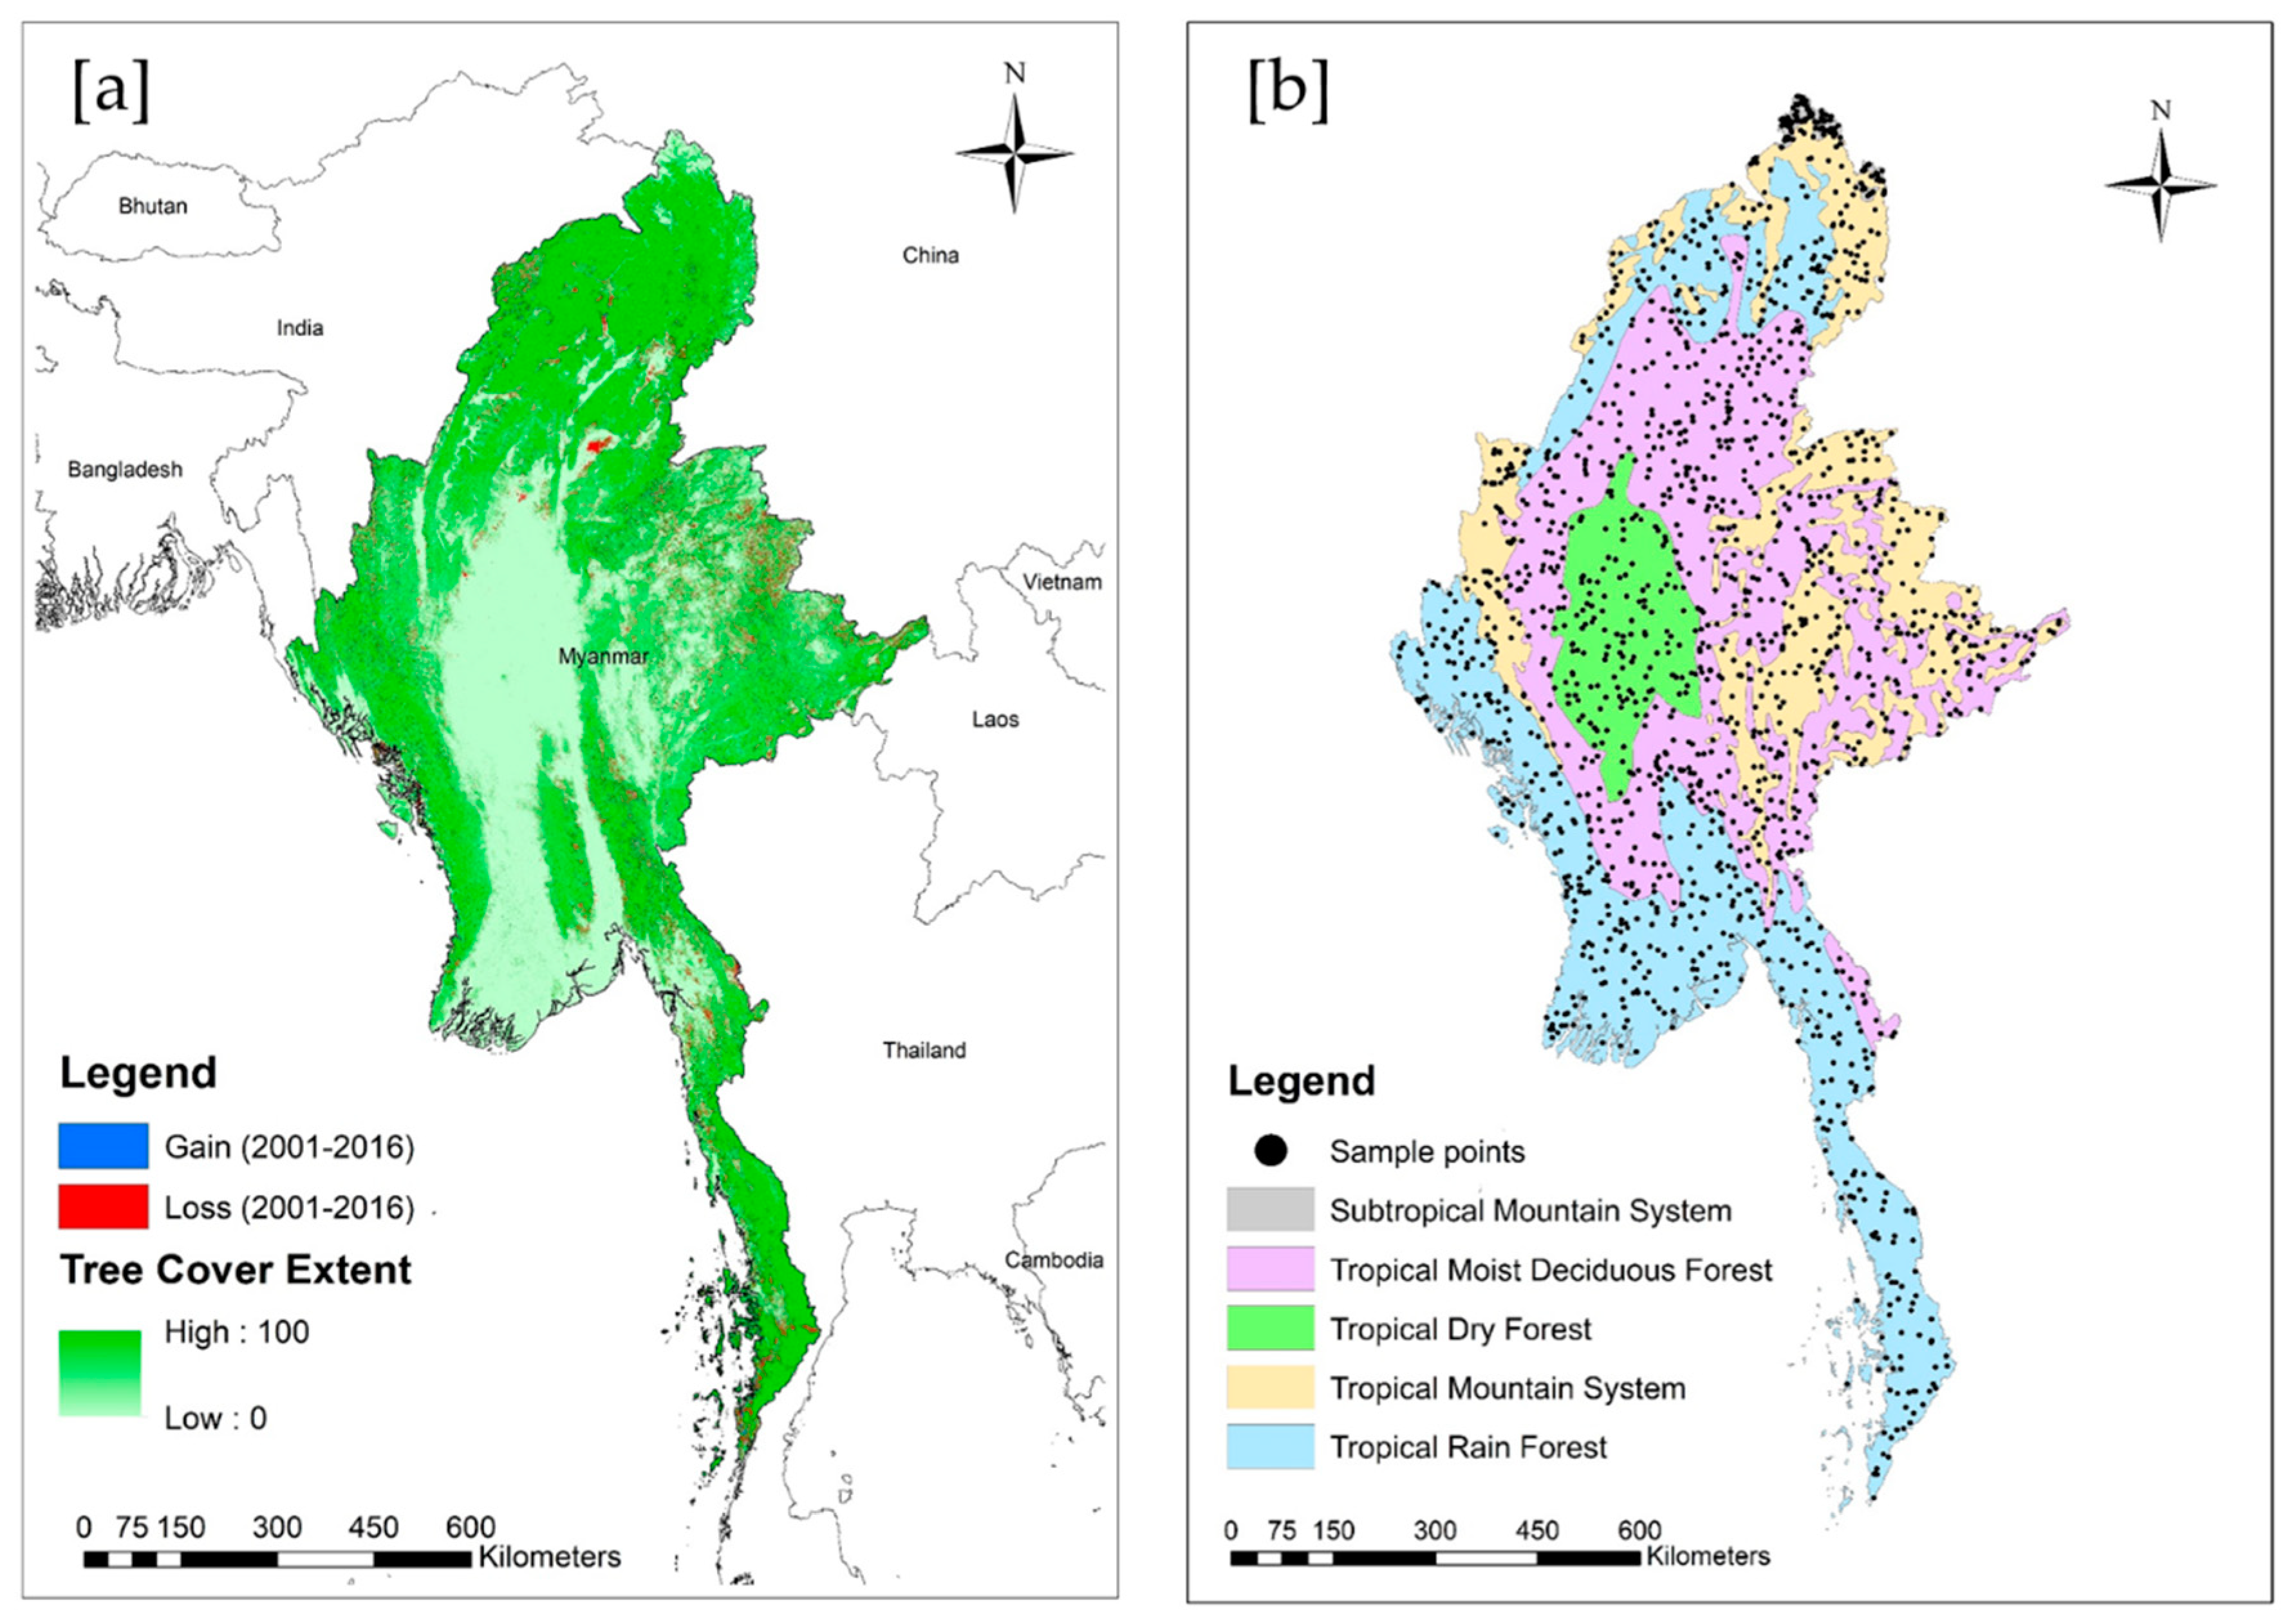
2.1. Study Area

Myanmar is located in Southeast Asia between latitudes 9°32′–28°31′N and longitude 92°10′–101°11′E. It is the second largest country in Southeast Asia, with a total area of approximately 0.67 million km2. According to the Global Forest Resources Assessment (FRA) 2015 [27], forests covered approximately 42.92% of the total land area in Myanmar.
Based on the Global Ecological Zones provided by the Food and Agricultural Organization of the United Nations (FAO) [28], Myanmar is divided into five ecological zones: the subtropical mountain system, tropical dry forest, tropical moist deciduous forest, tropical mountain system, and tropical rainforest (Figure 1). An ecological zone is defined as a broad area that has relatively homogeneous natural vegetation formations. The boundaries of ecological zones approximately correspond to the Köppen–Trewartha climatic types, based on temperature and rainfall. Mountain systems are classified as separate ecological zones, characterized by a high variation in both vegetation formations and climatic conditions [29].
Detailed explanations of the climate, physiography, and vegetation for each ecological zone in the Asian domain are provided in the FAO report by Simons [29]. Briefly, each ecological zone has different vegetation features. For example, the natural vegetation of the tropical rainforest is mainly dense moist evergreen forest, although semi-deciduous and moist deciduous forests are also distributed in the drier parts of this zone [29]. In contrast, the natural vegetation of tropical moist deciduous forests comprises mainly deciduous and semi-deciduous species, where teak (Tectona grandis) is found [29]. In Myanmar, bamboo (Dendrocalamus strictus) is also a common species in tropical moist deciduous forests [29]. The vegetation of tropical dry forests is complex but dry deciduous dipterocarp forests and mixed deciduous woodlands are common in the tropical dry forests of the Southeast Asian region, including Myanmar [29]. The vegetation of the subtropical mountain system and tropical mountain system varies by region.

2.2. Global Forest Change Dataset

The GFCD version 1.4, which included: (i) percent tree cover in 2000, (ii) annual loss layer, and (iii) a gain layer, was downloaded from the website [31]. All datasets were first clipped using the Myanmar boundary. Then, we defined forest area in 2000 using a threshold of percent tree cover. Here, we tested nine thresholds from 10% to 90%, with intervals every 10%, and generated nine forest cover maps for 2000. For each forest in the 2000 layer, we created a forest cover map for 2016 by combining the annual loss layer (2001–2016) and gain layer (2001–2016). We defined a pixel as forest in 2016 according to two criteria: (1) when a given pixel was forest in 2000 and was not classified as forest loss between 2001 and 2016, and (2) when a given pixel was classified as forest gain. The pixels satisfying either one of these two criteria were defined as forest. In contrast, we defined the pixels that did not satisfy the above criteria as non-forest in 2016. We assessed the accuracy of these nine different 2016 forest cover maps. When forest cover maps are created using a threshold, the information from neighboring pixels may improve their accuracy. Thus, we tested two different options for percent tree cover in 2000. In the first case, the original percent tree cover in 2000 was used. In the second case, the average value of tree cover in 2000 of a central pixel and its neighborhood was used. In this study, we used the average tree cover of 3 × 3 neighboring pixels.

2.3. Methodology

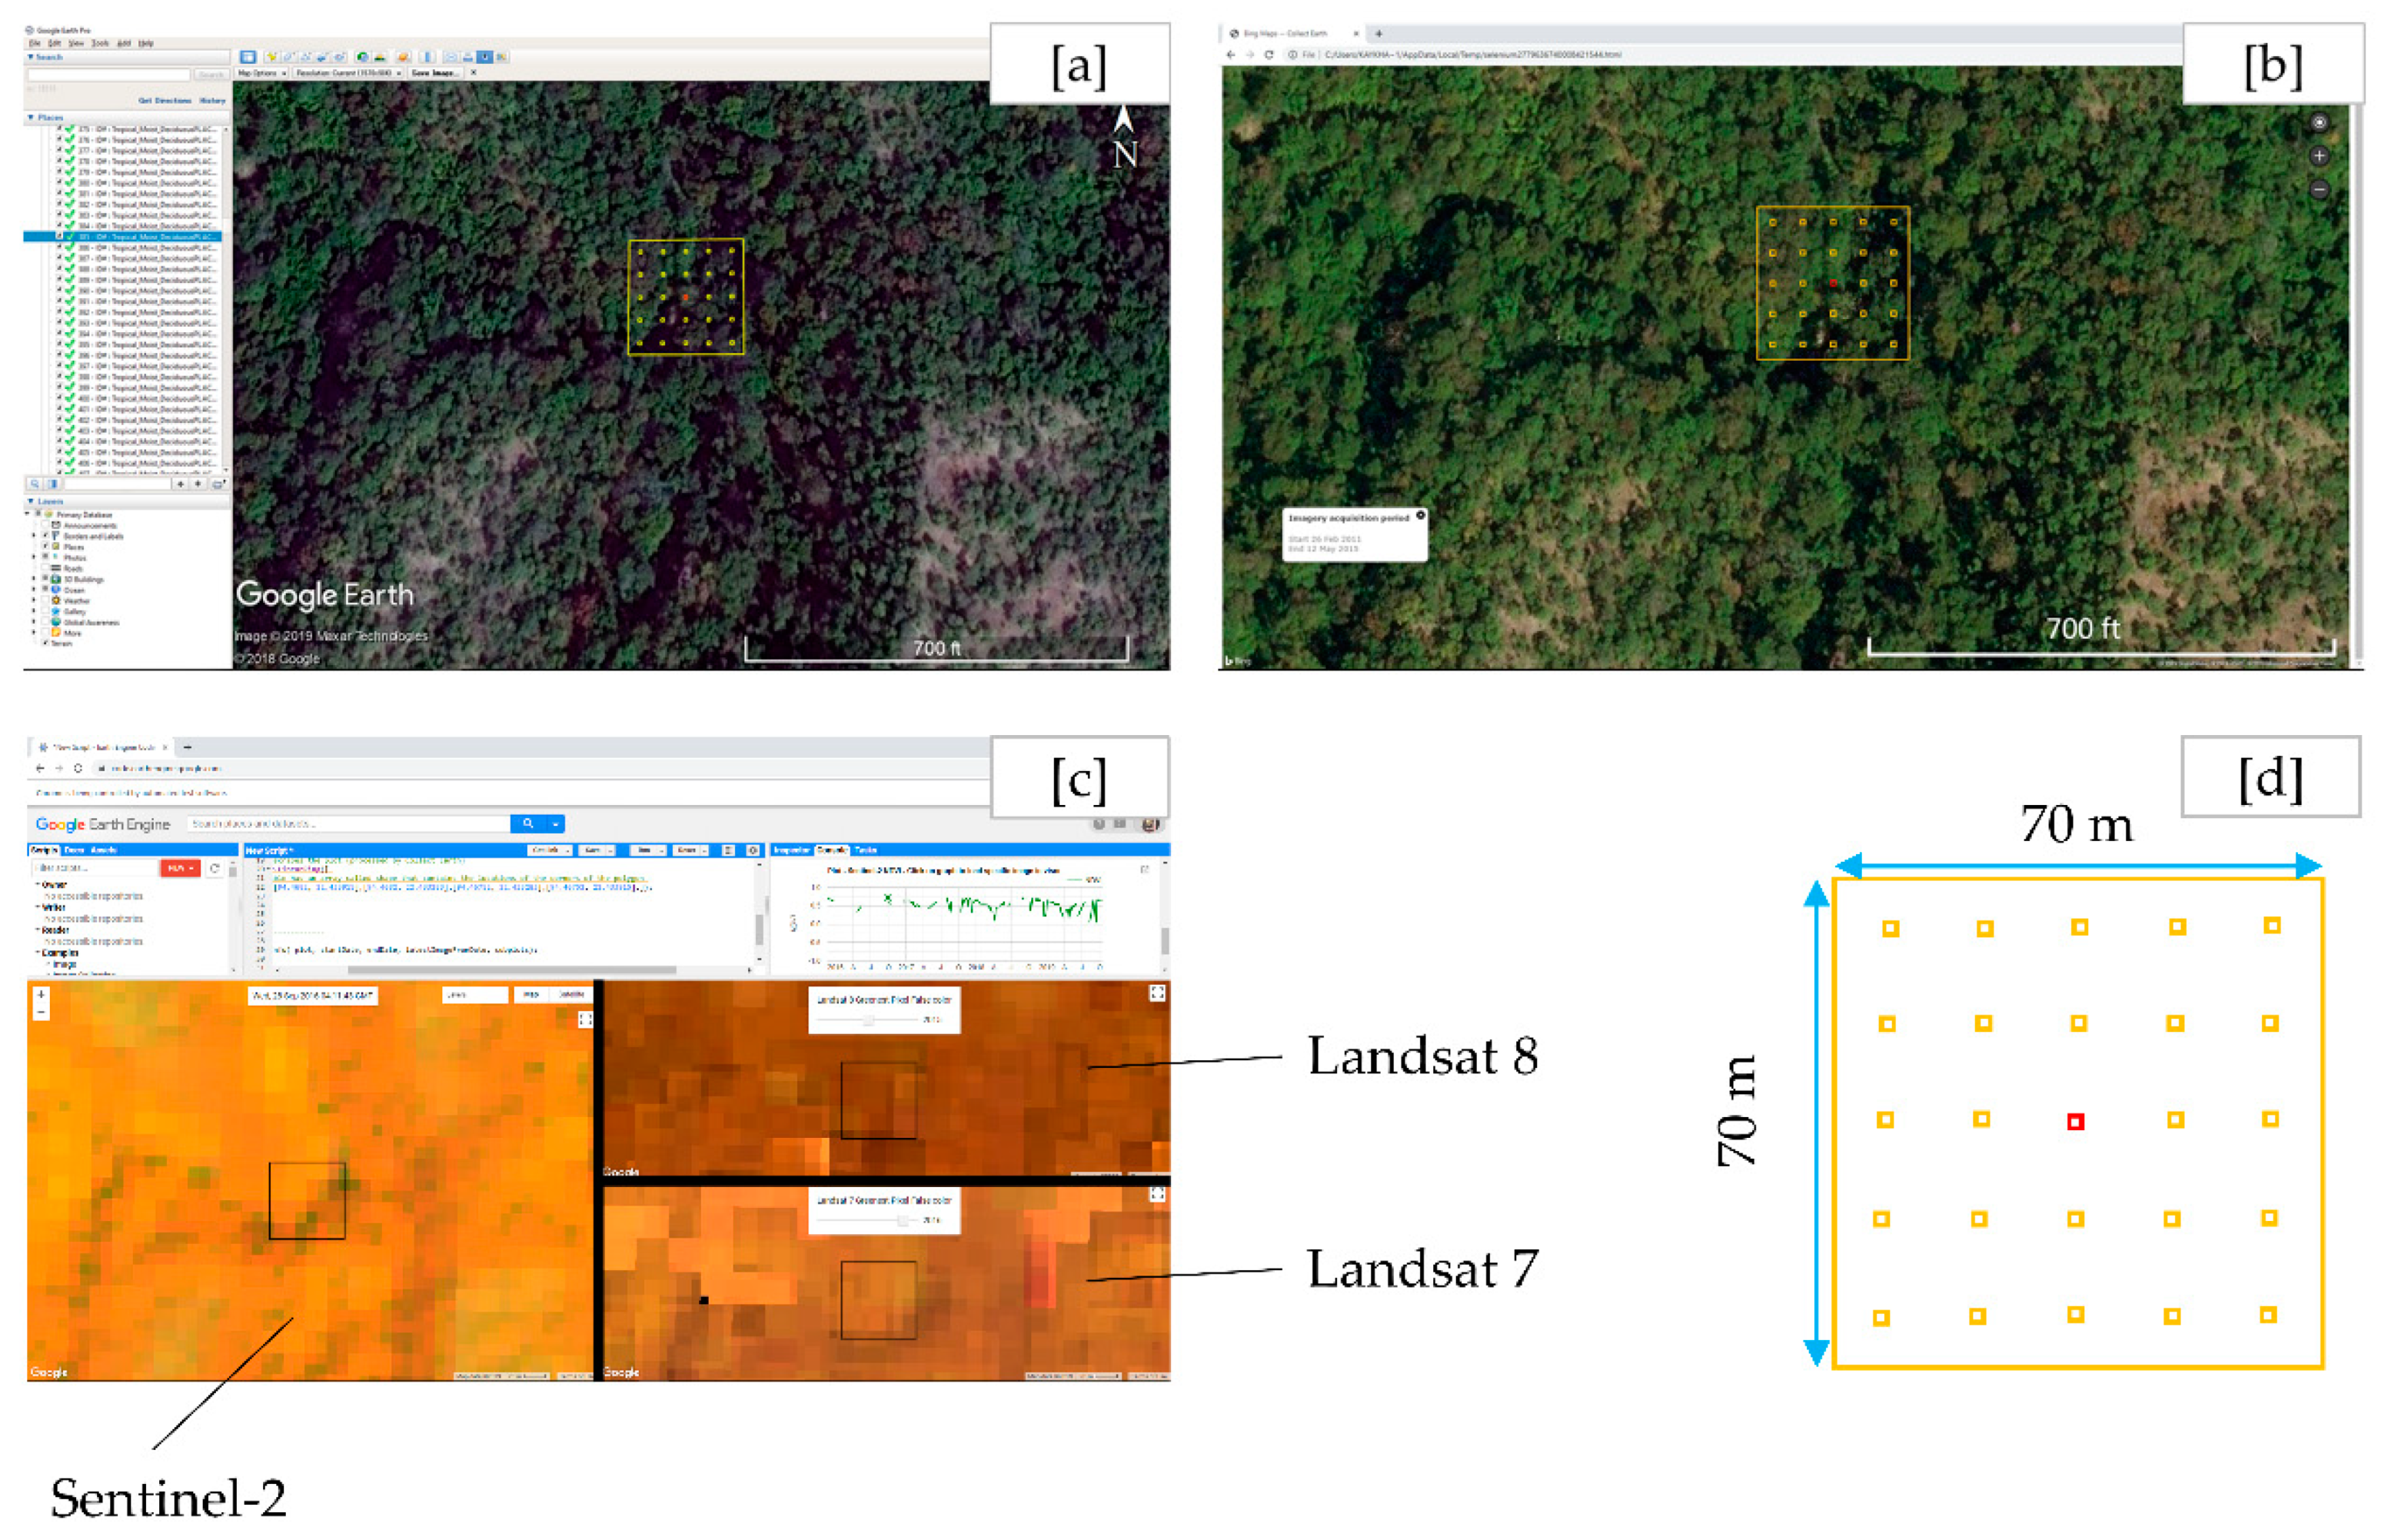
2.3.1. Determination of Sample Points

To determine the total number of sample points for the whole study area, the following equations [33] were used:
n ( W i S i S ( o ^ ) ) 2
S i   =   U i ( 1 U i )
where n is the calculated number of total samples, S ( o ^ ) is the standard error of the overall accuracy that we would like to achieve, W i is the mapped proportion of the area of class i, S i is the standard deviation of class i, and Ui is the expected user accuracy of class i. In this study, there were two classes, forest and non-forest. We assumed the mapped proportions of the areas of the forest class and non-forest class were 0.4 and 0.6, respectively. We also set the Ui of both forest and non-forest classes as 0.8. A total of 1600 sample points were used.
We applied stratified random sampling to allocate the samples to each ecological zone. To calculate the number of allocated samples, we used the Stratified Area Estimator-Design tool on the SEPAL platform [34]. The SEPAL platform is part of the Open Foris suite of tools [35]; it semi-automatically determines the number of samples according to the area of each stratum (an ecological zone) in our case, the total sample size, and the minimum sample size. Because the minimum sample size of each stratum should be at least 20–100 samples [35], we assigned at least 100 samples to each ecological zone. The respective number of sample points calculated by the tool for the five ecological zones are shown in Table 1; sample points were randomly distributed in each ecological zone.

2.3.2. Reference Data Collection

There are various approaches to collecting reference data, such as field survey data [19,36], Google Earth [10,20,37,38,39,40,41,42,43], and very high resolution satellite images, like Aerial photo, GeoEye, and QuickBird [44,45]. In this study, Collect Earth, which is a free open-source software designed to facilitate data collection for land cover monitoring [46], was used to interpret forest and non-forest from the samples for the ground situation (Figure 2). This software enabled us to interpret the land cover of the sampled area with plot layout design through imageries with varying spatial and temporal resolutions within Google Earth, Bing Maps, and Google Earth Engine [47]; it geo-synchronized the views of the ground situation at each sample within different imageries (Figure 2a–c). Previous studies used Collect Earth for various purposes, including ground truth data collection for accuracy assessment, land cover change analysis, and vegetation survey, for analyses at global scale [48] and specific regions of interest [49,50,51,52,53,54,55,56].
At the time of reference data collection, we defined forest as an area that was larger than 0.49 ha with tree cover of more than 10%, consistent with the forest definition of the FAO [57]. According to this definition, we set each sample from Section 2.3.1 as a 0.49 ha plot (70 m × 70 m) having a systematic grid of 5 × 5 points (i.e., 25 points), as shown in Figure 2d. Within each plot, we identified forest or non-forest areas by counting the number of points covered with trees, based on visualization of the ground situation through geo-synchronized views within Google Earth, Bing Maps, and Google Earth Engine. If the number of points with tree crowns in each plot was equal to or more than three (i.e., > 3/25 = 0.12), we classified the sample as forest. Otherwise, we classified the sample as non-forest.

2.3.3. Accuracy Assessment

The accuracies for all nine forest cover maps were assessed using overall accuracy (OA), producer’s accuracy (PA) and user’s accuracy (UA) derived from a confusion matrix between each forest cover map and reference data from Collect Earth. First, we evaluated the effect of the tree cover threshold on the accuracy of each ecological zone using the forest cover maps derived from the nine thresholds from 10% to 90%. Then, the effect of the tree cover threshold at a national scale was evaluated. For the national-scale evaluation, we calculated the national-scale accuracy (1) when the tree cover threshold was uniquely determined over the whole area of the country, and (2) when the tree cover threshold was determined by the optimal thresholds of tree cover from the ecological zones. For the former case, we calculated OA, PA and UA at a national scale from all nine forest cover maps as in the evaluation of each ecological zone. For the latter case, we used the tree cover threshold that received the highest OA for each ecological zone. McNemar’s test, which is a non-parametric test to assess the performance of a classification [58], was applied to evaluate national scale and ecological zone accuracies.

3. Results

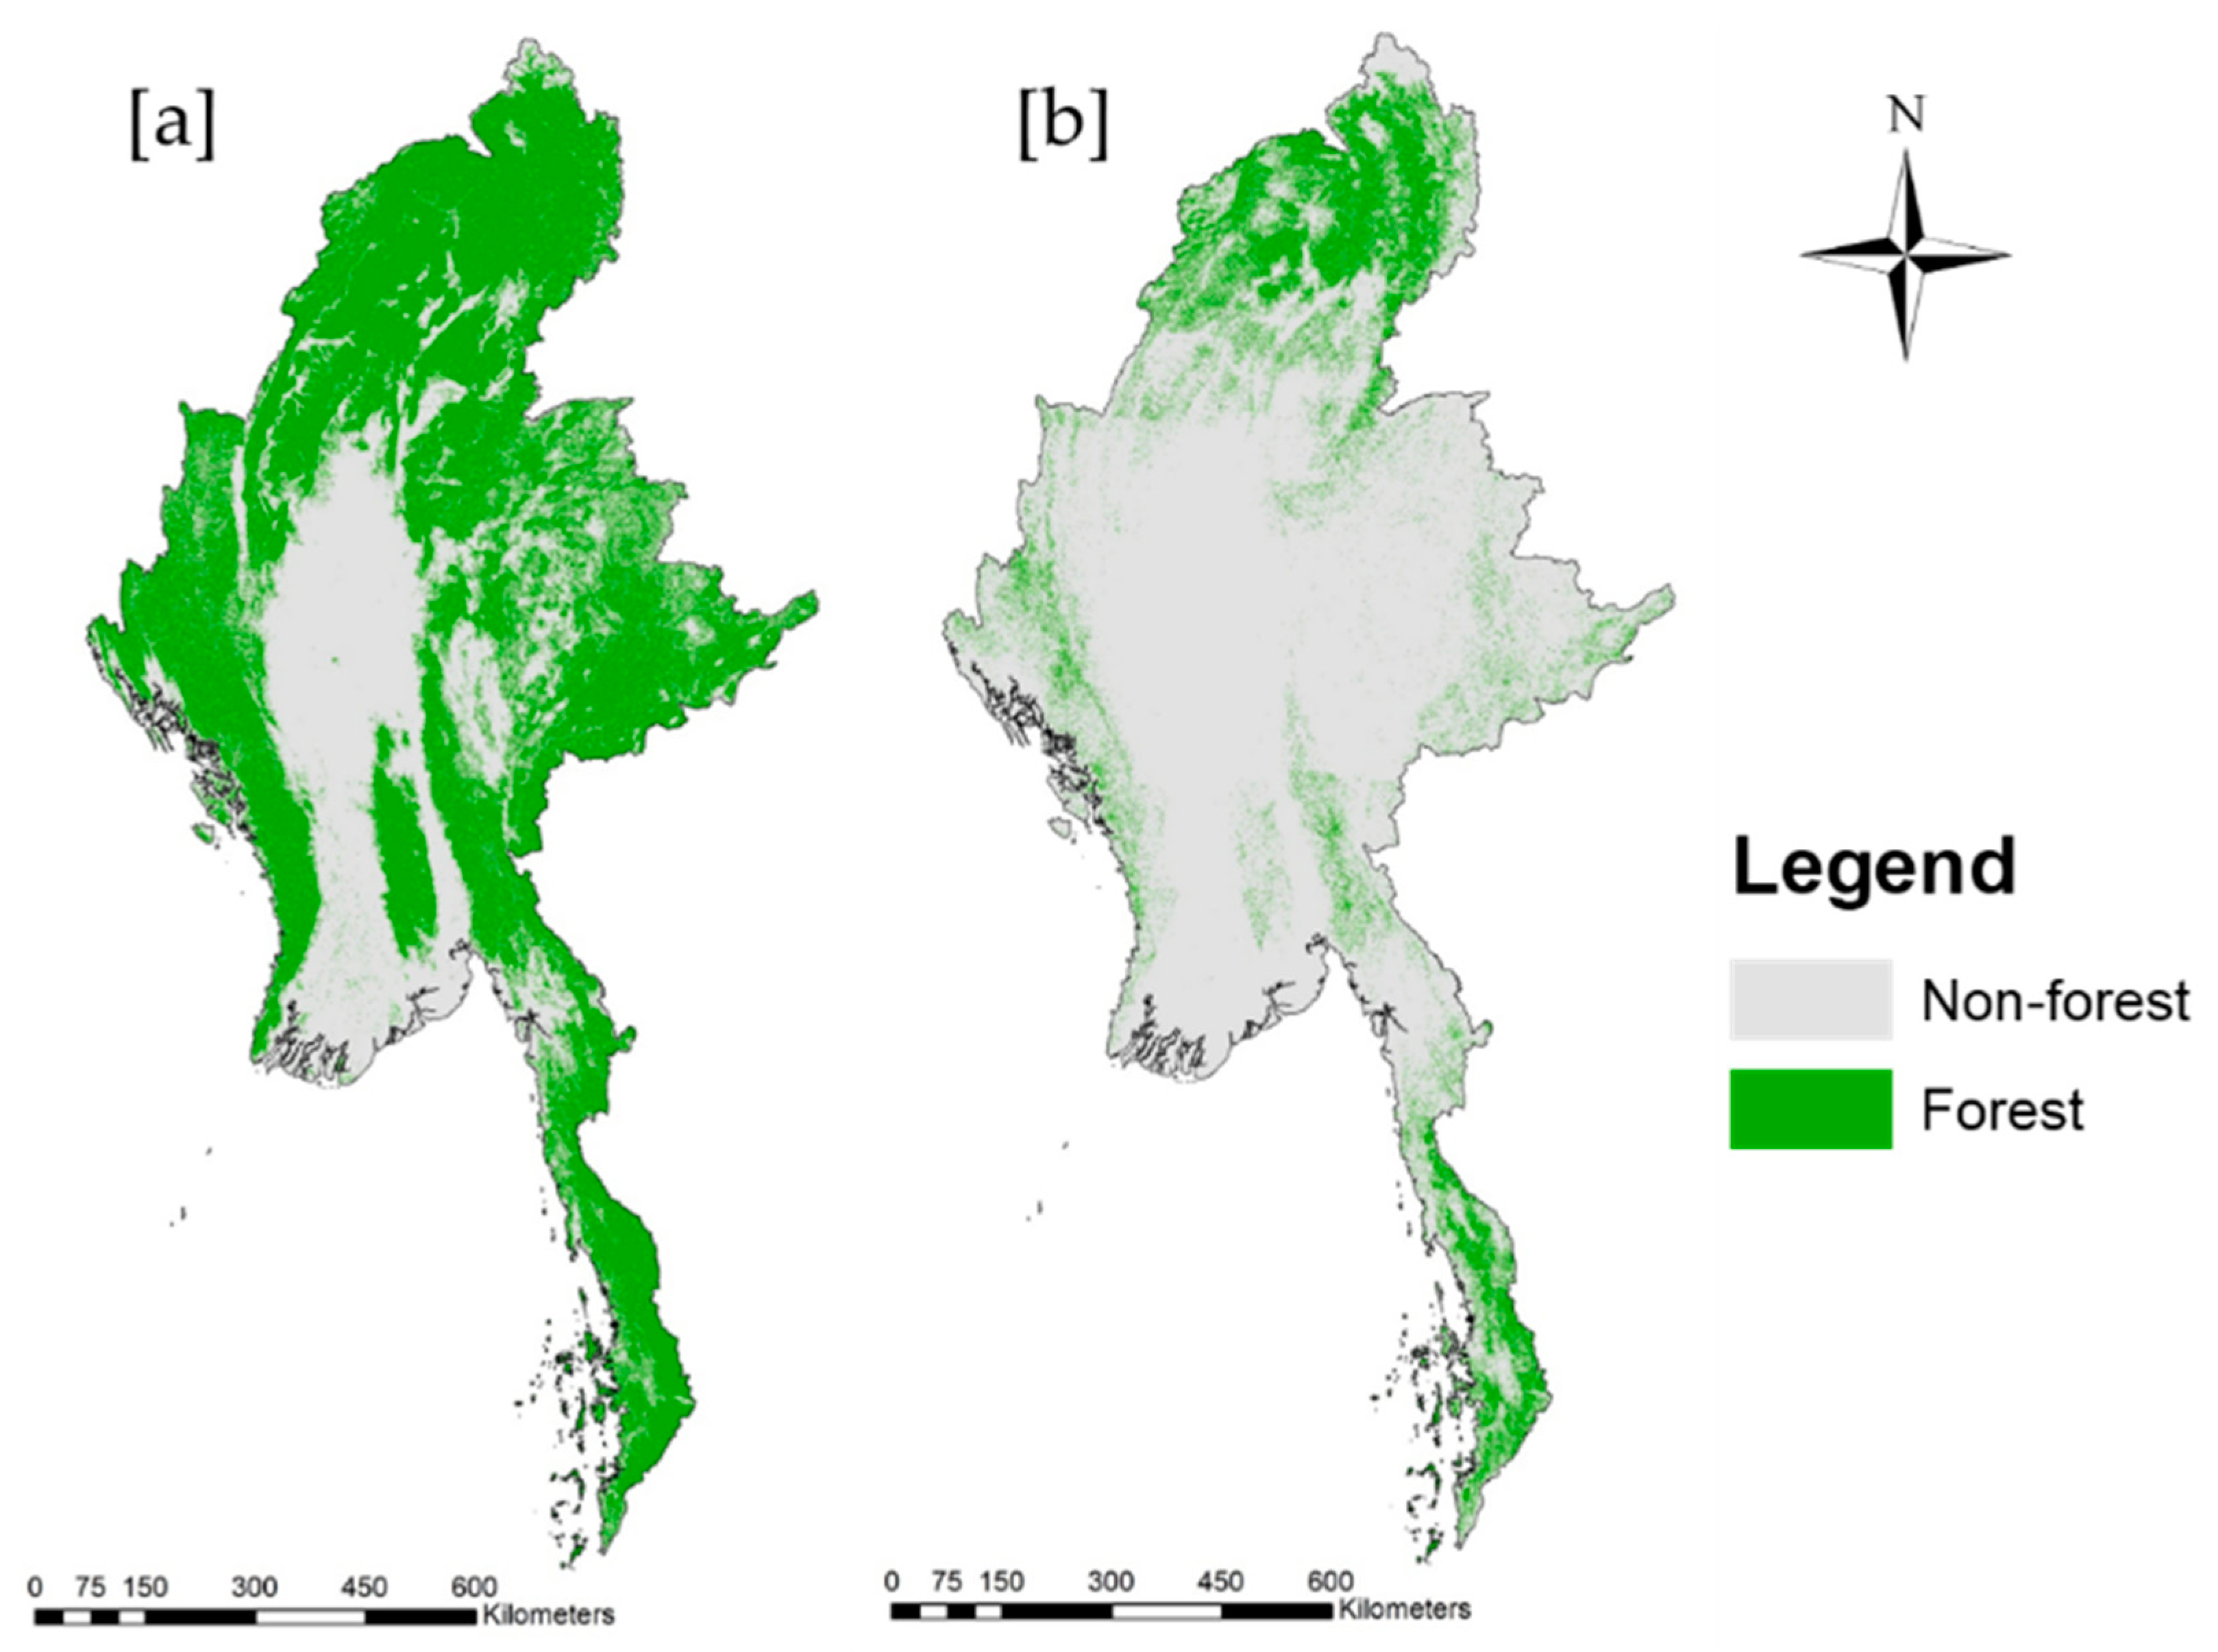
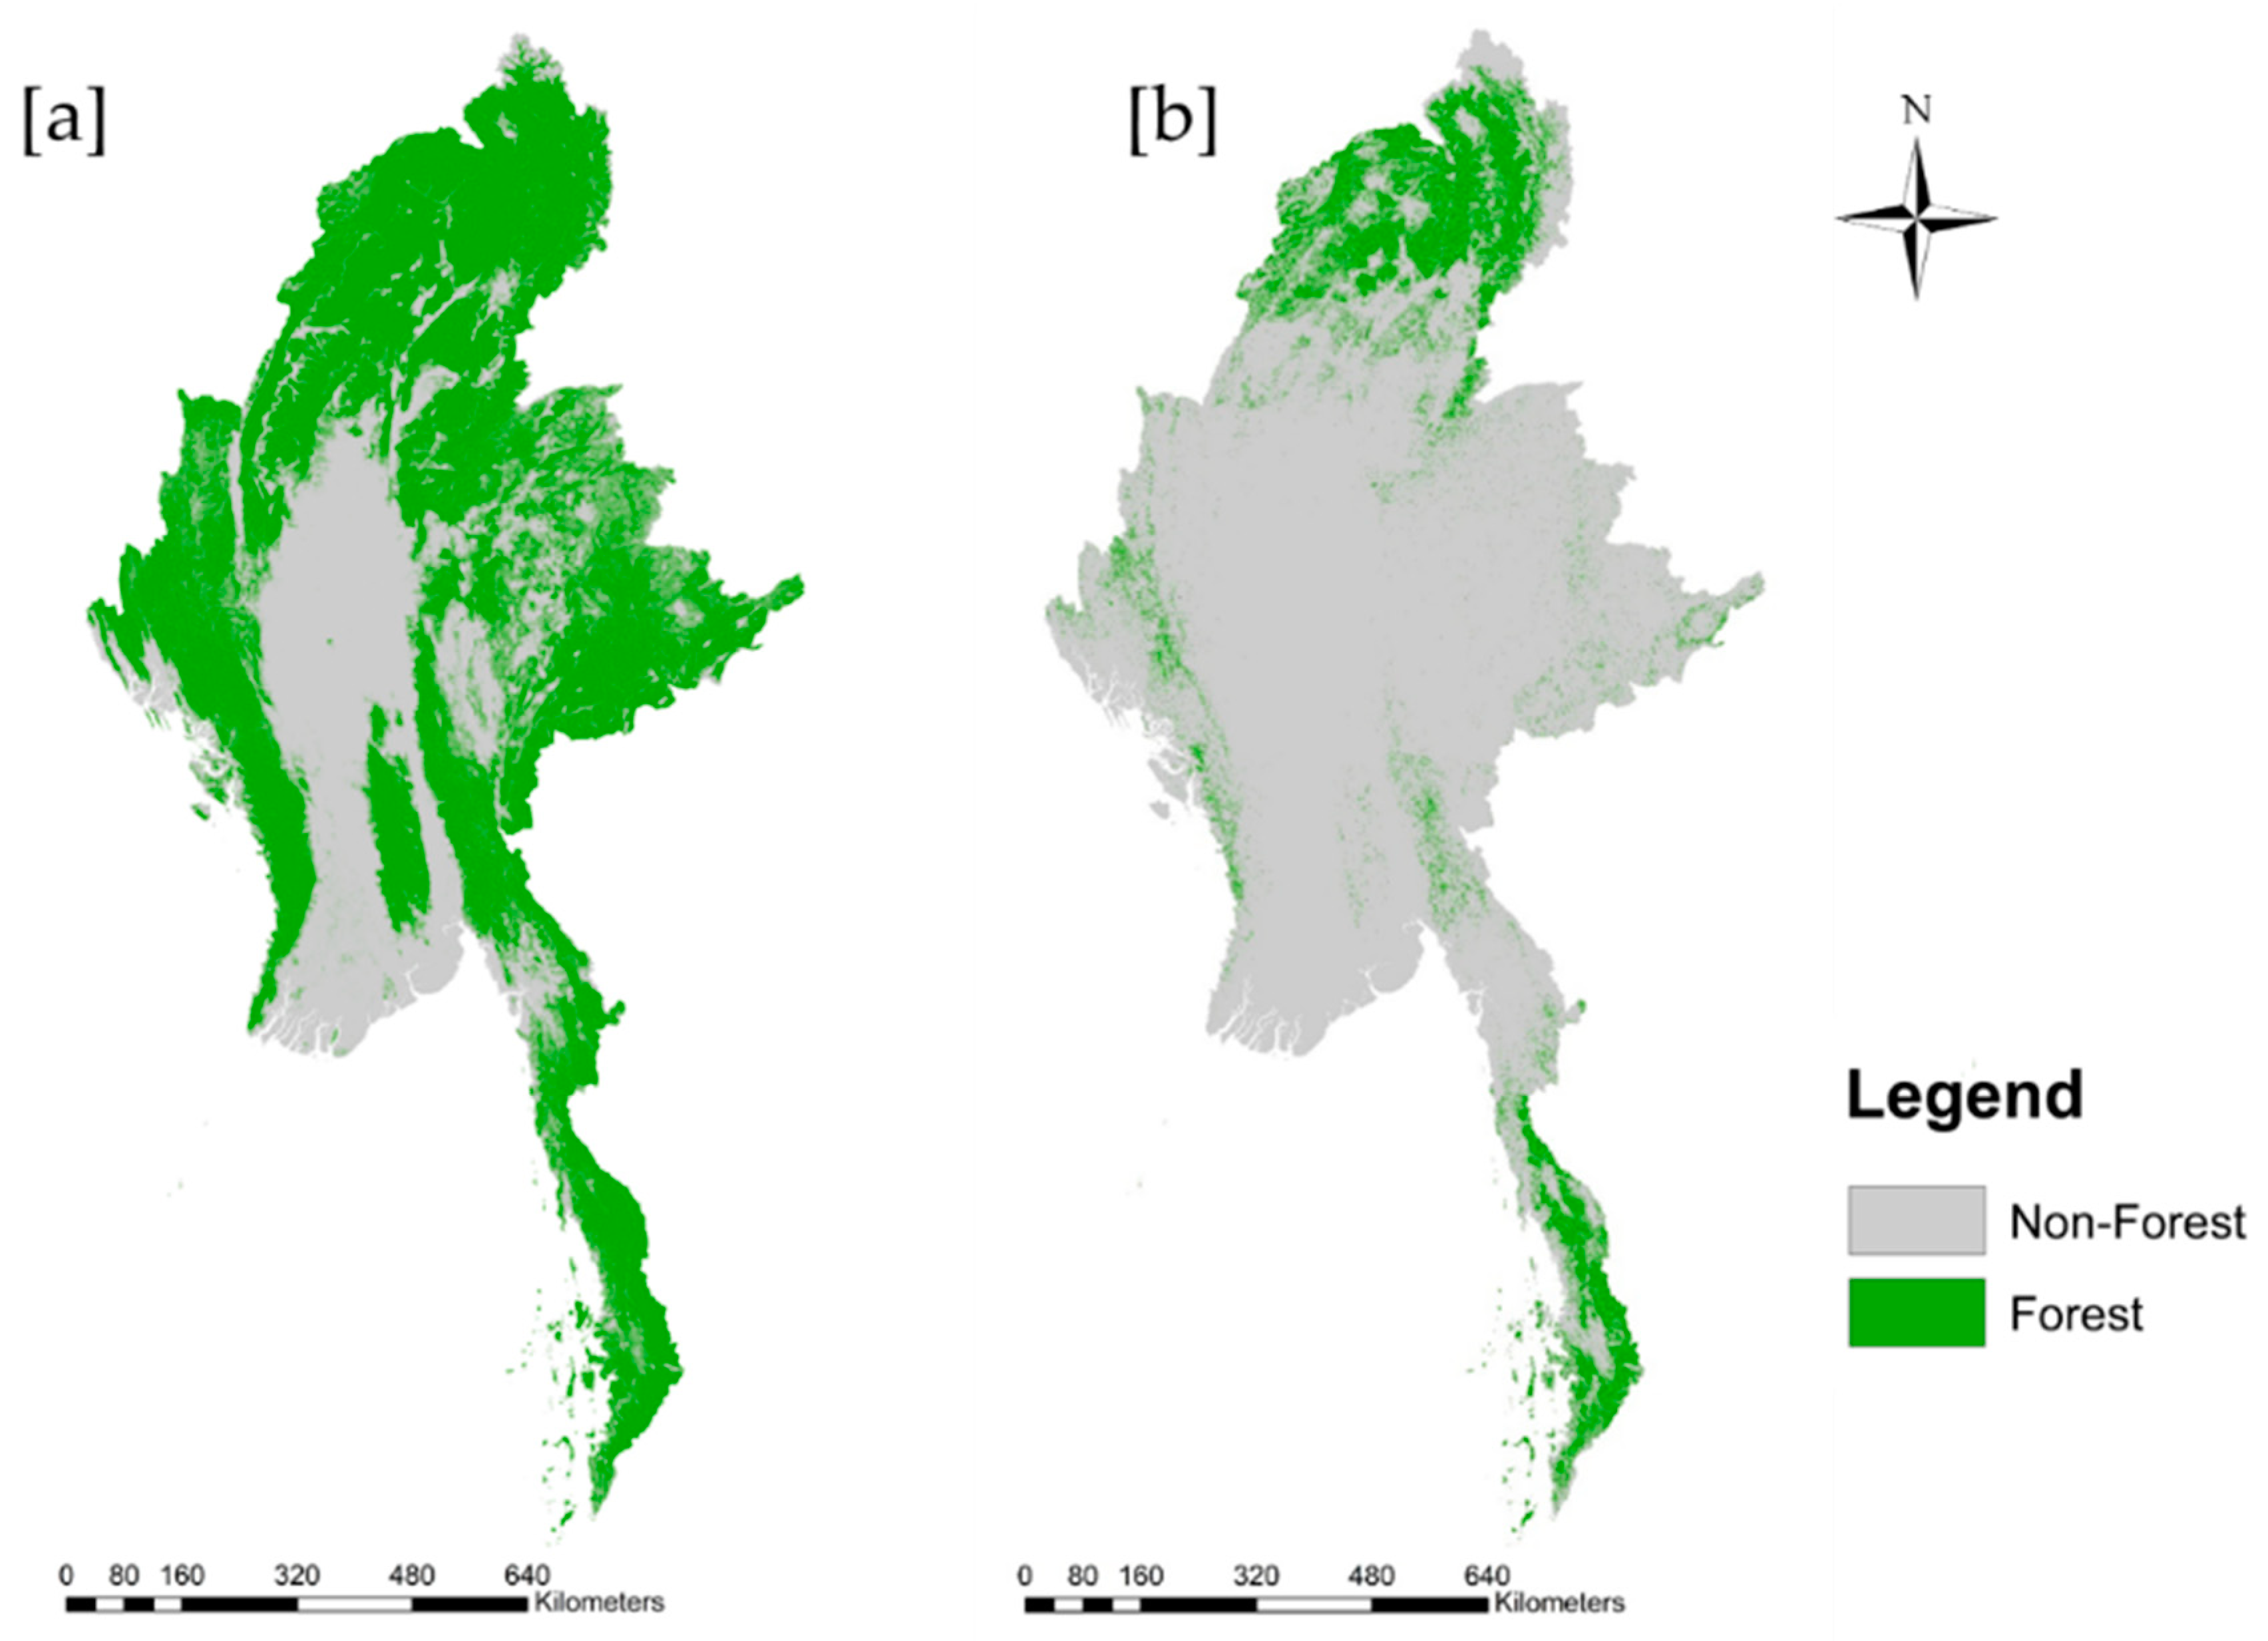
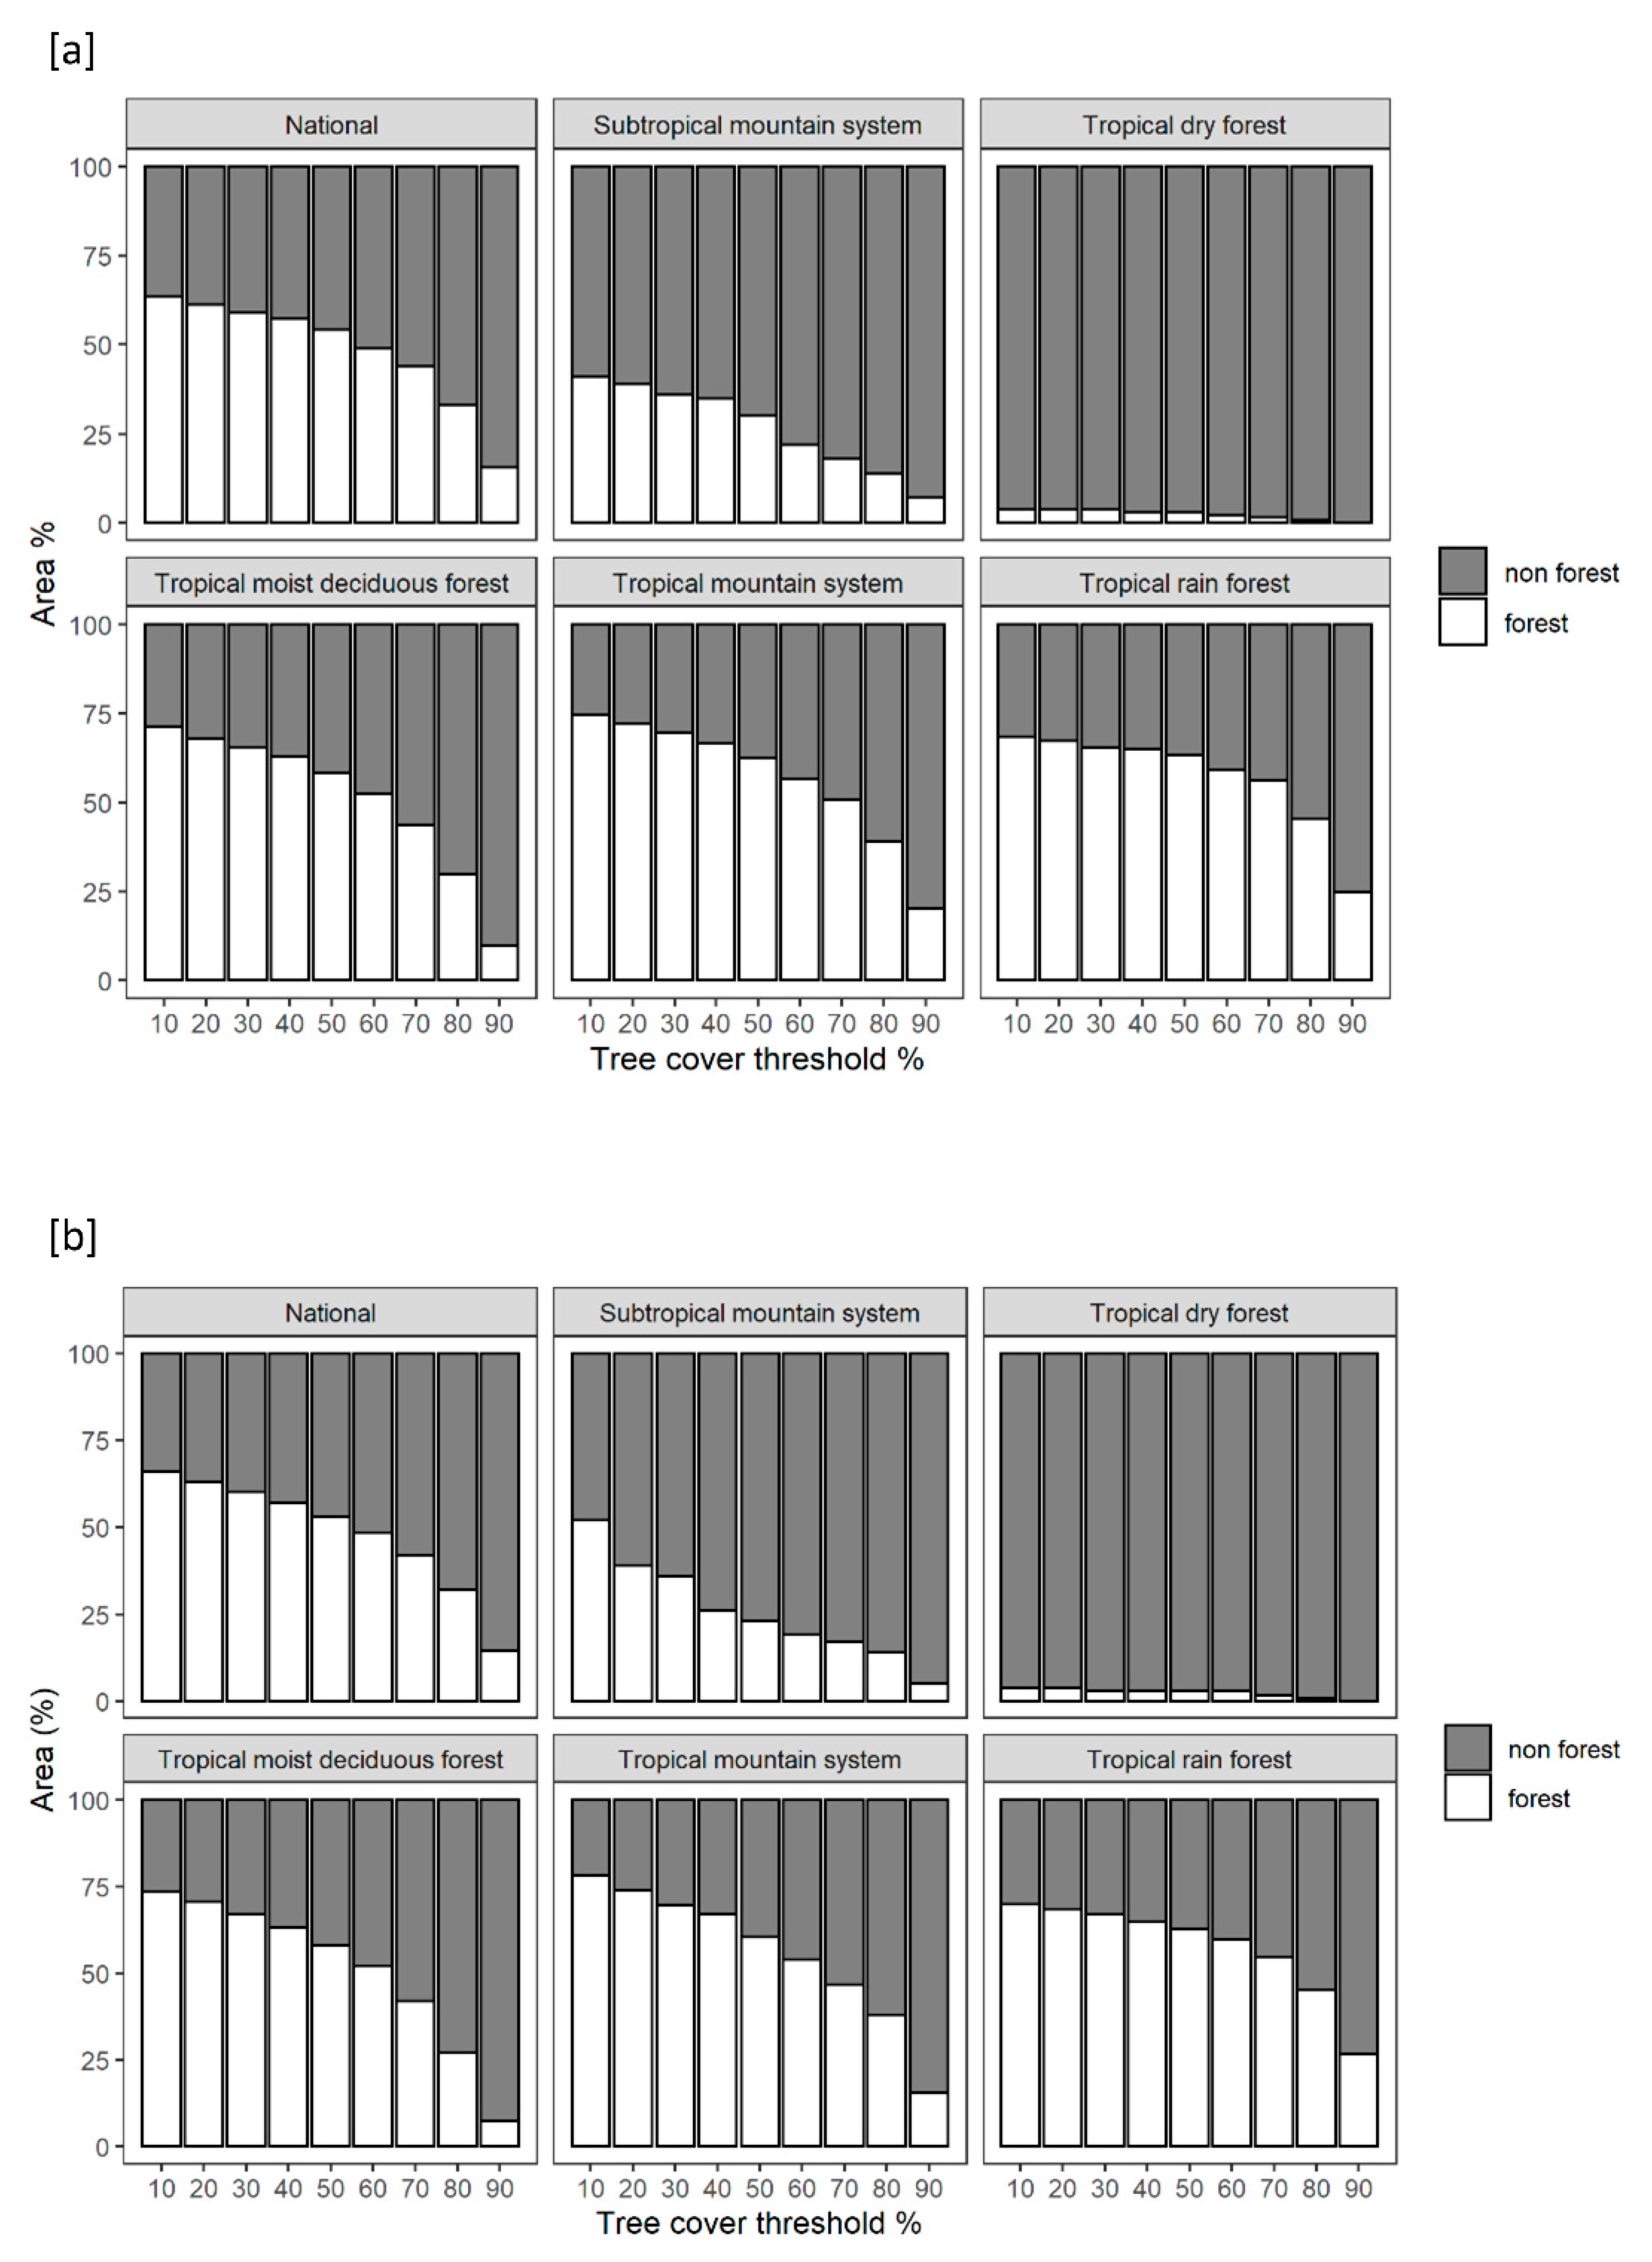
3.1. Forest Cover Area Estimation

Figure 3a,b show the relationship between the ratio of forest to non-forest and the tree cover threshold. The forest and non-forest areas derived from the two different cases of percent tree cover were similar. Forest area gradually decreased with an increase of the tree cover threshold. However, the gradients depended on ecological zones. Tropical dry forest showed the lowest forest cover and forest areas decreased in a linear fashion. Tropical moist deciduous forest, the tropical mountain system, and tropical rainforest showed a similar trend. The forests of these three ecological zones occupied an area of approximately 75% for both cases of percent tree cover, when the tree cover threshold was 10%; it remained at more than 50%, until the tree cover threshold reached 60%. Then, the forest cover ratio decreased sharply, as the tree cover threshold rose from 60% to 90%. The forest cover in the subtropical mountain system was less than 50% in the first case and approximately 52% in the other case, when the tree cover threshold was 10%; it gradually decreased as the threshold increased.
At the national scale, when the tree cover threshold was uniquely determined over the whole country, the trend was similar to that for the tropical moist deciduous forest, tropical mountain system and tropical rainforest in both percent tree cover cases. The forest cover ratio decreased proportionally, as the tree cover threshold rose from 10% to 50%.

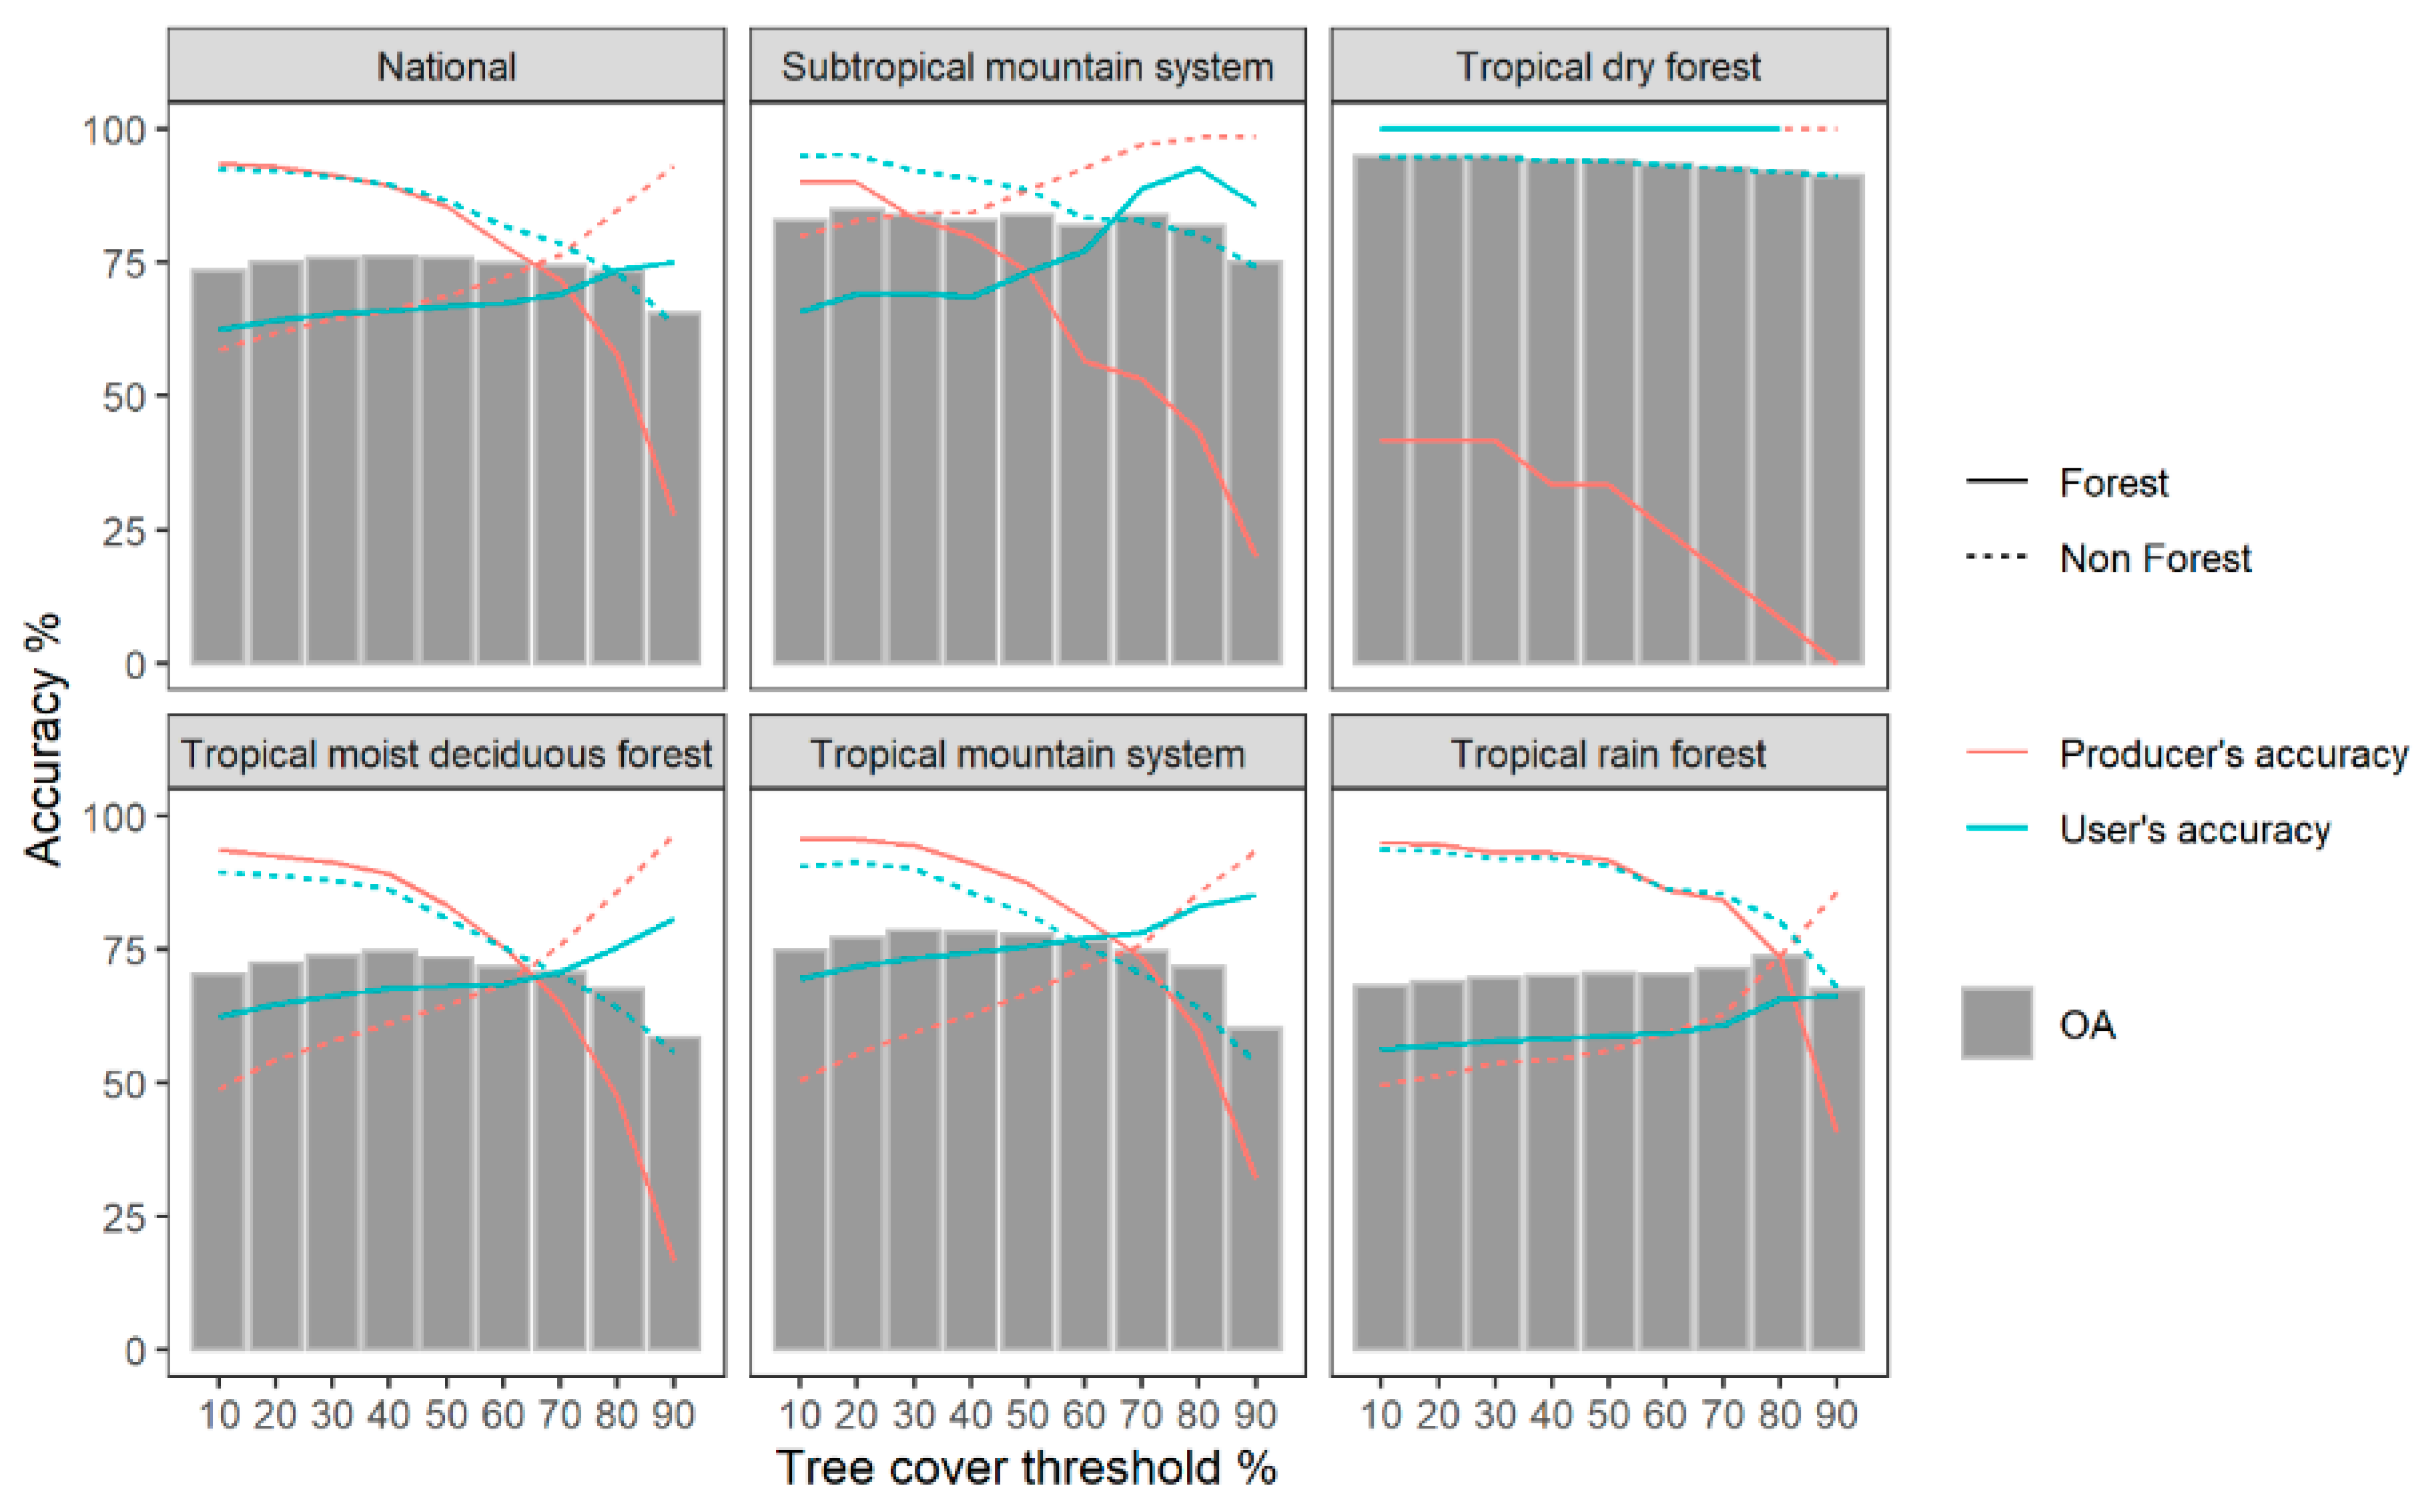
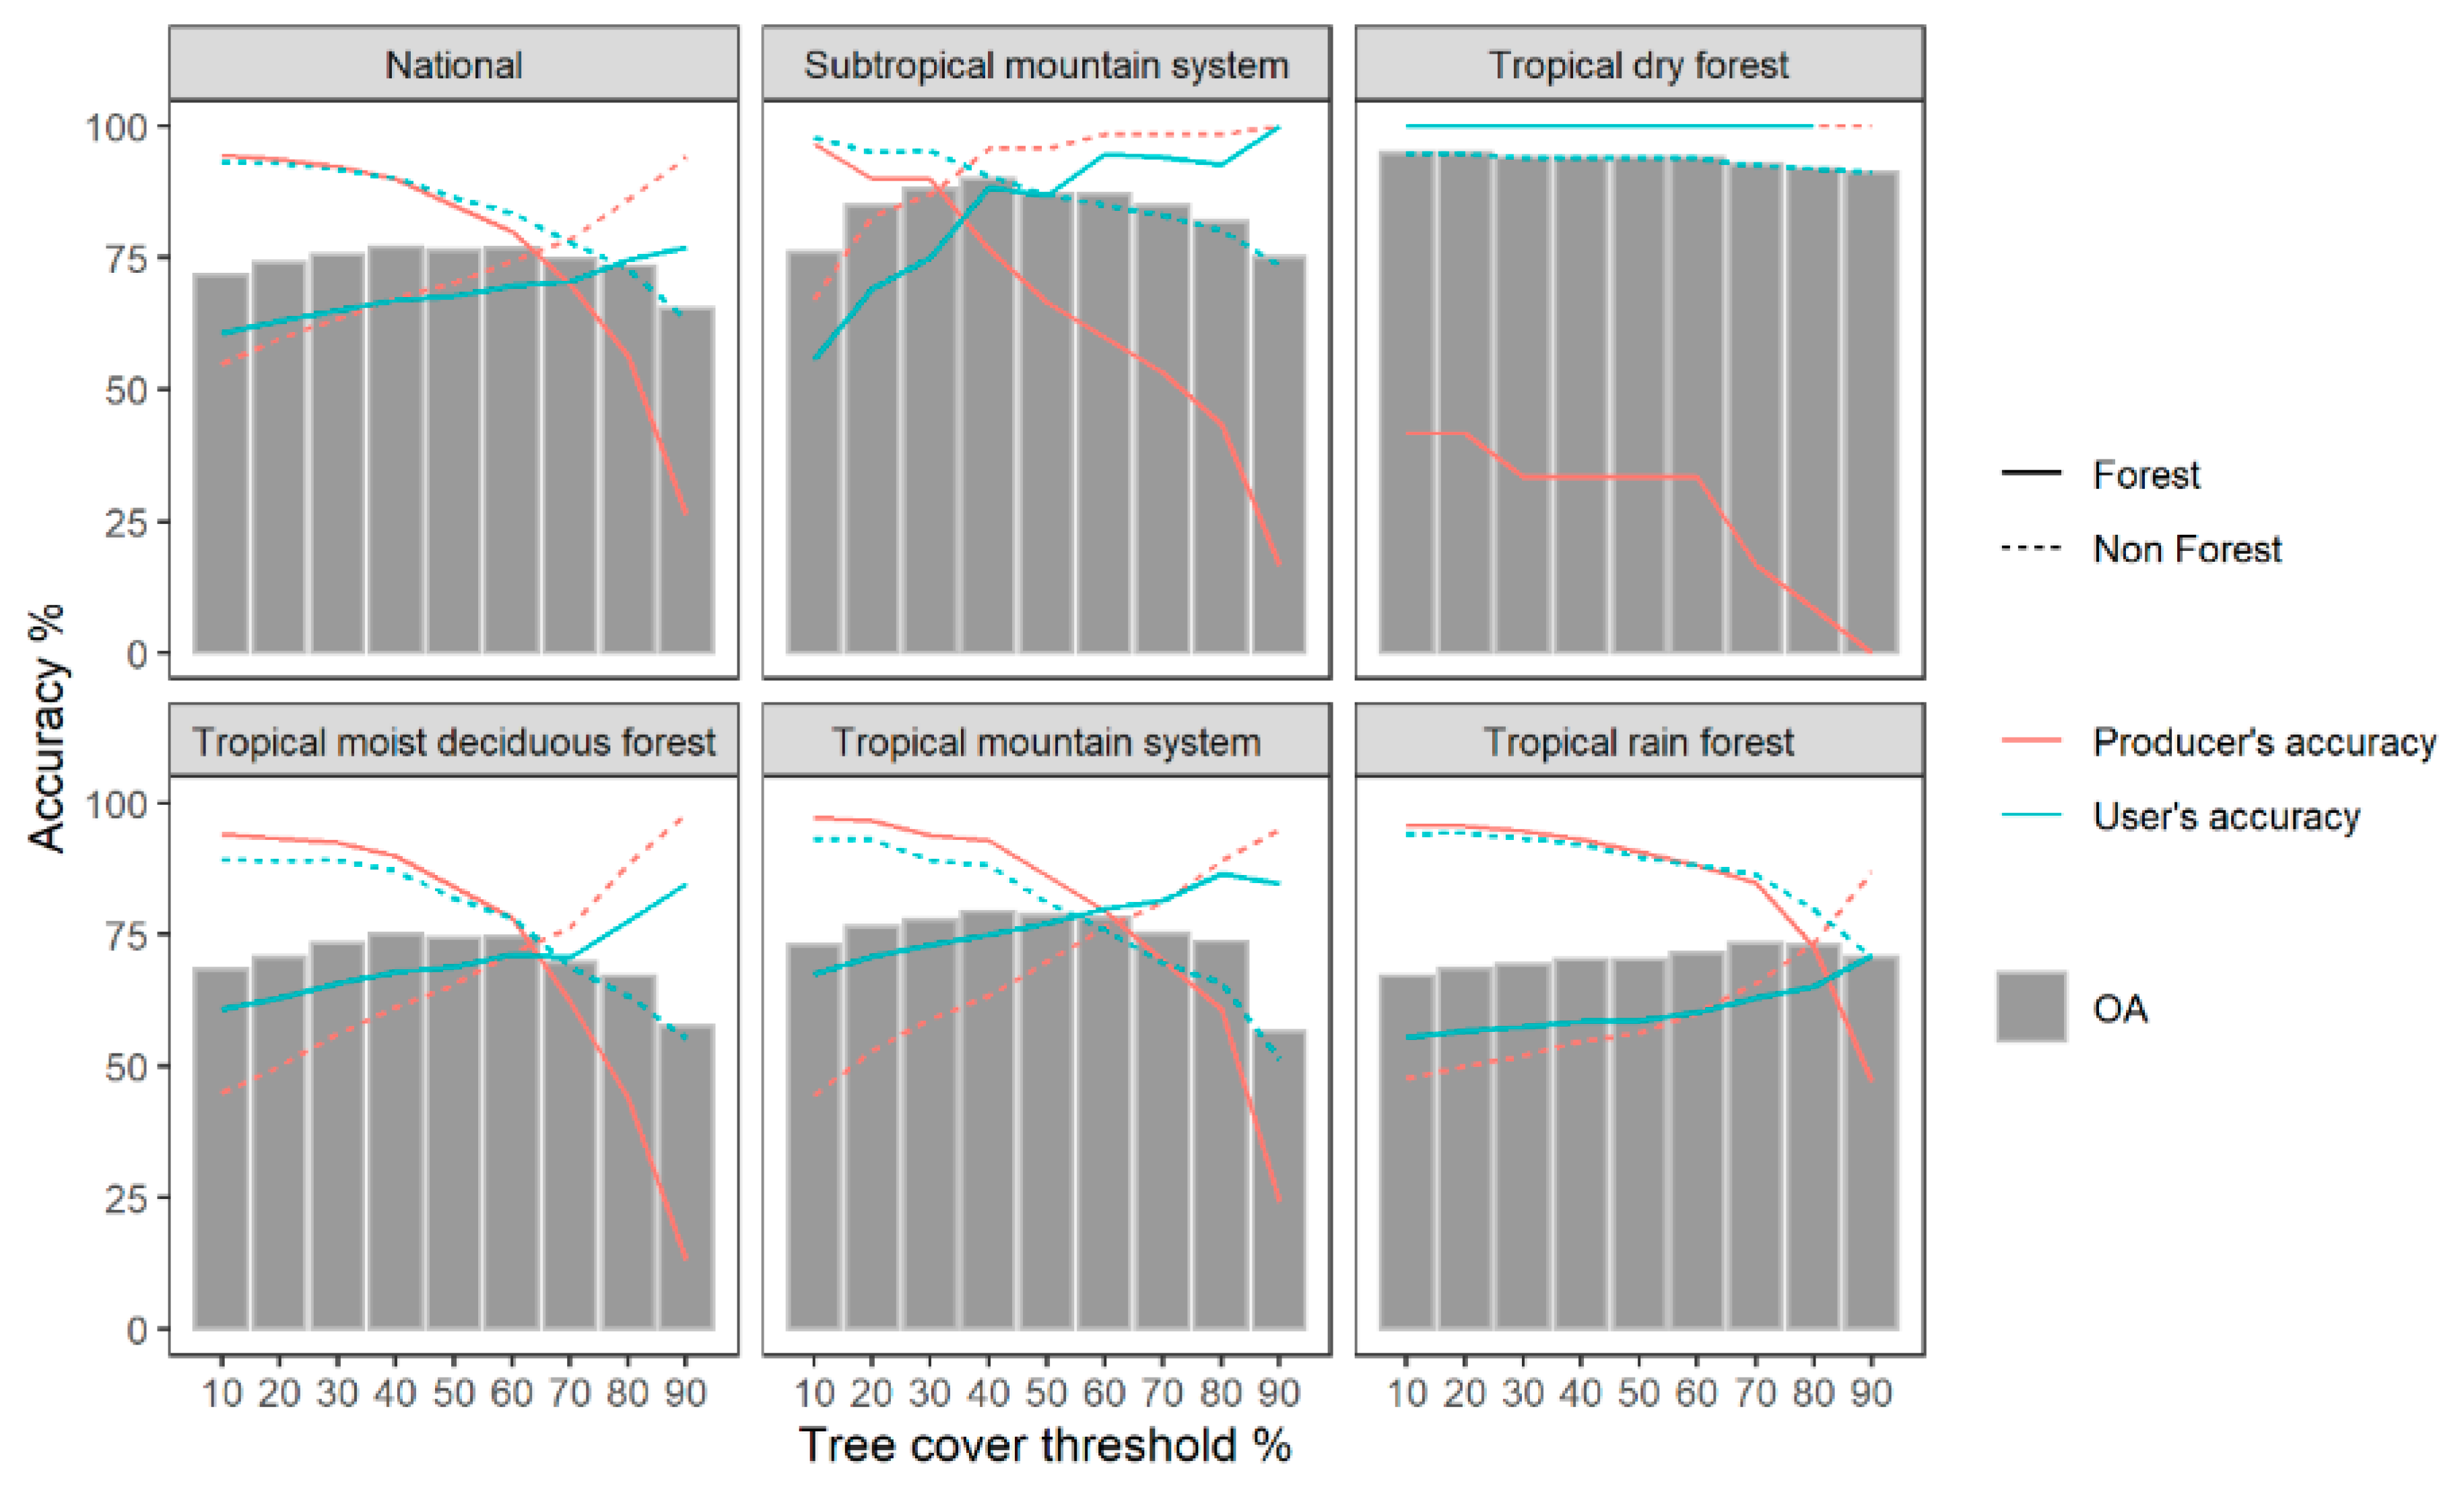
3.2. Accuracy Assessment

3.2.1. Ecological Zones

The OA, UA and PA for each ecological zone using original percent tree cover are shown in Figure 4; there are different accuracies for different tree cover thresholds in different ecological zones. In the subtropical mountain system, the OA ranged from 75% to 85% and the highest OA was obtained when the tree cover threshold was 20%. The OA was stable, with a range from 82% to 85% when tree cover threshold changed from 10% to 80%; but it gradually decreased, when the tree cover threshold changed from 80% to 90%. The OA of the tropical dry forest was over 90% for all tree cover thresholds. The highest OA was obtained between tree cover thresholds of 10% and 30%; it also decreased with further increases in tree cover threshold. In the tropical moist deciduous forest, the OA ranged from 58.4% to 74.6% and the highest OA was found at a 40% tree cover threshold. The OA increased, when the tree cover threshold increased from 10% to 40%; but it gradually decreased with an increase in the tree cover threshold from 50% to 90%. The OA of the tropical mountain system showed a similar trend to that of tropical moist deciduous forest and ranged from 60.2% to 78.4%. The OA gradually increased in accordance with the threshold of tree cover, when the threshold was between 10% and 30%. The OA then gradually decreased. Although the OAs of the other ecological zones were highest when the threshold of tree cover was between 10% and 40%, the tropical rainforest zone needed a tree cover threshold of 80% to achieve highest OA. The OA of the tropical rainforest increased from 68.1% at 10% tree cover threshold to 73.7% at 80% threshold and then decreased to 67.5% at 90% tree cover threshold. Therefore, the highest OA was found at various optimal tree cover thresholds, depending on the ecological zone.
The UAs and PAs of forest and non-forest areas for each ecological zone showed similar trends, except for the tropical dry forest zone. The UAs of forest and PAs of non-forest areas increased with an increase of tree cover threshold from 10% to 90%, while the PAs of forest and UAs of non-forest decreased. In the tropical dry forest zone, the UAs of forest and non-forest and PAs of non-forest were nearly 100%, indicating they were independent of the tree cover threshold. However, the PA of forest decreased in accordance with increasing tree cover threshold. The PA only reached a maximum of 41.7% and showed lower values than the PA of forest in other ecological zones.
The OA, UA and PA values for each ecological zone using the average of percent tree cover are shown in Figure 5. The results were similar to the results for the original percent tree cover. The highest OAs were slightly higher than those using the original percent tree cover in the tropical mountain system, subtropical mountain system, and tropical moist deciduous forest.
In the tropical dry forest, the highest OAs were same as those using the original percent tree cover. In the tropical rainforest, the highest OAs were lower than those using the original percent tree cover. The highest OAs of the two options were different, with a maximum difference between the two of 7% for the subtropical mountain system. The optimal thresholds using the average of percent tree cover were different from those using the original percent tree cover in the subtropical mountain system, tropical mountain system, and tropical rainforest. The highest OAs were achieved at 40% threshold in the subtropical mountain system and tropical mountain system, and at 70% threshold in the tropical rainforest.

3.2.2. National Scale

At a national scale, when the tree cover threshold was uniquely determined for the whole country using original percent tree cover (see Supplementary Materials), the OA was almost stable between 10% and 80% tree cover thresholds (Figure 4). The OA decreased when the tree cover threshold changed from 80% to 90%. The highest OA was 76.1%, when the tree cover threshold was 40%. Figure 6 shows forest cover maps using 40% and 90% tree cover thresholds, which gave the highest and lowest OAs, respectively. The UA of forest increased in accordance with an increase in the tree cover threshold from 10% to 90%. In contrast, the PA of forest continuously decreased from 93.5% to 27.9%, when the tree cover threshold changed from 10% to 90%.
When the tree cover threshold was determined by the optimal thresholds of tree cover from the ecological zones using the original percent tree cover, OA was 77.5%. The PA and UA of forest were 85.1% and 69.0%, respectively. The PA and UA of non-forest were 71.9% and 86.8%, respectively. McNemar’s test showed that there was no significant difference at the 0.05 level between the highest OA, when the tree cover threshold was uniquely determined for the whole country (i.e., the OA when the tree cover threshold was 40%) and the OA when the tree cover threshold was determined by the optimal thresholds of tree cover from the ecological zones.
When average tree cover percent was used, the results at a national scale showed similar results. When the tree cover threshold was uniquely determined, the highest OA was 77%. This was achieved when the tree cover threshold was 40%, as for the original percent tree cover and the lowest accuracy was found at 90% tree cover threshold. Forest cover maps at 40% and 90% tree cover threshold which have highest and lowest OAs were shown in Figure 7. When the tree cover threshold was determined by the optimal thresholds of tree cover from the ecological zones, the highest OA was 78.1%. There was no significant difference at the 0.05 confidence level between the highest OA when the tree cover threshold was uniquely determined and the OA when the tree cover threshold was determined by the optimal thresholds of tree cover from the ecological zones.

4. Discussion

The GFCD is a powerful dataset that provides data on tree cover, forest loss, and forest gain. However, to create a forest cover map from the GFCD, we need to choose an appropriate tree cover threshold. Not surprisingly, the tree cover threshold affects the estimated forest cover (Figure 3). An arbitrary choice of tree cover threshold may yield an overestimation or underestimation of forest cover. Thus, appropriate determination of the threshold is of practical importance. Here, we investigated the accuracy of the GFCD across different ecological zones based on a country-scale evaluation of Myanmar.
We tested forest cover maps using original tree cover percent downloaded from the website of GFCD and average tree cover percent of neighboring pixels. In both cases, the results of OA, UA and PA showed similar trends in different ecological zones. In addition, the optimal threshold at a national scale was 40% for both cases and the highest OAs showed little difference. Therefore, neighboring pixels were not necessary for accurate forest cover mapping using the GFCD.
We clearly showed that different tree cover thresholds were required to achieve the highest OA for different ecological zones. The OAs of ecological zones other than the tropical rainforest were highest when the tree cover threshold was less than 50%. However, an 80% tree cover threshold was required to achieve the highest OA in the tropical rainforest. Previous studies that used the GFCD have selected different thresholds. The studies in Cambodia used 30% as the threshold [14], while a study in Brazil demonstrated that a 95% threshold yielded the highest OA [21] and a 70% threshold had the highest OA in Gabon [18]. According to the Global Ecological Zones [29], Cambodia is dominated by tropical dry forest and tropical moist deciduous forest, but Brazil and Gabon are dominated by tropical rainforest, although tropical moist deciduous forests are sub-dominant in Brazil. Because our results showed that a higher threshold is required for tropical rainforest, the differences in the thresholds among countries may be explained by the differences in their dominant ecological zones. In this study, a 40% tree cover threshold was optimal to get the highest overall accuracy in tropical moist deciduous forest. A case study of Gola National Park in Sierra Leone [20] used 50% tree cover threshold, where tropical moist deciduous forest is dominant, to achieve an accuracy of more than 90%. Therefore, our study generally confirms that different tree cover thresholds are necessary for different ecological zones, when creating forest cover maps using the GFCD.
While our results indicated that the best threshold to achieve the highest OA depended on the ecological zone, we also showed that the threshold could be uniquely determined for the whole country. The optimal threshold for each ecological zone, except for tropical rainforest, was concentrated between 10% and 40%. In addition, the variations of the OA for each ecological zone, (except for tropical rainforest), when tree cover threshold was between 10% and 40%, were small. Thus, the effect of changing the threshold on the OA was limited for all ecological zones, except for tropical rainforest. The difference in optimal thresholds and the area ratio between the tropical rainforest and the other zones will substantially affect the optimal threshold at the national scale. In the case of Myanmar, tropical rainforests occupied only approximately 30% of the total area and the remainder was occupied by other ecological zones. Because most of the land was covered by ecological zones other than tropical rainforests, the OA could be uniquely determined over the whole country. However, the threshold may need to be determined by the ecological zone in regions, where tropical rainforests occupy more area than in Myanmar.
According to the FRA 2015 [27], forests covered approximately 42.92% of the total land area in Myanmar. Thus, the GFCD overestimated the forest cover even at a 40% tree cover threshold, which yielded the highest OA at national scale. As shown in Figure 4 and Table S4, when the OA was the highest with 76.1% at a 40% tree cover threshold at national scale, the UA of forest with 66.1% had a lower value than the PA of forest with 89.5%. This trend reflects an overestimation of the forest class. The overestimation of forest was observed, when the tree cover threshold was between 10% and 70%. Because a threshold between 10% and 50% is commonly applied (e.g., [14,15,16,17]), the overestimation of forest area when the GFCD is used needs to be considered. The other reason for the overestimation was linked to the definition of forest. In this study, we defined the forest based on a visual interpretation of tree crowns. In the case of the forest cover reported by the FRA 2015 [27], “forest does not include land that is predominantly under agricultural or urban land use” [57] (p. 3). Thus, land covers such as fruit tree plantations and oil palm plantations are not included in the forest cover reported by the FRA 2015 [27]. However, because the tree cover in the GFCD does not take into account the land use of forests, forest areas derived from the GFCD will be overestimated.
In this study, we evaluated the effect of different tree cover thresholds on the accuracy of forest cover maps from the GFCD and the importance of tree cover thresholds in five ecological zones, distributed across Myanmar. Our results could be applied to the other regions having the same ecological zones as Myanmar, especially within the tropics. Because Myanmar is located in a tropical region, our study focused on only a limited number of ecological zones. Further study focusing on temperate and boreal regions is also required to refine this method. Clearly, direct comparison among different tropical countries would also be worthwhile.

5. Conclusions

Tree cover threshold is one of the important indicators used to create forest cover maps from remote sensing data. This study evaluated the effect of changing tree cover thresholds on the accuracy of forest cover maps derived from the GFCD and the importance of tree cover thresholds for creating forest cover maps from the GFCD for large-area monitoring. We clearly showed that OA of forest cover maps increased or decreased in accordance with the change of tree cover thresholds for nine different thresholds from 10% to 90% and that the range of effect of changing tree cover threshold on the accuracy was different in five ecological zones. Because the highest OA was found at various thresholds for different ecological zones, different optimal tree cover thresholds should be selected to achieve the highest OA. However, in the unique case of Myanmar, we were able to determine the threshold over the whole country. We concluded that the threshold of tree cover for creating a forest cover map from the GFCD at national scale should be determined according to the areal ratio of ecological zones. The results from our study suggest a need to consider tree cover threshold, when creating forest cover maps from the GFCD, especially in regions where tropical rainforest is dominant. Because our study focused on tropical forest regions, further study is needed in temperate and boreal regions. Clearly, comparative study of different tropical countries is also necessary.

Supplementary Materials

The following are available online at https://www.mdpi.com/1999-4907/10/12/1062/s1, Figure S1: Forest cover maps in 2016 using tree cover percent in one pixel and (3 × 3) pixels at 10% tree cover threshold, Figure S2: Forest cover maps in 2016 using tree cover percent in one pixel and (3 × 3) pixels at 20% tree cover threshold, Figure S3: Forest cover maps in 2016 using tree cover percent in one pixel and (3 × 3) pixels at 30% tree cover threshold, Figure S4: Forest cover maps in 2016 using tree cover percent in one pixel and (3 × 3) pixels at 40% tree cover threshold, Figure S5: Forest cover maps in 2016 using tree cover percent in one pixel and (3 × 3) pixels at 50% tree cover threshold, Figure S6: Forest cover maps in 2016 using tree cover percent in one pixel and (3 × 3) pixels at 60% tree cover threshold, Figure S7: Forest cover maps in 2016 using tree cover percent in one pixel and (3 × 3) pixels at 70% tree cover threshold, Figure S8: Forest cover maps in 2016 using tree cover percent in one pixel and (3 × 3) pixels at 80% tree cover threshold, Figure S9: Forest cover maps in 2016 using tree cover percent in one pixel and (3 × 3) pixels at 90% tree cover threshold, Table S1: Accuracies of forest cover maps in 2016 using one pixel and (3 × 3) pixels at 10% tree cover threshold, Table S2: Accuracies of forest cover maps in 2016 using one pixel and (3 × 3) pixels at 20% tree cover threshold, Table S3: Accuracies of forest cover maps in 2016 using one pixel and (3 × 3) pixels at 30% tree cover threshold, Table S4: Accuracies of forest cover maps in 2016 using one pixel and (3 × 3) pixels at 40% tree cover threshold, Table S5: Accuracies of forest cover maps in 2016 using one pixel and (3 × 3) pixels at 50% tree cover threshold, Table S6: Accuracies of forest cover maps in 2016 using one pixel and (3 × 3) pixels at 60% tree cover threshold, Table S7: Accuracies of forest cover maps in 2016 using one pixel and (3 × 3) pixels at 70% tree cover threshold, Table S8: Accuracies of forest cover maps in 2016 using one pixel and (3 × 3) pixels at 80% tree cover threshold, Table S9: Accuracies of forest cover maps in 2016 using one pixel and (3 × 3) pixels at 90% tree cover threshold.

Author Contributions

K.K.L., T.O. and K.S. performed the analysis and wrote the manuscript. N.M. supervised and provided comments and suggestions for the research and reviewed the manuscript.

Funding

This study was funded by JSPS KAKENHI [grant number JP19H04339] and a Grant for Environmental Research Projects from the Sumitomo Foundation.

Acknowledgments

We would like to thank the Ministry of Education, Culture, Sports, Science and Technology (MEXT) of Japan which provided the scholarship for Kay Khaing Lwin and the Forest Department, which provided information about forestry in Myanmar. We also thank Leonie Seabrook and Trudi Semeniuk, from Edanz Group (www.edanzediting.com/ac), for editing a draft of this manuscript.

Conflicts of Interest

The authors declare no conflict of interest.

References

  1. Keenan, R.J.; Reams, G.A.; Achard, F.; de Freitas, J.V.; Grainger, A.; Lindquist, E. Dynamics of global forest area: Results from the FAO Global Forest Resources Assessment 2015. For. Ecol. Manag. 2015, 352, 9–20. [Google Scholar] [CrossRef]
  2. Baccini, A.; Walker, W.; Carvalho, L.; Farina, M.; Sulla-Menashe, D.; Houghton, R.A. Tropical forests are a net carbon source based on aboveground measurements of gain and loss. Science 2017, 358, 230–234. [Google Scholar] [CrossRef] [PubMed]
  3. Houghton, R. Carbon emissions and the drivers of deforestation and forest degradation in the tropics. Curr. Opin. Environ. Sustain. 2012, 4, 597–603. [Google Scholar] [CrossRef]
  4. Brooks, T.M.; Mittermeier, R.A.; Mittermeier, C.G.; da Fonseca, G.A.B.; Rylands, A.B.; Konstant, W.R.; Flick, P.; Pilgrim, J.; Oldfield, S.; Magin, G.; et al. Habitat Loss and Extinction in the Hotspots of Biodiversity. Conserv. Biol. 2002, 16, 909–923. [Google Scholar] [CrossRef]
  5. Giam, X. Global biodiversity loss from tropical deforestation. Proc. Natl. Acad. Sci. USA 2017, 114, 5775–5777. [Google Scholar] [CrossRef] [PubMed]
  6. Hughes, A.C. Understanding the drivers of Southeast Asian biodiversity loss. Ecosphere 2017, 8, e01624. [Google Scholar] [CrossRef]
  7. Gómez, C.; White, J.C.; Wulder, M.A. Optical remotely sensed time series data for land cover classification: A review. ISPRS J. Photogramm. Remote Sens. 2016, 116, 55–72. [Google Scholar] [CrossRef]
  8. Wulder, M.A.; White, J.C.; Goward, S.N.; Masek, J.G.; Irons, J.R.; Herold, M.; Cohen, W.B.; Loveland, T.R.; Woodcock, C.E. Landsat continuity: Issues and opportunities for land cover monitoring. Remote Sens. Environ. 2008, 112, 955–969. [Google Scholar] [CrossRef]
  9. Turner, W.; Rondinini, C.; Pettorelli, N.; Mora, B.; Leidner, A.K.; Szantoi, Z.; Buchanan, G.; Dech, S.; Dwyer, J.; Herold, M.; et al. Free and open-access satellite data are key to biodiversity conservation. Biol. Conserv. 2015, 182, 173–176. [Google Scholar] [CrossRef]
  10. Hansen, M.C.; Potapov, P.V.; Moore, R.; Hancher, M.; Turubanova, S.A.; Tyukavina, A.; Thau, D.; Stehman, S.V.; Goetz, S.J.; Loveland, T.R.; et al. High-Resolution Global Maps of 21st-Century Forest Cover Change. Science 2013, 342, 850–853. [Google Scholar] [CrossRef]
  11. Oldekop, J.A.; Sims, K.R.E.; Karna, B.K.; Whittingham, M.J.; Agrawal, A. Reductions in deforestation and poverty from decentralized forest management in Nepal. Nat. Sustain. 2019, 2, 421–428. [Google Scholar] [CrossRef]
  12. Pelletier, J.; Gélinas, N.; Potvin, C. Indigenous perspective to inform rights-based conservation in a protected area of Panama. Land Use Policy 2019, 83, 297–307. [Google Scholar] [CrossRef]
  13. Santika, T.; Meijaard, E.; Budiharta, S.; Law, E.A.; Kusworo, A.; Hutabarat, J.A.; Indrawan, T.P.; Struebig, M.; Raharjo, S.; Huda, I.; et al. Community forest management in Indonesia: Avoided deforestation in the context of anthropogenic and climate complexities. Glob. Environ. Chang. 2017, 46, 60–71. [Google Scholar] [CrossRef]
  14. Davis, K.F.; Yu, K.; Rulli, M.C.; Pichdara, L.; D’Odorico, P. Accelerated deforestation driven by large-scale land acquisitions in Cambodia. Nat. Geosci. 2015, 8, 772–775. [Google Scholar] [CrossRef]
  15. Lonn, P.; Mizoue, N.; Ota, T.; Kajisa, T.; Yoshida, S. Biophysical Factors Affecting Forest Cover Changes in Community Forestry: A Country Scale Analysis in Cambodia. Forests 2018, 9, 273. [Google Scholar] [CrossRef]
  16. Lonn, P.; Mizoue, N.; Ota, T.; Kajisa, T.; Yoshida, S. Using Forest Cover Maps and Local People’s Perceptions to Evaluate the Effectiveness of Community-based Ecotourism for Forest Conservation in Chambok (Cambodia). Environ. Conserv. 2019, 46, 111–117. [Google Scholar] [CrossRef]
  17. Potapov, P.; Hansen, M.C.; Laestadius, L.; Turubanova, S.; Yaroshenko, A.; Thies, C.; Smith, W.; Zhuravleva, I.; Komarova, A.; Minnemeyer, S.; et al. The last frontiers of wilderness: Tracking loss of intact forest landscapes from 2000 to 2013. Sci. Adv. 2017, 3, e1600821. [Google Scholar] [CrossRef]
  18. Sannier, C.; McRoberts, R.E.; Fichet, L. Suitability of Global Forest Change data to report forest cover estimates at national level in Gabon. Remote Sens. Environ. 2016, 173, 326–338. [Google Scholar] [CrossRef]
  19. Yang, Z.; Dong, J.; Liu, J.; Zhai, J.; Kuang, W.; Zhao, G.; Shen, W.; Zhou, Y.; Qin, Y.; Xiao, X. Accuracy Assessment and Inter-Comparison of Eight Medium Resolution Forest Products on the Loess Plateau, China. ISPRS Int. J. Geo Inf. 2017, 6, 152. [Google Scholar] [CrossRef]
  20. Lui, G.V.; Coomes, D.A. A comparison of novel optical remote sensing-based technologies for forest-cover/change monitoring. Remote Sens. 2015, 7, 2781–2807. [Google Scholar] [CrossRef]
  21. McRoberts, R.E.; Vibrans, A.C.; Sannier, C.; Næsset, E.; Hansen, M.C.; Walters, B.F.; Lingner, D.V. Methods for evaluating the utilities of local and global maps for increasing the precision of estimates of subtropical forest area. Can. J. For. Res. 2016, 46, 924–932. [Google Scholar] [CrossRef]
  22. Arjasakusuma, S.; Kamal, M.; Hafizt, M.; Forestriko, H.F. Local-scale accuracy assessment of vegetation cover change maps derived from Global Forest Change data, ClasLite, and supervised classifications : Case study at part of Riau Province, Indonesia. Appl. Geomat. 2018, 10, 205–217. [Google Scholar] [CrossRef]
  23. Burivalova, Z.; Bauert, M.R.; Hassold, S.; Fatroandrianjafinonjasolomiovazo, N.T.; Koh, L.P. Relevance of Global Forest Change Data Set to Local Conservation : Case Study of Forest Degradation in Masoala National Park, Madagascar. Biotropica 2015, 47, 267–274. [Google Scholar] [CrossRef]
  24. Linke, J.; Fortin, M.; Courtenay, S.; Cormier, R. High-resolution global maps of 21st-century annual forest loss: Independent accuracy assessment and application in a temperate forest region of Atlantic Canada. Remote Sens. Environ. 2017, 188, 164–176. [Google Scholar] [CrossRef]
  25. Mitchard, E.; Viergever, K.; Morel, V.; Tipper, R. Assessment of the Accuracy of University of Maryland (Hansen et al.) Forest Loss Data in 2 ICF Project Areas—Component of a Project that Tested an ICF Indicator Methodology, 2015.
  26. Food and Agriculture Organization (FAO). Global Forest Resources Assessment 2015: How Are the World’s Forests Changing? 2nd ed.; FAO: Rome, Italy, 2016; ISBN 9789251092835. [Google Scholar]
  27. Food and Agriculture Organization (FAO). Global Forest Resource Assessment 2015 Country Report: Myanmar; FAO: Rome, Italy, 2014. [Google Scholar]
  28. Food and Agriculture Organization (FAO). Global Ecological Zones for FAO Forest Reporting: 2010 Update; FAO: Rome, Italy, 2012. [Google Scholar]
  29. Simons, H. FRA 2000.Global Ecological Zoning for the Global Forest Resources Assessment 2000: Final Report; FAO: Rome, Italy, 2001. [Google Scholar]
  30. GADM. Available online: https://gadm.org/download_world.html (accessed on 3 November 2017).
  31. Global Forest Change. Available online: https://earthenginepartners.appspot.com/science-2013-global-forest/download_v1.2.html (accessed on 3 November 2017).
  32. Global Ecological Zone. Available online: http://193.43.36.20/map?entryId=baa463d0-88fd-11da-a88f-000d939bc5d8 (accessed on 29 May 2018).
  33. Olofsson, P.; Foody, G.M.; Herold, M.; Stehman, S.V.; Woodcock, C.E.; Wulder, M.A. Good practices for estimating area and assessing accuracy of land change. Remote Sens. Environ. 2014, 148, 42–57. [Google Scholar] [CrossRef]
  34. Sepal Platform. Available online: https://sepal.io/ (accessed on 15 August 2018).
  35. Food and Agriculture Organization (FAO). Map Accuracy Assessment and Area Estimation: A Practical Guide; FAO: Rome, Italy, 2016. [Google Scholar]
  36. Venkatappa, M.; Sasaki, N.; Shrestha, R.P.; Tripathi, N.K.; Ma, H.O. Determination of vegetation thresholds for assessing land use and land use changes in Cambodia using the Google Earth Engine cloud-computing platform. Remote Sens. 2019, 11, 1514. [Google Scholar] [CrossRef]
  37. Tilahun, A.; Teferie, B. Accuracy Assessment of Land Use Land Cover Classification using Google Earth. Am. J. Environ. Prot. 2015, 4, 193. [Google Scholar] [CrossRef]
  38. Rwanga, S.S.; Ndambuki, J.M. Accuracy Assessment of Land Use/Land Cover Classification Using Remote Sensing and GIS. Int. J. Geosci. 2017, 8, 611–622. [Google Scholar] [CrossRef]
  39. Brun, C.; Cook, A.R.; Lee, J.S.H.; Wich, S.A.; Koh, L.P.; Carrasco, L.R. Analysis of deforestation and protected area effectiveness in Indonesia: A comparison of Bayesian spatial models. Glob. Environ. Chang. 2015, 31, 285–295. [Google Scholar] [CrossRef]
  40. Yang, Y.; Xiao, P.; Feng, X.; Li, H. Accuracy assessment of seven global land cover datasets over China. ISPRS J. Photogramm. Remote Sens. 2017, 125, 156–173. [Google Scholar] [CrossRef]
  41. Dhar, R.B.; Chakraborty, S.; Chattopadhyay, R.; Sikdar, P.K. Impact of Land-Use/Land-Cover Change on Land Surface Temperature Using Satellite Data: A Case Study of Rajarhat Block, North 24-Parganas District, West Bengal. J. Indian Soc. Remote Sens. 2019, 47, 331–348. [Google Scholar] [CrossRef]
  42. Yang, R.; Luo, Y.; Yang, K.; Hong, L.; Zhou, X. Analysis of forest deforestation and its driving factors in Myanmar from 1988 to 2017. Sustainability 2019, 11, 3047. [Google Scholar] [CrossRef] [Green Version]
  43. Potere, D. Horizontal Positional Accuracy of Google Earth’s High-Resolution Imagery Archive. Sensors 2008, 8, 7973–7981. [Google Scholar] [CrossRef] [PubMed]
  44. Mahdianpari, M.; Salehi, B.; Mohammadimanesh, F.; Homayouni, S.; Gill, E. The first wetland inventory map of newfoundland at a spatial resolution of 10 m using sentinel-1 and sentinel-2 data on the Google Earth Engine cloud computing platform. Remote Sens. 2019, 11, 43. [Google Scholar] [CrossRef] [Green Version]
  45. Poortinga, A.; Tenneson, K.; Shapiro, A.; Nquyen, Q.; Aung, K.S.; Chishtie, F.; Saah, D. Mapping plantations in Myanmar by fusing Landsat-8, Sentinel-2 and Sentinel-1 data along with systematic error quantification. Remote Sens. 2019, 11, 831. [Google Scholar] [CrossRef] [Green Version]
  46. Bey, A.; Sanchez-Paus, A.; Pekkarinen, A.; Patriarca, C.; Maniatis, D.; Weil, D.; Mollicone, D.; Marchi, G.; Niskala, J.; Rezende, M.; et al. Open Foris: Collect Earth 1.1.1 User Manual; FAO: Rome, Italy, 2015. [Google Scholar]
  47. Bey, A.; Díaz, A.S.P.; Maniatis, D.; Marchi, G.; Mollicone, D.; Ricci, S.; Bastin, J.F.; Moore, R.; Federici, S.; Rezende, M.; et al. Collect earth: Land use and land cover assessment through augmented visual interpretation. Remote Sens. 2016, 8, 807. [Google Scholar] [CrossRef] [Green Version]
  48. Bastin, J.F.; Berrahmouni, N.; Grainger, A.; Maniatis, D.; Mollicone, D.; Moore, R.; Patriarea, C.; Picard, N.; Sparrow, B.; Abraham, E.M.; et al. The extent of forest in dryland biomes. Science 2017, 356, 635–638. [Google Scholar] [CrossRef] [Green Version]
  49. Mitri, G.; Nasrallah, G.; Gebrael, K.; Bou Nassar, M.; Abou Dagher, M.; Nader, M.; Masri, N.; Choueiter, D. Assessing land degradation and identifying potential sustainable land management practices at the subnational level in Lebanon. Environ. Monit. Assess. 2019, 191, 567. [Google Scholar] [CrossRef]
  50. Leite, A.; Cáceres, A.; Melo, M.; Mills, M.S.L.; Monteiro, A.T. Reducing emissions from Deforestation and forest Degradation in Angola: Insights from the scarp forest conservation ‘hotspot’. Land Degrad. Dev. 2018, 29, 4291–4300. [Google Scholar] [CrossRef]
  51. Vega Isuhuaylas, L.A.; Hirata, Y.; Santos, L.C.V.; Torobeo, N.S. Natural forest mapping in the Andes (Peru): A comparison of the performance of machine-learning algorithms. Remote Sens. 2018, 10, 782. [Google Scholar] [CrossRef] [Green Version]
  52. De Alban, J.D.T.; Prescott, G.W.; Woods, K.M.; Jamaludin, J.; Latt, K.T.; Lim, C.L.; Maung, A.C.; Webb, E.L. Integrating analytical frameworks to investigate land-cover regime shifts in dynamic landscapes. Sustainability 2019, 11, 1139. [Google Scholar] [CrossRef] [Green Version]
  53. Muro, J.; Strauch, A.; Heinemann, S.; Steinbach, S.; Thonfeld, F.; Waske, B.; Diekkrüger, B. Land surface temperature trends as indicator of land use changes in wetlands. Int. J. Appl. Earth Obs. Geoinf. 2018, 70, 62–71. [Google Scholar] [CrossRef]
  54. Pelletier, J.; Chidumayo, E.; Trainor, A.; Siampale, A.; Mbindo, K. Distribution of tree species with high economic and livelihood value for Zambia. For. Ecol. Manag. 2019, 441, 280–292. [Google Scholar] [CrossRef]
  55. Messina, M.; Cunliffe, R.; Farcomeni, A.; Malatesta, L.; Smit, I.P.J.; Testolin, R.; Ribeiro, N.S.; Nhancale, B.; Vitale, M.; Attorre, F. An innovative approach to disentangling the effect of management and environment on tree cover and density of protected areas in African savanna. For. Ecol. Manag. 2018, 419–420, 1–9. [Google Scholar] [CrossRef]
  56. Asrat, Z.; Taddese, H.; Ørka, H.O.; Gobakken, T.; Burud, I.; Næsset, E. Estimation of forest area and canopy cover based on visual interpretation of satellite images in Ethiopia. Land 2018, 7, 92. [Google Scholar] [CrossRef] [Green Version]
  57. Food and Agriculture Organization (FAO). Forest Resoruce Assessment 2015 Terms and Definition; FAO: Rome, Italy, 2012. [Google Scholar]
  58. Foody, G.M. Thematic map comparison: Evaluating the statistical significance of differences in classification accuracy. Photogramm. Eng. Remote Sens. 2004, 70, 627–633. [Google Scholar] [CrossRef]
Figure 1. (a) Forest Cover Change from 2001–2016, (b) Five ecological zones showing sample points in Myanmar. The country border data were downloaded from the Database of Global Administrative Areas (GADM) [30], Forest Cover Change Data were from the Global Forest Change website [31] and the ecological zones were from the Food and Agricultural Organization website [32].
Forests 10 01062 g001
Figure 2. Geo-synchronized view of each sample using Collect Earth Software: (a) Google Earth image, (b) Bing Map image, (c) Google Earth Engine showing normalized difference vegetation index (NDVI) values and different satellite images, such as Sentinel-2, Landsat 7, Landsat 8, (d) schematic of a 0.49 ha plot with 25 points. The red point in the center of the plot represents the original sample described in Section 2.3.1.
Forests 10 01062 g002
Figure 3. Percentage of forest and non-forest in 2016 at the national scale and in the five ecological zones (a) using original percent tree cover and (b) using average tree cover percent of 3 × 3 neighboring pixels.
Forests 10 01062 g003
Figure 4. Overall accuracy (OA), producer’s accuracy, and user’s accuracy for forest and non-forest areas at the national scale and in the five ecological zones using original percent tree cover.
Forests 10 01062 g004
Figure 5. Overall accuracy (OA), producer’s accuracy, and user’s accuracy for forest and non-forest areas at the national scale and in the five ecological zones using the average tree cover percent of nine neighboring pixels.
Forests 10 01062 g005
Figure 6. Forest cover maps for 2016 developed from the Global Forest Cover Database (GFCD) using original tree cover percent in 2000 [10] and (a) 40% tree cover threshold, or (b) 90% tree cover threshold.
Forests 10 01062 g006
Figure 7. Forest cover maps for 2016 developed from the Global Forest Cover Database (GFCD) using average tree cover percent of neighboring pixels in 2000 [10] and (a) 40% tree cover threshold, or (b) 90% tree cover threshold.
Forests 10 01062 g007
Table 1. Number of sample points for the five ecological zones.
Ecological ZonesArea (1000 ha)Sample Points
Subtropical Mountain System 412100
Tropical Dry Forest5998137
Tropical Moist Deciduous Forest 23,080527
Tropical Mountain System 14,550334
Tropical Rainforest 22,670502
Total66,7101600

