Article

Temperature, Wind, Cloud, and the Postglacial Tree Line History of Sub-Antarctic Campbell Island

1
Manaaki Whenua-Landcare Research, Lincoln 7640, New Zealand
2
School of Environment, The University of Auckland, Auckland 1142, New Zealand
3
Palaeontology, Geobiology and Earth Archives Research Centre, and ARC Centre of Excellence for Australian Biodiversity and Heritage, School of Biological, Earth and Environmental Sciences, University of New South Wales, New South Wales 2052, Australia
*
Author to whom correspondence should be addressed.
Forests 2019, 10(11), 998; https://doi.org/10.3390/f10110998
Submission received: 3 October 2019 / Revised: 5 November 2019 / Accepted: 5 November 2019 / Published: 7 November 2019
(This article belongs to the Special Issue Alpine and Polar Treelines in a Changing Environment)

Abstract

:
Campbell Island, which is 600 km south of New Zealand, has the southernmost tree line in this ocean sector. Directly under the maximum of the westerlies, the island is sensitive to changes in wind strength and direction. Pollen records from three peat cores spanning the tree line ecotone provide a 17,000-year history of vegetation change, temperature, and site moisture. With postglacial warming, tundra was replaced by tussock grassland 12,500 years ago. A subsequent increase of shrubland was reversed at 10,500 years ago and wetland-grassland communities became dominant. Around 9000 years ago, trees spread, with maximum tree line elevation reached around 6500 to 3000 years ago. This sequence is out of step with Southern Ocean sea surface temperatures, which were warmer than 12,500 to 9000 years ago, and, subsequently, cooled. Campbell Island tree lines were decoupled from temperature trends in the adjacent ocean by weaker westerlies from 12,500 to 9000 years ago, which leads to the intrusion of warmer, cloudier northern airmasses. This reduced solar radiation and evapotranspiration while increasing atmospheric humidity and substrate wetness, which suppressed tree growth. Cooler, stronger westerlies in the Holocene brought clearer skies, drier air, increased evapotranspiration, and rising tree lines. Future global warming will not necessarily lead to rising tree lines in oceanic regions.

1. Introduction

Tree lines are confidently predicted to rise as a result of global climate change in the near future, which will lead to a profound impact on alpine ecosystems [1]. Nevertheless, there are many uncertainties regarding the impact on the tree line ecotone [2] and even some doubt as to whether all tree lines will rise. For instance, a global survey of tree line response to climatic warming over the last 100 years showed that, while some were rapidly advancing, many had either responded sluggishly or not at all [3]. Oceanic tree lines, such as those that characterize New Zealand and southern South America, are among those that have failed to respond to recent warming. Why this may be so, and under what circumstances these tree lines may change, is, therefore, of great interest [4]. The sub-Antarctic islands lying several hundred kilometers to the south of New Zealand offer a unique opportunity to explore these questions.
Two island groups several hundred kilometers to the south of the New Zealand mainland (Auckland and Campbell) are at the southern limit to trees in the Australasian sector of the Southern Ocean (Figure 1). Lying directly under the maximum of the southern westerly wind belt, they have windy, moist, cool, cloudy, and highly oceanic climates and are nearly entirely blanketed with deep organic soils, but have low-growing forest on their leeward flanks [5]. Although local environmental factors can prevent the growth of trees, globally, the high elevation limit to the tree line is associated with a minimum growing season length and mean temperature [6,7]. Palaeoecological studies suggest that tree lines on these islands may have been decoupled from a regional temperature change and, thus, provide an exception to this global pattern [8]. Rise to dominance of the forest in these islands was delayed until the mid-Holocene [8], which is a lag inconsistent with the warm, early postglacial sea surface temperatures (SSTs) in the adjacent ocean [9]. The anomalous response of sub-Antarctic tree lines to oceanic warming may, therefore, have been driven by other factors linked to the westerlies such as humidity, sunshine hours, and wind strength. In this study, we explore this possibility.
In this study, we present the postglacial vegetation, peat, and climatic history of extensive peat bog complexes on the southernmost of these forested islands, including sub-Antarctic Campbell Island (52°34′ S, 169°09′ E) some 600 km south of the New Zealand mainland. Truncated pollen diagrams with pollen-based temperature estimates have been reported [8]. We now provide the full pollen results for these and an additional site, along with moisture proxies. We also present summaries of cloud levels, daily peat water table depth measurements, and peat vegetation studies, which were undertaken many years ago to support ecological studies and mapping, but not compiled until recently [10]. We use these vegetation and peat analyses from bogs with contrasting elevations, exposure, and hydrology to help determine the influence of temperature, wind, and cloudiness on the postglacial climatic regime and explore their effects on the vegetation and position of the tree line.

2. Physical Geography and Vegetation Cover of Campbell Island

2.1. Geology, Topography, Soils, and Climate
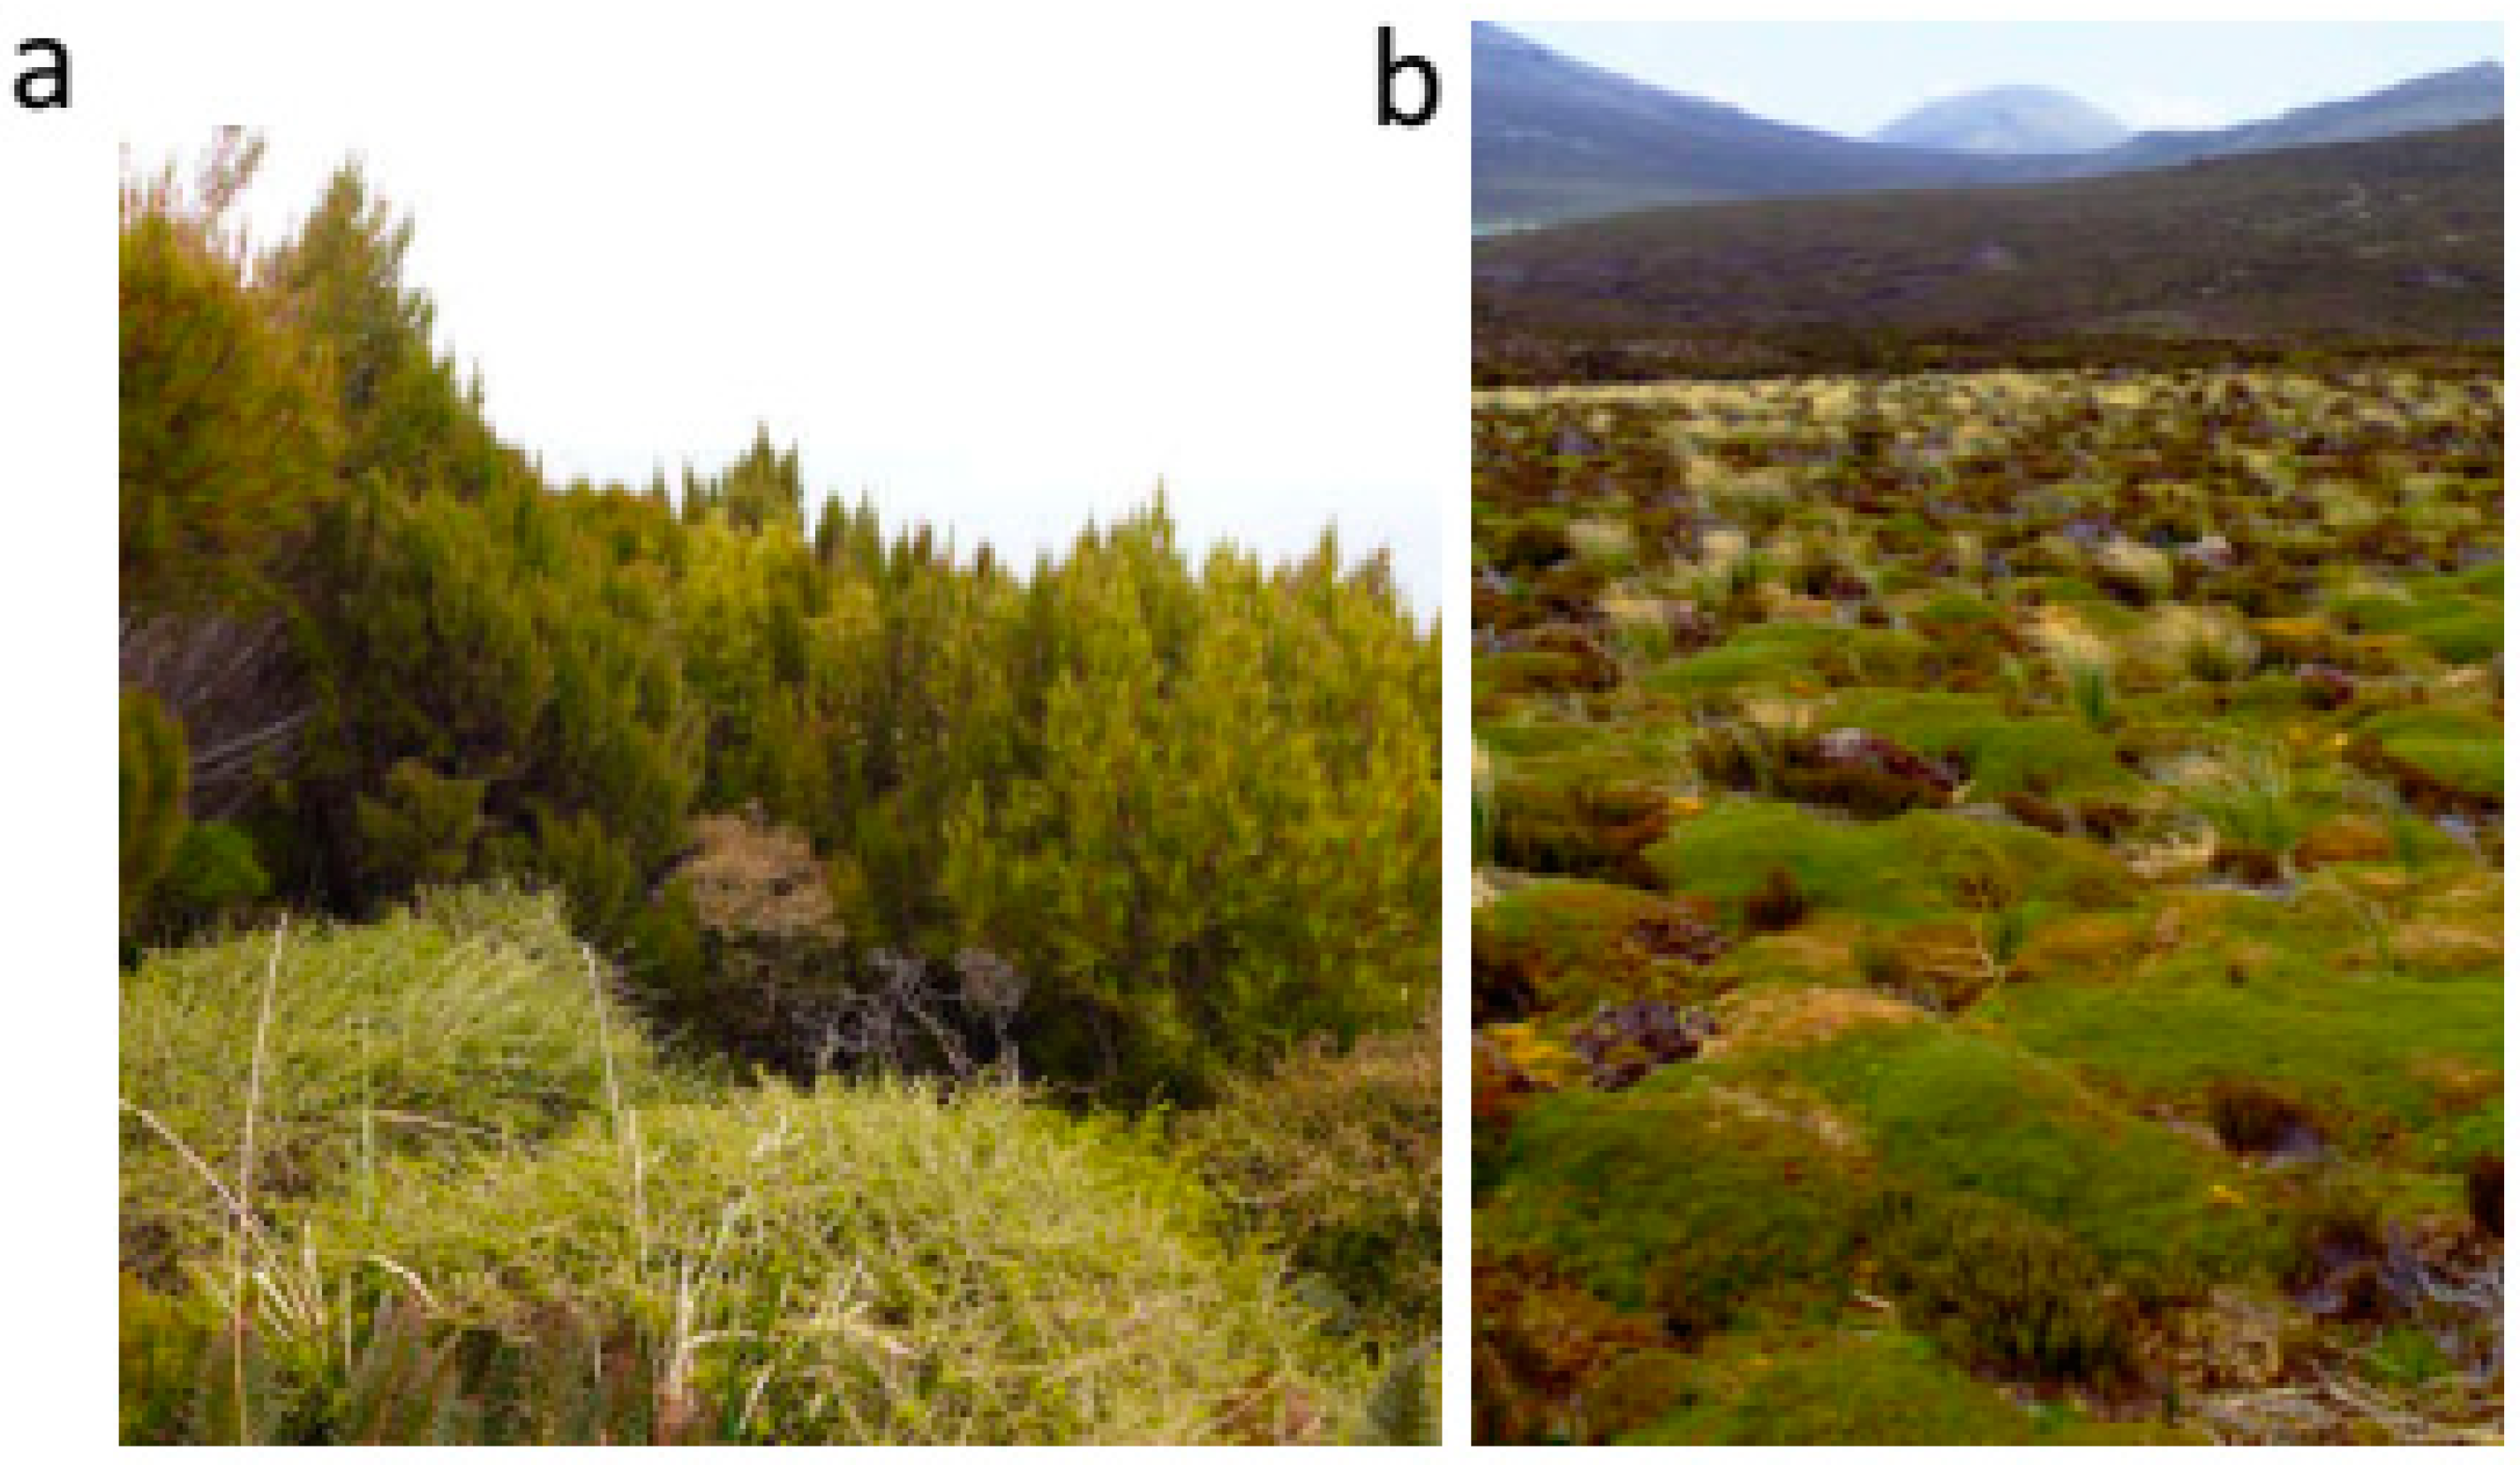
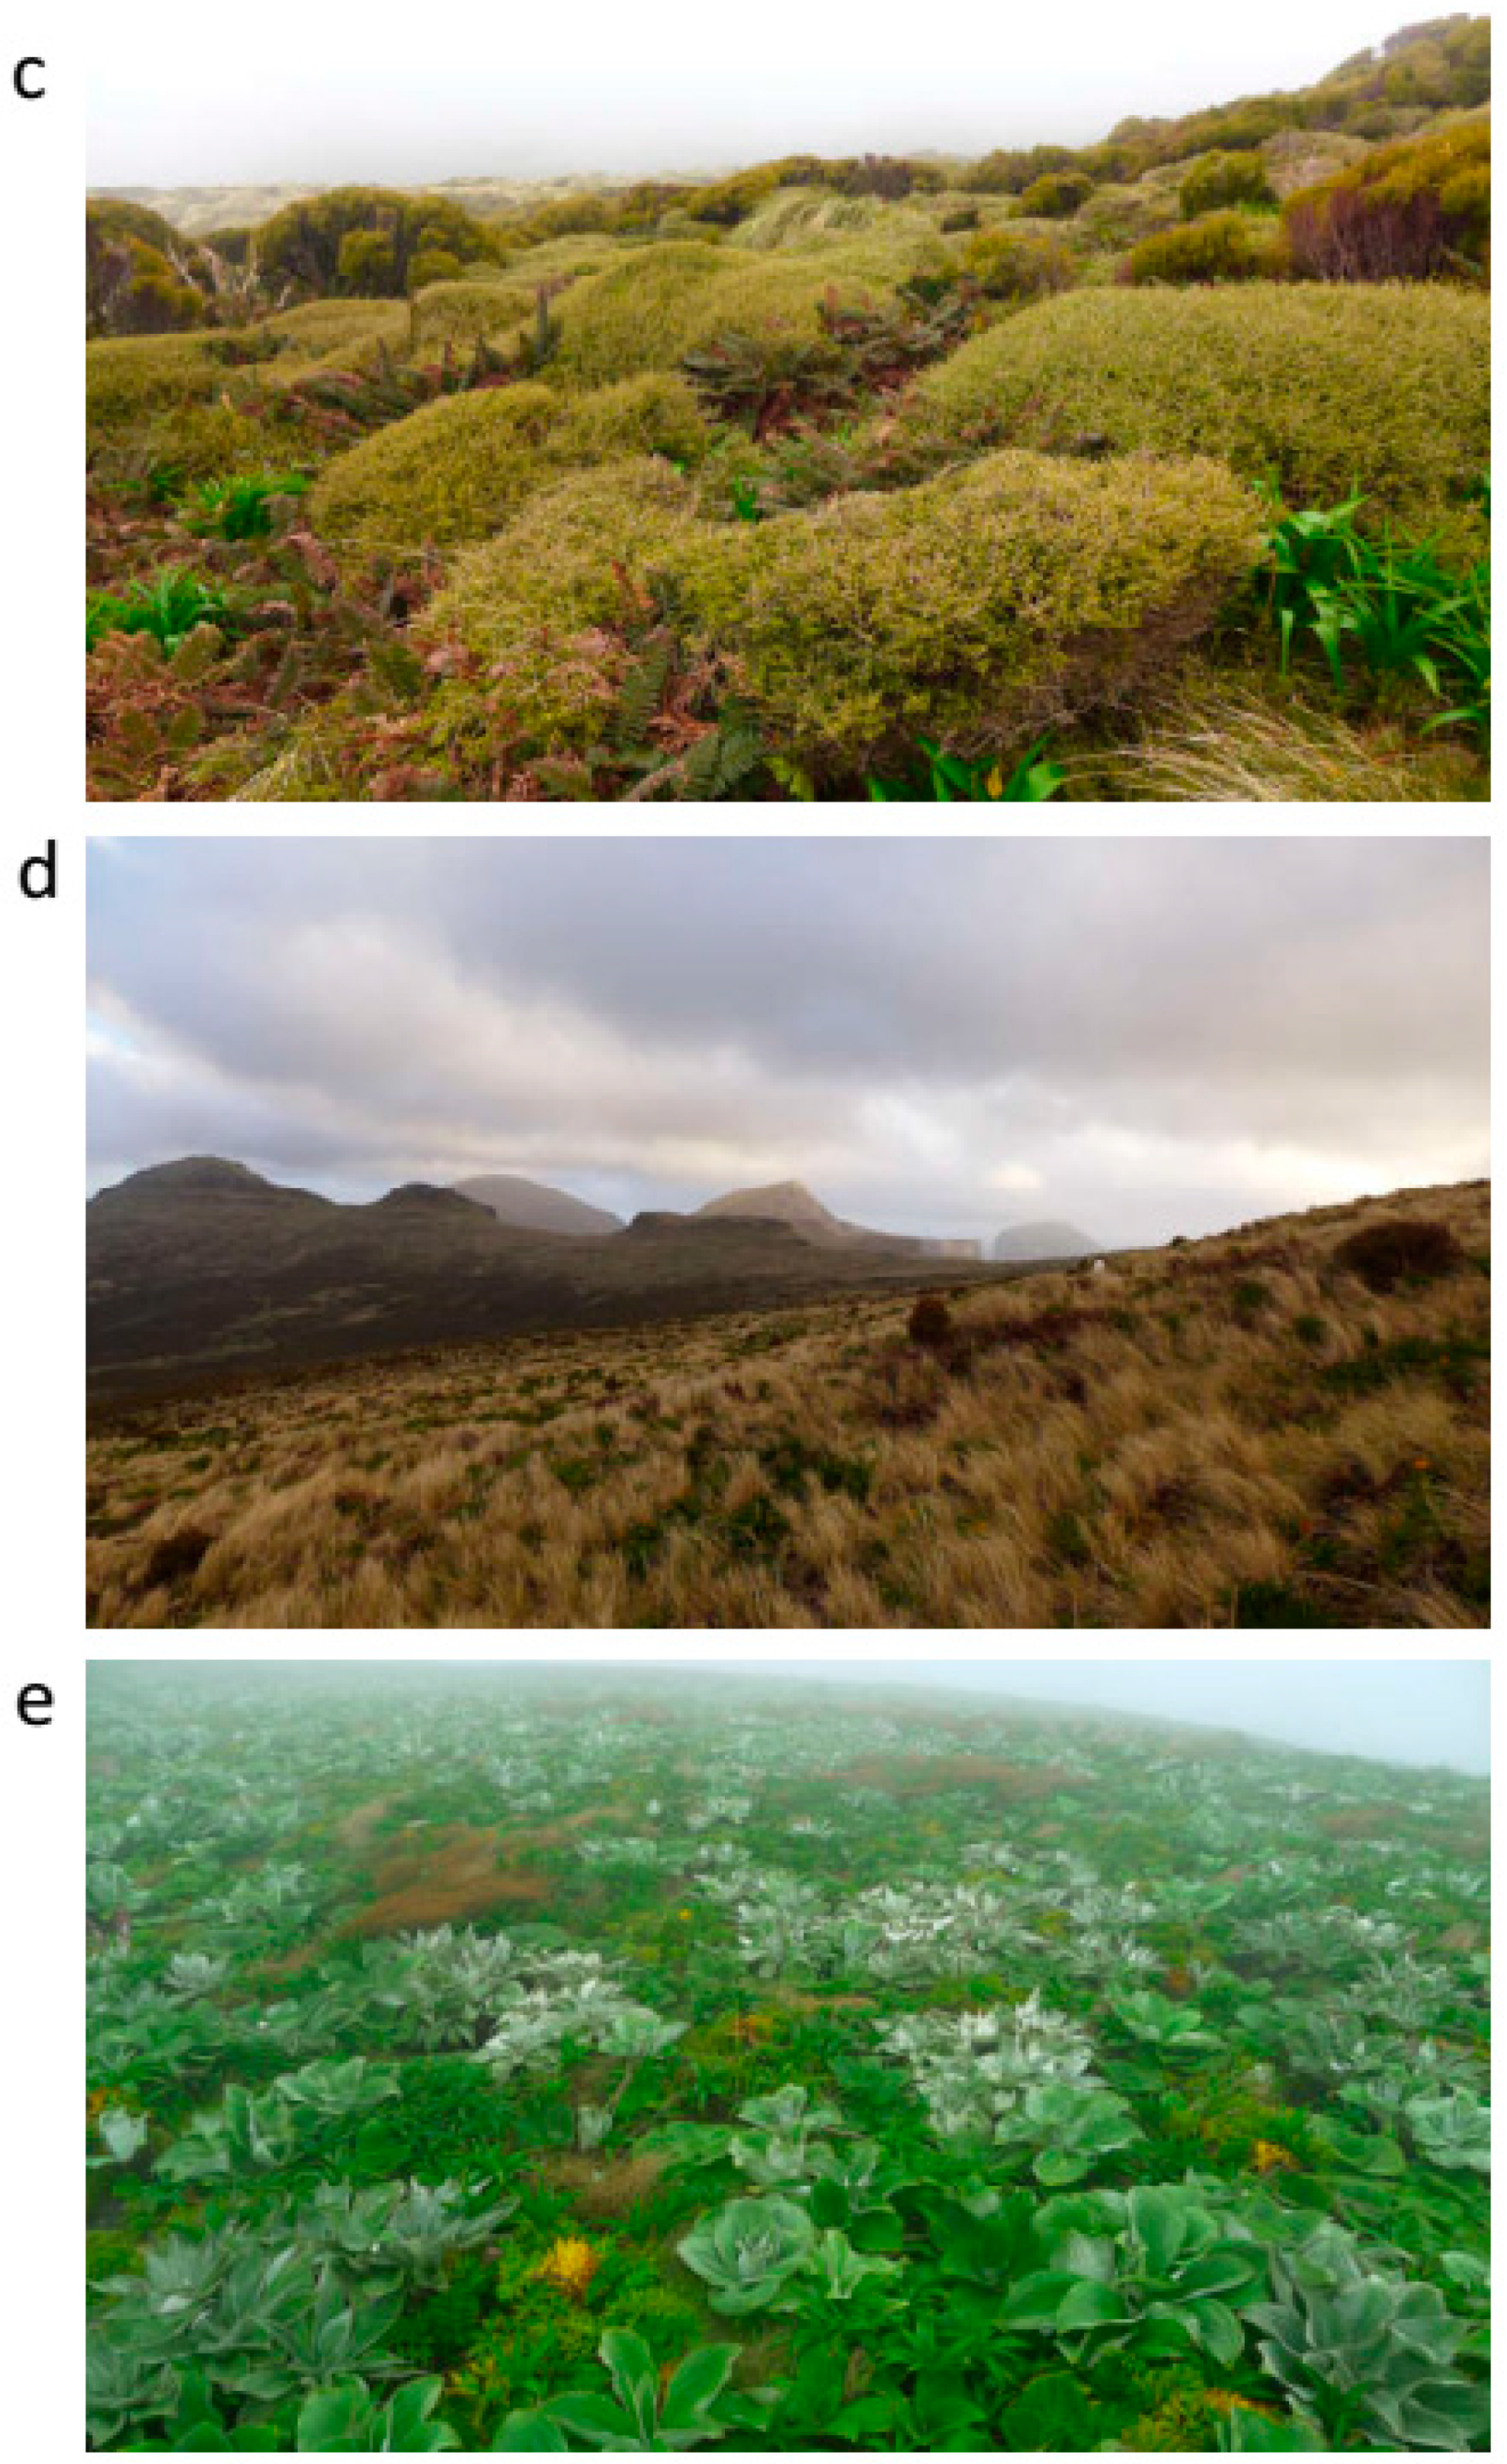
Campbell Island has a surface area of 113 km2 and consists of the eroded eastern segment of a Pliocene volcanic complex [11]. Basaltic flows and intrusions make up two-thirds of the island and schists, conglomerates, mudstones, limestone tuffs, and breccias make up the rest. The island has a rugged topography, with some peaks over 500 m elevation and evidence of glacial action in the form of cirques, U-shaped valleys, and moraine-like landforms [5,12]. The west coast is exposed to the prevailing westerly winds and has steep cliffs eroded by strong wave action, while the eastern flanks have gentle to moderately steep slopes and broad valleys (Figure 1).
Campbell Island has a mild, humid, extremely windy climate with a muted annual cycle [13]. Mean annual temperature at sea level is 6.8 °C (monthly range 9.3–4.6 °C). The mean daily minimum of July (the coldest month) is 2.5 °C, and the mean daily maximum in January (warmest month) is 11.9 °C. Campbell Island technically has a year-long growing season, since, even in winter, daily mean minima are more than 2.5 °C, which is well above the 0.9 °C mean daily minimum that defines the tree line growing season limit [7]. The mean annual temperature of 6.5 °C at the tree line on Campbell Island is nearly identical to the global tree line average of 6.4 °C [7], which suggests that this relationship is valid for this location. Mean annual precipitation of 1404 mm falls on an average of 252 d with little seasonal variation. Sunshine hours are 664 per annum. Cool, moist conditions make decomposition slow, and, thus, highly organic peat soils cover nearly the entire landscape. Only fresh slips, cliffs, and steep slopes of ≥30°, as well as rocky outcrops and exposed tops above 400 m a.s.l. have mineral soils. An overview of the soils is provided in References [11,14] and their nutrient status in References [14,15,16,17].

2.2. Vegetation

The vegetation and plant ecology of Campbell Island is documented in References [16,18,19]. Key vegetation types are shown in Figure 2a–d. Well drained, sheltered lowland sites are in a low forest (≤5 m) or scrub dominated by Dracophyllum scoparium and Dracophyllum longifolium over the subdominant shrubs Myrsine divaricata and Coprosma ciliata, and a fern ground cover of Polystichum vestitum. The tree line is defined as the presence of groups of trees at least 3 m tall [6] and, by this standard, the Campbell Island tree line sits at 30 m a.s.l. (Figure 2a), even though Dracophyllum stands up to 2.5 m tall dominate sheltered sites up to 120 m elevation. We regard this elevational range as a tree line ecotone. Myrsine and Coprosma shrublands become more abundant with increasing elevation and are often the main cover from 100 m to 250 m on sheltered slopes where the last shrubland patches occur (Figure 2c). Chionochloa antarctica tussock grassland is the main vegetation above 150–200 m (Figure 2d) but, in turn, intergrades with a herb field of macrophyllous forbs (Anisotome antipoda, A. latifolia, Pleurophyllum hookeri, P. speciosum, and Bulbinella rossii), which become prominent above 250–300 m (Figure 2e). The open, exposed tops (above 300 m) are in a tundra of low-growing macrophyllous forbs, sedges, rushes, and stunted grasses.
Wind, drainage, and exposure to sea spray alter this general pattern markedly. The exposed western cliffs and steep slopes are covered with macrophyllous forb communities with Poa litorosa tussocks, grassland extending from the sea level to the tundra, and woody vegetation being confined to low-growing wind-trimmed shrubland in sheltered locations. Ombrogenous (rain-fed) moorlands occur on low-angle valley bottoms and on gentle slopes, particularly on eastern headlands. In this region, extensive cushion bogs form dominated by the sedges Oreobolus pectinatus and Isolepis spp., together with Centrolepis spp., Astelia subulata, and stunted Dracophyllum scoparium (Figure 2b). Wet fens have a cover of Carex appressa, and the macrophyllous forb Pleurophyllum criniferum and Blechnum montanum.

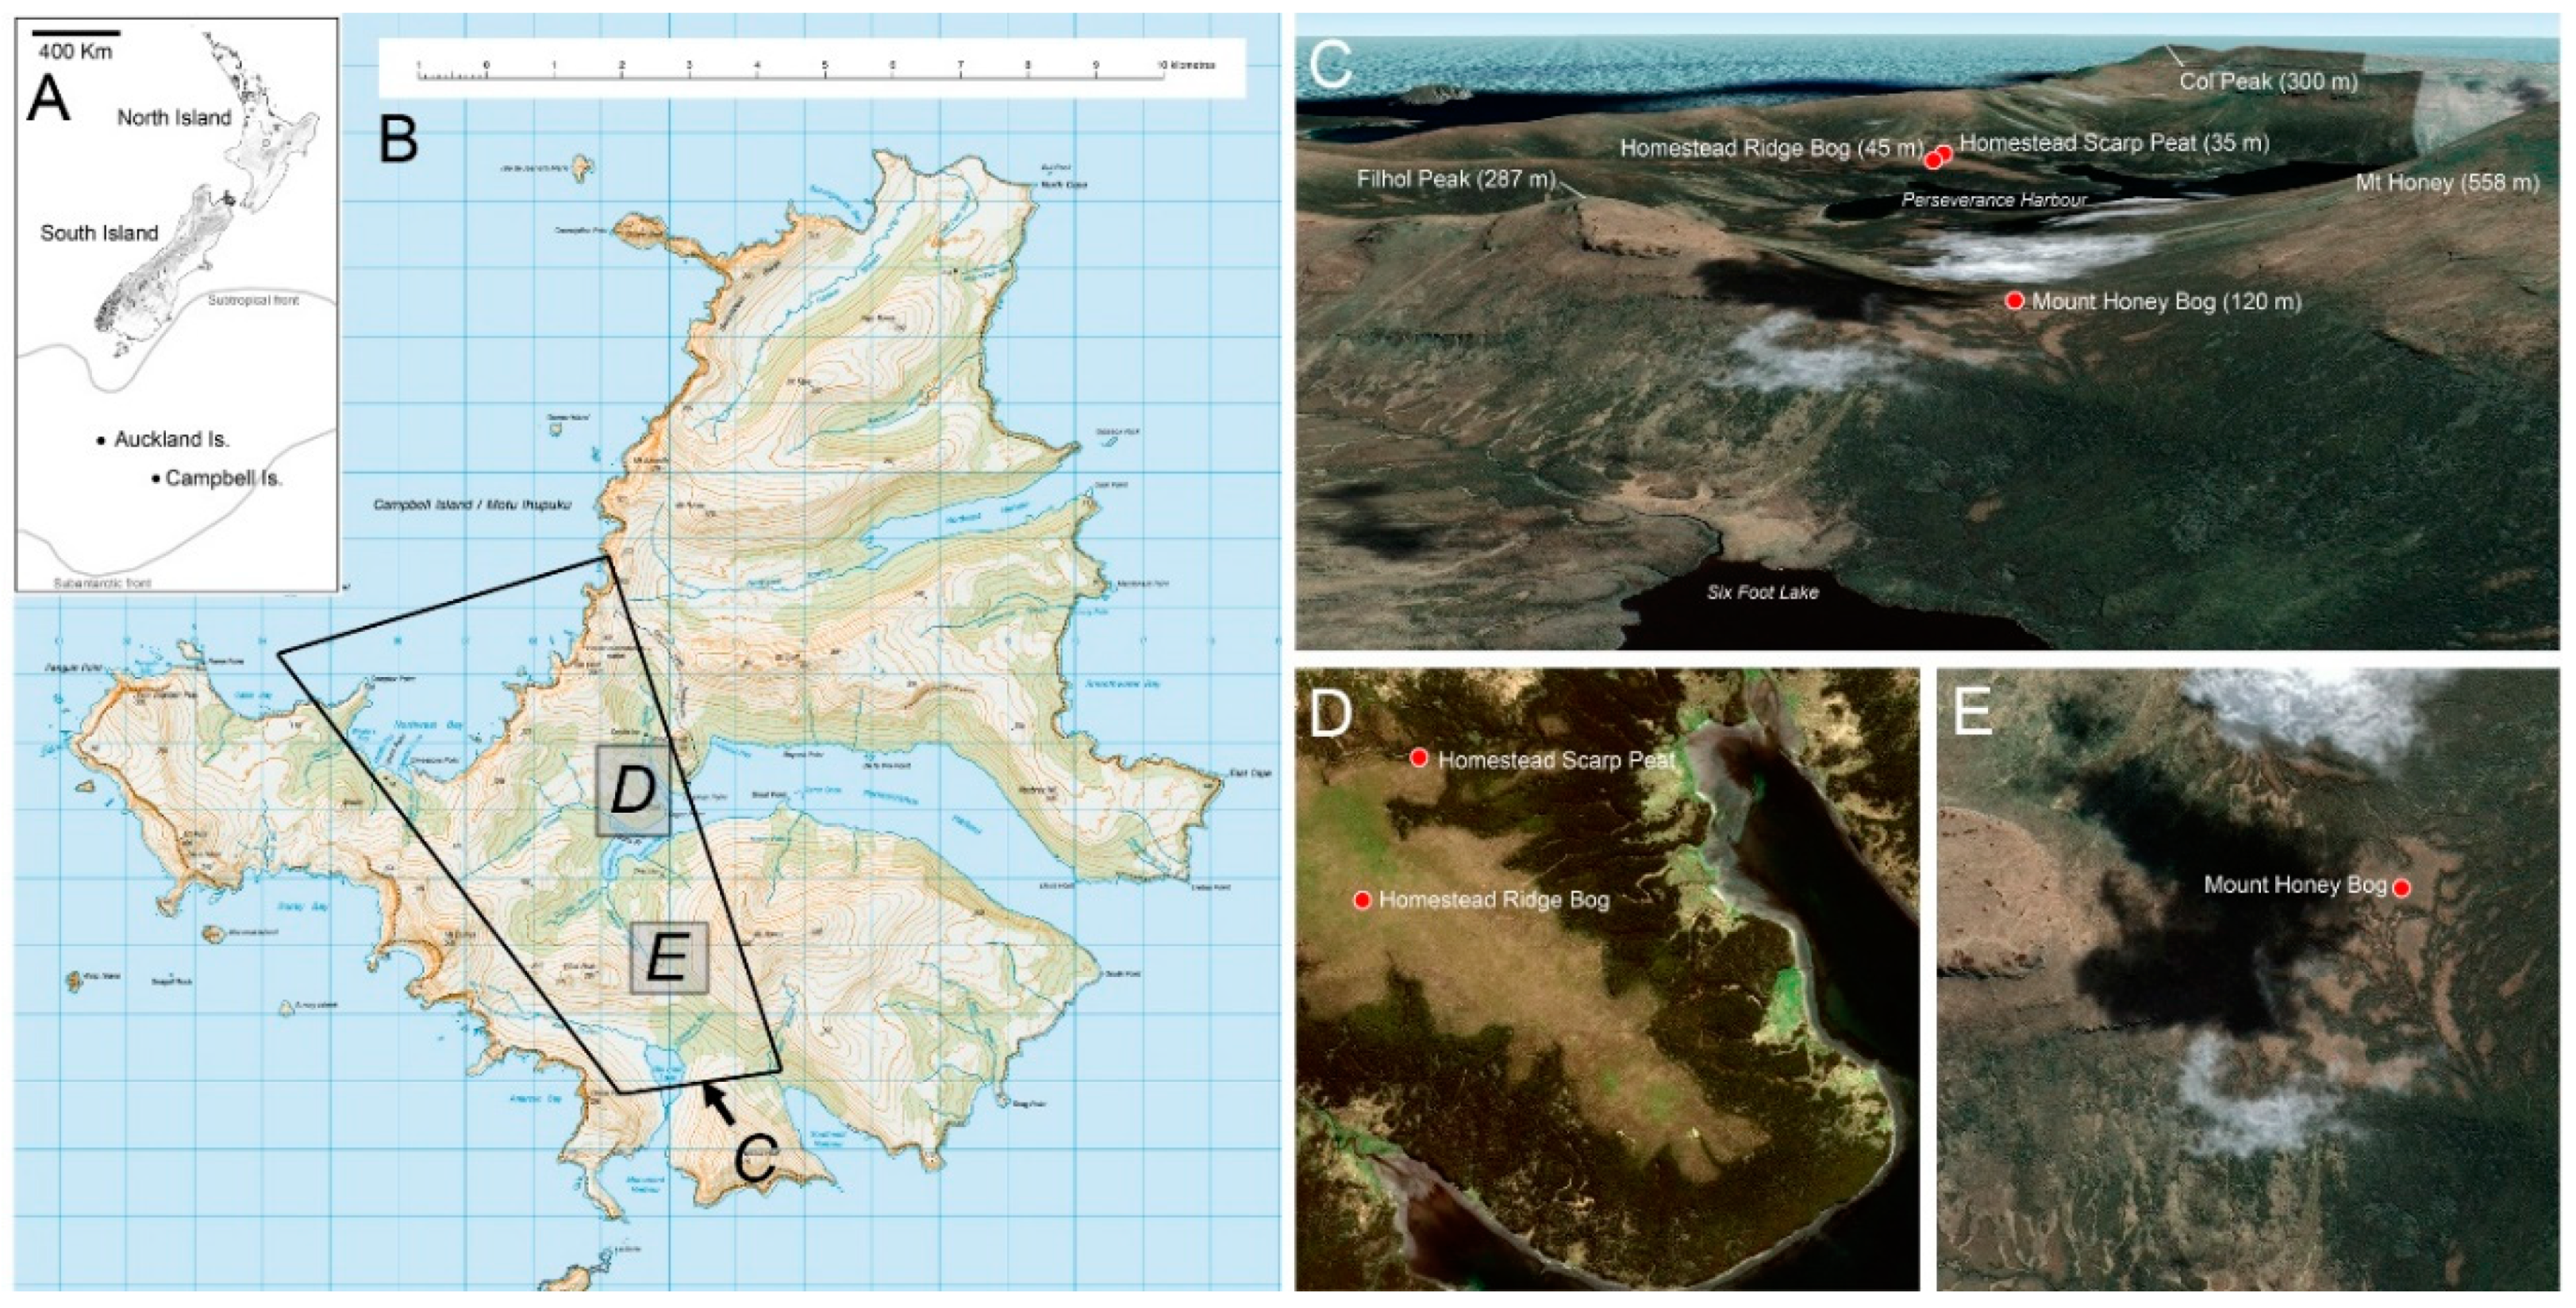
3. Study Sites (Figure 1)

Previous investigations have shown that the raised bogs of Campbell Island provide the most complete record of past vegetation while, at the same time, sensitively recording fluctuations in soil surface moisture [12]. Two bogs were selected to provide maximum information on tree line fluctuations: one lying at the limit to Dracophyllum forest (Homestead Ridge—two core sites) and another within the upper Dracophyllum shrubland ecotone (Mt Honey Saddle).

3.1. Homestead Ridge Bog (HRB)

The Homestead Ridge lies at the head of Perseverance Harbor between two inlets, known as Camp Cove and Tucker Inlet. Its crest is mantled by a large, raised, oligotrophic cushion bog, about 1 km long and averaging 300 m wide and extending over c. 25 ha (Figure 1d). This raised bog is part of a larger bog complex, cut by steep-sided streams, extending inland to the west and covering much of the local drainage basin. The central dome is covered by a mosaic of wetland cushions of Oreobolus, Isolepis, Centrolepis, Astelia, moss, stunted Dracophyllum scoparium, and scattered Chionochloa tussocks. The flanks of the bog are mostly covered with a Dracophyllum longifolium low forest or shrubland with subdominant Myrsine divaricata, Coprosma cuneata, and Coprosma ciliata, as are the banks of the streams in the western bog complex. Gaps in the low canopy are occupied by Polystichum vestitum ferns, Chionochloa antarctica tussocks, and, close to the shore, where sea lions haul out, and swards of the macroforb, Bubinella rossii.
The bog forms an elongated, low-angle (1–5°) peat dome, averaging 8.6 m deep, with a maximum depth of 9.6 m at the crest (45 m a.s.l.). At the same time, the oligotrophic bog gives way to Dracophyllum shrub and a low forest. The slopes steepen to 10–15°. The peat underlying the oligotrophic bog is a wet, fibrous sedge peat with abundant wood in the top 6–7 m, fining in the bottom meter to a gyttja-like peat above the blue silt base. Under the scrub-covered and forest-covered margins is a dry, dense, coarsely fibrous, well humified peat with abundant wood throughout the top three quarters of the profile. It varies in depth according to the slope from 2.0–4.0 m. The core (laboratory i.d. X9901) was taken from the bog summit, which has a vegetation cover of cushion bog and scattered patches of low-growing Dracophyllum scoparium.

3.2. Homestead Scarp Peat (HSP)

Homestead Scarp (c. 35 m a.s.l.) lies on the north-eastern flank of Homestead Ridge bog complex (Figure 1d) in a steep-sided small valley covered in dense Dracophyllum longifolium 1.5–2 m high, with occasional Myrsine divaricata and Coprosma spp. In this region, recent erosion has exposed a 2 m peat bank. A pit was dug for a further 2 m into the base of the bank for a total sample exposure of 3.9 m of peat above the coarse gravel basement (laboratory i.d. X9911).

3.3. Mount Honey Saddle Bog (MHB)

At approximately 120 m a.s.l. in the saddle between Mount Honey and Filhol Peak, an oligotrophic bog complex occupies the headwaters of streams draining to the south (Figure 1d). The bog complex lies within the upper Dracophyllum-dominant scrub some 30 m vertically below the upper boundary of the closed scrub. Dracophyllum in the vicinity has a canopy height of c. 1 m on exposed ridges but up to 2.5 m in sheltered depressions. The bog has a hummocky microtopography, with a cover of approximately 30% stunted (0.1–0.6 m high) Dracophyllum scoparium, alongside occasional tufts of Chionochloa and prostrate Myrsine and Coprosma cuneata, over a ground cover dominated by Astelia, Oreobolus, and Dicranoloma moss. A single c. 7 m core of fibrous sedge peat was taken from near the highest point of the complex (laboratory i.d. X9903).

4. Methods

4.1. Water Table, Vegetation Cover, and Surface Wetness Index

In order to assess the relationship of oligotrophic bog vegetation cover to the water table, we located 21 1 × 1 m2 plots across Homestead Ridge Bog in December 1998, including austral summer. The 11 plots were distributed at regular intervals along 2 transects running from shrubland to the bog dome summit. A further 10 were subjectively allocated to sample specific communities or soil moisture conditions by selecting markedly different vegetation compositions. Vegetation cover (%) was estimated visually. A 15 × 15 cm pit was dug adjacent to the plot down to the water table and its depth was measured as distance from the surface of the litter layer to the water surface after the level equilibrated (c. 20 minutes for most plots). Vegetation cover percentages and water table depth are provided in Table S2.
No unusually heavy rainfall occurred during the measurement period and the average water table depth is nearly identical to the long-term summer water table as recorded from a site within our survey area [10]. We tested whether vegetation composition was significantly related to the water table depth using permutational multivariate analysis of variance (PERMANOVA) [20] (implemented using the function adonis in the vegan library [21] in R v3.5.1). To determine how individual taxa responded to water table depth, the percent coverage of each taxa was correlated with the water table depth using Spearman’s rank correlation. We removed all singleton taxa before analyses since they provide negligible information about how the plant community is related to the water table depth [22,23].
Results from a modern pollen survey of the Campbell vegetation communities spanning significant gradients of temperature and moisture [24] were used via ordination techniques (non-metric multidimensional scaling = NMS) [21,25,26] to develop a surface wetness index (SI: Derivation of the surface wetness index, Figures S4 and S5).

4.2. Peat Sampling

HRB and MHB were sampled with a 10-cm diameter and a 5-cm diameter ‘D’-section corer, respectively. Core segments of 50-cm lengths were transferred to plastic half drain pipes, wrapped in plastic film, and stored at 4 °C for return to the mainland. HSP was sampled by cutting back an exposure and taking block samples ca. 25 cm × 10 cm. Subsamples were taken for loss-on-ignition (LOI), macrofossils, pollen analysis, and radiocarbon dating. LOI samples of 1 cm3 were taken at 2-cm intervals, and combusted in a muffle furnace at 550 °C for 2 h to determine the dry weight percentage of organic matter [27].

4.3. Radiocarbon

Material for radiocarbon analysis was obtained from peat, leaf, or wood fragments. It was cleaned in distilled water and then dried at <70 °C. Ages have been calibrated using a Bayesian statistical approach (on the OxCal 3.5 calibration program with resolution = 4; OxCal, Oxford, UK, https://c14.arch.ox.ac.uk) against the INTCAL98 data set [28] and are reported as calibrated years before the present (= BP).

4.4. Peat Humification

Humification analysis was used to determine the degree of peat decomposition using a modified version of the semi-quantitative sodium hydroxide extraction technique [29]. In this technique, light transmission through the sodium hydroxide extract under standardized conditions is used as a measure of the humic acids present in the sample. The lower the values of light transmission is, the more decomposed the peat is. A 0.2 g dry weight peat from each depth was pulverised and extracted, as in the methods outlined in Reference [29]. The filtration stage of the procedure was replaced by centrifugation of the samples for three minutes at 3000 rpm, and retention of the supernatant, which is a technique that produces results identical to the standard procedure. The percentage transmission of light through the supernatant was measured on a spectrophotometer at 540 nm.

4.5. Pollen Analysis

Pollen samples (volume 1.2 cm3) were prepared using standard procedures (hot 10% KOH, 40% HF, and acetolysis) [30]. Samples were spiked in the initial processing step with exotic Lycopodium spores for calculation of palynomorph concentrations. Pollen and spore counts were continued until a pollen sum of at least 250 grains was reached. Percentage calculations are based on island pollen and spore types but exclude all known extra-island pollen and spore types. Pollen and spore naming conventions follow [31] except that the new Nothofagaceae classification is accepted here: Fuscospora pollen type replaces the previous Nothofagus fusca pollen type and Lophozonia menziesii pollen type is the previous Nothofagus menziesii pollen type [32]. Pollen results were calculated and drafted using TILIA and TILIA.GRAPH [33].

5. Results

5.1. Chronostratigraphy

A total of 85 radiocarbon dates (HSP, 20, HRB, 44, MHB, 21) were obtained for the three sites (Table S1). Details of the Baysian derivation of calibrated ages for Figure 3 are given in Table S1. Despite the issue of downward intrusion of roots, which is a problem with peat bog dates, there are only a few age reversals and a high degree of internal consistency within and between peat profiles. An external validation of the accuracy of the dating is provided by the record of Podocarpacaeae long-distance pollen derived from the postglacial spread of the tall forest on the New Zealand mainland at c. 11,500 BP (SI Figure 1, Figure 2 and Figure 3).

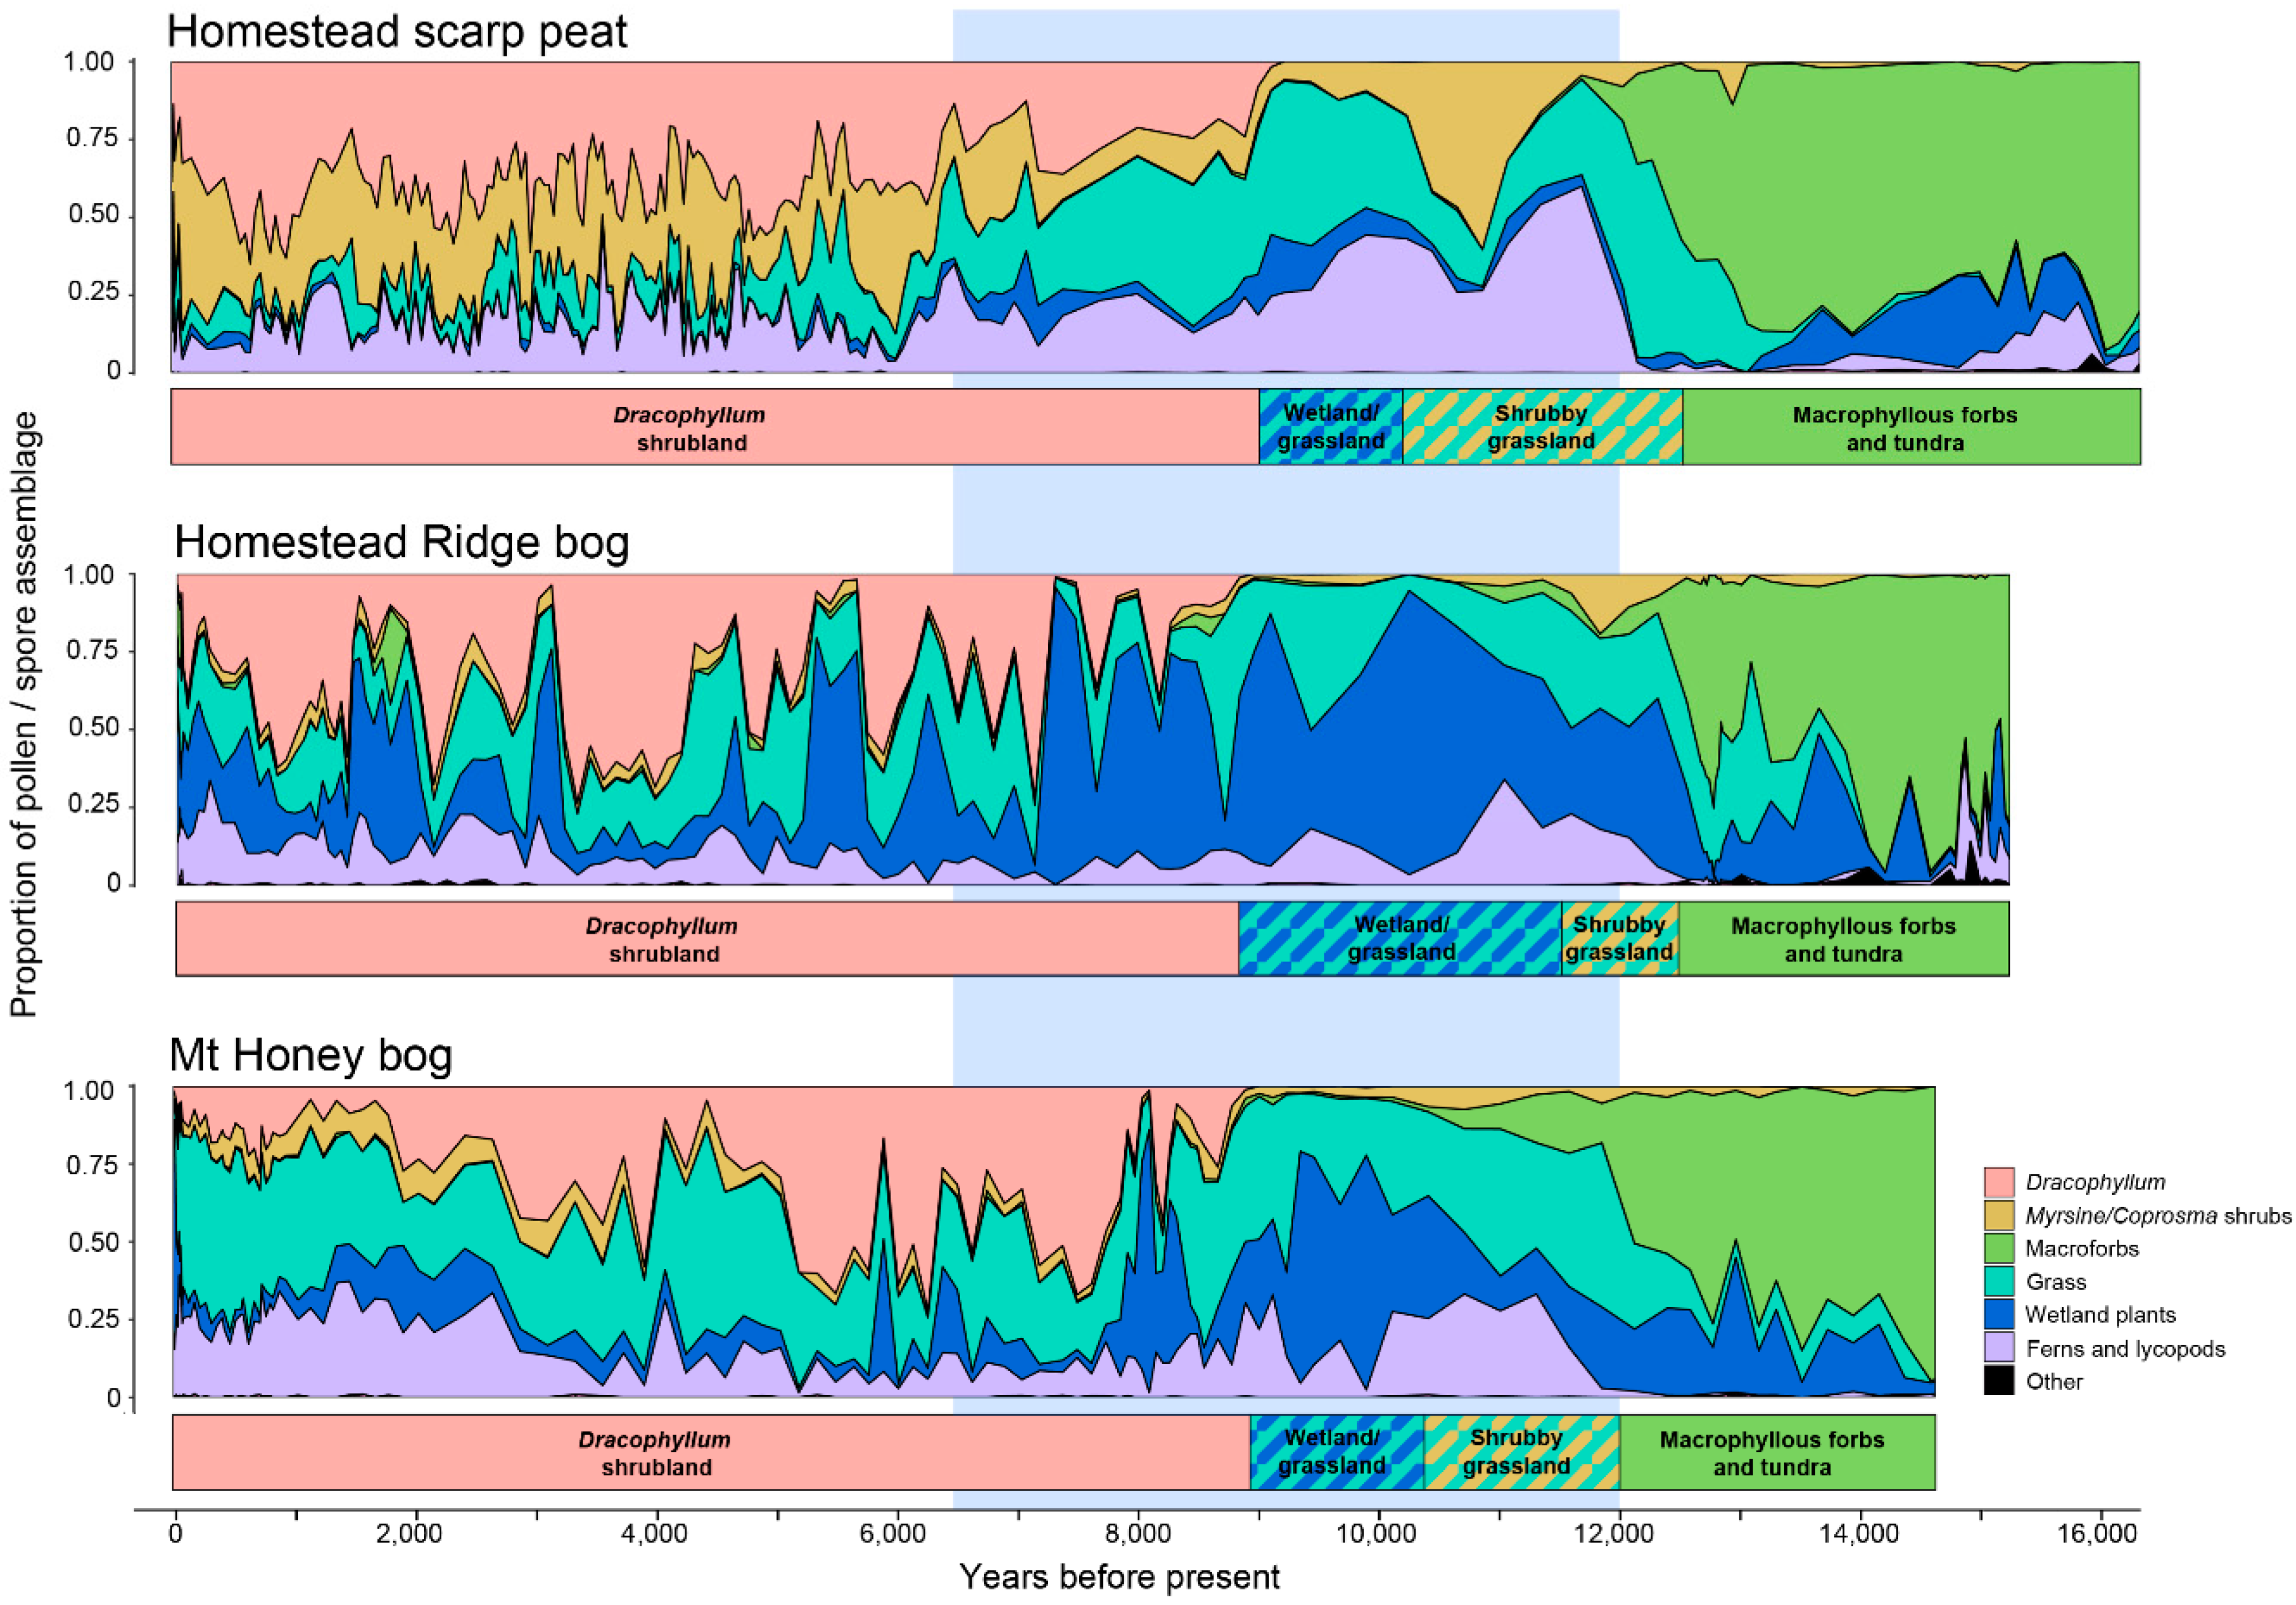
5.2. Vegetation Sequences Based on Pollen Stratigraphy

Pollen results from the three sites are summarized in Figure 3. Detailed results are shown in SI Figure 1, Figure 2 and Figure 3.
Four vegetation zones are recognised based on the dominant pollen and spore types (Figure 3, Table 1, full results, Figures S1–S3).
  • Macrophyllous forb: The oldest sediments are dominated by macrophyllous forbs and include occurrences of the poorly dispersed Stilbocarpa polaris, and have relatively little wetland, low shrub, grassland, or fern representation. The small ground fern Grammitis is characteristic of the earliest sediments. While Grammitis spores cannot be identified to species, it is likely, given its association with tundra dominants, to be the dwarf alpine fern G. poeppigiana, which forms mats on rocks in the tundra zone [19]. A sparse macrophyllous forb tundra growing in a rock-covered and silt-covered landscape was, therefore, the first postglacial vegetation. The absence of abundant grass or wetland pollen types points to the tundra zone above about 300–400 m as the closest modern analogue. In contrast to the modern tundra, few fern spores are recorded, aside from the alpine Grammitis. Since fern spores are among the few well dispersed types on the island [24], tundra-like conditions extended right to the contemporary sea level about 100 m lower than the present day.
  • Grassland-shrub-wetland: At all three sites, there is an abrupt to gradual transition toward less macrophyllous forbs and more grasses, which is followed by increased shrubs (Coprosma and Myrsine divaricata) and ferns. This sequence is best exemplified at well drained HSP where a Myrsine/Coprosma shrub-dominated zone (11,400-10,200 BP) not apparent at the other sites is recognised.
  • Wetland-grassland: Wetland types begin to predominate in Astelia and Centrolepis. HSP, being the best drained of the three sites, has only a weak wetland response, but wetland types are more abundant at the other two sites than elsewhere in the profile. Hymenophyllum ferns, which are abundant in the preceding zone, are also common in this region.
  • Dracophyllum-scrub: The island-wide simultaneous spread of Dracophyllum marks the onset of this zone, but grassland and ferns remain abundant, and wetland at the bog sites, for two to three thousand years longer. All sites have significant fluctuations in abundance of the major components, but most markedly in the raised bog, HRB, where Dracophyllum oscillates in response to wetter or drier conditions. This stage ended with the settlement of the island in the late 19th century and the changes it brought with fire and sheep grazing [34,35,36,37].
These zones are only approximately equivalent in time and composition because of the different elevations and soil moisture conditions. For instance, the wetland-grassland phase was more pronounced and much longer (2700 years vs. 1200 years) in the poorly drained bog crest HRB compared with the close by, but well-drained scarp site, HSP.

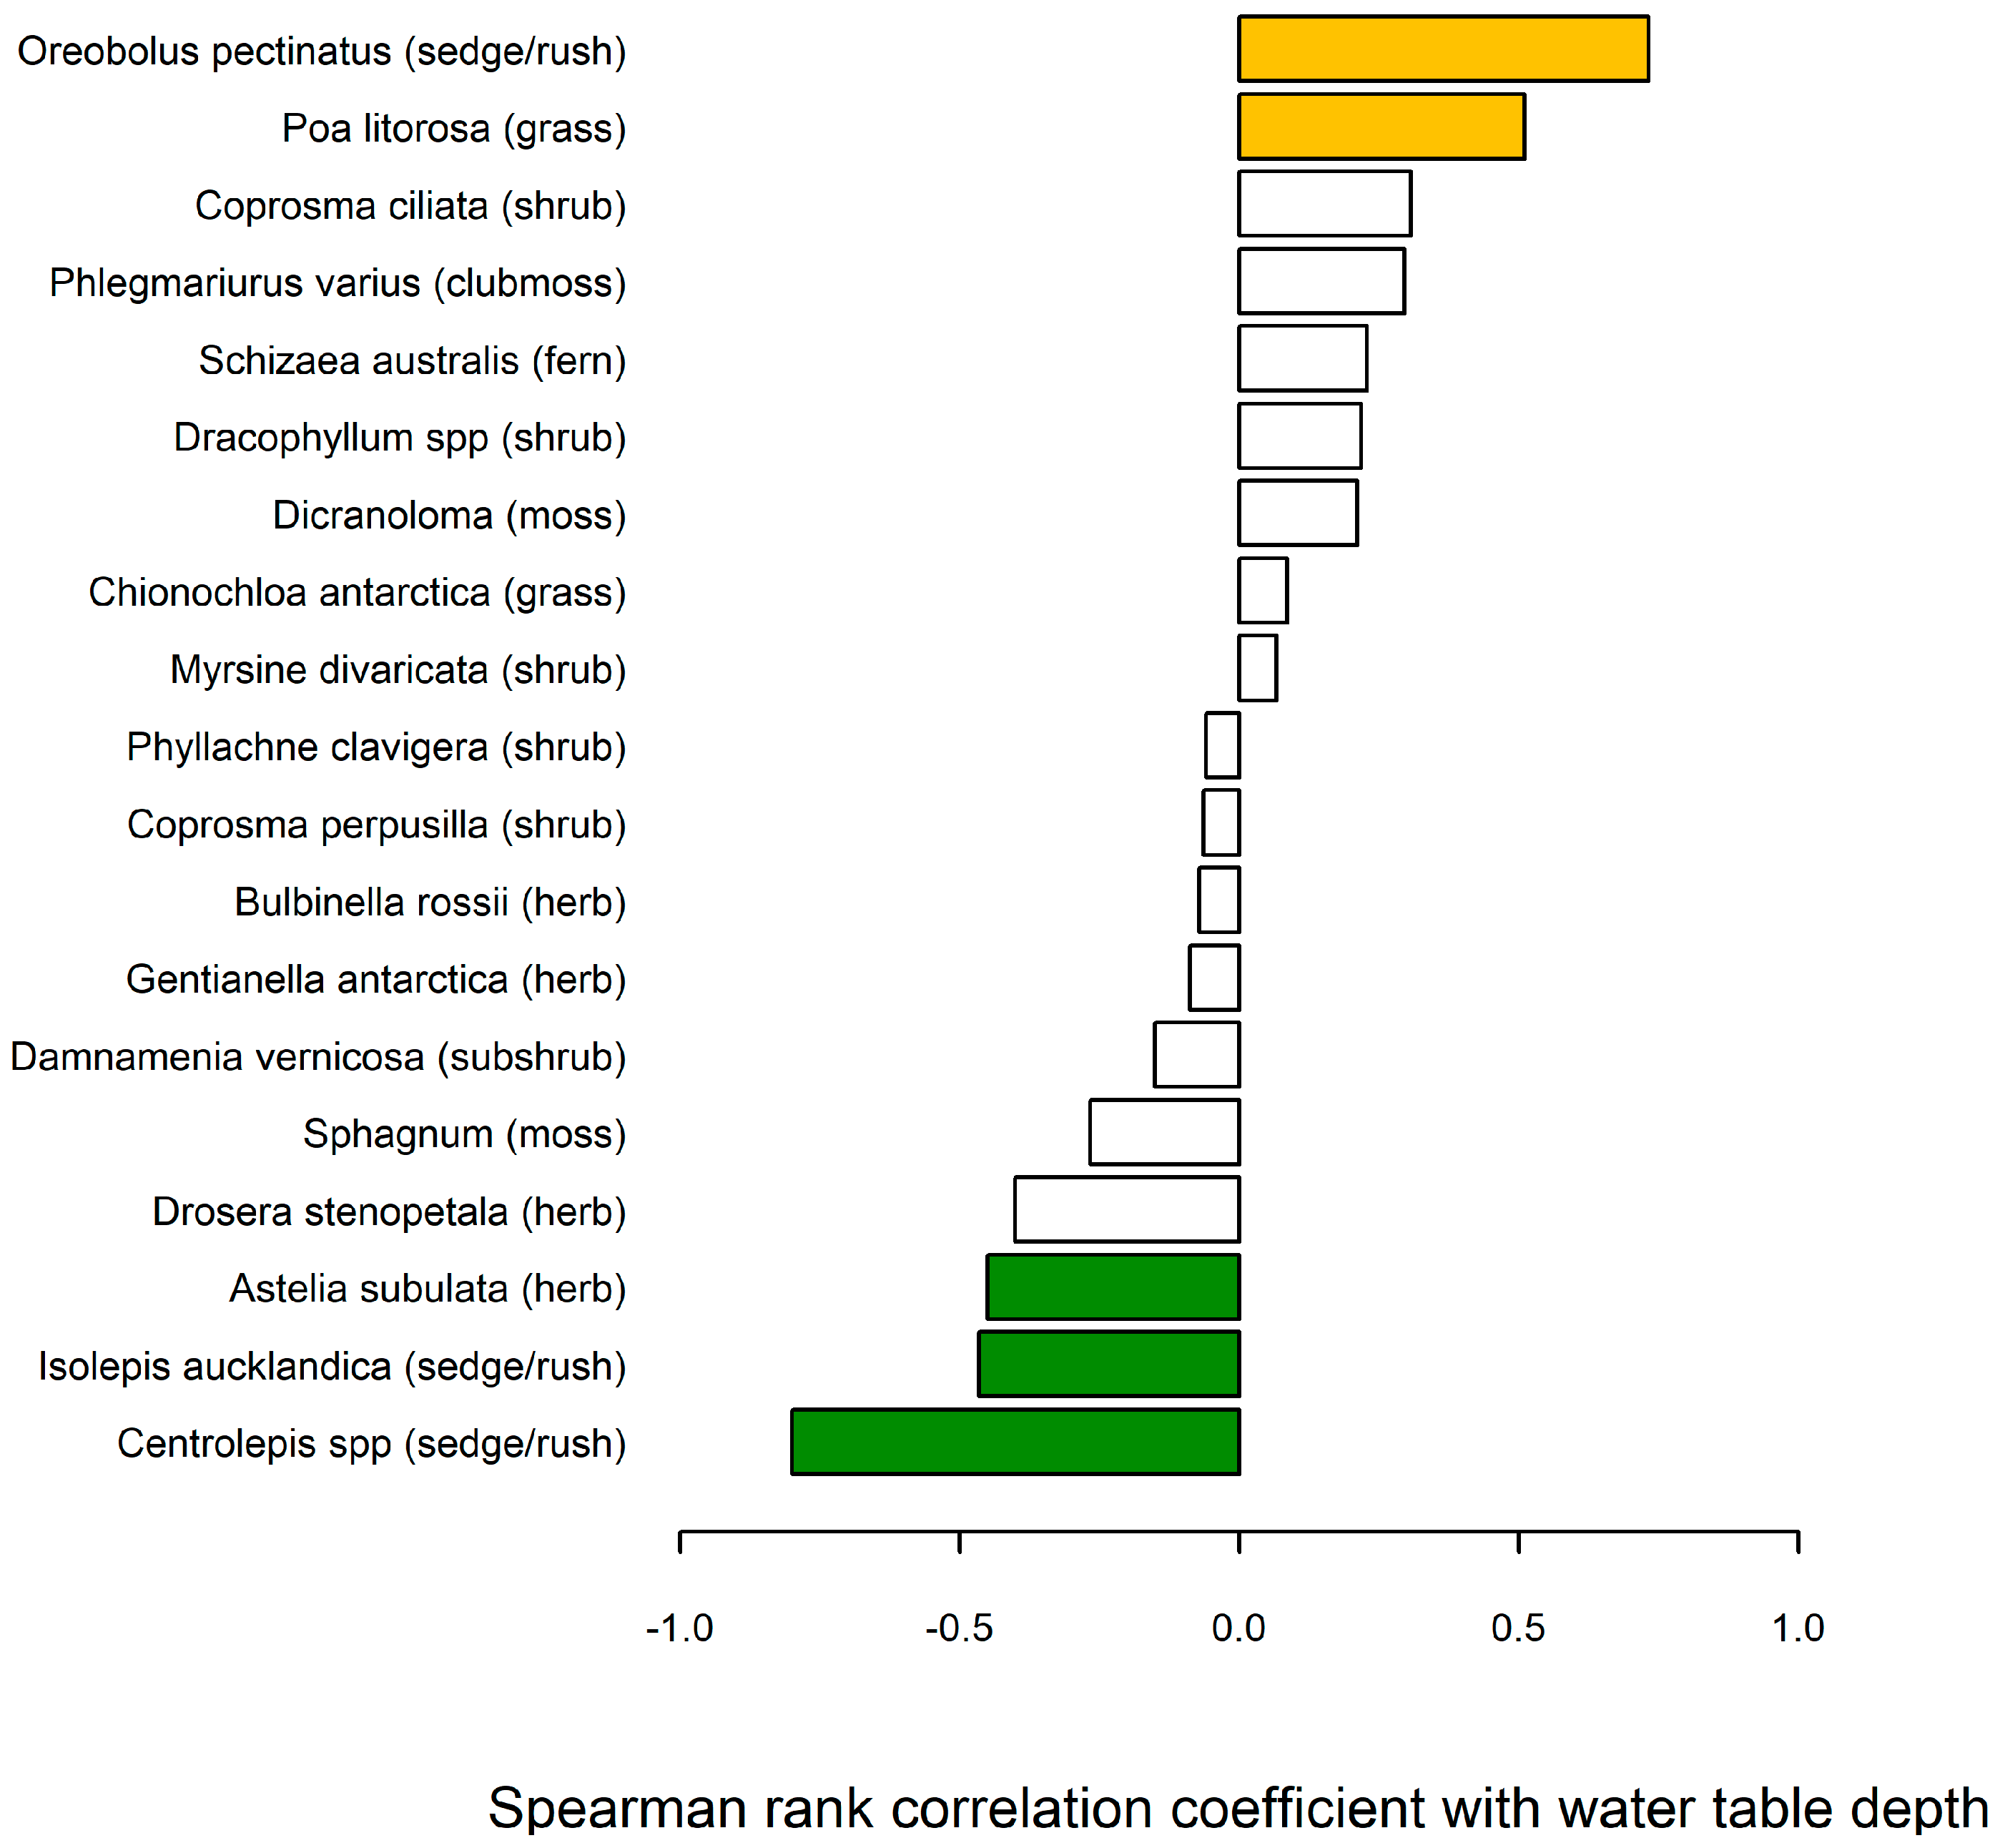
5.3. Water Table Relationship with Bog Vegetation

A general pattern of vegetation cover and water table depth has been already documented for the island (Table S2). The detailed survey of the raised bog crest showed that vegetation composition was strongly predicted by water table depth (PERMANOVA F1,19′ = 6.92, p < 0.001, R2 = 0.27). The percentage cover of the sedge Oreobolus pectinatus and the grass Poa litorosa have a significant positive correlation with the water table depth, while the forb Astelia subulata and graminoids Isolepis aucklandica and Centrolepis spp. have a significant negative correlation with the water table depth (Figure 4). The shrub species had positive relationships with water table depth but not as strong as might be expected from the general dominance of shrubs on well-drained peats (see Table 2). Because the well-drained shrub-dominant sites were not sampled, we suggest the results reflect the dynamics of stunted shrubs on the raised bog surface and its margins. Myrsine divaricata and Coprosma spp. are an insignificant component of the cushion bog vegetation whereas Dracophyllum scoparium is abundant and patches of various sizes occur across the entire surface, which averages 20%–25% of the ground cover.

5.4. Peat Vertical Growth, Surface Wetness, and Humification

A surface wetness indicator was developed from an ordination of three sites (HRB, HSP, and MHB) and the modern surface sample data was presented in Reference [24] (Figure 5c). The second axis is well aligned with the results of the modern water table depth results, with Dracophyllum and ferns contrasted with Astelia antarctica and Centrolepis spp. (Figure S4). The two bog sites (HRB and MHB) show a decline surface wetness from 14,000 BP onwards. The maximum wetness is evident between 10,500 and 9000 BP while the forest site (HSP) has fluctuating but dry conditions along with markedly increased moisture between 10,500 and 9000 BP (Figure 5c). All three sites became drier shortly after 9000 BP and followed a fluctuating trend toward less surface moisture, which culminated between 6000 and 2000 BP.
Peat vertical growth (Figure 5d) is a proxy for net accumulation, the product of decay of organic material in the profile, and net plant productivity. The two bog sites (HRB and MHB) show a gradual decline in vertical growth over the early Holocene to reach a low value between 12,000 and 9000 BP. They recommend accelerated growth after 9000 BP. The high elevation MHB has an early Holocene peak in vertical growth centered on 6000 BP and then a steep decline. The low elevation HRB peaks at around the same time but continues to grow at about the same rate, which leaves aside rapid fluctuations in the late Holocene. The HSP peat soil grew slowly until 8000 BP, increased until 4500 BP, and then grew at a steady rate.
Peat humification matches the changes in vertical growth well (Figure 5e). The slow growing HSP peat soil is well-humified for the last 1000 years, which likely reflects undecomposed material in the surface that has had insufficient time to breakdown. HRB and MHB show a general increase in humification from 13,500 BP with sustained intense humification from 12,500 through 8000 BP, at which time, peat decomposition in these bog sites matched that of the well-drained HSP soil. By 6500 BP, humification at both sites was at relatively low levels that were sustained for the rest of the Holocene.

6. Discussion

6.1. Climatic Interpretation

The January (= summer) temperature estimates (Figure 5b) generated by transfer functions based on a modern pollen rain-temperature data set [8] need to be interpreted cautiously, since they are based on the current disposition of vegetation. We, therefore, refer to them as ‘temperature equivalents’ since they indicate the January temperature the pollen assemblages suggest if the same type of climatic regime prevailed.
The early (17,000 to c. 12,500 BP) pollen assemblages of the two lowland site profiles are typical of areas with abundant exposed rock and tundra vegetation. The only modern analogues are high elevation sites above 500 m where peat does not form and cold temperatures (January temperatures are ≤6 °C in the tundra zone), frost heave, and high winds induce stunted vegetation cover. The pollen transfer function reconstructions for the early part of the macrophyllous forb stage corroborate this estimate and show no pronounced shift in temperature until about 12,000 BP (Figure 5b). Tundra, therefore, covered the island surface from the sea level to at least 120 m elevation.
A transition from macrophyllous forb tundra to grassland-shrubland began c. 14,000–13,000 BP and was associated with a trend toward wetter conditions in the two bog sites, but not the well-drained HSP site. At HSP, first Coprosma shrubland and then Myrsine divaricata rose to dominance, with shrub cover peaking at c. 11,000 BP. This may be taken for the more general trend on well drained slopes. Phlegmariurus varius, which is a clubmoss common in low shrubland, and Hymenophyllum, which is a filmy fern more abundant in the current pollen assemblages above c. 100 m [24], were prominent at all sites over this period (Figure 5f). High percentages of Myrsine pollen on the present landscape are inevitably associated with high percentages of Dracophyllum pollen [24]. Therefore, the absence of the latter is significant, and indicates that forest climates have not been established. The major increase in shrubland noted at HSP was only weakly registered at the two bog sites. Equivalent January temperatures are estimated to have risen by c. 1 °C shortly after 12,000 BP. Between 11,000 and 10,500 BP, equivalent January temperatures were within 1 °C of the current temperature. The timing of this warming c. 12,000 BP is consistent with the end of the Antarctic Cold Reversal cooling event between 14,700 and 13,000 BP [39].
The grassland-wetland stage (present at all sites between 10,000 and 9000 BP) is characterised by the lowest percentages of shrub types in the post 12,500 BP period. The shrubland associate Phlegmariurus varius declined. Hymenophyllum ferns continued to be well represented. The reassertion of grassland cover and decline of shrubs is consistent with a lowering of elevational vegetation zones. The pollen transfer functions support such an interpretation since they show an equivalent temperature decline of c. 1 °C. The wetland index peaked, which could also be related to less evapotranspiration under cooler climates. However, vertical peat growth slowed at all three sites to a minimum and peat humification increased (Figure 5c–e) and this suggests an alternative explanation.
Vertical peat growth is determined by the balance between vegetation productivity and breakdown [40]. Most peat decay takes place in the few centimetres of the upper aerated acrotelm. If peat vertical growth was a faithful proxy for peat mass accumulation into the unaerated catotelm, steady peat accumulation would result in a linear relationship between peat height and age. However, compaction and slow anaerobic decay with increasing age and depth in the profile reduces the apparent vertical annual increment and upper peat layers. Therefore, they usually show an apparent acceleration of vertical growth [41]. Normally, a wetter peat will grow faster, all things being equal, because organic matter spends less time in the aerated acrotelm, which is thinner because of the higher water table. However, if vegetation productivity is low, even though the acrotelm is thin, the peat spends a greater amount of time within it, and, thus, decomposes more. Moreover, if winters and overnight temperatures are warm, peat breakdown increases as higher temperatures favour accelerated loss of organics [42]. Therefore, although the pollen sequences and temperature transfer functions developed from them, at first sight, seems to support a cooler summer climate, we prefer an interpretation based on changes in cloud cover and wind direction.
The peat surfaces became wetter after 13,000 BP, and much wetter between 10,500 and 9000 BP, and peat grew slowly (Figure 5c,d). Atmospheric humidity across the whole period (12,500 to 9000 BP) must have increased, as the filmy fern Hymenophyllum that is poorly represented in the modern pollen rain below 100 m [24], but common in the cloudier uplands, was abundant at all sites (Figure 5f). Rather than temperature decreases being the driver of these ecological changes, increased cloud immersion with accompanying low light, increased humidity and decreased transpiration, and wetter substrates [43] may have restricted shrub growth. Observations made on cloud bases over Campbell Island in the Perseverance Harbour basin [10] show that cloud immersion has a linear trend with altitude (Figure 6).
Wind direction has a strong effect on cloud base and mean daily temperature (Table 3). When prevailing winds were west to southwest, cloud bases were high (all peaks were clear in almost 60% of observations) and temperatures were cool (5.0 °C) (Table 3). Winds from the north-west quarter had cool temperatures but low cloud bases (peaks clear only in 21% of observations). Winds from the north and east led to cloud bases being low but temperatures were 3 °C warmer. Low cloud cover decreases warming during the day by reflecting solar radiation, but prevents heat loss overnight. The combination of northerly source air and prevention of overnight heat loss leads to markedly warmer temperatures. As plant growth depends on bright light and daytime warmth, the same daily mean temperature can have radically different consequences. Cloudiness at these latitudes, therefore, will not cool the land relative to the ocean but will suppress woody plant growth. Mild winters, in particular, are, paradoxically, a physiological stress factor for woody plants in oceanic environments since they break dormancy and encourage respiration and growth during a season when ground water levels are high and light levels are minimal [44]. For instance, Dracophyllum growth on Campbell Island is substantially reduced during warmer than normal winters [45]. In turn, loss of woody cover decreases evapotranspiration and increases soil moisture. This feedback cycle further reduces the suitability of soils for shrubs and encourages the spread of graminoids and cushion plants. Consistent with our interpretation is the lack of any resurgence of a cool climate and tundra indicators such as the macrophyllous forbs. If the early Holocene wetland-grassland phase represents a cloudiness and soil moisture induced depression of the limit to shrub-low forest on the island, it may have been substantial. The difference in the tree line altitude across the middle of the Southern Alps in New Zealand is c. 200 m, the cloudier, western slopes have lower elevation tree lines [46]. In terms of mean annual temperature, this is equivalent to more than a 1 °C depression, which shows that cloudiness could potentially offset a warming of this magnitude.
The near simultaneous expansion of Dracophyllum scrub across our sites argues for an abrupt change in the climate regime and a nearly 2 °C increase in equivalent January temperatures is reconstructed over the next 1000 years. However, the adjacent ocean was cooling from 9000 BP onward after an early Holocene peak [9,38,47]. Therefore, as the cooler equivalent temperatures reconstructed for the previous period were largely induced by cloudiness, it follows that the subsequent ‘warming’ reflects a reversion to clearer skies with increased southwesterly winds and, therefore, a real cooling of mean annual temperatures over the island. The establishment of Dracophyllum trees (as distinct from Dracophyllum shrubs) at the lower HSB site cannot have occurred before 9000 BP and we suggest not until 6200 BP when the grass and Hymenophyllum percentages fell to levels consistent with present day pollen rain from forested sites (Figure 5f). The timing is similar at the higher elevation MHB site. The Campbell Island fossil wood occurrences support this interpretation [48]. Buried Dracophyllum wood was collected along an elevational transect 65 to 100 m above the shrub line at c. 210 m in sheltered Southeast Harbour 3.5 km to the southeast of MHB, with no wood before 6000 BP.
The vegetation consequences of the interaction between wind and clear skies is complex. Although shrubs, and Dracophyllum in particular, become common at all three sites. They are not well aligned and each Dracophyllum curve has a different trajectory over the Holocene (Figure 4). The two lowland sites (HSP and HRB) achieve high Dracophyllum percentages at 6200 BP and, from then on, show marked fluctuations—especially the HRB—but no overall trend. In contrast, the upland MHB site after high values between 7500 and 5500 BP, undergoes a fluctuating decline in response to grassland expansion. A sharp rise in monolete fern spores at 3000 BP at this site shows winds may have increased in strength in the late Holocene (Figure 4) since ground ferns are likely to be favoured by reduced competition from wind-stunted shrubs and grasses. A similar trend is seen in the late Holocene at Rocky Bay [12].
These differing Holocene long term trends in Dracophyllum between the upland and lowland sites are yet a further indication of how the separate components of the climate system can have markedly differing effects on sites depending on their altitude and exposure. The pollen-based temperature reconstructions (which, after 9000 BP, likely reflect actual January temperatures) do not show, in either case, a marked Holocene trend nor do sea surface temperatures in the adjacent ocean. Dracophyllum is, therefore, most likely responding directly to wind speed and bright sunshine hours. The upland MHB site lies in a saddle exposed to winds from the north-western and south-western sectors, while the lowland HSP site is sheltered. Any increase in southern sector winds is likely to subject MHB to strong, cold winds and reduced Dracophyllum growth, whereas HSP will experience clearer skies and increased growth.
Evidence for a direct wind effect comes from the absence or decline in the course of the Holocene of shrubs in the most wind-exposed sites on Campbell Island. West-facing Hooker Cliffs (90 m asl) north of the island, never had significant shrub representation. The south-facing Rocky Bay cliff-top (130 m a.s.l, c. 6 km west of MHB) lost its initial Coprosma shrub cover in the course of the Holocene [12]. The fossil wood transect from Southeast Harbour lacks wood between 2300 and 1000 BP, which coincides with an interval with wind-blown silt and stones in nearby cliffs [49] and a marked decline in Dracophyllum pollen at MHB, and is attributed to an episode of intense windiness [48]. Increased windiness is recorded in sediments from an Auckland Island fiord over the same interval [50]. We attribute this pattern to the increased prevalence of southwesterly winds bringing clearer skies and, thus, favouring woody growth in sheltered areas but stronger, cooler winds eliminate woody communities on exposed sites.
While, from c. 5000 BP, the general Dracophyllum trend is strongly negative at MHB and positive at HSP. There is more alignment from 2000 BP. Both sites show a Dracophyllum peak at or around 2000 BP, low centered on 1500 BP, and peak values between 1000 and 600 BP, and a decline thereafter. The periods of falling or low Dracophyllum values are well aligned with glacial advances in the Southern Alps of New Zealand, where there are two groups of closely spaced advances between 2000 and 1400 BP, and 700 and 200 BP [51]. These are broadly consistent with the timing of the Dark Ages Cool period (DAC: 1550–1250 BP), the Mediaeval Climate Anomaly (MCA: 1150–750 BP), and the Little Ice Age (LIA: 650–100 BP).

6.2. The Sea Surface Temperature versus Island Temperature Anomaly

Given that growing season mean temperature is closely correlated with tree line elevation [7], and, as SSTs in the adjacent ocean were 1 °C or more higher than present [8,9], the tree line during the early Holocene period (12,000 to 6500 BP) should have been at elevations of 150 m or more if current climatic patterns held. Summer mean temperatures on Campbell Island are presently closely aligned with the surrounding SST (as they are in coastal locations on the New Zealand mainland) and some substantial change would have had to occur to decouple this alignment.
McGlone et al. [8] argued that the cooling of the land relative to the ocean was a consequence of the weakening of the southern westerlies over the island and, another consequence was a decline in summer heat subsidies brought by cyclones embedded in that wind flow. While this is still a feasible explanation, increased cloudiness is more consistent with the evidence we have outlined above. Westerly cliff edge sites from sub-Antarctic Auckland Island and Campbell Island showed that wind-blown silt and stones were absent from their postglacial soils until c. 9000 BP [5,8]. This is consistent with results from an analysis of deep sea cores from the New Zealand sector, which suggested that the early Holocene (11,800 to 9800 BP) period was both less windy and warmer than currently south of the New Zealand mainland due to weakening of the westerly wind flow [9]. As we have shown, indicators of increased soil wetness, higher humidity, and expansion of wetland-grassland at this time can be most parsimoniously explained by increased north-easterly flow over the island with greater cloud immersion and less bright sunshine. Resumption of strong south-westerly flow after 9000 BP would have reduced the incidence of low cloud and led to the subsequent expansion of trees, tall woody shrubs, and drier peat surfaces peaking between 6500 and 3000 BP. The strong regionalisation of vegetation development after 9000 BP argues for the pre-eminent influence of wind in the Holocene. Exposed cliff sites and ridge tops appear to have lost what shrub cover that they had initially and, after 3000 BP, seem to have become even more wind-swept with open, stunted shrubs [12]. This is not to say that cooling of the ocean in the late Holocene had no effect. HRB and MHB clearly had reduced shrub cover during the DAC and the LIA.

6.3. Southern Ocean Context

There are only a few terrestrial peat records in the southern ocean region with which to compare those from Campbell Island. The Auckland Island group 150 km to the north lies in the same ocean waters and has a similar vegetation cover [5,52]. While the chronology is not as secure as in the Campbell Island peats, the general pattern is the same, with the major trees, Dracophyllum longifolium and Metrosideros umbellata, not abundant until after c. 9000 BP. Acceleration of vertical peat growth after 6000 BP at two sheltered sites at Dea’s Head on the main island, and restriction of shrubs and small trees after ca. 9600 BP by intense windiness on the exposed Enderby Island site [5,53], supports the inferences made for Campbell Island. Evidence from wind-blown minerogenic input on Stewart Island immediately south of the New Zealand mainland points to stronger westerly winds after 5500 BP [54] as does isotopic and stratigraphic evidence from a lake in the far south and in the wind shadow east of the main ranges [55]. Further north on the New Zealand mainland, there are indications that tree lines were similarly inhibited by weaker westerly airflow. In the southeastern and central South Islands, tree lines did not reach current elevations until well after 9000 BP [56] and, in the northwestern South Island, not until 9500 BP [57].
A number of peat sites in Patagonia, Tierra del Fuego, and the Falkland Islands group between 55 and 51° S have vegetation records comparable to those of Campbell Island [58,59,60,61,62,63,64,65,66,67]. The initial timing of peat growth in the higher latitudes of Patagonia and Tierra del Fuego is similar to that of Campbell Island, commencing between 17,500 and 12,000 BP. The vegetation transitions from steppe-moorland to Nothofagus parkland by 12,000–11,000 BP, and then to closed Nothofagus forest during the early to mid-Holocene. Of particular relevance to the Campbell Island sequence is the late arrival of closed Nothofagus forest at upland sites close to the tree line. At Paso Garibaldi (54°43′ S, 500 m a.s.l), a closed forest was not present until after 8700 BP [64] and, at Las Contornas mire (54°41′ S, 420 m a.s.l), not until 6500 BP [63]. At Port Howard, Falkland Islands (51°20’S, 100–130 m a.s.l), the current vegetation of low shrubs did not replace herbaceous associations until 8000–7000 BP [66]. These patterns are confirmed in a recent review of vegetation change in Patagonia [68], which shows Nothofagus abundance not reaching current levels until 7000 BP in central Patagonia and 4000 BP in southern Patagonia.
The climatic explanation for the late establishment of forest or shrubland in southern South America differs from that given here for Campbell Island. In southern South America, SSTs were as warm or warmer than by 12,000 BP. However, weaker westerly flow brought more arid conditions and, thus, prevented the Nothofagus forest expanding, while, in the New Zealand sub-Antarctic regions, mist and low cloud associated with weaker westerlies suppressed the taller woody vegetation. Expansion of forest in the early to mid-Holocene in both regions was ultimately driven by increased windiness. However, in southern South America, rain-bearing westerlies delivered more precipitation and were pushed further inland, while, in the New Zealand sub-Antarctic regions, the south-westerly to westerly orientation of the wind flow brought higher cloud-bases and more spells of bright sunshine.
Recent tree line and scrub coverage on Campbell Island has been largely unresponsive to regional climate change. Around the turn of the 19th century and for several decades after, SSTs in the immediate region were as much as 0.5 °C below the 20th century average rising to 0.5 °C above 1970 to 1990 AD [69]. Although there has been vigorous regrowth of forest and shrubland across grassland induced by fire during the late 19th to early 20th century farming era [34], there has been no indication of elevational shifts in response to temperature [35,36]. This is consistent with our findings that past temperature shifts alone in these highly oceanic situations are insufficient to alter tree line dynamics, which has been noted for the mountains of mainland New Zealand [3,70,71].

7. Conclusions

While the postglacial spread of the forest on sub-Antarctic Campbell Island broadly follows the warming of the surrounding ocean, wind direction, wind strength, and cloudiness modified the timing and created gradients within the island, according to the degree of wind exposure. Decreased westerly to south-westerly wind flow permitted increased intrusion of north-easterly clouds between 12,500 and 9000 BP, which brings less sunshine, more cloud immersion, higher humidity, and weakened evapotranspiration that resulted in increased soil surface wetness. As a result, initial woody growth was inhibited despite rising ocean surface temperatures, and grassland and wetland spread. Establishment of forest and upland shrub coverage on the more sheltered leeward side of the island followed the switch to clearer skies as the current strong south-westerly airflow progressively established from 9000 BP onward. Woody vegetation reached maximum cover between 6500 and 3000 BP, but intensifying winds, at the same time, prevented forest or shrub spreading on the windward flanks. The warming of the southern part of the ocean in the early Holocene by 1–2 °C can be used as a proxy for anticipated warming in the near future. However, our results suggest temperature is only one of the factors that can affect the tree line position, and cloudiness and seasonality may be just as important. The failure of tree lines on Campbell Island and mainland New Zealand to respond to prolonged warming episodes during the 20th and 21st centuries supports this conclusion. Therefore, increasing mean annual temperatures will not necessarily lead to rising tree lines in highly oceanic regions unless these other factors are also in alignment.

Supplementary Materials

The following are available online at https://www.mdpi.com/1999-4907/10/11/998/s1. Table S1. Radiocarbon dates (old T1/2 and calibrated) for HRB, HSP, and MHB. Table S2. Homestead Ridge Bog vegetation cover and water table depths. Figure S1. Homestead Ridge Bog (X9901). Pollen diagram. Figure S2. Homestead Scarp (X9911). Pollen diagram. Figure S3. Mount Honey Saddle Bog(X9903). Pollen diagram. Derivation of the surface wetness index. Figure S4. NMS ordination of modern pollen and peat core samples at Campbell Island. Figure S5. NMS scores for modern pollen samples from 11 distinct Campbell Island plant communities.

Author Contributions

Conceptualization, M.S.M., J.M.W. and C.S.M.T. Data curation, J.M.W. Formal analysis, J.M.W., S.J.R., C.S.M.T., and J.R.W. Funding acquisition, M.S.M., J.M.W., and C.S.M.T. Investigation, M.S.M. and J.M.W. Project administration, J.M.W. Writing—original draft, M.S.M. Writing—review & editing, M.S.M., J.M.W., S.J.R., C.S.M.T., and J.R.W.

Acknowledgments

We thank the New Zealand Department of Conservation for permission to take samples from Campbell Island and for logistical support and Alison Watkins for technical support. This research was supported by Strategic Science Investment funding for Crown Research Institutes from the New Zealand Ministry of Business, Innovation and Employment’s Science and Innovation Group.

Conflicts of Interest

The authors declare no conflict of interest.

References

  1. IPCC. Climate Change 2014: Impacts, Adaptation, and Vulnerability Part A: Global and Sectoral Aspects; Cambridge University Press: Cambridge, UK; New York, NY, USA, 2014; p. 1132. [Google Scholar]
  2. Halloy, S.R.P.; Mark, A.F. Climate-change effects on alpine plant biodiversity: A New Zealand perspective on quantifying the threat. Arct. Antarct. Alp. Res. 2003, 35, 248–254. [Google Scholar] [CrossRef]
  3. Harsch, M.A.; Hulme, P.E.; McGlone, M.S.; Duncan, R.P. Are treelines advancing? A global meta-analysis of treeline response to climate warming. Ecol. Lett. 2009, 12, 1040–1049. [Google Scholar] [CrossRef] [PubMed]
  4. Cieraad, E.; McGlone, M.S.; Huntley, B. Southern hemisphere temperate tree lines are not climatically depressed. J. Biogeogr. 2014, 41, 1456–1466. [Google Scholar] [CrossRef]
  5. McGlone, M.S. The late Quaternary peat, vegetation and climate history of the southern oceanic islands of New Zealand. Quat. Sci. Rev. 2002, 21, 683–707. [Google Scholar] [CrossRef]
  6. Korner, C.; Paulsen, J. A world-wide study of high altitude treeline temperatures. J. Biogeogr. 2004, 31, 713–732. [Google Scholar] [CrossRef]
  7. Paulsen, J.; Körner, C. A climate-based model to predict potential treeline position around the globe. Alp. Bot. 2014, 124, 1–12. [Google Scholar] [CrossRef] [Green Version]
  8. McGlone, M.S.; Turney, C.S.M.; Wilmshurst, J.M.; Renwick, J.; Pahnke, K. Divergent trends in land and ocean temperature in the southern ocean over the past 18,000 years. Nat. Geosci. 2010, 3, 622–626. [Google Scholar] [CrossRef]
  9. Prebble, J.G.; Bostock, H.C.; Cortese, G.; Lorrey, A.M.; Hayward, B.W.; Calvo, E.; Northcote, L.C.; Scott, G.H.; Neil, H.L. Evidence for a Holocene climatic optimum in the southwest pacific: A multiproxy study. Paleoceanography 2017, 32, 763–779. [Google Scholar] [CrossRef]
  10. McGlone, M.S.; Meurk, C.D.; Crompton, M.B. Climate and Water Table Depth Data from Campbell Island, New Zealand Subantarctic; Manaaki Whenua-Landcare Research Contract Report; Landcare Research NZ Ltd.: Lincoln, New Zealand, 2019. [Google Scholar] [CrossRef]
  11. Campbell, I.B. Soil pattern of Campbell Island. N. Z. J. Sci. 1981, 24, 111–135. [Google Scholar]
  12. McGlone, M.S.; Moar, N.T.; Wardle, P.; Meurk, C.D. Late-glacial and Holocene vegetation and environment of Campbell Island, far southern new zealand. Holocene 1997, 7, 1–12. [Google Scholar] [CrossRef]
  13. De Lisle, J.F. Weather and climate of Campbell Island. Pac. Insect Monogr. 1964, 7, 34–44. [Google Scholar]
  14. Ross, D.J.; Campbell, I.B.; Bridger, B.A. Biochemical activities of organic soils from sub-antarctic tussock grasslands on Campbell Island. 1. Oxygen uptakes and nitrogen mineralization. N. Z. J. Sci. 1979, 22, 161–171. [Google Scholar]
  15. Foggo, M.N.; Meurk, C.D. A bioassay of some Campbell Island soils. N. Z. J. Ecol. 1983, 6, 121–124. [Google Scholar]
  16. Meurk, C.D.; Foggo, M.N.; Thomson, B.M.; Bathurst, E.T.J.; Crompton, M.B. Ion-rich precipitation and vegetation pattern on sub-antarctic Campbell Island. Arct. Alp. Res. 1994, 26, 281–289. [Google Scholar] [CrossRef]
  17. Meurk, C.D.; Blaschke, P.M. How Representative Can Restored Islands Really Be?: An Analysis of Climo-Edaphic Environments in New Zealand; Department of Conservation: Wellington, New Zealand, 1990.
  18. Meurk, C.D.; Given, D.R. Vegetation Map of Campbell Island. Land Resources; Department of Scientific and Industrial Research: Christchurch, New Zealand, 1990. [Google Scholar]
  19. Meurk, C.D.; Foggo, M.N.; Wilson, J.B. The vegetation of sub-antarctic Campbell Island. N. Z. J. Ecol. 1994, 18, 123–168. [Google Scholar]
  20. Anderson, M.J. A new method for non-parametric multivariate analysis of variance. Austral Ecol. 2001, 26, 32–46. [Google Scholar]
  21. Oksanen, J.; Blanchet, F.; Friendly, M.; Kindt, R.; Legendre, P.; McGlinn, D.; Minchin, P.; O’Hara, R.; Simpson, G.; Solymos, P. Vegan: Community Ecology Package. R Package v. 2.5-4. 2018. Available online: https://cran.r-project.org/web/packages/vegan/index.html (accessed on 3 October 2019).
  22. Warton, D.I.; Foster, S.D.; De’ath, G.; Stoklosa, J.; Dunstan, P.K. Model-based thinking for community ecology. Plant Ecol. 2015, 216, 669–682. [Google Scholar] [CrossRef]
  23. Wang, Y.; Naumann, U.; Wright, S.T.; Warton, D.I. Mvabund—An R package for model-based analysis of multivariate abundance data. Methods Ecol. Evol. 2012, 3, 471–474. [Google Scholar] [CrossRef]
  24. McGlone, M.S.; Meurk, C.D. Modern pollen rain, subantarctic Campbell Island, New Zealand. N. Z. J. Ecol. 2000, 24, 181–194. [Google Scholar]
  25. R Core Team. R: A Language and Environment for Statistical Computing; R Foundation for Statistical Computing: Vienna, Austria, 2018. [Google Scholar]
  26. Bruce, M.; Grace, J.; Urban, D. Analysis of Ecological Communities; MJM Software Design: Gleneden Beach, OR, USA, 2002. [Google Scholar]
  27. Bengtsson, L.; Enell, M.; Berglund, B. Handbook of Holocene palaeoecology and palaeohydrology. Chem. Anal. 1986, 423–451. [Google Scholar]
  28. Stuiver, M.; Reimer, P.J.; Bard, E.; Beck, J.W.; Burr, G.S.; Hughen, K.A.; Kromer, B.; McCormac, G.; Van Der Plicht, J.; Spurk, M. Intcal98 radiocarbon age calibration, 24,000–0 cal bp. Radiocarbon 1998, 40, 1041–1083. [Google Scholar] [CrossRef]
  29. Blackford, J.; Chambers, F. Determining the degree of peat decomposition for peat-based palaeoclimatic studies. Int. Peat J. 1993, 5, 7–24. [Google Scholar]
  30. Moore, P.; Webb, J.; Collinson, M. Pollen Analysis; Blackwell Scientific: Oxford, UK, 1991. [Google Scholar]
  31. Moar, N.T.; Wilmshurst, J.M.; McGlone, M.S. Standardizing names applied to pollen and spores in New Zealand Quaternary palynology. N. Z. J. Bot. 2011, 49, 201–229. [Google Scholar] [CrossRef]
  32. Heenan, P.B.; Smissen, R.D. Revised circumscription of Nothofagus and recognition of the segregate genera Fuscospora, Lophozonia, and Trisyngyne (Nothofagaceae). Phytotaxa 2013, 142, 1–31. [Google Scholar] [CrossRef]
  33. Grimm, E.C. TILIA Software Version 1.7.16; Illinois State Museum, Research and Collection Center: Springfield, IL, USA, 2011. Available online: http://intra.museum.state.ilus/pub/grim?m/tilia/ (accessed on 3 October 2019).
  34. McGlone, M.; Wilmshurst, J.; Meurk, C. Climate, fire, farming and the recent vegetation history of subantarctic Campbell Island. Earth Environ. Sci. Trans. R. Soc. Edinb. 2007, 98, 71–84. [Google Scholar] [CrossRef]
  35. Bestic, K.L.; Duncan, R.P.; McGlone, M.S.; Wilmshurst, J.M.; Meurk, C.D. Population age structure and recent dracophyllum spread on subantarctic Campbell Island. N. Z. J. Ecol. 2005, 29, 291–297. [Google Scholar]
  36. Wilmshurst, J.M.; Bestic, K.L.; Meurk, C.D.; McGlone, M.S. Recent spread of Dracophyllum scrub on subantarctic Campbell Island, New Zealand: Climatic or anthropogenic origins? J. Biogeogr. 2004, 31, 401–413. [Google Scholar] [CrossRef]
  37. Bestic, K.L. Dracophyllum Scrub Expansion on Subantarctic Campbell Island, New Zealand; Lincoln University: Lincoln, New Zealand, 2002. [Google Scholar]
  38. Pahnke, K.; Sachs, J.P. Sea surface temperatures of southern midlatitudes 0–160 kyr bp. Paleoceanography 2006, 21. [Google Scholar] [CrossRef]
  39. Pedro, J.B.; Bostock, H.C.; Bitz, C.M.; He, F.; Vandergoes, M.J.; Steig, E.J.; Chase, B.M.; Krause, C.E.; Rasmussen, S.O.; Markle, B.R. The spatial extent and dynamics of the antarctic cold reversal. Nat. Geosci. 2016, 9, 51. [Google Scholar] [CrossRef]
  40. Charman, D. Peatlands and Environmental Change; John Wiley & Sons: London, UK, 2002. [Google Scholar]
  41. Rydin, H.; Jeglum, J.K. The Biology of Peatlands, 2nd ed.; Oxford University Press: Oxford, UK, 2013. [Google Scholar]
  42. Ise, T.; Dunn, A.L.; Wofsy, S.C.; Moorcroft, P.R. High sensitivity of peat decomposition to climate change through water-table feedback. Nat. Geosci. 2008, 1, 763. [Google Scholar] [CrossRef]
  43. Reinhardt, K.; Smith, W.K.; Carter, G.A. Clouds and cloud immersion alter photosynthetic light quality in a temperate mountain cloud forest. Botany-Botanique 2010, 88, 462–470. [Google Scholar] [CrossRef]
  44. Crawford, R.M.M.; Jeffree, C.E.; Rees, W.G. Paludification and forest retreat in northern oceanic environments. Ann. Bot. 2003, 91, 213–226. [Google Scholar] [CrossRef] [PubMed]
  45. Harsch, M.A.; McGlone, M.S.; Wilmshurst, J.M. Winter climate limits subantarctic low forest growth and establishment. PLoS ONE 2014, 9, e93241. [Google Scholar] [CrossRef] [PubMed]
  46. Cieraad, E.; McGlone, M.S. Thermal environment of New Zealand’s gradual and abrupt treeline ecotones. N. Z. J. Ecol. 2014, 38, 12–25. [Google Scholar]
  47. Bostock, H.C.; Prebble, J.G.; Cortese, G.; Hayward, B.; Calvo, E.; Quiros-Collazos, L.; Kienast, M.; Kim, K. Paleoproductivity in the sw pacific ocean during the early Holocene climatic optimum. Paleoceanogr. Paleoclimatol. 2019, 34, 580–599. [Google Scholar] [CrossRef]
  48. Turney, C.S.; M c Glone, M.; Palmer, J.; Fogwill, C.; Hogg, A.; Thomas, Z.A.; Lipson, M.; Wilmshurst, J.M.; Fenwick, P.; Jones, R.T. Intensification of southern hemisphere westerly winds 2000–1000 years ago: Evidence from the subantarctic Campbell and Auckland Islands (52–50° s). J. Quat. Sci. 2016, 31, 12–19. [Google Scholar] [CrossRef]
  49. McGlone, M.S.; Moar, N.T. Pollen-vegetation relationships on the subantarctic Auckland Islands, New Zealand. Rev. Palaeobot. Palynol. 1997, 96, 317–338. [Google Scholar] [CrossRef]
  50. Browne, I.M.; Moy, C.M.; Riesselman, C.R.; Neil, H.L.; Curtin, L.G.; Gorman, A.R.; Wilson, G.S. Late Holocene intensification of the westerly winds at the subantarctic Auckland Islands (51 degrees S), New Zealand. Clim. Past 2017, 13, 1301–1322. [Google Scholar] [CrossRef]
  51. Schaefer, J.M.; Denton, G.H.; Kaplan, M.; Putnam, A.; Finkel, R.C.; Barrell, D.J.A.; Andersen, B.G.; Schwartz, R.; Mackintosh, A.; Chinn, T.; et al. High-frequency holocene glacier fluctuations in New Zealand differ from the northern signature. Science 2009, 324, 622–625. [Google Scholar] [CrossRef]
  52. McGlone, M.S.; Wilmshurst, J.M.; Wiser, S.K. Lateglacial and Holocene vegetation and climatic change on Auckland Island, subantarctic New Zealand. Holocene 2000, 10, 719–728. [Google Scholar] [CrossRef]
  53. Fleming, C.A.; Mildenhall, D.C.; Moar, N.T. Quaternary sediments and plant microfossils from Enderby Island, Auckland Islands. J. R. Soc. N. Z. 1976, 6, 433. [Google Scholar] [CrossRef]
  54. Turney, C.; Wilmshurst, J.; Jones, R.; Wood, J.; Palmer, J.; Hogg, A.; Fenwick, P.; Crowley, S.; Privat, K.; Thomas, Z. Reconstructing atmospheric circulation over southern new zealand: Establishment of modern westerly airflow 5500 years ago and implications for southern hemisphere Holocene climate change. Quat. Sci. Rev. 2017, 159, 77–87. [Google Scholar] [CrossRef]
  55. Anderson, H.J.; Moy, C.M.; Vandergoes, M.J.; Nichols, J.E.; Riesselman, C.R.; Van Hale, R. Southern hemisphere westerly wind influence on southern New Zealand hydrology during the lateglacial and Holocene. J. Quat. Sci. 2018, 33, 689–701. [Google Scholar] [CrossRef]
  56. McGlone, M.S.; Basher, L. Holocene vegetation change at treeline, Cropp Valley, Southern Alps, New Zealand. In Peopled Landscapes: Archaeological and Biogeographic Approaches to Landscape; Haberle, S., David, B., Eds.; ANU E Press: Canberra, Australia, 2012; Volume 34, pp. 343–358. [Google Scholar]
  57. Jara, I.A.; Newnham, R.M.; Vandergoes, M.J.; Foster, C.R.; Lowe, D.J.; Wilmshurst, J.M.; Moreno, P.I.; Renwick, J.A.; Homes, A.M. Pollen-climate reconstruction from northern South Island, New Zealand (41 degrees S), reveals varying high- and low-latitude teleconnections over the last 16,000 years. J. Quat. Sci. 2015, 30, 817–829. [Google Scholar] [CrossRef]
  58. Heusser, C. Late Quaternary vegetation and climate of southern Tierra del Fuego. Quatern. Res. 1989, 31, 396–406. [Google Scholar] [CrossRef]
  59. Heusser, C.J. Three late Quaternary pollen diagrams from southern Patagonia and their paleoecological implications. Palaeogeogr. Palaeoclimatol. Palaeoecol. 1995, 118, 1–24. [Google Scholar] [CrossRef]
  60. McCulloch, R.D.; Davies, S.J. Late-glacial and Holocene palaeoenvironmental change in the central Strait of Magellan, southern Patagonia. Palaeogeogr. Palaeoclimatol. Palaeoecol. 2001, 173, 143–173. [Google Scholar] [CrossRef]
  61. Fesq-Martin, M.; Friedmann, A.; Peters, M.; Behrmann, J.; Kilian, R. Late-glacial and Holocene vegetation history of the Magellanic rain forest in southwestern Patagonia, Chile. Veg. Hist. Archaeobot. 2004, 13, 249–255. [Google Scholar] [CrossRef]
  62. Borromei, A.M.; Coronato, A.; Quattrocchio, M.; Rabassa, J.; Grill, S.; Roig, C. Late Pleistocene-Holocene environments in Valle Carbajal, Tierra del Fuego, Argentina. J. S. Am. Earth Sci. 2007, 23, 321–335. [Google Scholar] [CrossRef]
  63. Borromei, A.M.; Coronato, A.; Franzen, L.G.; Ponce, J.F.; Saez, J.A.L.; Maidana, N.; Rabassa, J.; Candel, M.S. Multiproxy record of Holocene paleoenvironmental change, Tierra del Fuego, Argentina. Palaeogeogr. Palaeoclimatol. Palaeoecol. 2010, 286, 1–16. [Google Scholar] [CrossRef] [Green Version]
  64. Markgraf, V. Paleoenvironments and paleoclimates in Tierra del Fuego and southernmost Patagonia, South America. Palaeogeogr. Palaeoclimatol. Palaeoecol. 1993, 102, 53–68. [Google Scholar] [CrossRef]
  65. Pendall, E.; Markgraf, V.; White, J.W.C.; Dreier, M.; Kenny, R. Multiproxy record of late Pleistocene-Holocene climate and vegetation changes from a peat bog in Patagonia. Quatern. Res. 2001, 55, 168–178. [Google Scholar] [CrossRef]
  66. Barrow, C.J. Postglacial pollen diagrams from South Georgia (sub-antarctic) and West Falkland Island (South Atlantic). J. Biogeogr. 1978, 5, 251–274. [Google Scholar] [CrossRef]
  67. Smith, R.I.L.; Prince, P.A. The natural history of Beauchêne Island. Biol. J. Linn. Soc. 1985, 24, 233–283. [Google Scholar] [CrossRef]
  68. Nanavati, W.P.; Whitlock, C.; Iglesias, V.; de Porras, M.E. Postglacial vegetation, fire, and climate history along the eastern Andes, Argentina and Chile (lat. 41–55 degrees s). Quat. Sci. Rev. 2019, 207, 145–160. [Google Scholar] [CrossRef]
  69. Morrison, K.W.; Battley, P.F.; Sagar, P.M.; Thompson, D.R. Population dynamics of eastern rockhopper penguins on Campbell Island in relation to sea surface temperature 1942–2012: Current warming hiatus pauses a long-term decline. Polar Biol. 2015, 38, 163–177. [Google Scholar] [CrossRef]
  70. Cullen, L.E.; Stewart, G.H.; Duncan, R.P.; Palmer, J.G. Disturbance and climate warming influences on New Zealand Nothofagus tree-line population dynamics. J. Ecol. 2001, 89, 1061–1071. [Google Scholar] [CrossRef]
  71. Wardle, P.; Coleman, M.; Buxton, R.; Wilmshurst, J. Climatic warming and the upper forest limit. Canterb. Bot. Soc. J. 2005, 39, 90–98. [Google Scholar]
Figure 1. Campbell Island. Location in the southern part of the ocean (A), topographic map (B), oblique view, Perseverance Harbour (C), vertical view, Homestead Ridge bog (D), vertical view, and Mount Honey Saddle bog (E). Imagery from Google Earth.
Forests 10 00998 g001
Figure 2. Main vegetation types on Campbell Island. Tree line Dracophyllum at 30 m a.s.l. near the head of Perseverance Inlet (a), Oreobolus cushion bog, c. 40 m (b), Myrsine and Coprosma shrubland, c. 160 m (c), grassland above tree line, c. 220 m (d), macrophyllous forb community, c. 400 m (e).
Forests 10 00998 g002aForests 10 00998 g002b
Figure 3. Summary percentage pollen and spore diagrams for Homestead Scarp Peat (HSP), Homestead Ridge Bog (HRB), and Mount Honey Bog (MHB). Blue vertical shading represents the period during the Holocene (12,000 to 6500 BP) when the tree line was repressed.
Forests 10 00998 g003
Figure 4. Homestead Ridge Bog. Vegetation cover percentage correlations with the water table. Green-filled bars are statistically significant negative correlations, yellow bars are statistically significant positive correlations, and empty filled bars are not statistically significant.
Forests 10 00998 g004
Figure 5. SST, deep sea core MD97-2120 off south-eastern South Island [38] (a). Panels (b) to (f) from analyses of peat sites HSP (yellow), HRB (green), and MHB (red). Equivalent mean January (summer) Campbell temperature [8] (b). Surface wetness proxy (NMS axis 2) (c). Vertical peat accumulation (d). Humification index (% transmission) (e). Hymenophyllum (filmy fern) spore percentages (f). Blue vertical shading represents the period during the Holocene (12,000 to 6500 BP) when the tree line was repressed.
Forests 10 00998 g005
Figure 6. Percent of observations in which given elevations on the Mt Honey transect, Perseverance Harbour, Campbell Island were within the cloud base. A total of 576 twice daily (09:00 and 16:00 h) observations of cloud base were made from 1 March to 3 October 1991. Winds from northerly to south-easterly quarter (solid line) bring much lower cloud bases than those from westerly to southerly quarter (broken line). From Reference [10].
Forests 10 00998 g006
Table 1. Pollen vegetation zonation (periods calibrated years BP).
Vegetation ZonesHomestead Ridge Bog (HRB: X9901)Homestead Scarp Peat (HSP: X9911)Mt Honey Bog (MHB: X9903)
Macrophyllous forbs-tundra15,300–12,50016,800–12,50014,700–12,000
Grassland-shrub12,500–11,50012,500–10,20012,000–10,400
Wetland-grassland11,500–880010,200–900010,400–8900
Dracophyllum8900–559000–558900–55
Table 2. Vegetation cover in relation to the water table depth. Two series of daily water table measurements (February 1976 to February 1977, and December 1983 to November 1984) were made at permanent sites on Homestead Ridge raised bog and near the Meteorological Station, Perseverance Harbour, Campbell Island. Data from Reference [10].
Site Vegetation Cover (Elevation)Annual Mean Water Table Depth (cm)Standard Deviation
Cushion vegetation, Homestead Ridge (45 m)5.87.1
Sedge fen, Met. Station (10 m)8.19.9
Macrophyllous forbs/cushion, Homestead Ridge, raised bog (45 m)17.012.0
Tussock grassland, Met. Station (10 m)34.219.0
Dracophyllum low forest slope marginal to Homestead Ridge, raised bog (35 m)58.220.3
Dracophyllum/grassland, Met. Station (10 m)78.113.2
Dracophyllum/Coprosma forest, Met. Station (20 m)109.57.6
Table 3. Observations for which all peaks were clear of cloud, Perseverance Harbour Basin, 1 March to 3 October 1991. Data from Reference [10].
Wind DirectionsObservations with all Peaks Clear (%)Mean Daily Temperature (°C)% Observations
All39.56.1100.0
North to east-southeast21.08.127.4
North-northwest to west northwest20.85.122.7
West to southeast58.75.045.3
Calm53.99.34.5

