Article

Long-term Growth Variation and Selection of Geographical Provenances of Cunninghamialanceolata (Lamb.) Hook

1
Key Laboratory of Forest Silviculture of the State Forestry Administration, Research Institute of Forestry, Chinese Academy of Forestry, Beijing 100091, China
2
State Key Laboratory of Tree Genetics and Breeding, Research Institute of Forestry, Chinese Academy of Forestry, Beijing 100091, China
3
Collaborative Innovation Center of Sustainable Forestry in Southern China, Nanjing Forestry University, Nanjing 210037, China
*
Author to whom correspondence should be addressed.
Forests 2019, 10(10), 876; https://doi.org/10.3390/f10100876
Submission received: 26 July 2019 / Revised: 13 September 2019 / Accepted: 17 September 2019 / Published: 5 October 2019

Abstract

:
In order to understand the long-term growth variation of Chinese fir’s geographical provenances and promote long-term genetic improvement, the experimental provenance forest of Chinese fir planted in 1981 was taken as a research object.The provenances originated from southeastern China. The study measured each diameter at breast height (DBH) and tree height at 5, 6, 8, 12, and 33 years of age and analyzed the genetic variation of major growth traits of trees withdifferent provenances at different forest ages. Additionally, the study analyzed the geographical variation of Chinese fir by using the trend surface and principal component analysis (PCA) and evaluated the long-term selection effect of provenance by using juvenile–mature correlation and cluster analysis. The heritability of the DBH, treeheight, and volume of Chinese fir with different provenances reached 0.35–0.76, and with increasing forest age, the heritability of each trait showed a rising and gradually stabilizing trend. There were obvious differences in geographical variation patterns among the tested provenances, and both the DBH and the tree height growth patterns are two-way gradients. This variation pattern is associated with climatic conditions in different regions, and the factors limiting the growth difference of Chinese fir may be the mean temperature in winter and the precipitation in autumn and winter. An early selection age has a significant effect on shortening the timber production cycle of Chinese fir. The selection of trees aged between 6 and 12 years is more conducive to improving the efficiency of the genetic improvement of Chinese fir. The 42 excellent provenances selected from the 33-year-old mature Chinese fir forests have a larger increase in growth than trees with local provenances, which are concentrated in the Wuyi and Xuefeng mountains and are suitable for plantation in the Guangxi Zhuang Autonomous Region and surrounding areas.

1. Introduction

The effect of the genetic improvement of forest trees is related to the source of the seeds [1]. Successful afforestation programs depend, to a large extent, on the use of seeds with excellent geographic sources. The provenance test is an important means to identifythe geographical variation ofa tree species. Through the provenance test, the adaptability and productivity of trees with different provenances in a certain area (habitat) are determined, and high-yield, high-quality, and stable provenances are selected for forestry production. Provenance selection is one of the basic methods of forest genetic improvement [2].
Forests are generally distributed in a wide range of areas, and the climatic conditions vary greatly among different geographical areas. Temperature, precipitation, and light levels all affect the growth of trees. Larsen et al. [3] found that precipitation in the previous year (mainly precipitation in July or August) restricted the radial growth of white spruce (Piceaglauca (Moench) Voss) and jack pine (Pinusbanksiana Lamb.), and there was a significant positive correlation between the striction of radial growth and precipitation. Some tree species have distinctive patterns of geographic variation. For example, the variation of the cone and seed of Piceacrassifolia Kom. showed gradient regularity based on longitude variation, which was due to the gradual decrease of the relative humidity and the increase of evaporation [4]. Nagamitsu et al. [5] found that provenances of Japanese larch (Larixkaempferi (Lamb.) Carr.) in eastern Japan, where the seasonal variation is lowest in temperature and highest in precipitation, showed the highest performance of stem and branch growth. For forest trees, the target product is usually wood, and the harvest age (length of rotation) is generally 20 to 100 years, depending on the species and site quality [6]. Because of the long rotation period and the different genetic backgrounds of trees, the harvest efficiency is reduced.Therefore, it is necessary to shorten the rotation period. Early or indirect tree selection is particularly important to shorten the timber production cycle, improve the efficiency of genetic improvement, and maximize annual gainsin tree production [7,8]. Determining the optimal age for tree selection requires an analysis of the age trends of genetic parameters such as heritability and early and late correlation coefficients. McKeand [9] found that the annual expected productiongain of loblolly pine (Pinustaeda L.) was the largest when early selection was made between six and eight years of age. Jensen et al. [10] concluded that the optimal age for height in Scots pine (Pinussylvestris L.) is between 10 and 15 years.
Chinese firis a species of coniferous treenative to China. It is widespread in south China and has a history of about 8000 years of deforestation and utilization and more than 2000 years of cultivation [11]. According to the eighth Chinese National Forest Inventory, Chinese fir plantations occupy almost 8.95 million ha and have a standing timber volume of 625 million m3 [12]. At present, provenance selection and family selection are still one of the most important breeding methods of Chinese fir [13,14,15]. In order to estimate the genetic variation of forest trees, it is necessary to obtain and process large amounts of data from as many long-term experimental plots as possible and to collect data on long-term and repeated measurements [16]. Although the provenance test of the CAF (Chinese Academy of Forestry) has obtained a series of achievements, it appears that not all experimental plots have been preserved and maintained, and many of the published results were obtained in relatively young stands [15]. Although many provenance tests have been conducted on Chinese fir, only a few have been evaluated in the decades after planting.
In view of this, the growth and genetic parameters of Chinese fir with different provenances at ages of 5, 6, 8, 12, and 33 years were evaluated based on the growth survey data of the Chinese fir provenance test forest established in Liuzhou, GuangxiZhuang Autonomous Region, China, in 1981. Taking the Chinese fir experiment as an example, we tested the method of selecting a suitable planting population/provenance based on simple basic growth and survival parameters. The measurement aimed to find out growth differences between mature tree groups of different provenances from different locations and clarify geographic variation patterns. We also tried to screenfast-growth provenances of Chinese fir that are suitable for the development of the test areaand provide original materials for the conservation ofgermplasm resources and for further selection and cross-breeding in the future.

2. Materials and Methods

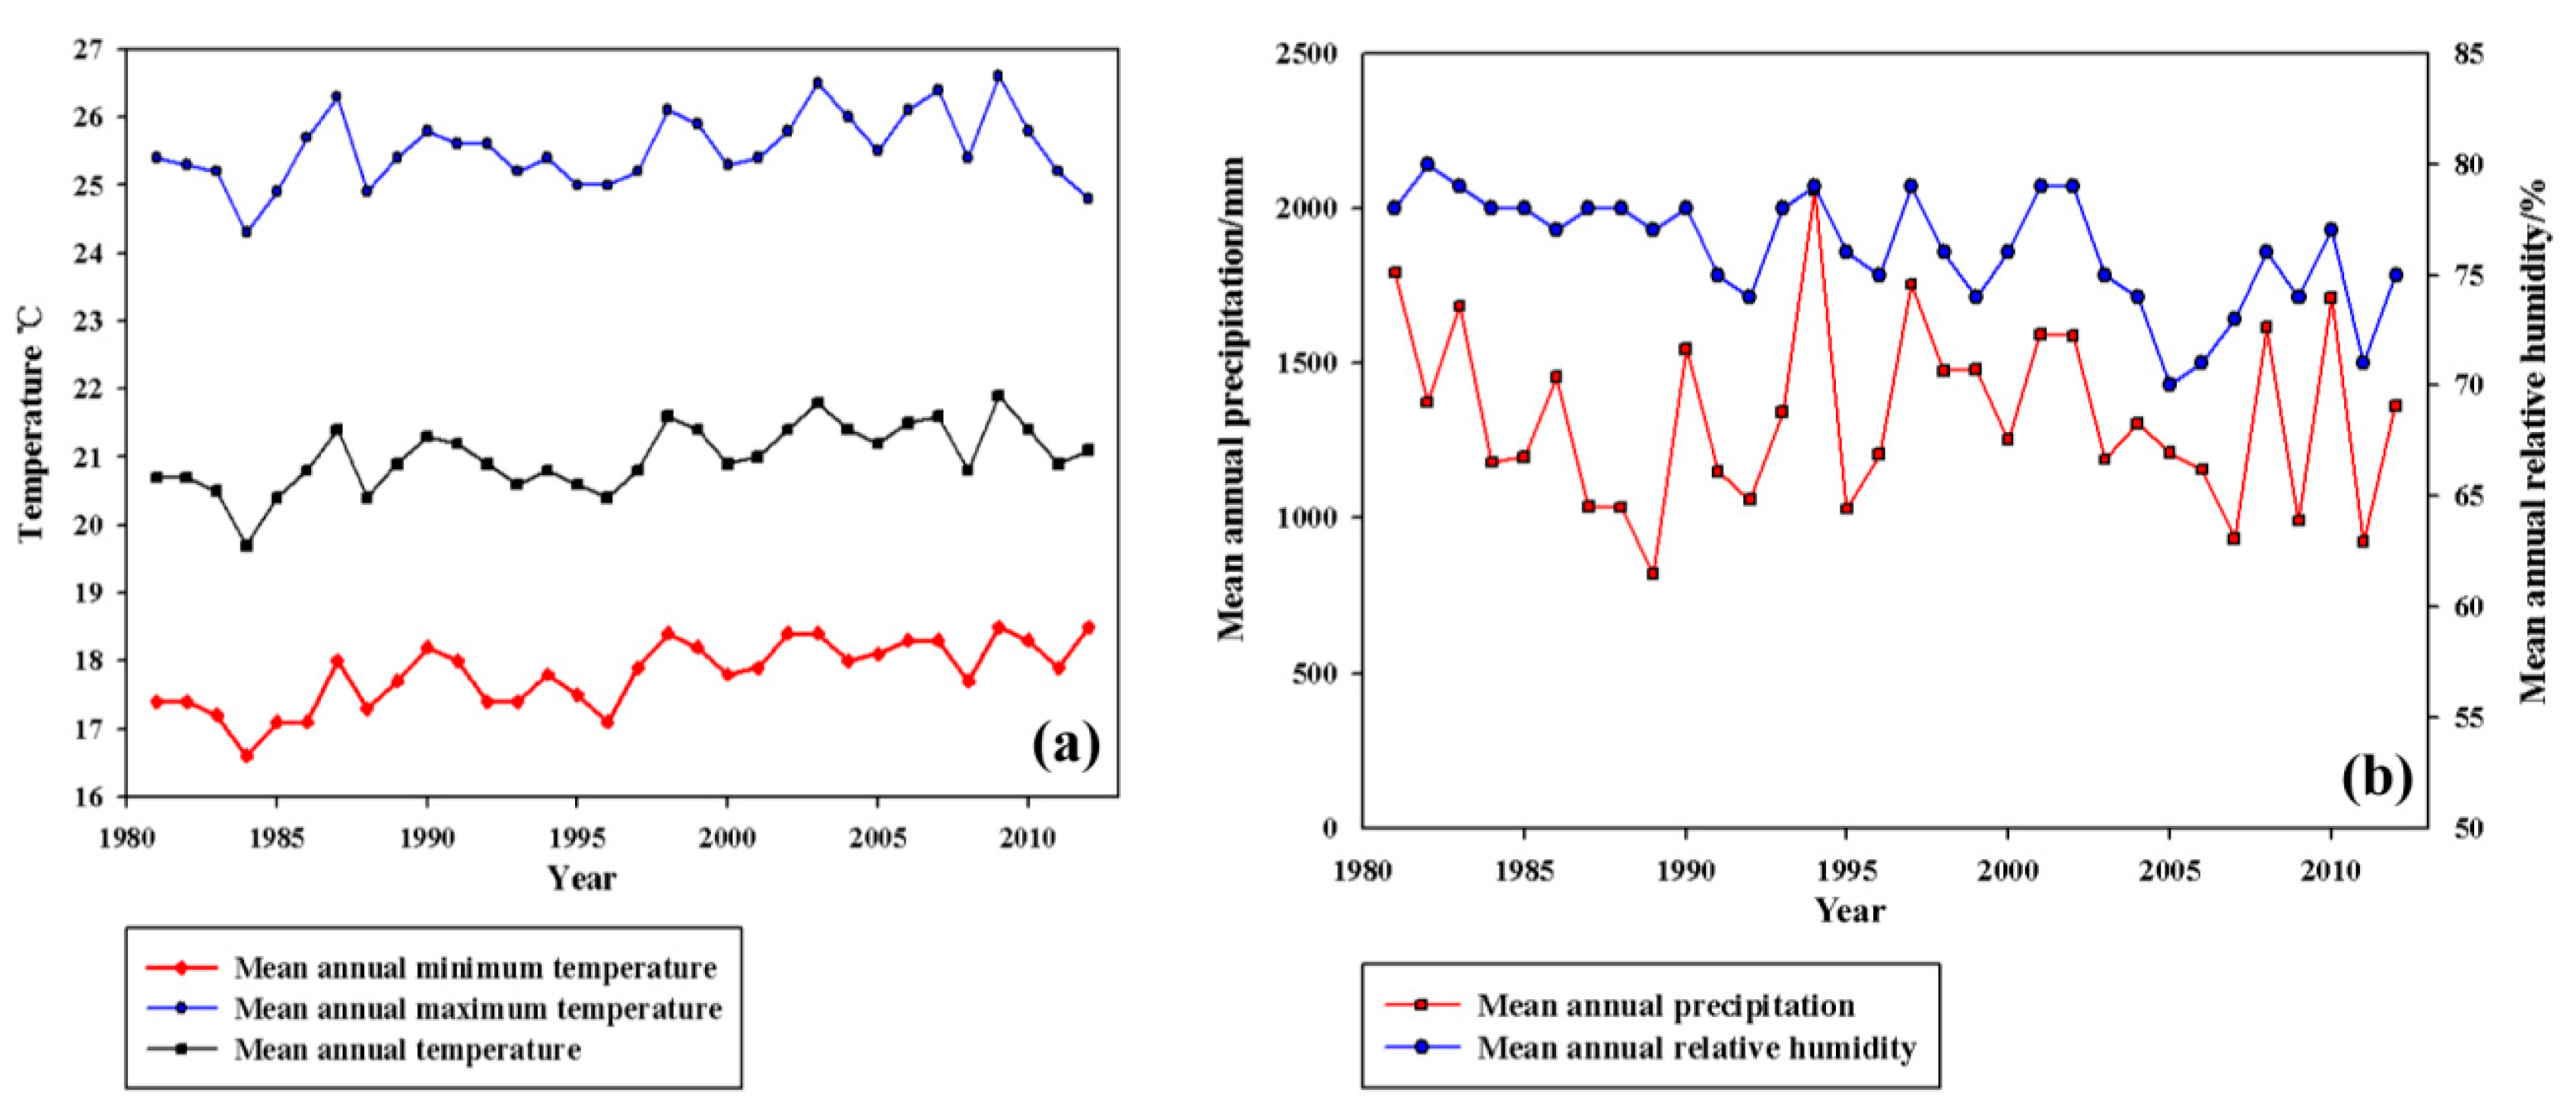
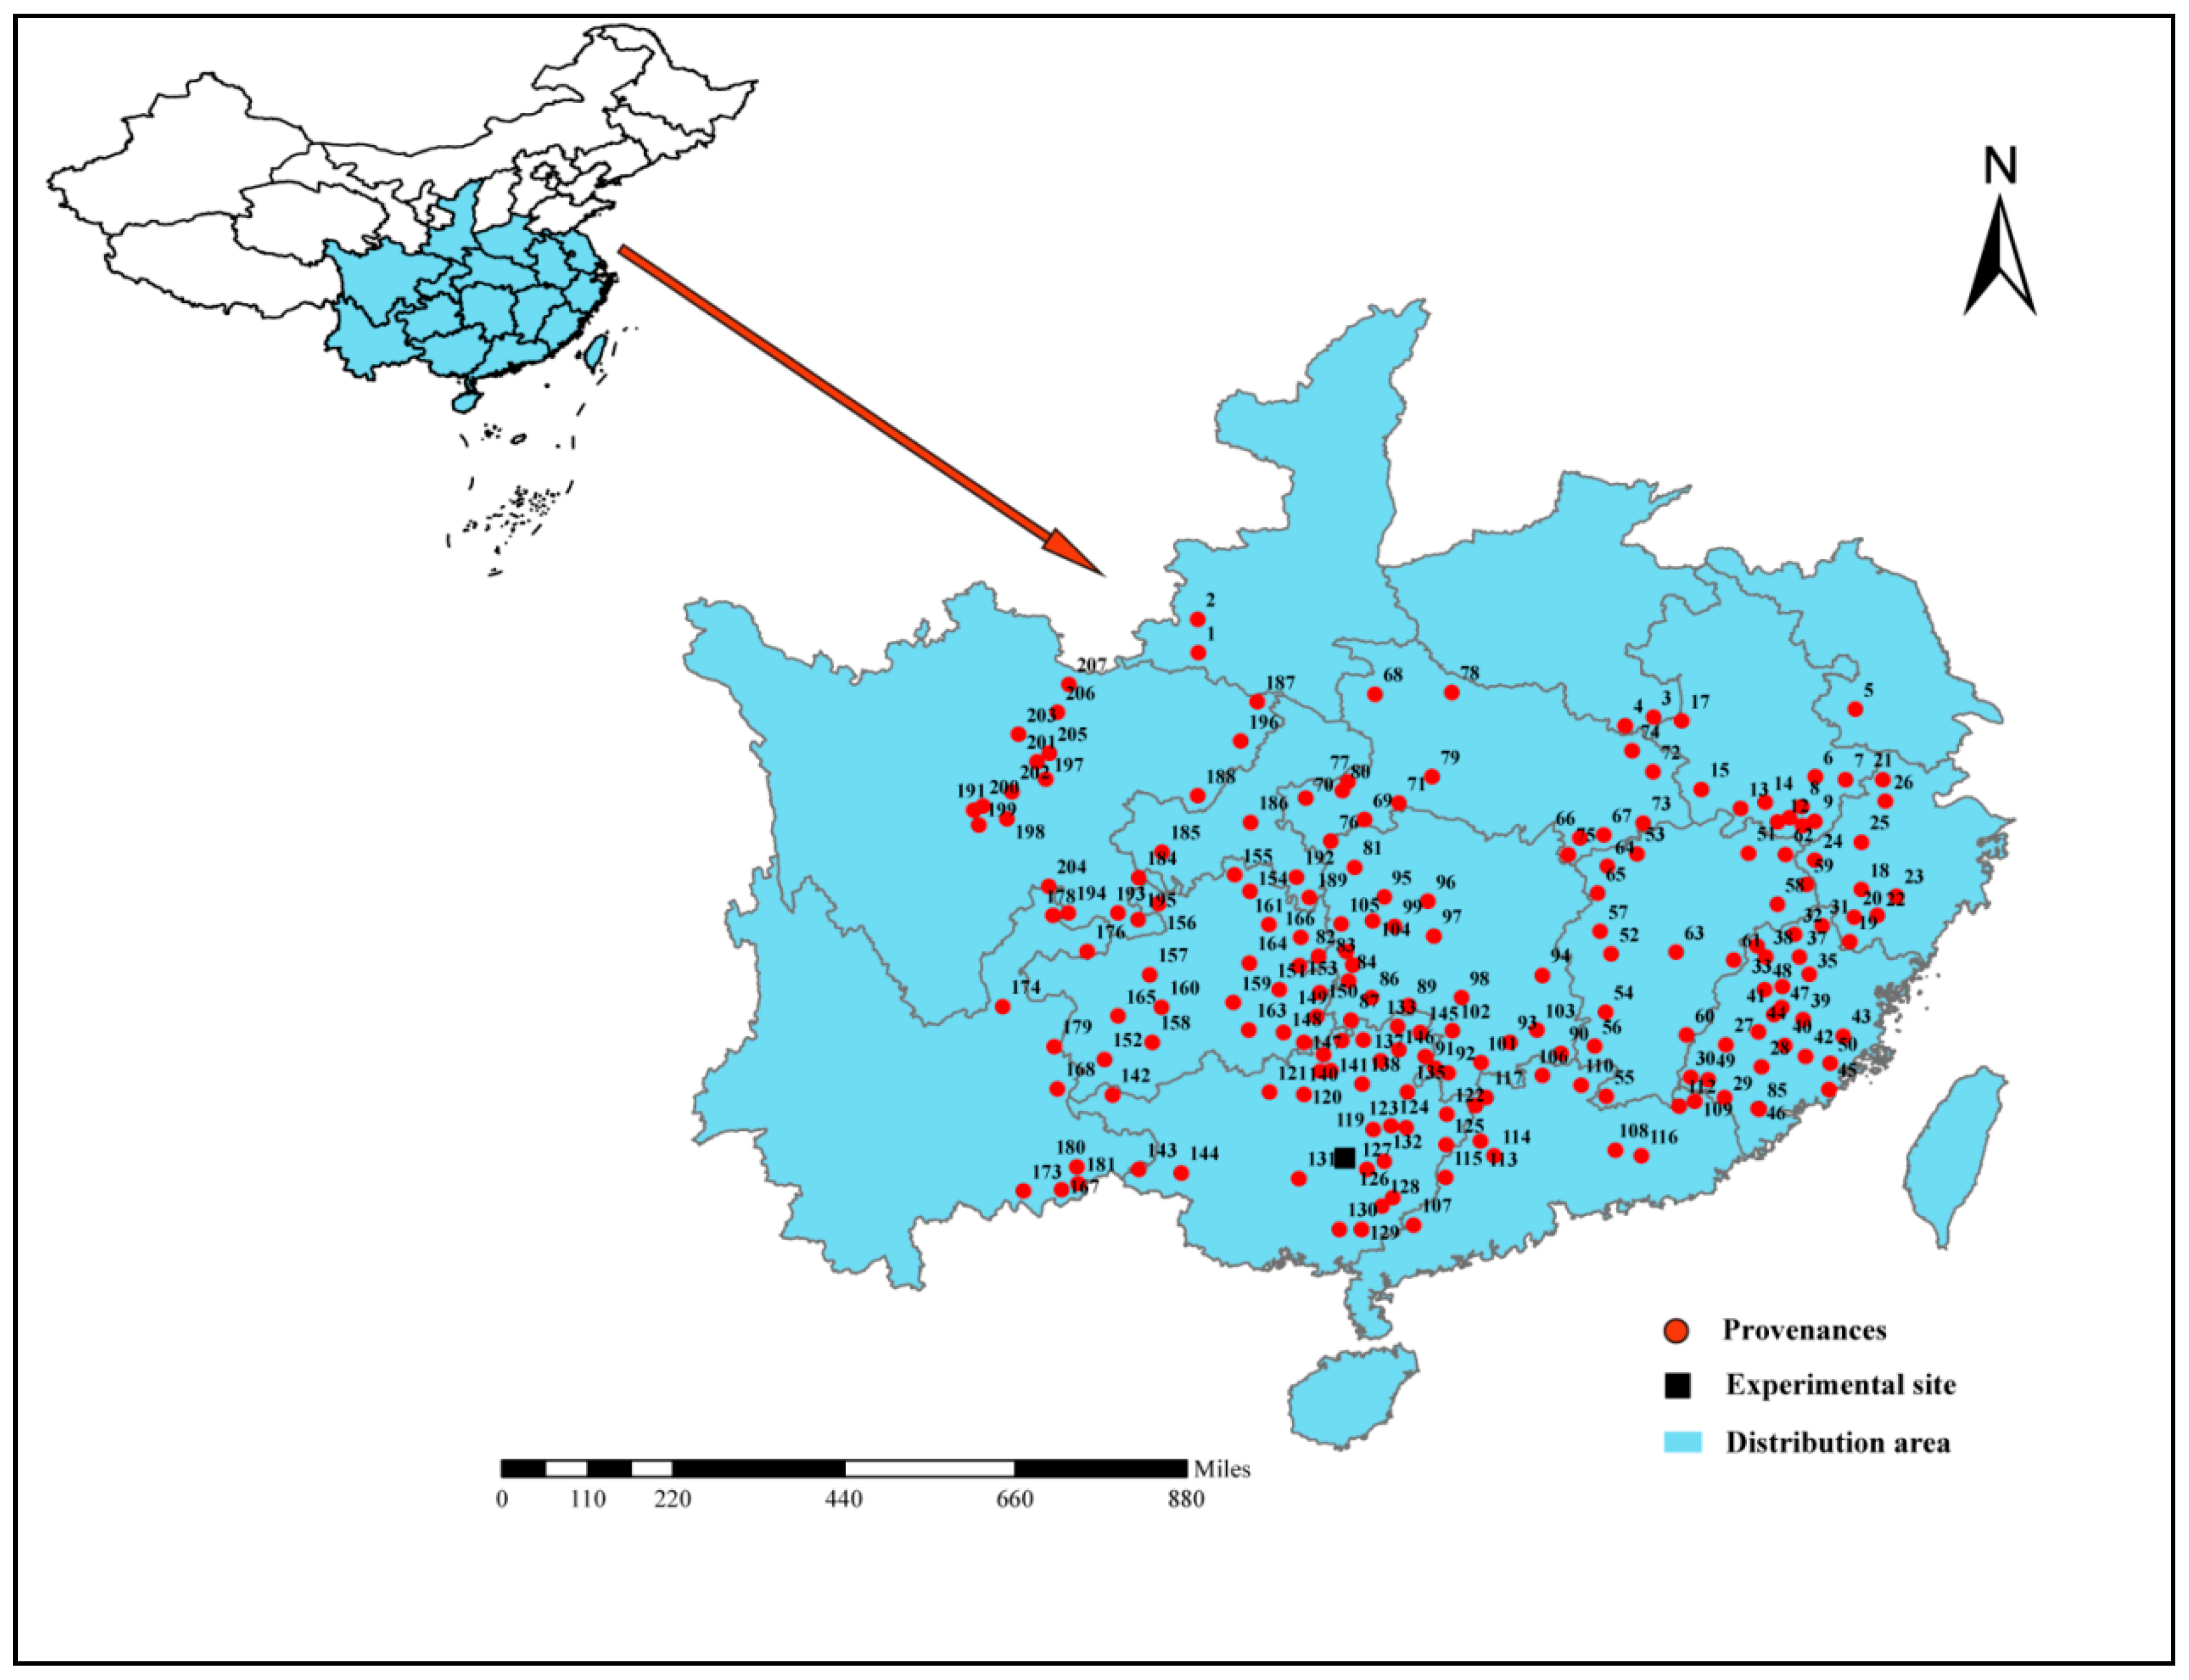
2.1. Experimental Site

The experimental materials were obtained from the Liufengshanforest farm (106°43′ E, 22°06′ N, 500 ma.s.l.), located in Liuzhou County, Guangxi Zhuang Autonomous Region, China (Figure 1). The area’s main geographical feature is low mountainswith slopes of 25–30°. This experimental site experiencesa southern tropical monsoon climate. The mean annual temperature, precipitation, and evaporation in the study area are 21 °C, 1328 mm, and 1200 mm, respectively. The site’s sandy-textured soil is formed from granite and is classified as Red Soil in the Chinese soil classification [17]. The soil thickness is greater than 1 m. Undergrowth vegetation, such as Aporusadioica (Roxb.) Muell. Arg., Rhodomyrtustomentosa (Ait.) Hassk., Cibotiumbarometz (L.) J. Sm., and Adiantumcapillus-veneris L., grows at the site.

2.2. Test Design

The National Geographic Provenance Cooperation Group started the second provenance test of the full natural distribution of Chinese fir in the late 1970s. A total of 207 geographic provenances were tested, which basically covered the full natural distribution of Chinese fir. Eight provenances were missing (the survival rate was less than 25% at the age of 33 years), and four repetitive collected provenances were excluded. Finally, 195 provenances were obtained (Figure 2). The preservation rate of the tested population was 94%. 195 provenance information data and survival ratecan be found in Supplementary material 1 (Table S1). In the spring of 1981, one-year-old seedlings were planted for afforestation, and abalanced incomplete plot design was adopted. Each plot had four plants, repeated 10 times, with 2 × 2 m row spacing, andtwo rows of Chinese fir isolation zones were set around the test area. The row spacing is representative of low-density afforestation (2500 trees/hm2) in Chinese fir plantations, and there is almost no self-thinning phenomenon in the early stage of afforestation. Diagonal thinning was carried out once in 1994, 4 × 4 m row spacing ensures less competition among trees, and provenances can exert their own effects.

2.3. Data Collection

The DBH and treeheight of each tree in the experimental forest was measured in 1984 (tree age of five years), 1985 (six years), 1987 (eight years), 1991 (12 years), and 2012 (33 years).
Distribution data (longitude, latitude in decimal degrees) of Chinese fir were taken from the second provenance test of CAF. The climate data came from the World Climate Database (http://www.worldclim.org/), which is mainly based on the meteorological observation records of meteorological stations around the world from 1970 to 2000 (BIOCLIM 2.0) [18]. The global climate data package with a spatial resolution of 2.5’ was generated by the spatial interpolation method. The extraction of bioclimatic coefficient values for each of the stations was performed using the DIVA-GIS 7.5 software [19], which was used to identify the main climatic factors that differentiate Chinese fir stands. Principal component analysis (PCA) based on the correlation matrix was used to identify these factors by PAST3.25 software [20]. This method of analyzing the differences in climatic conditions between provenance was used earlier in the research of Klisz et al. [21,22].

2.4. Data Analysis

Five replicates were checked at fiveyears old, 10 replicates were checked at 6, 8, and 12 years old, and all seven replicates were checked at 33 years old. A linear model of character variance analysis was used and was based on individual plants:
X i j = μ + α i + β j + e i j
where μ is the overall average value, α i is the provenance effect, β j is the block effect, and e i j is the residual error.
Trend surface analysis was used as a statistical method to simulate the spatial distribution and the change trend of geographic data by fitting a binary non-linear function with the least square method based on the principle of regression analysis [23]. If there are n provenances in the test, the mean value of each provenance is determined as zi (i = 1, 2, 3 … n). When the highest coefficient of x and y is 2, the regression equation of trend surface analysis is as follows [24]:
Z i = β 0 + β 1 x + β 2 y + β 3 x 2 + β 4 y 2 + β 5 x y + ε i j
where β is the regression coefficient, x is the longitude, y is the latitude, and ε i j is the random error.
Individual volume: V = 0.0000966836568 × D 1.3 1.677315187 × H 0.97848879 .
The heritabilityis H 2 = V G / V P , where V G is the genetic variance, and V P is the total variance. The genetic gainis Δ G = S / X c k ¯ × H 2 , where S is the selection difference, and X c k ¯ is the average of all traits of trees with provenances in the Guangxi Zhuang Autonomous Region.
The statistical analysis of the data was performed using Excel2011 (Microsoft, Washington, WA, USA) and SPSS22.0 software (IBM, New York, NY, USA), and Surfer 11.0 (Golden Software, Golden, CO, USA) software was used for trend surface mapping.

3. Results and Analysis

3.1. Variance Analysis of Growth Traits of Chinese Fir with Different Provenances

The results of the variance analysis (Table 1) of the main growth traits of Chinese fir provenance test forests of different ages show that the 195 provenances analyzed have significant (p < 0.01) differences in terms of their trees’ DBH, tree height, and volume among different ages, indicating that the growth traits of trees with different provenances show great differences and also have obvious differences among different ages of trees.

3.2. Growth Variation of Chinese Firwith Different Provenances

The growth variation of Chinese fir from different provenances is different at each growth stage (Table 2). As the age of the Chinese fir experimental forest increases, the growth characteristics of provenances increase, while the differentiation of traits among provenances keeps increasing. With increasing forest age, the coefficient of variation of each trait gradually decreases and tends to be stable. Among the traits, the coefficient of variation of the volume is the largest, far greater than the coefficient of variation of treeheight and DBH. The heritability of DBH, tree height, andvolume for 5, 6, 8, 12, and 33-year-old trees are 0.54–0.57, 0.75–0.77, 0.78–0.80, 0.74–0.81, and 0.75–0.76, respectively, and with increasing forest age, the heritability of each trait shows a trend of first rising and gradually stabilizing.

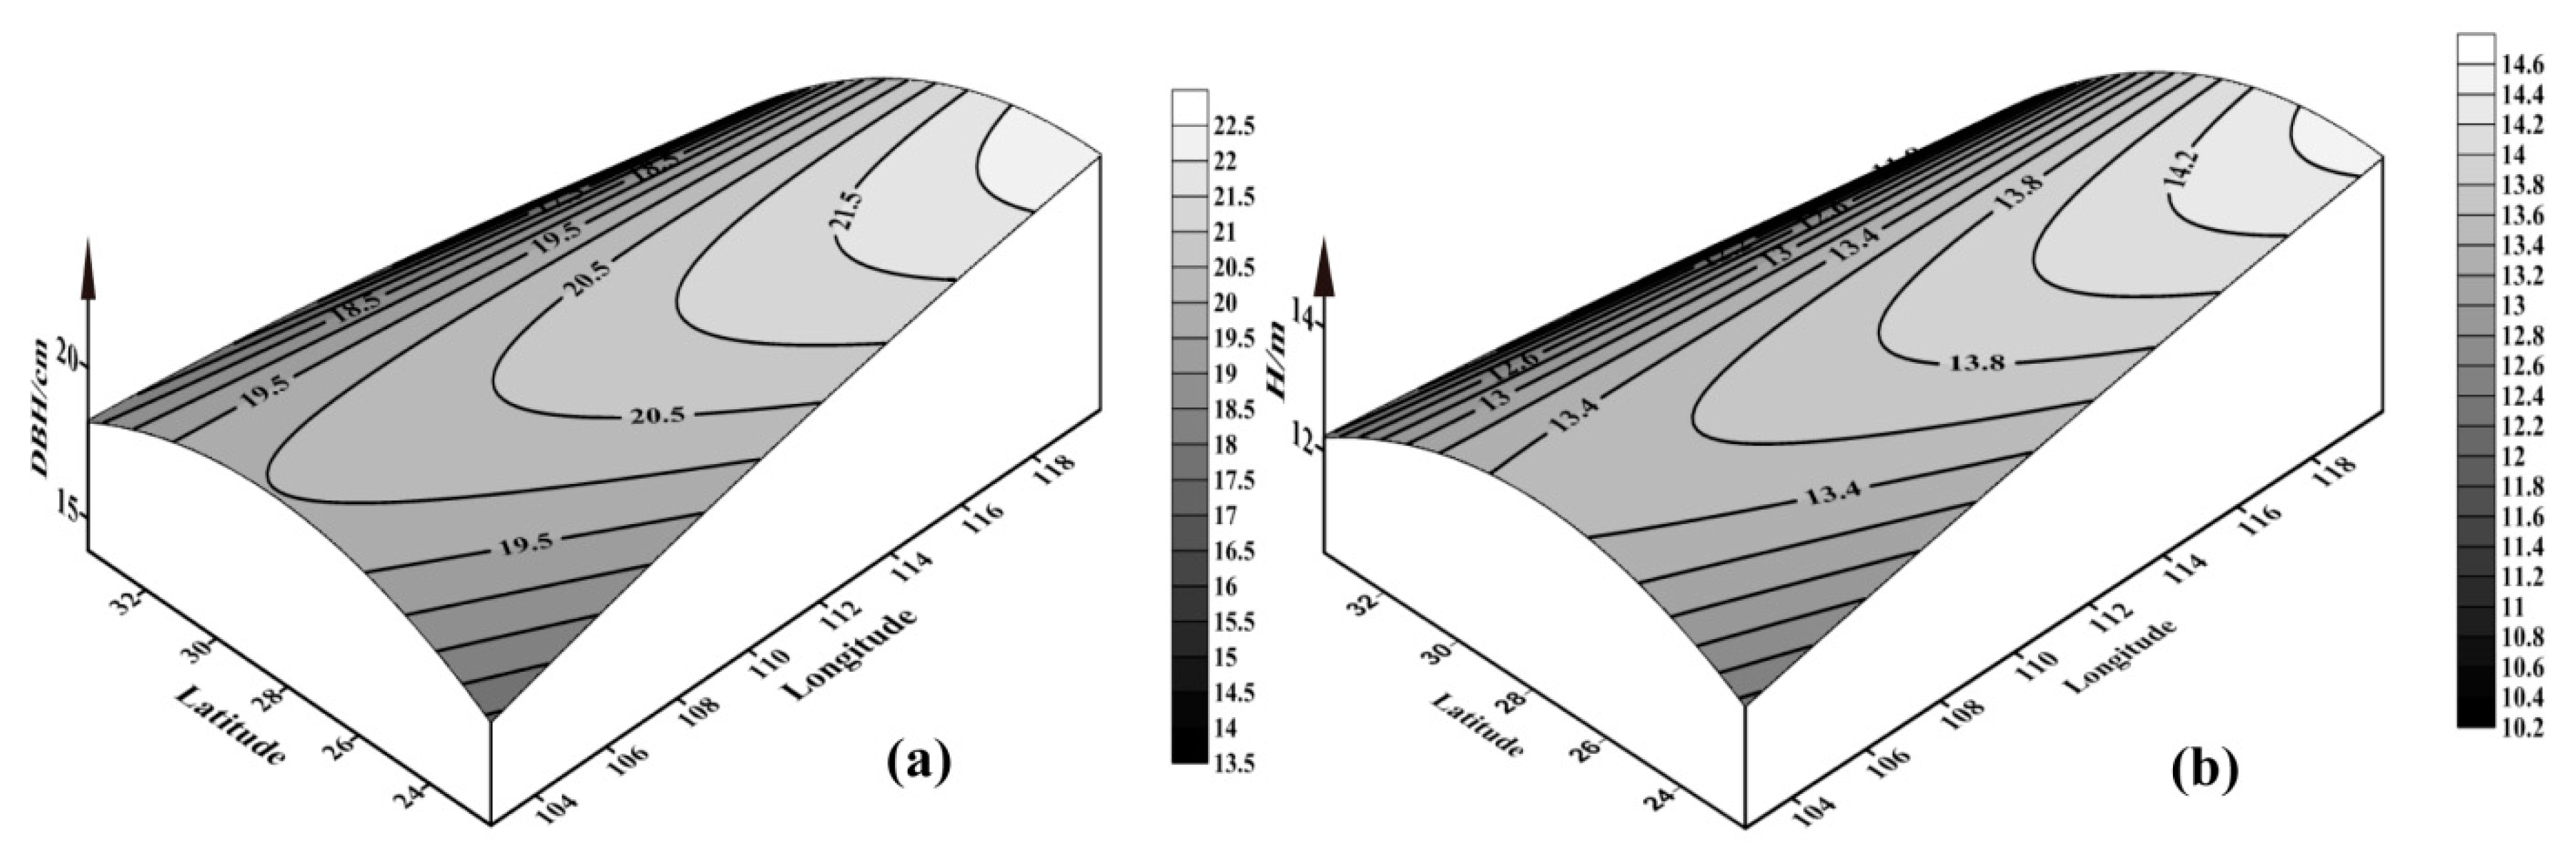
3.3. Correlation Analysis of Growth Traits and Geographical Factors of Chinese Fir with Different Provenances

The main growth characteristics of Chinese fir are the tree height and DBH, which are also the direct basis for judging the growth of Chinese fir. In order to better understand the trends in the geographic variation of Chinese fir, a binary quadratic trend surface analysis was performed on the geographic factors of the 33-year-old DBH, treeheight, and provenance of Chinese fir by using trend surface analysis (Table 3). The significance of the equations reaches a significant level (p < 0.01). From the trend map of DBH, tree height, and longitude and latitude, it can be seen that the geographic variation patterns of DBH and H (Figure 3) are both bidirectional variation patterns. DBH varies positively with longitude, i.e., the growth of trees with eastern provenance is greater than that of trees with western provenance, with a small variation. With increasing latitude, DBH first increases and then decreases, i.e., the growth of trees fromprovenance in the middle latitudes is greater than thoseof trees from the northern and southern latitudes, with a large variation. The changes in tree height and DBH with latitude and longitude follow similar patterns. Generally speaking, the provenance growth of treesis greater in the middle of the distribution area, and the growth increases from the northwest to the southeast. Additionally, Pearson correlation analysis showed that the treeheight and DBH are highly significantly correlated with latitude, while the correlation of tree height and DBH with longitude is insignificant, which is consistent with the trend surface analysis.

3.4. Bioclimatic Analyses of Chinese Fir

Twenty climatic factors extracted from DIVA-GIS 7.5 were analyzed by principal component analysis (PCA), of which only the first two are statistically significant and account for 69.44% of the variance (Table 4). The first component (PC1) explained 37.78% of the variance, which was strongly negatively correlated with altitude (r < −0.7) and strongly positively correlated with the mean temperature (bio1, bio9, bio10), maximum temperature (bio5), annual precipitation (bio12), and autumn and winter precipitation (bio14, bio17, bio19) (r > 0.7). According to PC1, the stand location of Chinese fir was weakly correlated with winter temperature and summer precipitation (bio6, bio11, bio13, bio16). PC1 is a contrast in temperature and precipitation. The second principal component (PC2) explains 31.66% of the variance and has a strong positive correlation with isothermality and precipitation seasonality (bio3, bio15) and a strong negative correlation with seasonal temperature distribution (bio4, bio7). In addition, the location of Chinese fir stands has little correlation with winter temperature and the warmest season precipitation (bio6, bio11, bio18). PC2 reflects seasonal variation in temperature and precipitation. The third principal component (PC3) explained 13.68%, which had little correlation with all meteorological factors. The fourth principal component (PC4) explained 6.78%, which had a strong positive correlation with the mean monthly temperature range (bio2).

3.5. Correlation between Juvenile–Mature Growth Traits and the Early Selection Effect of Chinese Fir

The year–year correlation coefficient is an important indicator for early selection. The phenotypic correlation coefficient and genetic correlation coefficient of the DBH, tree height, and tree volume of Chinese fir with different provenancesfor different forest ages were statistically analyzed (Table 5). The genetic correlation coefficients of DBH, tree height, and tree volume are 0.426–0.941, 0.392–0.934, and 0.395–0.946, respectively, and the phenotypic correlation coefficients are 0.323–0.939, 0.342–0.952, and 0.334–0.954, respectively. The phenotypic correlation and genetic correlation of various traits of Chinese firprovenances are significant at level <0.01 for allforest ages. This shows that the early selection of Chinese fir can be carried out after five years. With increasingforest age, the phenotypic correlation and genetic correlation coefficientsincrease to different degrees, which is in line with the viewpoint that the greater the forest age, the better the selection effect. At the age of five years, the phenotypic correlation and genetic correlation coefficients of each growth trait are only 0.3–0.4, which indicates that the growth potential of Chinese fir is not fully displayed in the early growth period, and that selection in the early growth period has great disadvantages.

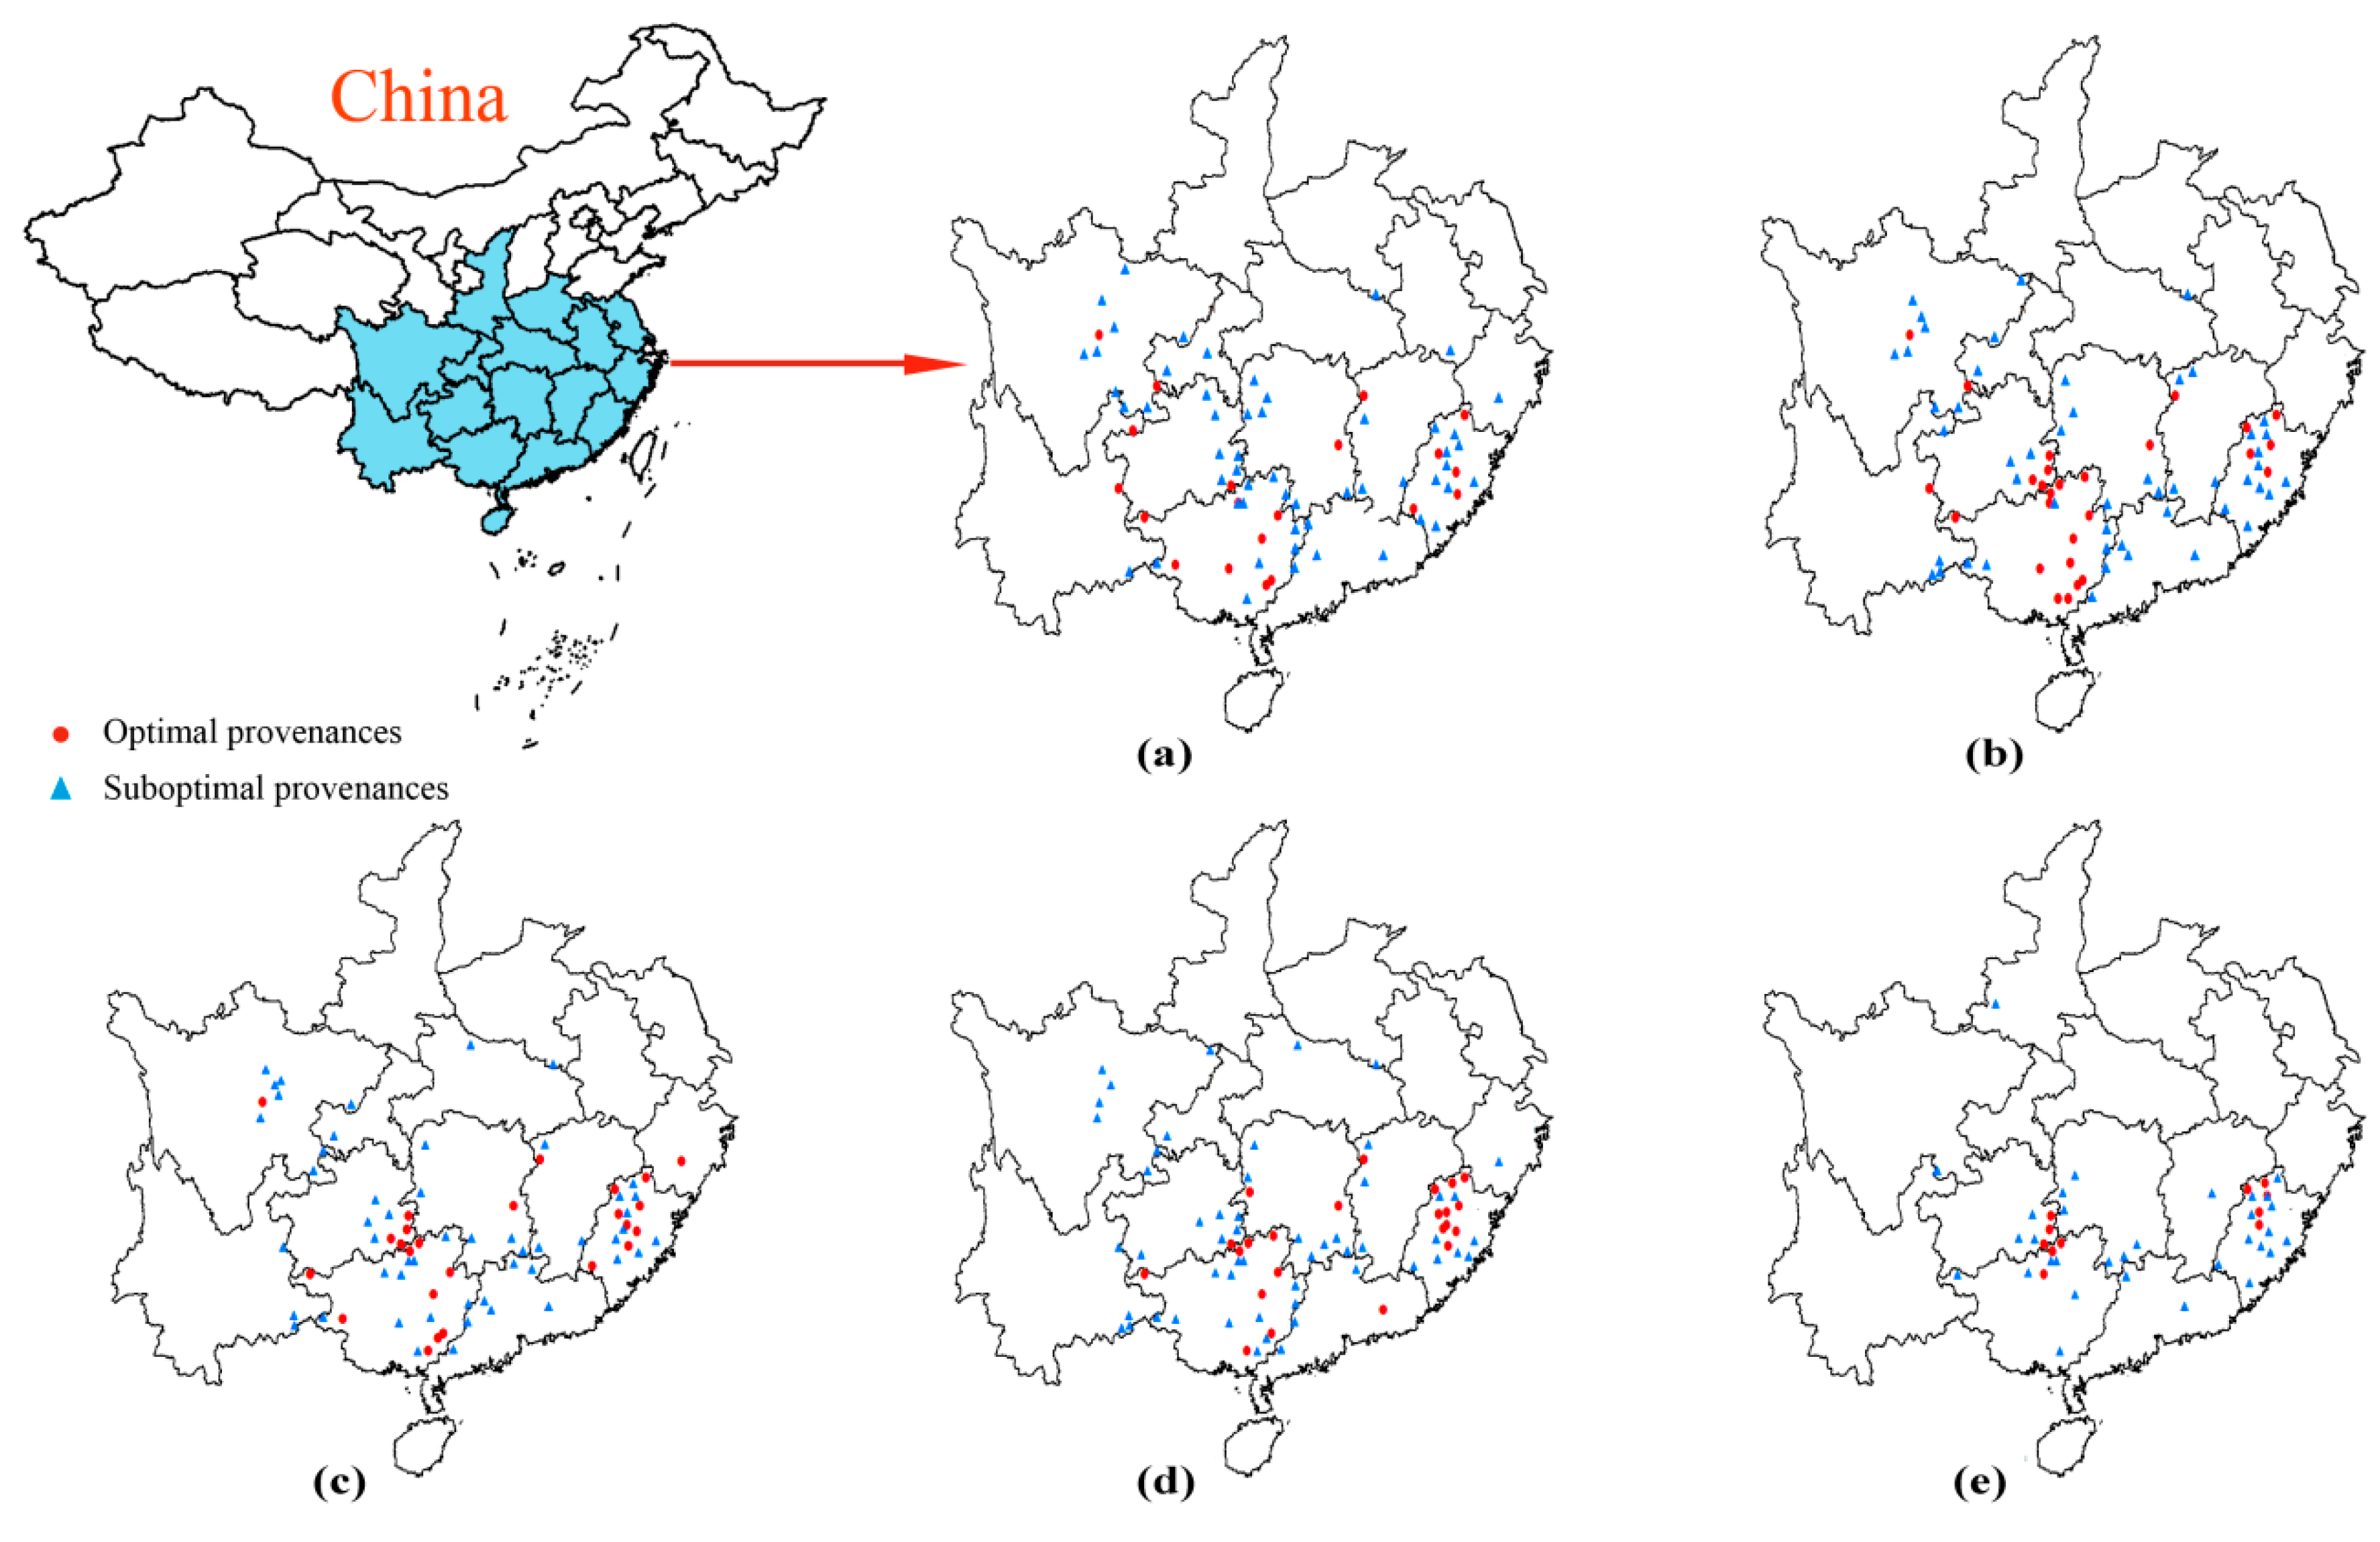
3.6. Cluster Analysis of Chinese Fir with Different Provenances

The DBH, treeheight, and volume of 195 provenances of Chinese fir for different forest ages were used as variables, cluster analysis was carried out forfive categories of tree growth type, and the two categories with the greatest growth for each forest age were selected, with category I indicating the optimum growth and category II indicating suboptimal growth (Figure 4). It can be seen that the selected 33-year-old firs were mainly distributed in the area of the Xuefeng Mountains and the area of the Wuyi Mountains, and that the provenances with the greatest growth for each forest age account for a small proportion of the whole, at only about 10%, 20% at 5 years old, 27% at 6 years old, 25% at 8 years old, 23% at 12 years old and 11% at 33 years old. Among the various provenances, the Chinese firs from Pucheng, Youxi, Jiangle, Tonggu, Youxian, Jinxiu, Rongxian, Gongcheng, and Longlin all belong to category I at forest ages of 5, 6, 8, and 12 years. However, they are not included in category I at a forest age of 33 years, which indicates that these Chinese firs belong to the middle and early growth types. The Chinese firs from Chongan, Jianyang, Shunchang, Shaxian, and Guangxi Luocheng were not included in category I at the early tree growth stage. However, they were included in this category at a forest age of 33 years, indicating that these provenances of Chinese fir belong to the late growth type. The Chinese firs fromGuangze, Guangxi Sanjiang, Rongshui, and Guizhou Congjiang were included in category I at all ages, indicating that these provenances of Chinese fir are the sustained growth type. Additionally, the results of this study show that the provenances with the greatest growth selected at a forest age of 33 years have different degrees of distribution at ages of 5 years, 6 years, 8 years, and 12 years, which also indicates the possibility of early selection.

3.7. Selection Analysis and Risk Estimation of Chinese Fir with Different Provenances in Early and Late Growth Stages

In this study, 33-year-old Chinese fir stands are deemed to have reached the mature stage, and their historic growth characteristics have been fully demonstrated. Additionally, based on the excellent provenance selected at a forest age of 33 years, the provenance areas with category Iand category II Chinese fir selected at different forest ages are further analyzed (Table 6). For the selection of only category I of provenances, it can be selected at forest ages of 8 to 12 years, including 64% of the provenances selected by decision. Next, we increase the selected population and select the provenances of category I and category II. By comparing and analyzing the correct selection rate, incorrect selection rate, and missed selection rate of provenances of different ages, it can be seen that the selection accuracies for 6-year-old, 8-year-old, and 12-year-old forests are very similar, and the selection of 6 to 12-year-old provenances includes 69–74% of the selected provenances. Compared with selecting only Class I provenances, the ratio of correct selections is increased andthe ratios of incorrect and missed selections are decreased. This shows that the probability of selecting excellent provenances can be selected and increased in advance by reducing the selection intensity during early selection.
Additionally, the provenances with the greatest and worst tree growth were compared. It was found that trees of provenances from northwestern Fujian Province, northern Guangxi, and southeastern Guizhou Province have the greatest growth, with all of these provenances in the area of the Nanling Mountains. Most of the provenance areas with trees showing the worst growth are located in Henan Province, Anhui Province, northwest Zhejiang Province, southwest Hubei Province, the south of the middle of Guangdong Province and Guangxi, and northern Sichuan Province, which belong to marginal production areas of Chinese fir.

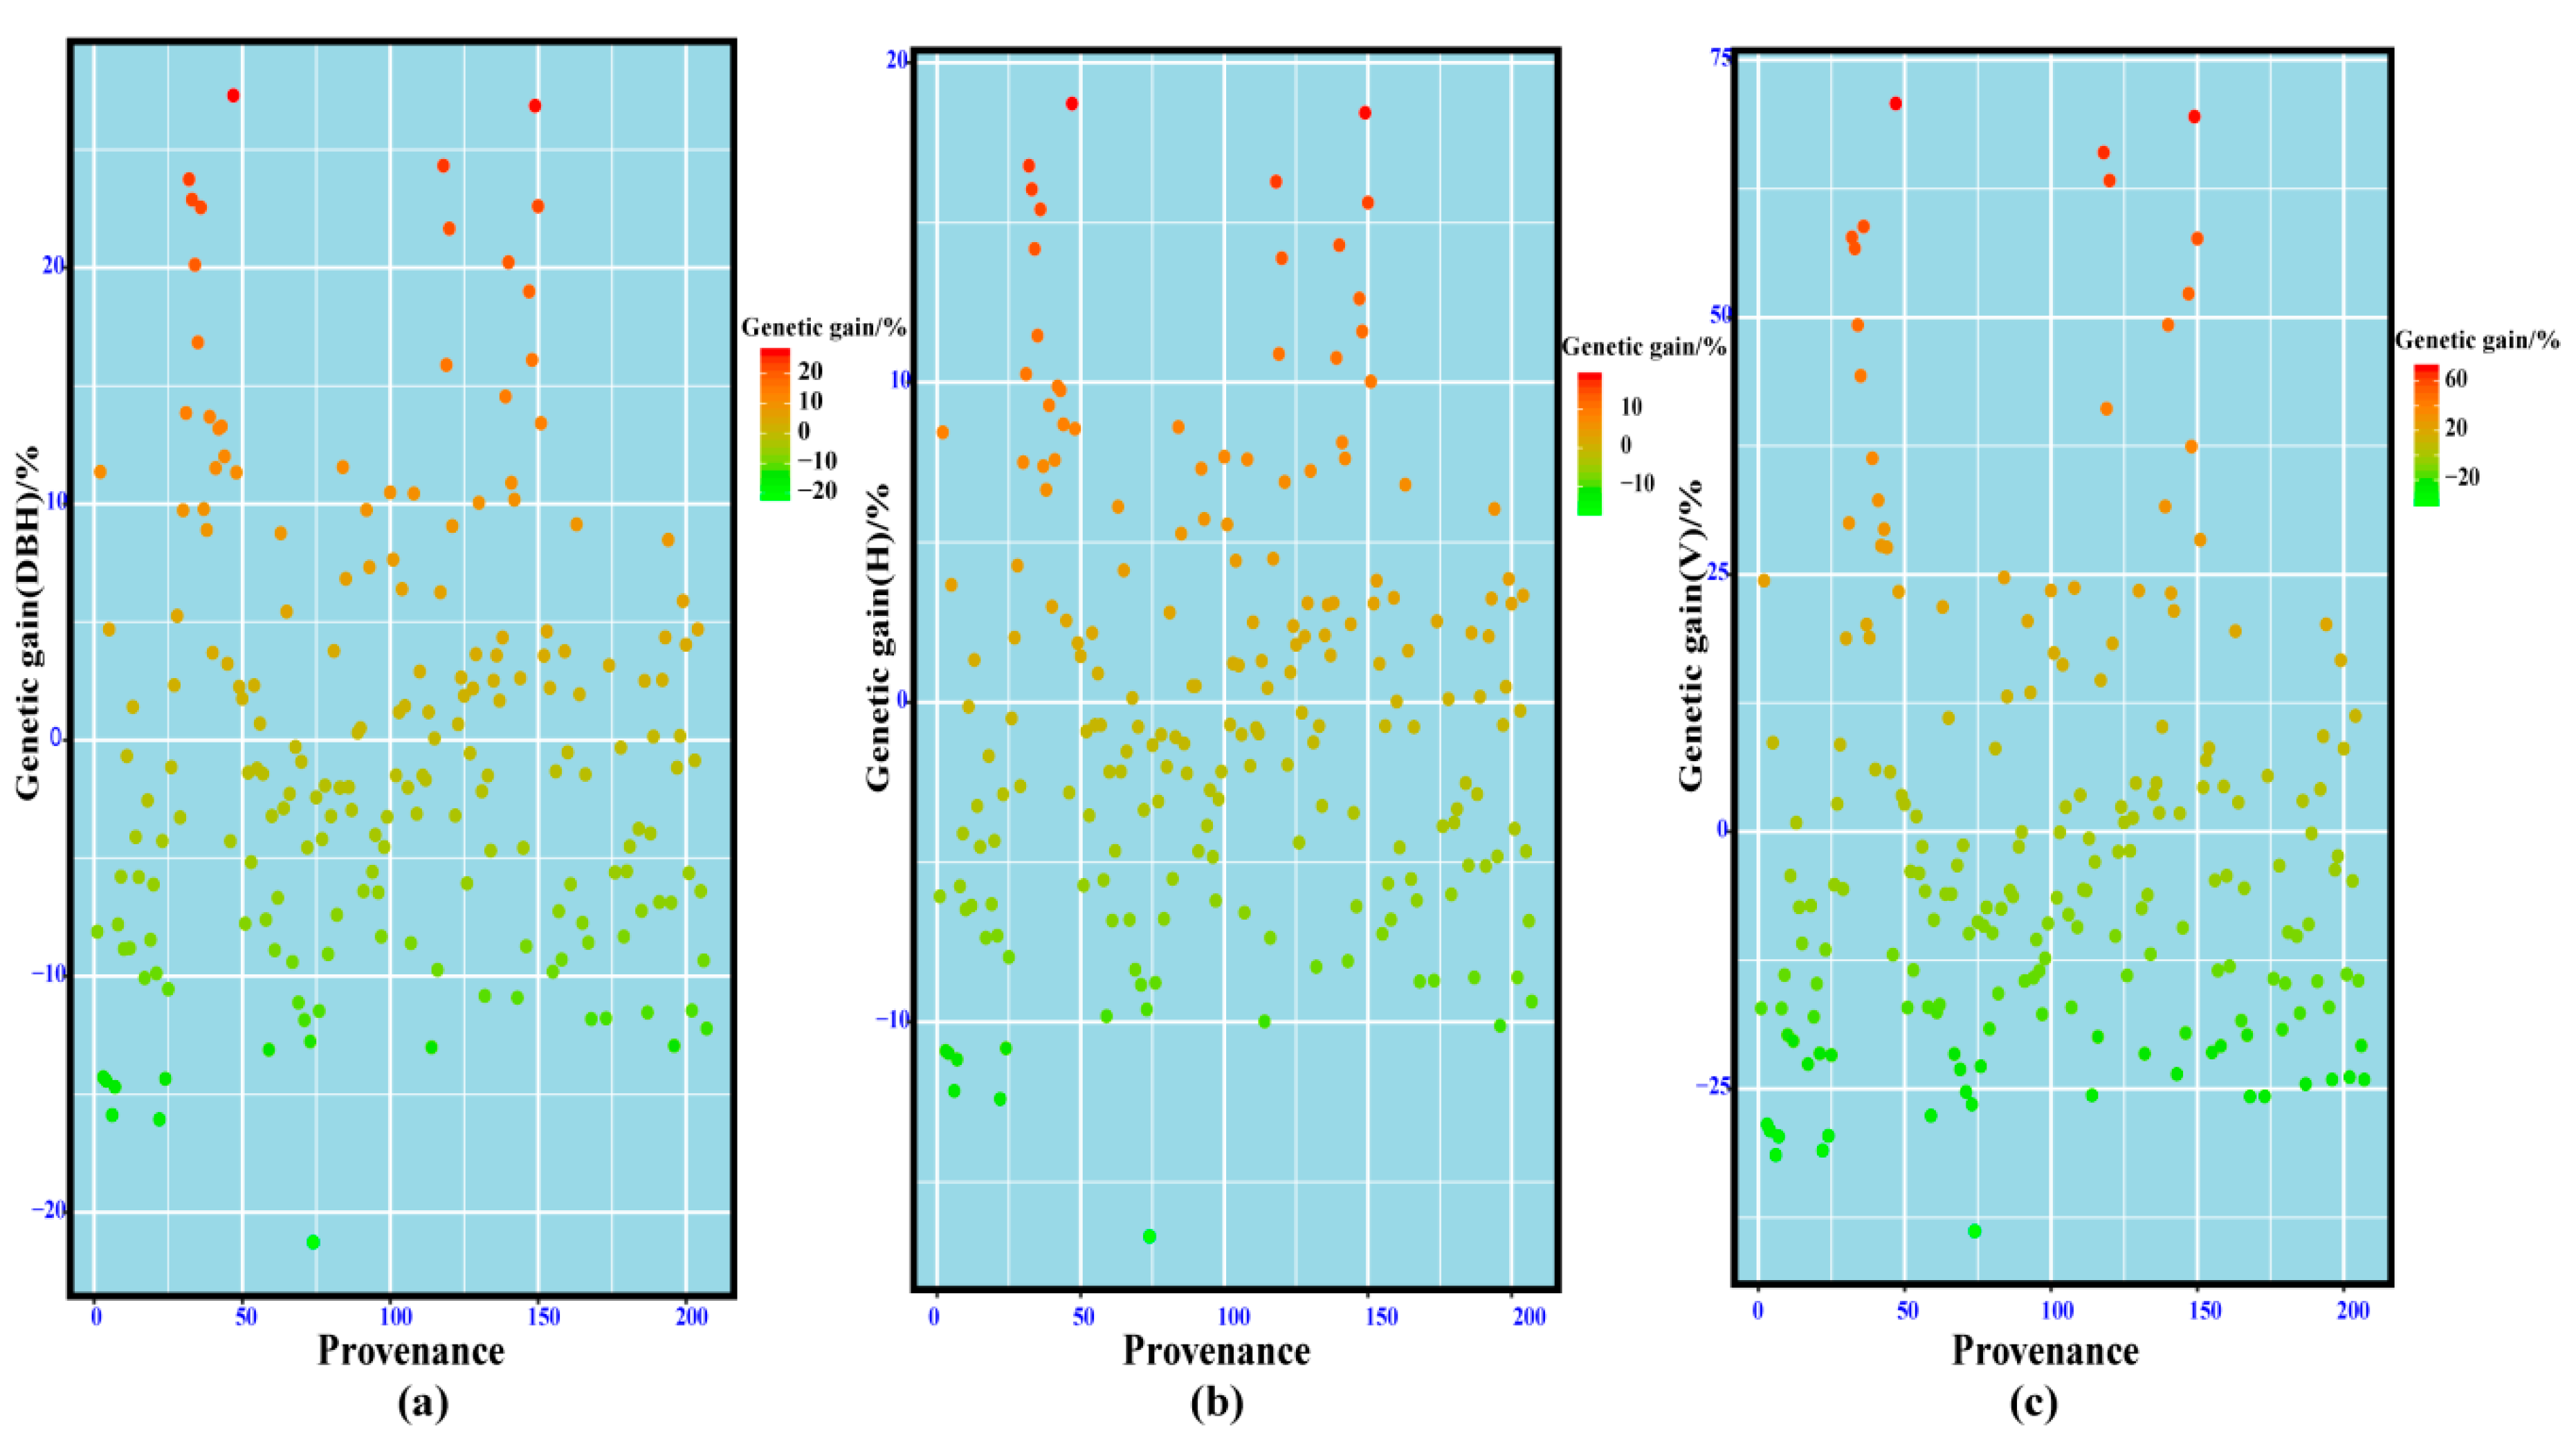
3.8. Genetic Gain Evaluation of Excellent Provenances of Chinese Fir

The average DBH, tree height, and tree volume of the Chinese fir from the 42 selected excellent provenances reached 24.04 cm, 15.31 m, and 0.31 m3, respectively. Compared with the control group, the growth traits of these Chinese firs were greater by different degrees: The average DBH was 15.70% larger, the average treeheight was 11.13% larger, and the average tree volume was 40.17% larger (Figure 5). It can be seen that the Chinese firs from these 42 provenances grow very well in Guangxi. Among them, trees from Chongan, Guangze, Jianyang, Shunchang, Shaxian, Sanjiang, Luocheng, Rongshui Baiyun, Congjiang, Liping, and Jinping have the greatest growth, and their genetic gains in DBH, tree height, and volume reached 18.99–27.30%, 12.62–18.72%, and 49.25–70.78%, respectively.

4. Discussion

4.1. Genetic Variation Analysis of Growth Traits of Chinese Firwith Different Provenances

In this study, the growth characteristics of 195 Chinese fir provenances across China at different forest ages were studied. It was found that there were significant differences in DBH, treeheight, andvolume among Chinese firs with different provenances of different forest ages. This is consistent with the findings of previous studies on the growth characteristics of Chinese fir with different provenances [25,26,27], indicating that there is great potential for the selection of Chinese fir provenances.
Studies ofthe estimation of genetic parameters of growth traits of conifer species have shown that the family heritability of DBH, tree height, and volume in P. taeda is between 0.50 and 0.89 [28], while the family heritability of the same three traits in Pinuselliottii Engelm. is about 0.78 [29]. In the present study, the heritability of DBH, tree height, and tree volume in Chinese fir is found to be between 0.54 and 0.81. With increasing forest age, the heritability of DBH, tree height and volumeincrease and gradually become stable. The heritability of tree height in loblolly pinehas also been found to follow a similar pattern [28].

4.2. Analysis of Geographical Variation Model of Chinese Fir Provenance

Some tree species have a wide natural distribution and great variation in geographical provenance. The productivity, survival rate [30], and resistance to diseases and insect pests of P. sylvestris are obviously different in different geographical areas [31,32]. Additionally, Androsiuk et al. [33] found that the coniferous morphology of P. sylvestris is different in different geographical regions, and such differencescan be used as markers of the geographic differentiation of its population. Amateis et al. [34] found that the accuracy of the regression equation can be greatly improved by taking longitude and latitude as prediction variables in the prediction of the dominant height and fault area of P. taeda forest. Variation patterns of the provenance of forest trees vary with the age of the study population and the number of traits. Therefore, the older the study population is and the more characteristics are studied, the more comprehensive and accurate geographical variation patterns of forest trees will be [35,36,37]. In the present work, the object used to study the geographical variation of forest trees wasa 33-year-old test forest of Chinese fir, which had reached maturity, and the results are, therefore, of high accuracy. The results of the model (p < 0.01) of the geographical variation of Chinese fir provenances show that the increase of the DBH and treeheight of Chinese fir with different provenances is a two-way gradual change model with small positive variation in the longitudinal direction (Figure 3). However, with increasing latitude, the DBH and tree heightfirst increase and then decrease, with a large variation. This two-way gradual change model has a strong correlationwith the water (i.e., precipitation and humidity) and temperature conditions in the trees’ provenance regions. In terms of temperature, rainfall, and altitude, it increases gradually from west to east. In the northern part of the distribution area, the average temperature and precipitation are relatively deficient.In the southern part of the distribution area, rainwater and light are abundant, but the altitude is low, accompanied by a strong wind.PCA analysis showed that there was a strong negative correlation between stand location and altitude, and a strong positive correlation between stand location and mean temperature in winter and precipitation in autumn and winter (Table 4). Trend surface analysis showed that provenances in the middle of the distribution area grew well, while provenances in the north of the distribution area grew poorly.Comparing the climatic conditions in the middle and northern regions, we can see that the mean temperature in the coldest season and the precipitation in autumn and winter in the middle region are obviously higher than those in the northern region, and these may be the limitation factors of regional growth differences without considering the genetic background.

4.3. Appropriate Forest Age for the Early Selection of Excellent Provenance Areas of Chinese Fir

Some studies have shown that the rotation period of Chinese fir plantations is 20–30 years [38]. Trees have long timber production cycles due to intrinsic and environmental factors. Existing research [39,40] has shown that the early selection of trees is an effective way to shorten the timber production cycle and increase theefficiency of genetic improvement. The primary problem of early selection is the selection time, which is also the area in which most extensive research has been carried out on early selection [41]. Wang et al. [42] and Jin et al. [43] found that the best forest age for the early selection of Pinusmassoniana Lamb. is about 10 years. Zhou et al. [44] evaluated the effect of the early selection of P. sylvestris wood properties and found that a forest age of eight years is the appropriate age to evaluate the wood’s elastic modulus. Lai et al. [45] estimated the early selection efficiency of L. kaempferi and found that the selection of the treeheight and DBH of its clone can be started from forest ages of two and five years, respectively, and considered that the selection of a double index of growth is more effective than the selection of a single index. The early selection of Chinese fir has also been reported in the relevant literature. According to the results of progeny determination by Ye et al. [46], the selection of Chinese fir at forest ages of six to seven years can increase the annual volume production. Additionally, Zhao [47] conducted a follow-up investigation of 107 Chinese fir clones in four experimental sites and found that the clones could be selected at an early stage. The primary selection age wasfive to six years after afforestation, and the selection age was eight to nine years after afforestation. Previous research mostly determined the timing of early selection based on young and middle-aged trees, without considering the actual selection effect and without the verification of early selection [48]. This presentstudyinvestigated Chinese fir with different provenances and different ages and found that the phenotypic correlation and genetic correlation of the DBH, treeheight, and volume of the tested Chinese fir with different provenances were highly significantly positively correlated among the forest ages, indicating that the early selection of Chinese fir provenances can be carried out after a forest age of five years. However, withincreasing forest age, the correlation coefficient has an upward trend, indicating that the correlation between the early and mature growth of Chinese fir is very low, and selection at this time has great disadvantages. In order to better determine the early selection age of Chinese fir, the category I and category II provenances of each forest age were selected through cluster analysis. By comparing the provenances selected at each forest age, it was found that early selection at an age of between 6 and 12 yearsresulted in a higher correctselection rate, a lower incorrect selection rate, and a lower missed selection rate, including 69–74% of the final selected provenances.Therefore, it is concluded that the early selection age of Chinese fir should be between 6 and 12 years with a selection intensity of 40%. This early selection method can provide a reference for tree species with long growth cycles.

4.4. Evaluation of the Effect of Excellent Provenances of Chinese Fir

Based on the growth of 33-year-old Chinese fir, 42 excellent provenance areas were selected. Compared with the trees with local provenances of Guangxi, the average genetic gains in DBH, tree height and volume were larger by 13.84%, 9.83%, and 33.26%, respectively. Among the 42 provenances, the Chinese fir from Fujian Chongan, Guangze, Jianyang, Shunchang, Sha County, Sanjiang, Luocheng, Rongshui Baiyun, Congjiang, Liping, and Jinping had the greatest growth. All of these provenances are locatedat the junction of Fujian Province with Hunan Province, Guizhou Province, andthe Guangxi Zhuang Autonomous Region. By comparing the climatic conditions of 42 provenances and Guangxi provenances, it is found that there are high climatic similarities between them, which indicate that these provenances are suitable for the promotion of afforestation in Guangxi and its surrounding areas. The provenances selected for the mature period of Chinese fir are partly different from those used in previous studies [15]. However, they include some of the same provenances, while some provenances from marginal production areas were not selected, such as those in Sichuan Province and the south of the central parts of Guangdong Province and Guangxi, which shows that, in these provenance areas, Chinese fir grows well in the middle and early growth stages, but has insufficient growth capacity in the later stages.
Additionally, this study also found that Chinese fir from Henan Province, Anhui Province, northwestern Zhejiang Province, Hubei Province, and northern Sichuan Province had the worst growth. Most of these provenances are located in the marginal production areas of Chinese fir. These areas have low temperatures in winter or low precipitation in autumn and winter. However, while there is a suitable temperature and sufficient precipitation throughout the year in the experimental site, the growth of Chinese fir in these areas is still poor. It can be seen that the cause of the growth difference was the genetic background factor, which is consistent with the results of Hong [15].

5. Conclusions

Taking the Chinese fir experiment as an example, the suitable planting population/provenance selection method based on simple basic growth and survival parameters was tested, after a long period of growth, the results have certain reference value. The difference in growth among Chinese fir with different provenances is highly significant. The geographical variation patterns of the growth traits of DBH and tree height were found to be two-way gradual changes, with smallvariations in the longitudinal direction and a trend of first increasing and then decreasing in the latitudinal direction, with a large variation. Studies of the early selection of Chinese fir with different provenances have shown that the selection effect is greatest when the trees are aged six to 12 years old, with the highest correct selection rate, the lowest incorrect selection rate, and the lowest missed selection rate, including 69–74% of the selected provenances. Forty-two excellent provenances selected from 33-year-old mature Chinese fir forests showeda larger increase in growth than the trees inthe local provenances, which are concentrated in the Wuyi and XuefengMountains and were found to be suitable for plantation in the Guangxi Zhuang Autonomous Region and surrounding areas.

Supplementary Materials

The following are available online at https://www.mdpi.com/1999-4907/10/10/876/s1, Table S1: Characteristics of the tested Chinese fir populations. The mean survival rates of 195 provenances were estimated at age of 33 years.

Author Contributions

Conceptualization, A.D. and J.Z.; Methodology, A.D. and H.W.; Software, A.D. and H.W.; Validation, A.D., H.W.; Formal Analysis, A.D. and H.W.; Investigation, A.D. and J.Z.; Resources, A.D. and J.Z.; Data Curation, A.D. and H.W.; Writing-Original Draft Preparation, H.W.; Writing-Review &Editing, H.W.; Visualization, H.W.; Supervision, A.D.; Project Administration, A.D.; Funding Acquisition, J.Z.

Funding

This work was supported by the National Natural Science Foundation of China (No.31570619; 1370629); the special science and technology innovation in Jiangxi Province (No. 201702).

Conflicts of Interest

The authors declare no conflict of interest.

References

  1. Zobel, B.; Talbert, J. Applied Forest Tree Improvement; John Wiley & Sons: New York, NY, USA, 1984; p. 496. [Google Scholar]
  2. Yu, Q.; Pulkkinen, P. Genotype–environment interaction and stability in growth of aspen hybrid clones. For. Ecol. Manag. 2003, 173, 25–35. [Google Scholar] [CrossRef]
  3. Larsen, C.P.S.; Macdonald, G.M. Relations between tree-ring widths, climate, and annual area burned in the boreal forest of Alberta. Can. J. For. Res. 1995, 25, 1746–1755. [Google Scholar] [CrossRef]
  4. Wang, Y.L.; Li, Y.; Chen, X.Y. Phenotypic diversity of natural populations in Picea crassifolia in Qilian Mountains. Sci. Silvae Sin. 2008, 44, 70–77. [Google Scholar]
  5. Nagamitsu, T.; Nagasaka, K.; Yoshimaru, H.; Tsumura, Y. Provenance tests for survival and growth of 50-year-old Japanese larch (Larix kaempferi) trees related to climatic conditions in central Japan. Tree Genet. Genomes 2014, 10, 87–99. [Google Scholar] [CrossRef]
  6. Libby, W.J. Domestication Strategies for Forest Trees. Can. J. For. Res. 1973, 3, 265–276. [Google Scholar] [CrossRef]
  7. Gwaze, D.P.; Bridgwater, F.E.; Byram, T.D.; Lowe, W.J. Genetic parameter estimates for growth and wood density in loblolly pine (Pinus taeda L.). Int. J. For. Genet. 2001, 8, 47–55. [Google Scholar]
  8. Lambeth, C.C.; Dill, L.A. Prediction models for juvenile-mature correlations for loblolly pine growth traits within, between and across sites. For. Genet. 2001, 8, 101–108. [Google Scholar]
  9. Mckeand, S.E. Optimum Age For Family Selection for Growth in Genetic Tests of Loblolly Pine. For. Sci. 1988, 34, 400–411. [Google Scholar]
  10. Jansson, G.; Li, B.; Hannrup, B. Time Trends in Genetic Parameters for Height and Optimal Age for Parental Selection in Scots Pine. For. Sci. 2003, 49, 696–705. [Google Scholar]
  11. Sheng, W.T. Plantation Forest and Their Silviculture Systems in China; China Forestry Press: Beijing, China, 2014; pp. 2–6. [Google Scholar]
  12. SFA. Reports of Chinese Forestry Resource: The 8th National Forest Resource Inventory; Chinese Forestry Publishing House: Beijing, China, 2013; p. 16. [Google Scholar]
  13. Yu, X.T.; Chen, C.D.; He, Z.Y.; Ye, Z.C.; Cheng, S.X. Growth and wood properties of Cunninghamia lanceolata provenance forest (23 years). J. Fujian Coll. For. 1984, 4, 1–8. [Google Scholar]
  14. Ye, Z.H.; Shi, J.S.; Wen, Y.Z.; Li, S.M.; Yu, R.Z.; Chen, R.X. Geographic variation and inheritance, correlation and selection of traits of provenances of Cunninghamia lanceolata. J. Nanjing For. Univ. 1991, 15, 7–10. [Google Scholar]
  15. Hong, J.S. Excellent provenance selection of Cunninghamia lanceolata afforestation. For. Res. 1994, 7, 1–25. [Google Scholar]
  16. Ulbrichová, I.; Podrázský, V.; Beran, F.; Zahradník, D.; Fulin, M.; Procházka, J.; Kubeček, J. Picea abies provenance test in the Czech Republic after 36 years—Central European provenances. J. For. Sci. 2015, 61, 465–477. [Google Scholar] [CrossRef]
  17. Soil Systematic Classification Research Group, Nanjing Institute of Soil Science, Chinese Academy of Sciences, Cooperative Group on Soil Systematic Classification Research in China. Soil Systematic Classification Retrieval of China, 3rd ed.; Press of China University of Science and Technology: Hefei, China, 2001; pp. 111–113. [Google Scholar]
  18. Fick, S.E.; Hijmans, R.J. WorldClim 2: New 1-km spatial resolution climate surfaces for global land areas. Int. J. Climatol. 2017, 37, 4302–4315. [Google Scholar] [CrossRef]
  19. Hijmans, R.J.; Guarino, L.; Gruz, M.; Rojas, E. Computer tools for spatial analysis of plant genetic resources data(1): DIVA-GIS. Plant Genet. Resour. Newsl. 2001, 127, 15–19. [Google Scholar]
  20. Hammer, Ø.; Harper, D.A.T.; Ryan, P.D. PAST: Paleontological statistics software package for education and data analysis. Paleontol. Electron. 2001, 4, 1–9. [Google Scholar]
  21. Klisz, M.; Ukalski, K.; Ukalska, J.; Jastrzębowski, S.; Puchałka, R.; Przybylski, P.; Mionskowski, M.; Matras, J. What Can We Learn from an Early Test on the Adaptation of Silver Fir Populations to Marginal Environments? Forests 2018, 9, 441. [Google Scholar] [CrossRef]
  22. Klisz, M.; Ukalska, J.; Koprowski, M.; Tereba, A.; Puchałka, R.; Przybylski, P.; Jastrzębowski, S.; Nabais, C. Effect of provenance and climate on intra-annual density fluctuations of Norway spruce Picea abies (L.) Karst. in Poland. Agric. For. Meteorol. 2019, 269, 145–156. [Google Scholar] [CrossRef]
  23. Wang, H.F. Introduction to Econometric Geography; Shandong Education Press: Jinan, China, 2001; pp. 90–92. [Google Scholar]
  24. Tang, Q.Y.; Feng, M.G. DPS Data Processing System; Science Press: Beijing, China, 2007; pp. 661–665. [Google Scholar]
  25. Xia, G.Q.; Wu, Y.C. Multicharacter selection plus Provenances of Cunninghamia lanceolata. J. Zhejiang For. Sci. Technol. 1999, 19, 1–5. [Google Scholar]
  26. Zhou, C.; Zeng, Z.G. Comparison research on growth characteristics of Cunninghamia lanceolata provenance’s young stage and maturity stage. Jiangxi For. Sci. Technol. 2006, 3, 10–12. [Google Scholar]
  27. Fan, L.; Jiang, B.; Shen, A.H.; Hong, C.D.; Xu, J.L.; Wu, Y.C.; Xu, G.C. Multi-traits selection of plus provenances of fast-growing Cunninghamia lanceolata. J. Zhejiang For. Sci. Technol. 2010, 30, 24–32. [Google Scholar]
  28. Xiang, B.; Li, B.; Isik, F. TimeTrend of Genetic Parameters in Growth Traits of Pinus taeda L. Silvae Genet. 2003, 52, 114–121. [Google Scholar]
  29. Wu, J.Y.; Cheng, Y.; Chen, J.F.; Xie, H.M.; Liao, D.Z.; Li, H.J.; Wei, Z.H.; Wu, Z. Heritability Analysis of Growth Traits and Selection of Semi-sib Families of Pinus elliottii. Agric. Biotechnol. 2018, 7, 160–162. [Google Scholar]
  30. Barzdajn, W. Results of a 24-year provenance trial with Scots pine in the Suprasl Forest District. Sylwan 2008, 152, 21–29. [Google Scholar]
  31. Rzeźnik, Z. Scots pine (Pinus sylvestris L.) of European provenances in the Suprasl forest inspectorate. Rocz. Akad. Rol. W Pozn. Rozpr. Nauk. 1991, 219, 56–67. [Google Scholar]
  32. Stephan, B.R.; Liesbach, M. Results of the IUFRO 1982 Scots pine (Pinus sylvestris L.) provenance experiment in southwestern Germany. Silvae Genet. 1996, 45, 342–349. [Google Scholar]
  33. Androsiuk, P.; Kaczmarek, Z.; Urbaniak, L. The morphological traits of needles as markers of geographical differentiation in European Pinus sylvestris populations. Dendrobiology 2011, 65, 3–16. [Google Scholar]
  34. Amateis, R.L.; Prisley, S.P.; Burkhart, H.E.; Liu, J.P. The effect of physiographic region and geographic locale on predicting the dominant height and basal area of loblolly pine plantations. South. J. Appl. For. 2006, 30, 147–153. [Google Scholar] [CrossRef]
  35. Shen, X.H. Selection and Breeding of Pinus Tabulaeformis and Larix Principis-Rupprechtii: Practice and Theory; Science Press: Beijing, China, 2015. [Google Scholar]
  36. Fang, S.; Xu, X.; Lu, S.; Tang, L. Growth dynamics and biomass production in short-rotation poplar plantations: 6-year results for three clones at four spacings. Biomass Bioenerg. 1999, 17, 415–425. [Google Scholar] [CrossRef]
  37. Caliński, T.; Czajka, S.; Kaczmarek, Z.; Krajewski, P.; Pilarczyk, W. A mixed model analysis of variance for multi-environment variety trials. Stat. Pap. 2009, 50, 735–759. [Google Scholar] [CrossRef]
  38. Sheng, W.T.; Hui, G.Y.; Zhang, S.G. Optimum Cultivation Pattern of Chinese Fir Plantation; China Science and Technology Publishing House: Beijing, China, 2004; pp. 93–98. [Google Scholar]
  39. Ma, C.G. Research status of accelerated tree breeding of the world. World For. Res. 1996, 9, 15–23. [Google Scholar]
  40. Yang, X.Y.; Ji, K.S. Early selection in forest tree improvement. World For. Res. 2004, 17, 6–8. [Google Scholar]
  41. He, H.; Dai, H. Research on theories and methods of early selection of forest tree. Rural Econ. Sci. Technol. 2012, 23, 33–36. [Google Scholar]
  42. Wang, Z.R.; Chen, T.H.; Zhou, Z.C.; Zheng, J.J.; Wang, Y.L. Early-late correlation and early selection of the growth traits of Pinus massoniana Lamb. in Huaan county, Fujian province. J. Nanjing For. Univ. 1987, 11, 41–47. [Google Scholar]
  43. Jin, G.Q.; Qin, G.F.; Liu, W.H.; Chu, D.Y.; Feng, Z.P.; Zhou, Z.C. Provenance selection effect at different stand age of Pinus massoniana. Sci. Silvae Sin. 2011, 47, 39–45. [Google Scholar]
  44. Zhou, H.; Fries, A.; Wu, H.X. Age trend of heritability, genetic correlation and efficiency of early selection for wood quality traits in Scots pine. Can. J. For. Res. 2015, 45, 817–825. [Google Scholar]
  45. Lai, M.; Sun, X.; Chen, D.; Xie, Y.; Zhang, S. Age-related trends in genetic parameters for Larix kaempferiand their implications for early selection. Bmc Genet. 2014, 15 (Suppl. S1), S10. [Google Scholar] [CrossRef]
  46. Ye, P.Z.; Chen, Y.W.; Ruan, Y.C.; Chen, S.B.; Liu, D.L.; Guo, M.C. Study on early selection of Cunninghamia lanceolata. J. Nanjing For. Univ. 1981, 5, 106–116. [Google Scholar]
  47. Zhao, C.K. A study on optimum age and gain for early selection of superior clone in Cunninghamia lanceolata. Sci. Silvae Sin. 2002, 38, 53–60. [Google Scholar]
  48. Cotterill, P.P.; Dean, C.A. Changes in the genetic control of growth of radiata pine to 16 years and efficiencies of early selection. Silvae Genet. 1987, 37, 138–146. [Google Scholar]
Figure 1. Climatic diagrams for experimental sites. The subfigure (a) shows the change trend of the mean annual minimum temperature, the mean annual maximum temperature and the mean annual temperature at the study site. The subfigure (b) shows the trend of the mean annual precipitation and mean annual relative humidity.
Forests 10 00876 g001
Figure 2. Sample information of the 195 Chinese fir (Cunninghamialanceolata) provenances used in this study. Experimental site (square), provenances (dots). The range of the natural distribution of Chinese fir is shown in blue.
Forests 10 00876 g002
Figure 3. Diagram of two power contour-trend surfaces of DBH (a) and H (b) for Chinese fir. The surface represents the geographical variation of DBH and H, and the lines on the surface represent contours.
Forests 10 00876 g003
Figure 4. Distribution of excellent provenances of Chinese fir at different forest ages. The subfigure (ae)shows the distribution of optimal and suboptimal provenances in 1984, 1985, 1987, 1991 and 2012, respectively. The red dots represent the optimal provenances (category I) and the blue triangle represents the suboptimal provenances (category II) selected in different forest ages.
Forests 10 00876 g004
Figure 5. Evaluation of the selection of excellent provenancesfor Chinese fir. The subfigure (ac), shows the geneticgain of DBH, tree height and volume, respectively. The horizontal axis represents the provenance number and the vertical axis represents the geneticgain of trait.
Forests 10 00876 g005
Table 1. Variance analysis of the growth traits of Chinese fir with differentprovenancesat different ages. ** represents significant at level < 0.01. DBH: diameter at breast hight.
Forests Age (Years)Source of VariationDFDBH/cmHeight/mVolume/m3
Mean SquareF ValueMean SquareF ValueMean SquareF Value
5Provenance1943.60 2.34 **0.97 2.23 **1.93 × 10−52.16 **
Block4316.57 205.63 **68.19 156.08 **1.72 × 10−3192.88 **
Experimental error7761.54 0.44 8.93 × 10⁻⁶
6Provenance1948.04 4.05 **2.35 4.04 **1.15 × 10−44.40 **
Block9227.48 114.65 **65.22 111.98 **2.62 × 10−3100.07 **
Experimental error17461.98 0.58 2.67 × 10⁻⁵
8Provenance19411.86 4.68 **4.12 4.54 **5.35 × 10−44.88 **
Block9163.74 64.57 **72.62 80.08 **7.29 × 10−366.53 **
Experimental error17462.54 0.91 1.10 × 10⁻⁴
12Provenance19411.16 5.15 **4.49 3.90 **1.03 × 10−34.97 **
Block934.75 16.03 **51.82 45.03 **4.01 × 10−319.42 **
Experimental error17462.17 1.15 2.07 × 10⁻⁴
33Provenance19447.61 4.08 **11.12 4.00 **3.11 × 10−24.61 **
Block6119.63 10.26 **27.23 9.79 **8.15 × 10−210.66 **
Experimental error116411.66 2.78 7.65 × 10⁻³
Table 2. Parameters of the growth variation of Chinese fir obtained from theprovenance test for different forest ages.
Forest Age (Years)TraitMin.Max.MeanStandard Deviation (SD)Coefficient of Variation (CV)/%Heritability
5DBH (cm)0.89.74.491.838.950.57
Height (m)0.765.83.380.925.670.55
Volume(m3)9.24 × 10−50.0224.94 × 10−34.20 × 10−381.950.54
6DBH (cm)112.86.691.9128.550.75
Height (m)17.654.471.0323.060.75
Volume (m3)2.10 × 10−40.0430.0126.86 × 10−359.650.77
8DBH (cm)1.515.19.342.0521.980.79
Height (m)1.510.86.421.2519.520.78
Volume (m3)3.94 × 10−40.0860.0280.013647.990.80
12DBH (cm)2.81710.931.9317.670.81
Height (m)3178.341.3416.080.74
Volume (m3)2.70 × 10−30.1260.0450.01840.560.80
33DBH (cm)7.240.720.085.426.910.76
Height (m)6.0721.3713.352.6219.630.75
Volume (m3)0.0150.9690.2310.10244.120.75
Table 3. Regression equations of the binary quadratic trend surface analysis fortreeheight and DBH.
TraitRegression Equation of Trend Surface AnalysisFitting Coefficientp Value
DBH (cm)Z = 1.804x + 8.484y − 0.003x2 − 0.076y2 − 0.041xy − 194.2210.175<0.01
Height (m)Z = 0.905x + 4.151y − 0.001x2 − 0.037y2 − 0.021xy − 92.5920.182<0.01
Table 4. Pearson correlation coefficients between climatic variables and the first four principal components, eigenvalues, and explained variance.
Bioclimatic VariablesAbbreviationPC1PC2PC3PC4
AltitudeAlt−0.770.420.350.12
Annual mean temperaturebio10.840.39−0.360.08
Mean diurnal range (mean of monthly temperatures (max temp-min temp))bio2−0.020.000.250.81
Isothermality (BIO2/BIO7) (* 100)bio30.010.830.120.52
Temperature seasonality (standard deviation * 100)bio4−0.05−0.960.03−0.16
Max temperature of warmest monthbio50.77−0.44−0.340.01
Min temperature of coldest monthbio60.620.67−0.35−0.03
Temperature annual range (BIO5-BIO6)bio7−0.04−0.940.090.04
Mean temperature of wettest quarterbio80.260.37−0.61−0.24
Mean temperature of driest quarterbio90.790.48−0.180.13
Mean temperature of warmest quarterbio100.84−0.30−0.38−0.05
Mean temperature of coldest quarterbio110.650.69−0.280.12
Annual precipitationbio120.820.030.52−0.08
Precipitation of wettest monthbio130.590.340.63−0.23
Precipitation of driest monthbio140.75−0.520.260.09
Precipitation seasonality (coefficient of variation)bio15−0.440.730.15−0.16
Precipitation of wettest quarterbio160.620.360.64−0.16
Precipitation of driest quarterbio170.75−0.530.280.10
Precipitation of warmest quarterbio180.200.690.45−0.37
Precipitation of coldest quarterbio190.82−0.390.290.15
Eigenvalue 7.56 6.33 2.74 1.36
Variance explained (%) 37.78 31.66 13.68 6.78
Table 5. Correlation coefficients of the main tree growth traits for different forest ages. For each trait, data to the right of the “1” are phenotypic correlation coefficients of the trait, and data to the left of the “1” aregenetic correlation coefficientsof the trait. ** represents significant correlation at level < 0.01.
TraitForest Age5681233
DBH510.815 **0.776 **0.700 **0.323 **
60.836 **10.939 **0.881 **0.516 **
80.802 **0.941 **10.922 **0.557 **
120.76 **0.898 **0.935 **10.601 **
330.426 **0.591 **0.621 **0.672 **1
Height510.826 **0.797 **0.740 **0.342 **
60.852 **10.952 **0.876 **0.464 **
80.811 **0.934 **10.901 **0.529 **
120.771 **0.895 **0.894 **10.508 **
330.392 **0.516 **0.551 **0.543 **1
Volume510.803 **0.771 **0.707 **0.334 **
60.831 **10.954 **0.902 **0.511 **
80.816 **0.946 **10.939 **0.565 **
120.725 **0.731 **0.76 **10.592 **
330.395 **0.536 **0.582 **0.602 **1
Table 6. Selection risk of the Chinese fir provenance test for different forest ages.
ClusterForest AgeNumber of SelectionsNumber of Correct SelectionsCorrect Selection Rate (%)Number of Incorrect SelectionsIncorrect Selection Rate (%)Number of Missed SelectionsMissed Selection Rate (%)
5201519951090.91
627622.222177.78545.45
8257281872436.36
1223730.431669.57436.36
3311111000000
Ⅰ+Ⅱ5732432.884967.121945.24
6773038.964761.041330.95
8793139.244860.761228.57
12772937.664862.341433.33
3342421000000

