GIS-Based Urban Afforestation Spatial Patterns and a Strategy for PM2.5 Removal

1
School of Architecture and Urban Planning, Huazhong University of Science and Technology, Wuhan 430000, China
2
Centre for Urban and Rural Planning Support Research, Huazhong University of Science and Technology, Wuhan 430000, China
3
School of Environmental Science & Engineering, Huazhong University of Science and Technology, Wuhan 430000, China
4
Wuhan Planning & Research and Exhibition Center, Wuhan 430000, China
*
Author to whom correspondence should be addressed.
Forests 2019, 10(10), 875; https://doi.org/10.3390/f10100875
Submission received: 24 July 2019
/
Revised: 24 September 2019
/
Accepted: 25 September 2019
/
Published: 5 October 2019
(This article belongs to the Section Forest Inventory, Modeling and Remote Sensing)
Abstract
:Within the scope of ecological development planning in China, afforestation is highly valued. However, the scientific planning of afforestation still has inadequacies. There are few studies on the spatial distribution of urban forests targeted at air quality improvement. Here, we implemented a virtual experiment to evaluate whether different tree planting distribution plans with the same afforestation scale would have a significant effect on fine particulate matter (PM2.5) removal. As a case study of Wuhan, this paper identified the statistical regularity between PM2.5 concentration and adsorption of representative trees through field sampling and measurement, simulated the influence of different afforestation plans on PM2.5 concentration based on Geographic Information System (GIS), judged the significance of the difference of the plans, and proposed a greening distribution strategy. The results show that different forest layouts had no significant impact on PM2.5 in the administrative region, and the concentration reduction rate was only 1–2%. Targeted planting of trees in heavily polluted areas in the city center would have achieved better air quality improvement, with a reduction rate of 3–5%. In Wuhan construction areas, trees should be planted to increase the forest coverage rate to 30%. The edge of the urban metropolitan development zone needs to be strengthened with trees to form a forest belt 10 km–20 km wide, with a forest coverage rate of at least 60%. In general, the capability of trees to reduce PM2.5 concentration is weak. The fundamental way to improve air quality is to reduce emissions; planting trees is only an auxiliary measure. More ecological forest functions should be considered in city-wide afforestation distribution.

1. Introduction
The concentration of populations in large cities and intensive human production activities have introduced heavy air pollution—characterized by particulate matter (PM) and other ecological problems—in the process of China’s rapid urbanization [1,2,3]. PM, including inhalable particulate matter (PM10) and fine particulate matter (PM2.5), is harmful to human health [4]. In particular, PM2.5 has a greater negative impact on human health. PM2.5 can float in the atmosphere for a long time and spread on a large scale via atmospheric circulation [5]. Moreover, the large specific surface area of PM2.5 can easily adsorb heavy metals and toxic organic compounds, enter the human respiratory system, penetrate the alveoli via blood, and subsequently cause various illnesses, such as cardiovascular disease, respiratory disease, lung cancer, or other diseases [6,7]. For every 10 μg m−3 increase in PM2.5, the death rate from cardiovascular disease and lung cancer increases by 6–8% [8]. Afforestation can play an important role in mitigation of PM pollution [9,10,11], in addition to reducing emissions at the source [12,13]. Improving air quality is one of the most important ecological service functions of urban forests. In particular, large areas of high-quality evergreen vegetation have good adsorption and blocking effects on PM, which can directly alleviate PM pollution [14,15,16,17].
As a metropolis in central China, Wuhan faces problems related to population growth and urban development, including air pollution and low forest coverage [18]. As of the end of 2018, annual PM2.5 concentration was 49 μg m−3, and 30% of the days of the year were still not up to the air quality standard. (Correspondingly, annual PM10 concentration was 73 μg m−3, approaching the national Ambient Air Quality Standard grade II, i.e., 70 μg m−3 [19].) For susceptible groups such as children, the outpatient consultation rate reaches the highest value after 5 days of heavy pollution in autumn or winter, and the total consultation rate for children’s respiratory diseases can increase by 1.8% to 6.6% [20]. In recent years, the municipal government has vigorously promoted afforestation and invested 2 billion CNY in afforestation every year to extensively carry out planting activities and construction projects [21]. However, after communicating with the staff of Wuhan Garden and Forestry Bureau, we found that the afforestation process was somewhat lacking in scientific planning. Tree planting is usually done according to second-type forest inventory (In China the second-type investigation of forest inventory is relative to the first- and third-type. It refers to the investigation to find out the types, distribution, quantity, and quality of forests, trees, and woodlands; and to objectively reflect the status of regional forest management in a forest management unit or administrative region.) and annual dynamic sampling of forest cover (The dynamic sampling is an investigation performed by the local government in order to realize the annual assessment of forest resources. It is based on “one map of a forest” and calculates forest coverage rates by combining satellite images, the data for the forestry operation, and field surveys. The dynamic monitoring only calculates the areas of arbor and bamboo forests with canopy densities above 0.2 and the shrub areas specified by the country, but does not include farmland tree cover or other scattered forests.), combined with the workload set by the higher authorities. Regarding the limited land space available, and the goal of maximizing the ecological service function of trees to improve air quality, there is a lack of comprehensive analysis on how many trees to plant and where to plant them. Such problems are prevalent throughout China [22,23].
Research on urban forest spatial distribution focuses on landscape management and urban planning [24,25,26]. Developed countries have a long history of thinking about green space layout. The ideal of a “garden city” has been an important part of city construction, but early green space distribution planning was often subjective [27]. Contemporary scholars generally discussed the layouts of urban forests and green spaces from different perspectives of functional requirements: (1) Considering the relationship between social factors and green spaces, the accessibility and equity of urban green space to the population are frequently studied [28,29]. Fan et al. [30] used Cook County, Illinois, United States, as an example and found that land use and socio-economic factors were more correlated with canopy coverage and stem density than species diversity. (2) From the perspective of ecological safety and environmental protection, Chen [31] studied the disaster avoidance green space in the central urban area of Shenyang, China. Escobedo and Nowak [32] discussed the heterogeneity of urban forests in removing air pollutants as a case study of the city of Santiago, Chile. Chen et al. [33] analyzed the influences of various green space patterns on PM2.5 in five Chinese cities. For example, increasing the main green space area, the connection between green spaces, and the length of green spaces can effectively reduce PM2.5 concentration. (3) Some researchers considered comprehensive factors, including natural and social factors. Elements such as rain flood management, social vulnerability, green space openings, air quality, heat island relief, and landscape connectivity were used for comprehensive and coordinated planning of green space facilities, and to obtain a green space plan that was conducive to multi-functional services [34,35].
These studies provide various references for urban green space distribution. As many cities are facing serious air pollution, it is an urgent priority to develop a scientific plan for afforestation to reduce PM. Rules for urban afforestation correlated with PM2.5 removal have been proposed [14,17,33,36]. However, there is still scarce research on urban or regional green space planning or optimization measures to reduce PM2.5. As a case study of Wuhan city, we assume that the urban forest coverage rate should reach 30%, and ask whether different tree planting spatial plans would have a significant effect on PM2.5 concentration mitigation. If so, how much can results be improved using the optimized plan for reducing PM2.5? If not, is it necessary to plan the optimal layout of new forests? What are the probable forest planting strategies? In this study, the regularity between leaf PM2.5 adsorption and the related concentration will be identified through sampling and measuring. Then, different afforestation plans will be proposed, and the effect of the planting plans on PM2.5 concentration will be analyzed to explore the above problems, based on Geographic Information System(GIS) analysis. Finally, the optimized distribution strategy for new forests will be explored.
2. Materials and Methods
2.1. Study Area and Data
Wuhan, the capital of Hubei province, is located in central China, where the Yangtze river meets the Han river. The city has a total administrative area of 8569 km2 (Figure 1), a metropolitan development area of 3261 km2, and had a population of 11.08 million as of 2018 [19]. It has a prominent strategic position in China. Building a healthy, green, livable city is the long-term goal for Wuhan’s future development [37].
Some key data for the study needed to be collected, including: Wuhan Landsat 8 remote-sensing images, PM2.5 concentration data in 2016 from ground monitoring stations, PM2.5 concentration distribution data over 12 months in 2016 (1 km × 1 km grid), 1-year statistical height data for atmospheric mixing layers, Wuhan forestry and gardening reports, and green space planning and projects lists.
Data show that the forest coverage rate in Wuhan is low (including artificial and natural forests), with poor forest quality and scattered spatial distribution. According to the remote sensing images from 2016, the forest coverage rate was 22.98% (1970 km2), which is very close to the data showing 22.88%, reported in the 4th second-type forest inventory. Regarding the target of 30% (2570 km2) forest coverage, an additional 600 km2 of forest will be added to urban administrative area. The days of heavy PM2.5 pollution in Wuhan are usually concentrated in autumn and winter, thus, effective distribution of the new forest to reduce PM2.5 is a concern for urban development.
2.2. Leaf Sample Collection
Leaf sample collection was aimed at analyzing the relationship between PM2.5 concentration and adsorption on leaves per time unit, which is the key to support the subsequent simulation of impact on PM2.5 of forest spatial distribution.
In general, evergreen leaves have greater PM adsorption than fallen leaves [17,38]. According to a survey of plant diversity in Wuhan city [39], two kinds of evergreen broad-leaved trees (Cinnamomum Camphor (L.) Presl and Magnolia Grandiflora L.), being the most popular trees and the easiest to collect, were selected as the research subjects. Elements such as weather, location, time, duration, and tree type were considered in sample collection.
(1) Location and time of sampling. We chose non-street trees in Huazhong University of Science and Technology (Figure 1). The trees were chosen far away from the influence of road dust to better reflect the PM2.5 adsorption ability of leaves from the overall pollution background during a period of 20 days, 11–30 May 2019.
(2) Leaf quantity collection. About 20 Cinnamomum Camphor leaves (2–3 branchlets) were collected each time, and groups of 10 leaves were taken as one sample, for a total of 2 samples. Four leaves of Magnolia Grandiflora were collected, and groups of 2 leaves were taken as a sample, for a total of 2 samples. The leaves were gently placed in a plastic bag for storage. The amount of leaves met the requirements of the experiment.
(3) Measurement of leaves’ floated PM. The PM was observed to be floated PM and deposited PM on the leaves. Floated PM refers to the PM that has been recently attached to the leaf surface and is easy to wash off with water. In contrast, the deposited PM has been attached to the leaf surface for a long time and cannot be easily washed away.As deposition is a time-related and complex process, it was hard to know how long the deposited particles had been attached, but we tried to analyze the duration of the floated PM.
The floated PM was filtered with filter paper during gentle washing of the PM on the leaves. Then, the filter paper was dried and weighed with electronic analysis balance (precision 0.1 mg). The weight difference between the filter paper after drying (W1 is the weight of filter paper and PM) and filter paper before filtering (W0 is the filter paper only weight) is the PM adsorption (W1–W0).
2.3. Analysis between PM2.5 Concentration and Adsorption by Leaves
PM2.5 adsorption was estimated at half of the measurement of floated PM [40,41]. Thus, analysis between PM2.5 concentration and its adsorption was conducted accordingly.
(1) Correlation between PM2.5 concentration for different durations and leaf PM2.5 adsorption. The higher the concentration, the higher the PM2.5 adsorption on the leaves [42,43]. However, the retention period was vague [44]. Therefore, we analyzed the correlation between hourly, daily, 2-day, and 3-day background concentration of PM2.5 and the PM2.5 adsorption to identify how long the floated PM on the leaf remained.
(2) Estimation of the amount of PM2.5 adsorbed by green leaves per area unit. Equation (1) was adopted to estimate the PM2.5 adsorption by trees’ hourly per area unit. The reason why the hourly PM retention was determined is that the concentration value was measured once per hour, and the daily or the yearly value is the 24-h or 365-day average value, which is a mean instantaneous value. Thus, the retention, no matter if it is a day or a few days, is a cumulative amount, and the two factors (concentration and adsorption) should scale corresponding to time duration.
where W is PM2.5 adsorption by sample leaves (g), M is the amount of PM2.5 adsorption per area unit (g m2 h−1), H is the effective height of tree leaf quantity (m), n is a multiple of sample leaf quantity per cubic meter (1 m−3), and D is the duration of PM retention by sample (h).
(3) Statistic regularity between PM2.5 concentration and adsorption. With PM2.5 concentration as the independent variable (X) and the corresponding adsorption per area unit of green leaves as the dependent variable (Y), the scattered diagram of “concentration–adsorption” was drawn (Equation (2)). Then, we calculated the regression coefficient to establish the equation and test the regression equation.
The expected result in this part is that the PM2.5 adsorption should decrease with the decrease of background PM2.5 concentration, and the fitted regression curve should reflect the statistical feature. If an apparent exception appears, possible problems in sample processing should be examined and data with significant differences should be excluded.
2.4. Tree Planting Range
The urban forest coverage rate refers to the ratio of forest coverage area to urban administrative area. Forest coverage area includes arbor and bamboo forest areas with canopy densities of 0.2 or above (Canopy density is defined as the proportion of the forest floor covered by the vertical projection of the tree crowns. It is a major factor in evaluation of forest status and is an important indicator of possible management interventions.), shrub forest areas specified by the country, farmland, forest network, and the forest cover of the trees on the edges of villages, roadsides, waterways, and houses. As such, forest areas are distributed on all kinds of land, except water. At present, the forest coverage rate in Wuhan is 22.98%, or 1970 km2. To reach the desired rate of 30%, 600 km2 of forests should be added. According to the current land use classification (GB/T 21010-2017) [45], the afforestation area for trees (including the potential plantable area) includes all kinds of land, except rivers, lakes, pit surfaces, ditches, reservoirs, and existing forest areas.
2.5. Tree Planting Plans
Firstly, the current forest cover status was mapped using satellite remote sensing images in a 1 km × 1 km grid display. Then, we proposed (1) the basic plan. This plan for planting was based on the 13th five-year forestry development plan and greening project of Wuhan [46], and was implemented in a 1 km × 1 km grid by combining the afforestation plan, forest land use situation, and actual labor ability for planting, giving a total new forest area of 600 km2. Comparatively, (2) the optimized plan was a targeted approach. This followed the principle of “planting where the PM2.5 concentration is high”. This plan arranges trees in corresponding grids, with the highest average concentration up to 600 km2 according to the PM2.5 concentration spatial distribution data for the first quarter (January to March) of 2016.
2.6. Effect of Planting Plan on PM2.5 Concentration
Here, we estimate the effect of new trees on PM2.5 concentration.
The PM2.5 adsorption capability by forest area per square kilometer corresponding to the PM2.5 concentration was calculated using Equation (2). Then, the accurate height of the mixed layer in Wuhan was acquired from the weather bureau. Inspired by Nowak’s study [47], the PM2.5 concentration change in every grid and the monthly average PM2.5 concentration in Wuhan was calculated using Equations (3) and (4), with the ratio of the change in concentration of PM2.5 compared to the initial concentration being the PM2.5 concentration decrease rate (Equation (5)).
where ΔC is the change of PM2.5 concentration, Δk is the forest coverage increment rate in 1 km2, P is PM2.5 adsorption amount by trees over 1 km2, i is the count of months, j is the count of grids, and m is Wuhan’s effective grid number. A refers to a 1 km2 area, BL is he atmospheric mixed layer height (m), and C0 is the monthly average initial concentration of PM2.5.
2.7. Plan Evaluation of Significance
(1) Samples of evaluation. Each plan corresponded to 12 change rates, r1, r2, ..., r11, r12. The two samples were denoted as R1 and R2, respectively.
(2) Parameter estimation. The general distribution of two samples was unclear, but these samples were influenced by many accidental factors, and no one factor played a leading role, hence the probable model or these samples was approximately a normal distribution. The mean value and standard deviation of a small sample can be estimated using Equations (6) and (7), respectively.
(3) Hypothesis testing. Since the variance was unknown and the sample size was small, the T test was adopted. The change rate of for the basic plan was the null hypothesis (Ha), μ = μ0. Correspondingly, the rate or the optimized plan as the alternative hypothesis (Hb). To judge whether Hb was significantly better than Ha a right side test was used, μ > μ0. If Hb is significantly better, then the statistic T is located in the rejection domain W (Equation (8)), the null hypothesis is abandoned, and the alternative hypothesis accepted. If it is not significantly better, the null hypothesis is accepted, and the alternative one is dropped. During the test, alpha significance levels were set at 0.05 and 0.01, respectively.
where μ is the sample mean value and S2 is the sample variance. Here, i is the month (from the period January to December), T is test statistics, W is the rejection domain, and alpha is the significance level.
2.8. Spatial Strategy of Afforestation
If the optimized plan is significantly better than the basic plan in the administrative region of the city and the urban metropolitan development area, the optimized plan should be adopted. If there is no significant difference between the two plans in the administrative region, but the optimized plan in the urban metropolitan development area has the advantage of PM2.5 removal compared to the basic, the two plans should be taken into account and the planting in the urban metropolitan development area should be strengthened. If there is no significant difference between the plans in the two ranges, it is judged that there may not be an optimal forest layout, and that different forest cover patterns have little effect on PM2.5 removal.
3. Results
3.1. Regularity between PM2.5 Concentration and Adsorption by Leaves
Leaves were not collected on 12, 15, 25, 26, or 30 May due to rainy weather. The PM2.5 adsorption by two kinds of trees (W-PM2.5) was estimated as half of the measured sample weight [48], and the W-PM2.5 of overall sample was the mean value of the two kinds of leaves. The results of PM2.5 adsorption on leaves are shown in Table 1.
Based on Equation (1), the adsorption per area unit and time unit (M-PM2.5) can be calculated by W-PM2.5. (1) Cinnamomum camphor. The newly planted trees are young and small. The tree height is 5 m (up to the quality standard of third types of arbor trees) [49], the effective height of the tree canopy is 3 m, and the leaf quantity per cubic meter is 10 times that of the sample. (2) Magnolia grandiflora. The tree height is 5 m, the effective height of the canopy is 3 m, and the leaf quantity per cubic meter is 15 times that of the sample. M-PM2.5 can be calculated accordingly (Table 1). For example, the sample adsorption weight of PM2.5 in Cinnamomum camphor leaves is 0.0023 g. Because it is the cumulative amount of one day, 0.0023 g is divided by 24 (h), which corresponds to the time unit for PM2.5 concentration monitoring. Then, according to the volume of leaves, the sample size is multiplied by 30 to get 0.0029 g m−2, which represents the PM2.5 capacity of Cinnamomum camphor leaves, with canopy cover per area unit (1 m2) per time unit (1 h).
From Table 1, the correlation between the average PM2.5 of the overall sample (M-PM2.5) and the PM2.5 concentrations over the last 3 days, the last 2 days, the given day, and the given hour were 0.6914, 0.7338, 0.7951, and 0.5265, respectively. The adsorption of overall samples showed a strong positive correlation with PM2.5 concentration on the given day, indicating that the higher probability of floated PM on the leaf surface was accumulated on one day (within 24 h), and the longer or shorter the time, the lower the correlation was.
On this basis, a linear correspondence of concentration–adsorption can be obtained. According to Equation (2), the linear regressions of Cinnamomum camphor, Magnolia grandiflora, and the overall level are shown in Figure 2, respectively. Intercept b is 0, a = 0.0001, and the regression of the overall adsorption level per area unit is y = 0.0001x. This indicates that the higher the concentration, the greater the PM2.5 adsorption amount is. This important regularity will be used to analyze the influence of new forests on PM2.5 concentration in the cell grid.
3.2. Plans of Planting
(1) Basic Plan. According to Wuhan’s forestry plan and ecological control red line, tree planting projects mainly include cross-axis landscape greening, periphery urban ecological landscape zone construction, “into the city” demonstration projects for green wedges, greening action across the city and barren hill greening, and the city green way, increasing total forest cover by 600 km2. Distribution of new trees is in the administrative region, mainly in the city periphery area. The corresponding forest growth ratios for the construction area (1700 km2), ecological development area (219 km2), future development area (1177 km2), and ecological protection area (3998 km2, excluding surface water area) (Figure 3a) are 1%, 4.5%, 5.1%, and 13.2%, respectively, and growth proportion areas are 17, 10, 60, and 513 km2 (Figure 3b), respectively.
(2) Optimized Plan. Based on the PM2.5 concentration distribution in the first quarter (January to March), the 600 km2 forest was planted in the cell grid, in which concentration is from high to low. The upper limits of planting in the construction area, ecological development area, future development area, and ecological protection area are 30%, 40%, 50%, and 70%, respectively. Regarding the low tree coverage in the current built-up area, the newly added trees, totaling 600 km2, are concentrated in the urban metropolitan development area (Figure 3c).
3.3. Effects of Plans on PM2.5 Concentration
The added forests have a certain improvement effect on PM2.5 concentration reduction from January to December. The simulated results for different plans are as follows. (1) In the basic plan, the monthly PM2.5 concentration in Wuhan’s administrative region decreased by 2.55, 1.72, 1.45, 0.82, 0.93, 0.63, 0.47, 0.58, 0.92, 0.75, 1.33, and 2.70 μg m−3, and the decrease rates were 2.38%, 2.15%, 1.73%, 1.74%, 2.12%, 2.03%, 1.94%, 1.72%, 2.05%, 2.14%, 2.18%, and 2.90%, respectively. In the metropolitan development area, the concentration decrement amounts were 2.01, 1.32, 1.18, 0.68, 0.73, 0.49, 0.36, 0.46, 0.72, 0.59, 1.08, and 2.16 μg m−3, respectively, and the decrease rates were 2.18%, 1.84%, 1.57%, 1.55%, 1.76%, 1.57%, 1.28%, 1.27%, 1.63%, 1.59%, 1.87%, and 2.23%, respectively (Figure 5a). (2) In the optimized plan, the PM2.5 concentration in Wuhan’s administrative region decreased by 2.55, 1.67, 1.48, 0.86, 0.93, 0.61, 0.44, 0.57, 0.90, 0.74, 1.36, and 2.72 μg m−3, and the corresponding PM2.5 decrease rates were 2.38%, 2.08%, 1.76%, 1.83%, 2.11%, 1.97%, 1.83%, 1.67%, 1.99%, 2.12%, 2.24%, and 2.92%, respectively. In the metropolitan development area, the concentration decrement amounts were 5.65, 3.69, 3.30, 1.91, 2.06, 1.35, 0.97, 1.25, 1.98, 1.64, 3.02, and 6.03 μg m−3, and the PM2.5 decrease rates were 6.14%, 5.14%, 4.38%, 4.34%, 4.92%, 4.31%, 3.46%, 3.47%, 4.51%, 4.41%, 5.21%, and 6.19%, respectively (Figure 5b).
The results for the two plans were compared in the administrative region, and the hypothesis test (T test) was conducted with the PM2.5 concentration change rate as the sample. The concentration reduction rate for the basic plan was regarded as the null hypothesis (Ha), and the optimized plan was regarded as the alternative hypothesis (Hb). The test results showed that the T test probability value was 0.2128, higher than the significance levels of 0.05 or 0.01, indicating that there was no significant difference in PM2.5 concentration reduction rate between the two types of tree planting schemes in Wuhan. Therefore, it is believed that when analyzing the average PM2.5 removal level of the whole city, the advantages of concentrated PM2.5 removal in the optimized plan are weak compared to the basic plan.
Figure 3c shows that the added trees are mainly concentrated in the range of the urban metropolitan development area. We further analyzed the significance difference between the two plans in this region. The T test was performed again, and the concentration reduction rate of the basic plan was used as the null hypothesis (Ha), while the optimized plan was regarded as the alternative hypothesis (Hb). The test results show that the t-test probability value is only 6.776×10⁻¹⁰, which is less than the significance levels of 0.05 and 0.01, indicating that the two plans have significant differences in PM2.5 removal for added trees in the metropolitan development area.
3.4. Planting Spatial Pattern
In the administrative region, there is no significant difference in PM2.5 concentration reduction in the planting of forests over an area of 600 km2. However, focusing on the urban metropolitan development area, the differences can be seen. Optimized planting has a better PM2.5 improvement effect. Therefore, aiming at air quality improvement, the optimized plan still has its advantages.
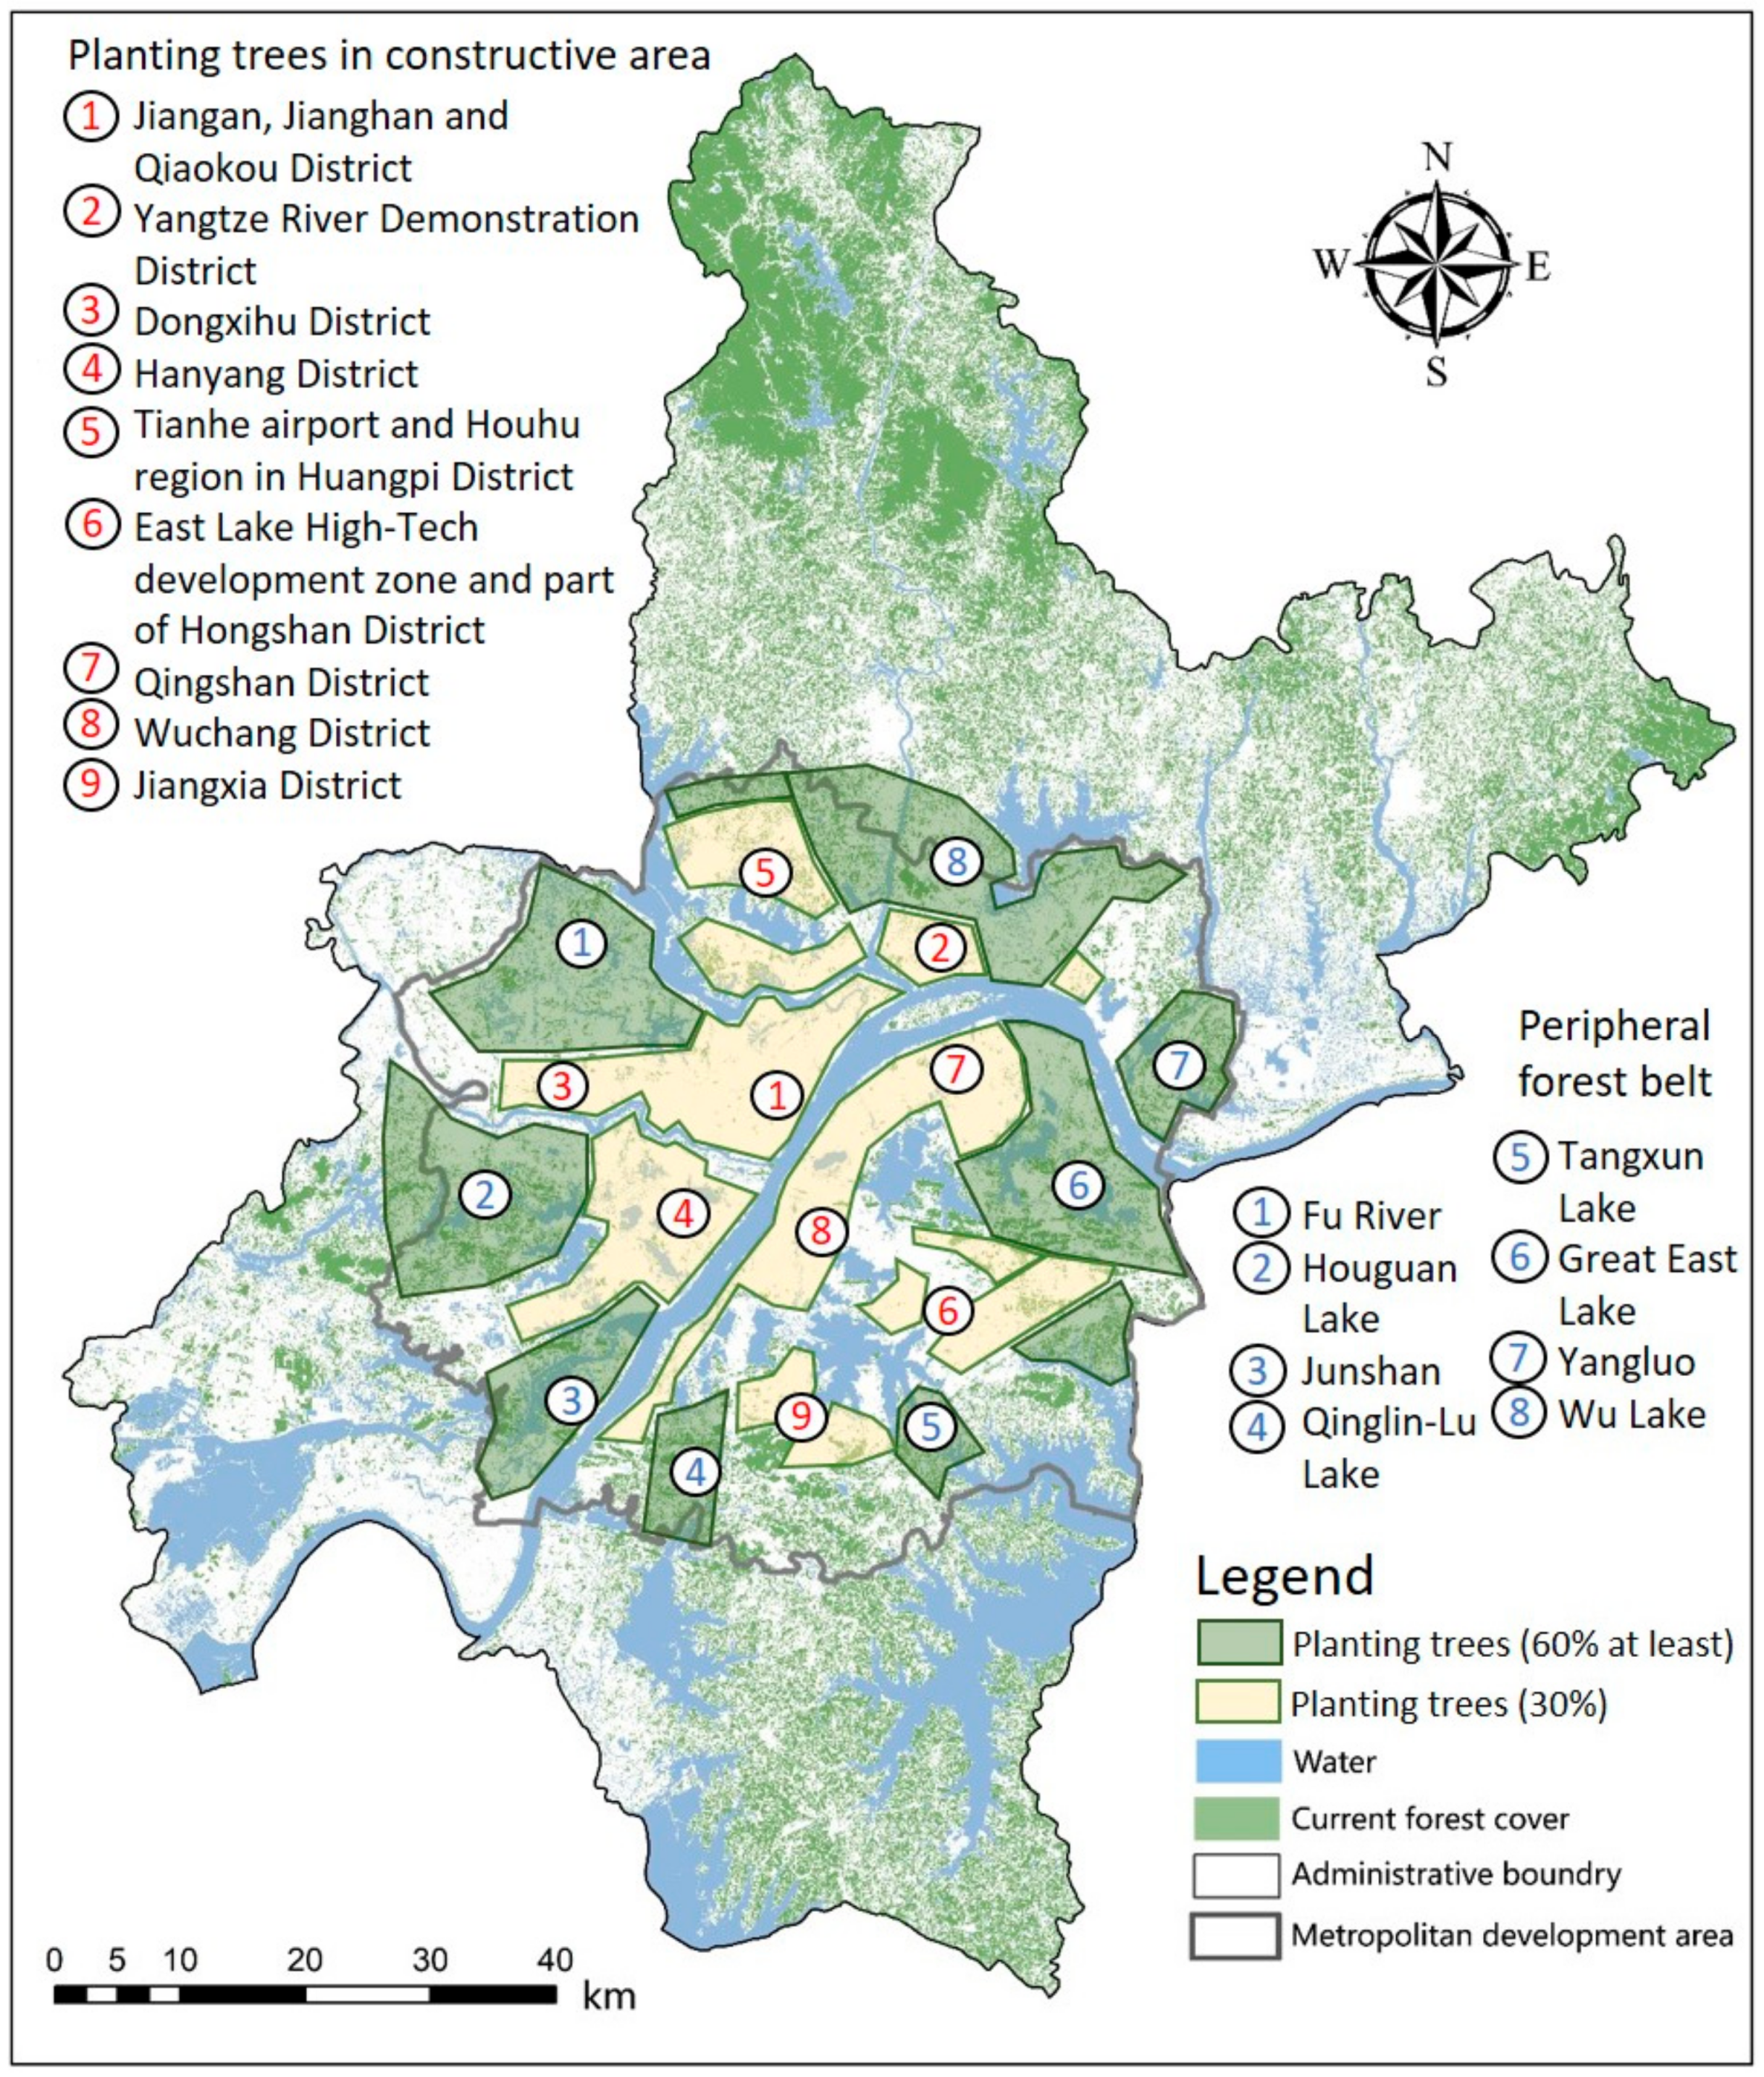
The distribution of further tree planting space in Wuhan can be seen in Figure 3c and Figure 4c. These figures illustrate the following. (1) The urban ring forest belt should be formed around the boundary of the metropolitan development area (or between the outer ring road and the fourth ring road), with a width of 10 km–20 km. Main greening areas include: the south of Hanjiang river to surrounding Houguan wetlands, Junshan bridge to Dongfeng road, the north of Lu Lake to Qingling Lake, Tangxun Lake surrounding to Liangzi Lake, Great East Lake scenic area and its eastern part, Wu Lake peripheral area and the south to the Yangtze River, the west of Fu River, and south to Dongxihu district. Forest coverage in these areas is at least 60%. (2) In the urban construction area, the following districts need improved greening: Wuchang, Hongshan, Qingshan, East Lake High-Tech zone, Jianghan, Jiang’an, Qiaokou, Hanyang, Zhuankou economic development zone, Dongxihu, Tianhe international airport surroundings, east and south of Huangpi district, and the Yangtze river demonstration district. The greening must be strengthened as much as possible, and the forest coverage rate must be increased to reach 30% (Figure 6).
4. Discussion
4.1. Afforestation Strategy and Policy Implications
The scale of afforestation and the forest coverage rate will be further improved in the future as the Chinese government vigorously promotes ecological civilization construction and green development strategies, with priority placed on ecological protection along the Yangtze river. Wuhan’s master plan (in preparation) shows that it is necessary to build a green space model with six green wedges, namely, Fuhe, Houguan Lake, Qingling, Tangxun Lake, Great East Lake, and Wu Lake wedges, forming the country park group. This requires a development strategy for a three-ring ecological zone and a suburban ecological ring. In line with the policy background, this study explores the spatial patterns of urban forest planting that are conducive to PM2.5 removal. Similar studies are rare.
The most direct ecological service function of urban forests is air improvement and micro-climate regulation. Because forests in this area are young, ecological diversity is insufficient, and soil formation, water conservation, flood storage, habitat provision, and landscape entertainment are also weak (primitive forests or secondary forests can effectively realize these functions). PM2.5 pollution is a large-scale and regional atmospheric environmental problem. At the city scale or larger, most afforestation is far away from urban centers and cannot provide deep coverage over parks and streets. The research determines the distribution of afforestation at the macro scale, and also has some abstract value at the micro scale, which does not affect the flexibility of planting in a small space. It provides a beneficial supplement for scientific afforestation planning.
This paper is a virtual experiment, with the forest coverage rate increased to 30% and the area increased to 600 km2. The greening result is basically the same as the green space development in the Wuhan master plan. In terms of quantity and area, our simulation further emphasizes that tree planting should be strengthened to form a forest belt in the “suburban ecological ring”, which is also an area where industrial production is concentrated, in order to strengthen the isolation function and improve the environmental benefit. The improvement effect of PM2.5 in the metropolitan development area is significant. The 5300 km2 periphery should also be considered, meaning this is not a complete forest strategy for the city.
The results also showed that different tree planting plans had no significant effect on PM2.5 removal in the administrative region. The ΔC value under the two plans is small. It is a significant point that improvement in air quality depends on emission reduction, not on planting trees. Thus, another significant point of this study reveals that the significance of the tree planting layout when only considering PM2.5 removal is limited in terms of the whole planting strategy.
4.2. Evaluation of the Methods in This Paper
4.2.1. Sample Selection
There are many tree species in Wuhan, 53% of which are deciduous trees [39]. On one hand, deciduous trees usually shed their leaves in the heavily polluted autumn and winter, and lose the positive effects of PM retention. On the other hand, the scale of prevalence trees in Wuhan is second only to Cinnamomum camphor trees. We found that the leaf surface of sycamore trees would adhere to a large number of villi instead of PM, which has been confirmed in the literature [48]. Therefore, we did not consider sycamore trees in leaf selection. Among the common evergreen trees, we only selected the two most common trees for experimental analysis. From the results, the regularity between PM2.5 concentration and its adsorption is clear.
4.2.2. Measuring Method
The methods for measuring PM included weighing, scanning electron microscopy (SEM), and particle size analysis [48]. Studies [50,51,52] show that the weighing method is a widely used method, but may lead to a low accuracy result. The SEM image is very clear, but the sample size selected is small, with a high cost and slow scanning speed. If the laser particle size analyzer is used, the water-soluble substances on the leaf surface particles are washed away, thus causing errors in the results. In addition, SEM and particle size analysis interpret the adsorption capacity of a leaf from the number of particles, and it is difficult to determine how long the PM takes to attach. Using the weighing method, one can evaluate the trends and meet the research needs at low cost.
4.2.3. GIS-Based Forest Spatial Distribution
Pollution sources can be transferred. The analysis of the influence of trees on PM2.5 concentration adopted in this paper may be incomplete and static. However, we think that pollution discharge is closely related to the processes of human activities. Large-scale human activities will not transfer effects in a short time. Thus, in the short and medium term, PM2.5 concentration distribution within a month or year still presents a relatively stable trend, and PM2.5 concentration is significantly higher in places close to built-up areas. Moreover, the source of PM2.5 and its formation process is very complex, involving human activities, climate, and meteorological factors. If a comprehensive analysis was conducted, it would be necessary to use more data and more sophisticated scientific research methods, with higher operating costs. However, the analysis effect is not proportional to the cost of work and is difficult to carry out in practice. If a large-scale study on urban development and environmental protection were carried out, it could be based on big data for human activities, emissions, and meteorological factors, and could use enhanced analysis of air quality model and agent based model, so as to obtain more comprehensive and dynamic analysis results. Considering current limitations, the optimal planting scheme based on historical data in this paper has strong relevance and operability, providing a reference for spatial patterns for urban greening.
4.3. Limitations and Prospects
Inevitably, the adsorption results will have errors. As working time was restricted, valid samples were only collected for 15 days (excluding rainy days). The sample of two species were limited by the time, batches, tree species, collection location, and other aspects. Also, the statistical relationship of concentration–adsorption of PM2.5 is worth an in-depth study. Moreover, although the ecological function of newly added trees is mainly PM retention, in the long run, once trees are planted, they are generally not replanted. When trees grow, they will have more ecological value. Therefore, tree planting should also consider the multiple ecological services they can offer [53], such as accessibility, recreation, soil and water conservation, flood prevention, among others.
In view of the limitations mentioned above, subsequently, sample collection can be increased in terms of vegetation types, batch number, and duration to enhance the accuracy and reliability of the statistical analysis of samples [54]. In addition, tree planting should also consider the multiple functional elements of their ecological services. This is also the research content that is expected to be further carried out in the study of forest distribution. Meerow and Newell [34] have explored this area. The aim going forward is to constantly improve the scientific nature of forest planning.
5. Conclusions
Air pollution in China’s big cities is a serious issue, especially PM2.5, which can be harmful to human health. In recent years, China has promoted ecological development planning, with priority placed on ecological protection along the Yangtze river. Afforestation is highly valued, but its planning is subjective. There are few studies yet on the distribution of forest planting for reducing PM2.5. Therefore, as a case study of Wuhan, this paper investigates whether different afforestation spatial arrangements can significantly reduce PM2.5 when the same amount of trees are planted. For urban environmental problems, either in China or elsewhere, it is of practical significance to improve the scientific quality of planning, in order to provide a reference for planning and construction.
Conclusions are as follows. (1) The amount of PM retained on leaves is proportional to the concentration, and floated and deposited PM are found on the leaves. Floated PM can be washed off, while the deposited PM is adsorbed in the leaf. (2) Through correlation analysis, there is a high positive correlation between the floated PM2.5 and the average PM2.5 concentration on one day. Therefore, a linear regression of “concentration (X)–adsorption (Y)” is conducted; that is, Y = 0.0001X. This provides support for the simulation of leaf PM2.5 capacity under the change of PM2.5 concentration. (3) On a city-wide scale, different forest layouts have no significant impact on PM2.5 concentration, with only a 1–2% reduction rate. However, in the scope of the metropolitan development area (central city), the optimized plan has a significant improvement effect on PM2.5 concentration compared with the basic plan, with a reduction rate of 3–5%. Therefore, it is of limited significance to consider the forest distribution in the city’s whole region with the same scale of afforestation. Targeted tree planting should be implemented in the city’s central area, which has heavy air pollution. (4) In the urban center (built-up area), trees should be planted in plantable places as much as possible to increase the forest coverage rate to 30%. At the edge of the Wuhan metropolitan development area (the outer ring road, or “suburban ecological ring”), the land is relatively abundant and the industrial production is concentrated. It is necessary to strengthen tree planting to form a forest belt with a width of 10 km–20 km for ecological isolation and air improvement. The forest coverage rate needs to reach at least 60%. (5) It should be recognized that the improvement of PM2.5 concentration using trees is generally small. The fundamental way to improve air quality is to reduce emissions, and tree planting is only an auxiliary means. If afforestation is on a city-wide scale, not only should the function of air quality improvement be taken into consideration, but also more ecological forest functions should be involved, including leisure tourism, accessibility, soil and water conservation, flood storage, and other functions.
Author Contributions
Y.Z. contributed to the methodology, calculation, analysis, and writing. H.L. was the supervisor and also the corresponding author, who gave advice and funding support. J.Z. provided the original conceptual analysis. M.X. supported the research through data investigation.
Funding
Funding for this research was provided in part by the Innovation Grant from Science and Technology Department of Hubei Province under Grant Number: 2017ADC073, China Thousands Talents Program under Grant Number: D1218006 and Natural Science Foundation of Hubei Province under Grant Number: 2019CFB284.
Acknowledgements
We would like to thank Yuanli Zhou for his help with the language, and two anonymous reviewers for their crucial advice.
Conflicts of Interest
The authors declare no conflict of interest.
References
- Deng, T.T.; Wang, D.D.; Yang, Y.; Yang, H. Shrinking cities in growing China: Did high speed rail further aggravate urban shrinkage? Cities 2019, 86, 210–219. [Google Scholar] [CrossRef]
- Li, C.; Li, H.J.; Feng, S.D.; Liu, X.Y.; Guo, S. A study on the spatiotemporal characteristics and change trend of the atmospheric environmental carrying capacity in the Jing-Jin-Ji region, China. J. Clean. Prod. 2019, 211, 27–35. [Google Scholar] [CrossRef]
- Xiao, H.J.; Duan, Z.Y.; Zhou, Y.; Zhang, N.; Shan, Y.L.; Lin, X.Y.; Liu, G.S. CO2 emission patterns in shrinking and growing cities: A case study of Northeast China and the Yangtze River Delta. Appl. Energ. 2019, 251, 113384. [Google Scholar] [CrossRef]
- Wang, J.; Hu, Z.M.; Chen, Y.Y.; Chen, Z.L.; Xu, S.Y. Contamination characteristics and possible sources of PM10 and PM2.5 in different functional areas of Shanghai, China. Atmos. Environ. 2013, 68, 221–229. [Google Scholar] [CrossRef]
- Yin, H.; Xu, L.Y. Comparative study of PM10/PM2.5-bound PAHs in downtown Beijing, China: Concentrations, sources, and health risks. J. Clean. Prod. 2018, 177, 674–683. [Google Scholar] [CrossRef]
- Lelieveld, J.; Evans, J.S.; Fnais, M.; Giannadaki, D.; Pozzer, A. The contribution of outdoor air pollution sources to premature mortality on a global scale. Nature 2015, 525, 367–371. [Google Scholar] [CrossRef] [PubMed]
- Shao, F.; Wang, L.H.; Sun, F.B.; Li, G.; Yu, L.; Wang, Y.J.; Zeng, X.R.; Yan, H.; Dong, L.; Bao, Z.Y. Study on different particulate matter retention capacities of the leaf surfaces of eight common garden plants in Hangzhou, China. Sci. Total Environ. 2019, 652, 939–951. [Google Scholar] [CrossRef] [PubMed]
- Pope, C.A.; Burnett, R.T.; Thun, M.J.; Calle, E.E.; Krewski, D.; Ito, K.; Thurston, G.D. Lung cancer, cardiopulmonary mortality, and long-term exposure to fine particulate air pollution. J. Am. Med. Assoc. 2002, 287, 1132–1141. [Google Scholar] [CrossRef]
- Irga, P.J.; Burchett, M.D.; Torpy, F.R. Does urban forestry have a quantitative effect on ambient air quality in an urban environment? Atmos. Environ. 2015, 120, 173–181. [Google Scholar] [CrossRef] [Green Version]
- Zhang, X.D.; Du, J.; Huang, T.; Zhang, L.M.; Gao, H.; Zhao, Y.; Ma, J.M. Atmospheric removal of PM2.5 by man-made Three Northern Regions Shelter Forest in Northern China estimated using satellite retrieved PM2.5 concentration. Sci. Total Environ. 2017, 593–594, 713–721. [Google Scholar] [CrossRef]
- Xie, C.K.; Kan, L.Y.; Guo, J.K.; Jin, S.J.; Li, Z.G.; Chen, D.; Li, X.; Che, S.Q. A dynamic processes study of PM retention by trees under different wind conditions. Environ. Pollut. 2018, 233, 315–322. [Google Scholar] [CrossRef] [PubMed]
- Zhang, Y.J.; Hao, J.F. The evaluation of environmental capacity: Evidence in Hunan province of China. Ecol. Indic. 2016, 60, 514–523. [Google Scholar] [CrossRef]
- Zhou, Y.J.; Zhou, J.X. Urban atmospheric environmental capacity and atmospheric environmental carrying capacity constrained by GDP and PM2.5. Ecol. Indic. 2017, 73, 637–652. [Google Scholar] [CrossRef]
- McDonald, A.G.; Bealey, W.J.; Fowler, D.; Dragosits, U.; Skiba, U.; Smith, R.I.; Donovan, R.G.; Brett, H.E.; Hewitt, C.N.; Nemitz, E. Quantifying the effect of urban tree planting on concentrations and depositions of PM10 in two UK conurbations. Atmos. Environ. 2007, 41, 8455–8467. [Google Scholar] [CrossRef]
- Tallis, M.; Taylor, G.; Sinnett, D.; Freer-Smith, P. Estimating the removal of atmospheric particulate pollution by the urban tree canopy of London, under current and future environments. Landsc. Urban Plan. 2011, 103, 129–138. [Google Scholar] [CrossRef]
- Janhall, S. Review on urban vegetation and particle air pollution—Deposition and dispersion. Atmos. Environ. 2015, 105, 130–137. [Google Scholar] [CrossRef]
- Nowak, D.J.; Hirabayashi, S.; Doyle, M.; McGovern, M.; Pasher, J. Air pollution removal by urban forests in Canada and its effect on air quality and human health. Urban For. Urban Gree. 2018, 29, 40–48. [Google Scholar] [CrossRef]
- Yang, T.R.; Liu, W.L. Does air pollution affect public health and health inequality? Empirical evidence from China. J. Clean. Prod. 2018, 203, 43–52. [Google Scholar] [CrossRef]
- Wuhan national economic and social development statistical bulletin in 2018. Hubei provincial bureau of statistics (HBS). Available online: http://tjj.hubei.gov.cn/tjsj/ndtjgb/fzndtjgb/120429.htm (accessed on 30 August 2019).
- Liu, Z.; Chen, D.; Huo, X.X.; Yin, J.; Mei, Y. Lag effects of air pollutant levels on pediatric respiratory disease outpatient visits in Wuhan. J. Environ. Occup. Med. 2018, 35, 124–130, (In Chinese with English abstract). [Google Scholar] [CrossRef]
- Wuhan Garden and Forestry Bureau (WGFB). Wuhan’s greening status report, 2017 (in Chinese). Available online: http://www.wuhan.gov.cn/whszfwz/xwxx/whyw/201803/t20180322_192625.html (accessed on 29 August 2019).
- Chen, L.X.; Wang, L.Q.; Li, G.; Ma, F.W.; Zhang, Z.Q. Understanding treescape changes as the basis of urban forest planning infringe areas. Ecol. Indic. 2018, 95, 117–126. [Google Scholar] [CrossRef]
- Sun, C.G.; Lin, T.; Zhao, Q.J.; Li, X.H.; Ye, H.; Zhang, G.Q.; Liu, X.F.; Zhao, Y. Spatial pattern of urban green spaces in a long-term compact urbanization process—A case study in China. Ecol. Indic. 2019, 96, 111–119. [Google Scholar] [CrossRef]
- Mincey, S.; Schmitt-Harsh, M.; Thurau, R. Zoning, land use, and urban tree canopy cover: The importance of scale. Urban For. Urban Gree. 2013, 12, 191–199. [Google Scholar] [CrossRef]
- Ordonez, C.; Duinker, P. An analysis of urban forest management plans in Canada: Implications for urban forest management. Landsc. Urban Plan. 2013, 116, 36–47. [Google Scholar] [CrossRef] [Green Version]
- Mabon, L.; Shih, W.Y. What might ‘just green enough’ urban development mean in the context of climate change adaptation? The case of urban greenspace planning in Taipei Metropolis, Taiwan. World Dev. 2018, 107, 224–238. [Google Scholar] [CrossRef]
- Wu, R.W. The development of urban green space in foreign countries. City Plan. Rev. 1998, 22, 39–43. (In Chinese) [Google Scholar]
- Fan, P.P.; Xu, L.H.; Yue, W.Z.; Chen, J.Q. Accessibility of public urban green space in an urban periphery: The case of Shanghai. Landsc. Urban Plan. 2017, 165, 177–192. [Google Scholar] [CrossRef]
- Luz, A.C.; Buijs, M.; Aleixo, C.; Metelo, I.; Grilo, F.; Branquinho, C.; Santos-Reis, M.; Pinho, P. Should I stay or should I go? Modelling the fluxes of urban residents to visit green spaces. Urban For. Urban Gree. 2019, 40, 195–203. [Google Scholar] [CrossRef]
- Fan, C.; Johnston, M.; Darling, L.; Scott, L.; Liao, F.H. Land use and socio-economic determinants of urban forest structure and diversity. Landsc. Urban Plan. 2019, 181, 10–21. [Google Scholar] [CrossRef]
- Chen, C. Layout status and optimal site selection of urban disaster prevention green space: A case study of Shenyang central urban area. Ph.D Thesis, Northeast Normal University, Changchun, China, 2016. (In Chinese with English abstract). [Google Scholar]
- Escobedo, F.; Nowak, D.J. Spatial heterogeneity and air pollution removal by an urban forest. Landsc. Urban Plan. 2009, 90, 102–110. [Google Scholar] [CrossRef]
- Chen, M.; Dai, F.; Yang, B.; Zhu, S.W. Effects of urban green space morphological pattern on variation of PM2.5 concentration in the neighborhoods of five Chinese megacities. Build. Environ. 2019, 158, 1–15. [Google Scholar] [CrossRef]
- Meerow, S.; Newell, J.P. Spatial planning for multifunctional green infrastructure: Growing resilience in Detroit. Landsc. Urban Plan. 2017, 59, 62–75. [Google Scholar] [CrossRef]
- Sass, C.K.; Lodder, R.A.; Lee, B.D. Combining biophysical and socioeconomic suitability models for urban forest planning. Urban For. Urban Gree. 2019, 38, 371–382. [Google Scholar] [CrossRef]
- Pugh, T.A.M.; MacKenzie, A.M.; Whyatt, J.D.; Hewitt, C.N. Effectiveness of green infrastructure for improvement of air quality in urban street canyons. Environ. Sci. Technol. 2012, 46, 7692–7699. [Google Scholar] [CrossRef] [PubMed]
- Wuhan Planning & Design Institute (WPDI). Wuhan’s 2049 Vision of Development Strategy, 2017 (In Chinese). Available online: http://www.wpdi.cn/project-1-i_11297.htm (accessed on 23 July 2019).
- Nowak, D.J.; Hirabayashi, S.; Bodine, A.; Greenfield, E. Tree and forest effects on air quality and human health in the United States. Environ. Pollut. 2014, 193, 119–129. [Google Scholar] [CrossRef] [PubMed] [Green Version]
- Huang, Z.G.; Ding, Z.J.; Yao, J.; Pan, L.; Pan, Y.P.; Jiang, T.P.; Wu, H.Z.; Shi, G.W. Investigation on plant diversity resources in Wuhan city. Gree Technol. 2006, 102, 32–38. (In Chinese) [Google Scholar]
- Jia, Y.; Wu, C.; Dong, C.F.; Li, C.P.; Liao, H.M. Measurement on ability of dust removal of seven green plants at micro-conditions. J. Cent. South Univ. 2012, 43, 4547–4553, (In Chinese with English abstract). [Google Scholar]
- Tomasevic, M.; Vukmirovic, Z.; Rajsic, S.; Tasic, M.; Stevanovic, B. Characterization of trace metal particles deposited on some deciduous tree leaves in an urban area. Chemosphere 2005, 61, 753–760. [Google Scholar] [CrossRef] [PubMed]
- Wang, L.; Gong, H.L.; Liao, W.B.; Wang, Z. Accumulation of particles on the surface of leaves during leaf expansion. Sci. Total Environ. 2015, 532, 420–434. [Google Scholar] [CrossRef]
- Zhang, L.; Zhang, Z.Q.; Chen, L.X.; McNulty, S. An investigation on the leaf accumulation-removal efficiency of atmospheric particulate matter for five urban plant species under different rainfall regimes. Atmos. Environ. 2019, 208, 123–132. [Google Scholar] [CrossRef]
- Lu, S.W.; Yang, X.B.; Li, S.N.; Chen, B.; Jiang, Y.; Wang, D.; Xu, L. Effects of plant leaf surface and different pollution levels on PM2.5 adsorption capacity. Urban For. Urban Gree. 2018, 34, 64–70. [Google Scholar] [CrossRef]
- Ministry of Natural Resources of the People Republic of China (MNR). Current Land Use Classification (GB/T 21010-2017). 2017; (In Chinese). Available online: http://www.mnr.gov.cn/dt/ywbb/201810/t20181030_2288891.html (accessed on 29 August 2019).
- Wuhan Garden and Forestry Bureau (WGFB). Wuhan’s 13th Five-year Plan of Garden and Forestry Development. 2017; (In Chinese). Available online: http://ylj.wuhan.gov.cn/webpage/view/breakNews.jsp?article_id=6172&from=singlemessage&isappinstalled=0 (accessed on 26 September 2019).
- Nowak, D.J.; Hirabayashi, S.; Bodine, A.; Hoehn, R. Modeled PM2.5 removal by trees in ten U.S. cities and associated health effects. Environ. Pollut. 2013, 178, 395–402. [Google Scholar] [CrossRef] [PubMed]
- Chen, X.P.; Jiao, Y.W.; Pei, T.T.; Zhou, Z.X. The effect of adsorbing fine particulate matter (PM2.5) by garden plants: A review. Chin. J. Ecol. 2014, 33, 2558–2566, (In Chinese with English abstract). [Google Scholar] [CrossRef]
- National Forestry and Grassland Administration (NFGA). National Technical Provisions on Continuous Inventory of Forest Resources. 2014; (In Chinese). Available online: http://www.forestry.gov.cn/main/4818/content-797022.html (accessed on 23 July 2019).
- Dzierzanowski, K.; Popek, R.; Gawroska, H.; Sӕbø, A.; Gawronski, S.W. Deposition of particulate matter of different size fractions on leaf surfaces and in waxes of urban forest species. Int. J. Phytoremediat. 2011, 13, 1037–1046. [Google Scholar] [CrossRef] [PubMed]
- Sӕbø, A.; Popek, R.; Nawrot, B.; Hanslin, H.M.; Gawronska, H.; Gawronski, S.W. Plant species differences in particulate matter accumulation on leaf surfaces. Sci. Total Environ. 2012, 427, 347–354. [Google Scholar] [CrossRef] [PubMed]
- Jamil, S.; Abhilash, P.C.; Singh, A.; Singh, N.; Behl, H.M. Fly ash trapping and metal accumulating capacity of plants: Implication for green belt around thermal power plants. Landsc. Urban Plan. 2009, 92, 136–147. [Google Scholar] [CrossRef]
- Pontes, D.M.; Engel, V.L.; Parrotta, J. Forest structure, wood standing stock, and tree biomass in different restoration systems in the Brazilian Atlantic Forest. Forests 2019, 10, 588. [Google Scholar] [CrossRef]
- Muhammad, S.; Wuyts, K.; Samson, R. Atmospheric net particle accumulation on 96 plant species with contrasting morphological and anatomical leaf characteristics in a common garden experiment. Atmos. Environ. 2019, 202, 328–344. [Google Scholar] [CrossRef]
Figure 1.
Study area, leaf sample collection location, and the fine particulate matter (PM2.5) concentration distribution (January to March).
Figure 1.
Study area, leaf sample collection location, and the fine particulate matter (PM2.5) concentration distribution (January to March).
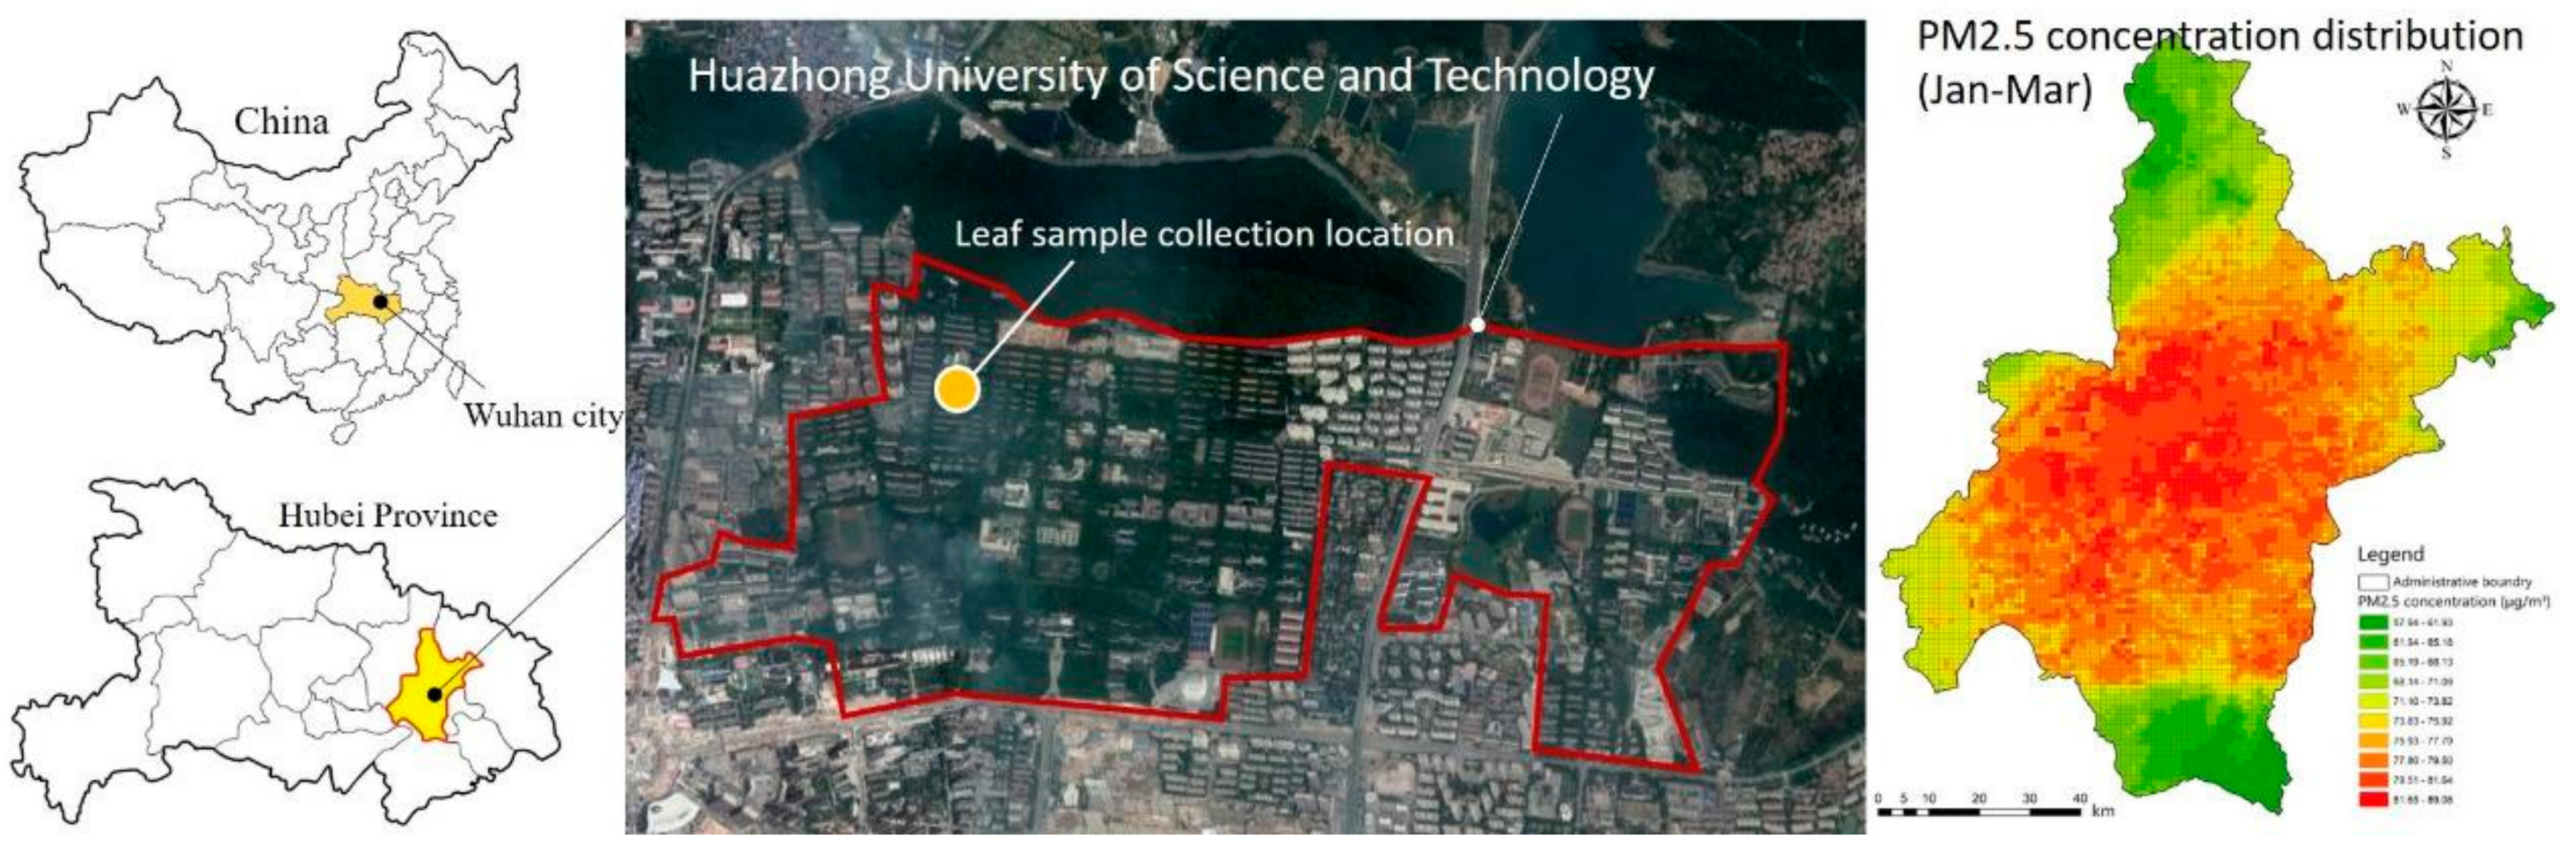
Figure 2.
Regularities between PM2.5 concentration and adsorption by leaves.
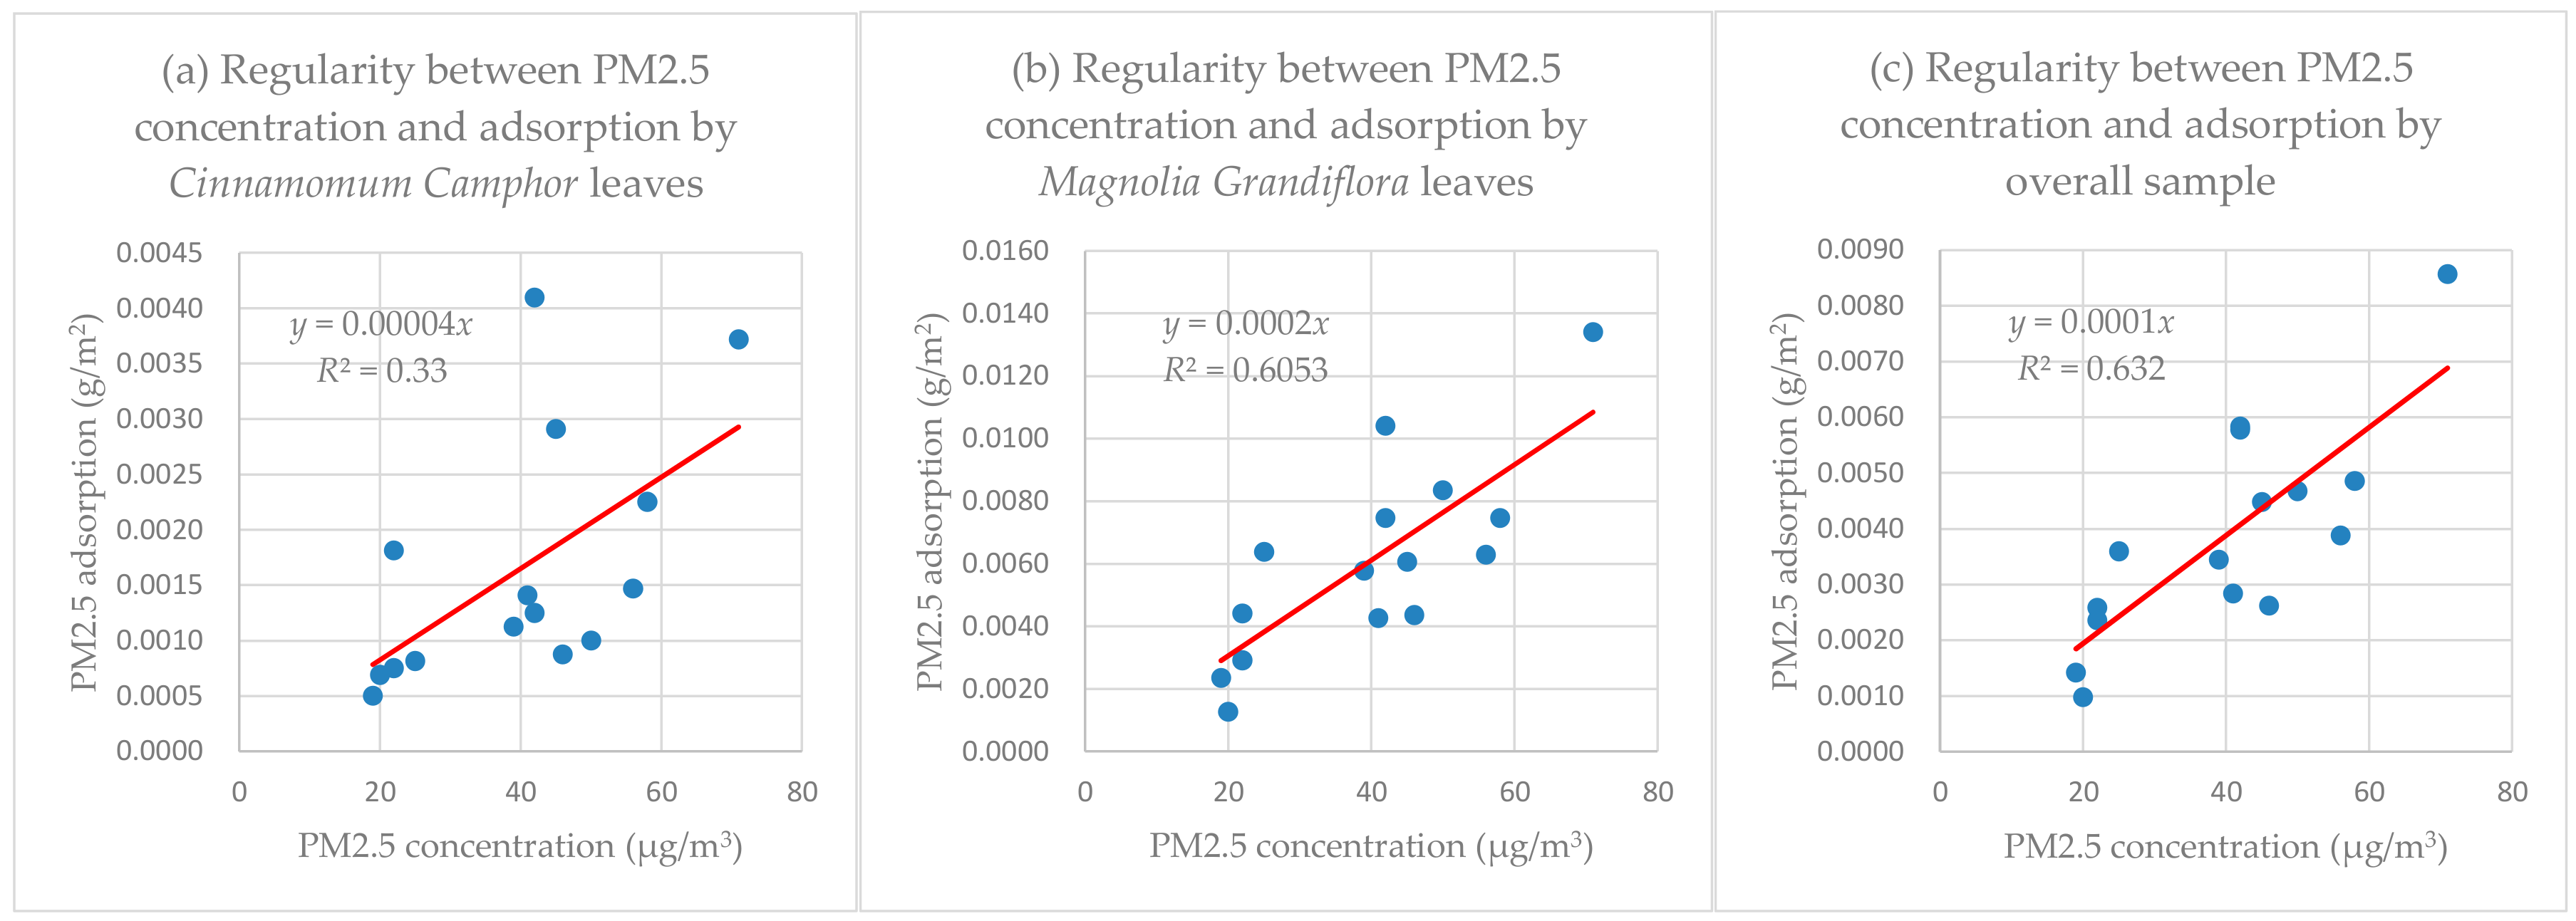
Figure 3.
(a) The Wuhan eco-control red line range, (b) the basic plan based on forestry developing planning, and (c) the optimized plan to mitigate PM2.5 pollution.
Figure 3.
(a) The Wuhan eco-control red line range, (b) the basic plan based on forestry developing planning, and (c) the optimized plan to mitigate PM2.5 pollution.
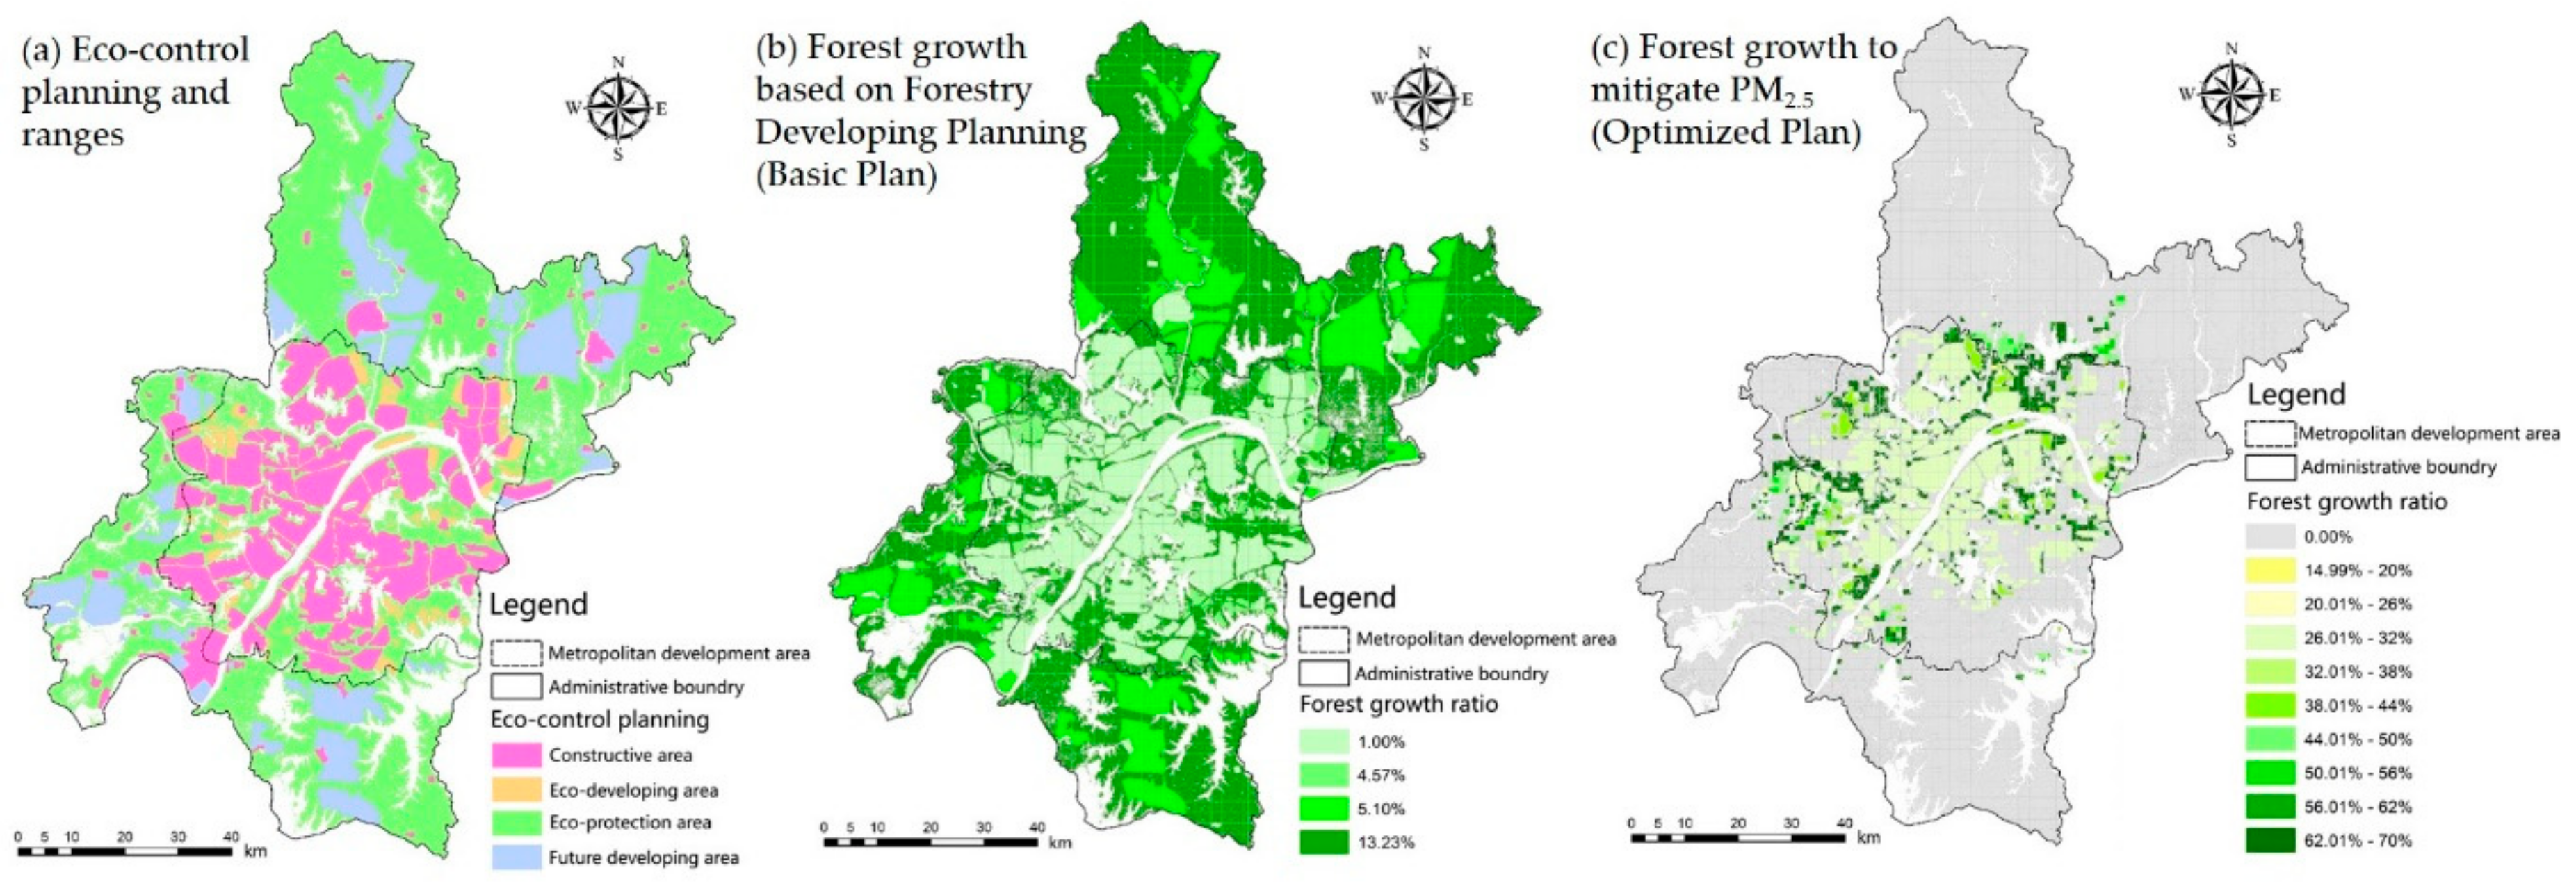
Figure 4.
Distribution of forest cover in different schemes: (a) The current forest cover, (b) the basic plan, and (c) the optimized plan.
Figure 4.
Distribution of forest cover in different schemes: (a) The current forest cover, (b) the basic plan, and (c) the optimized plan.
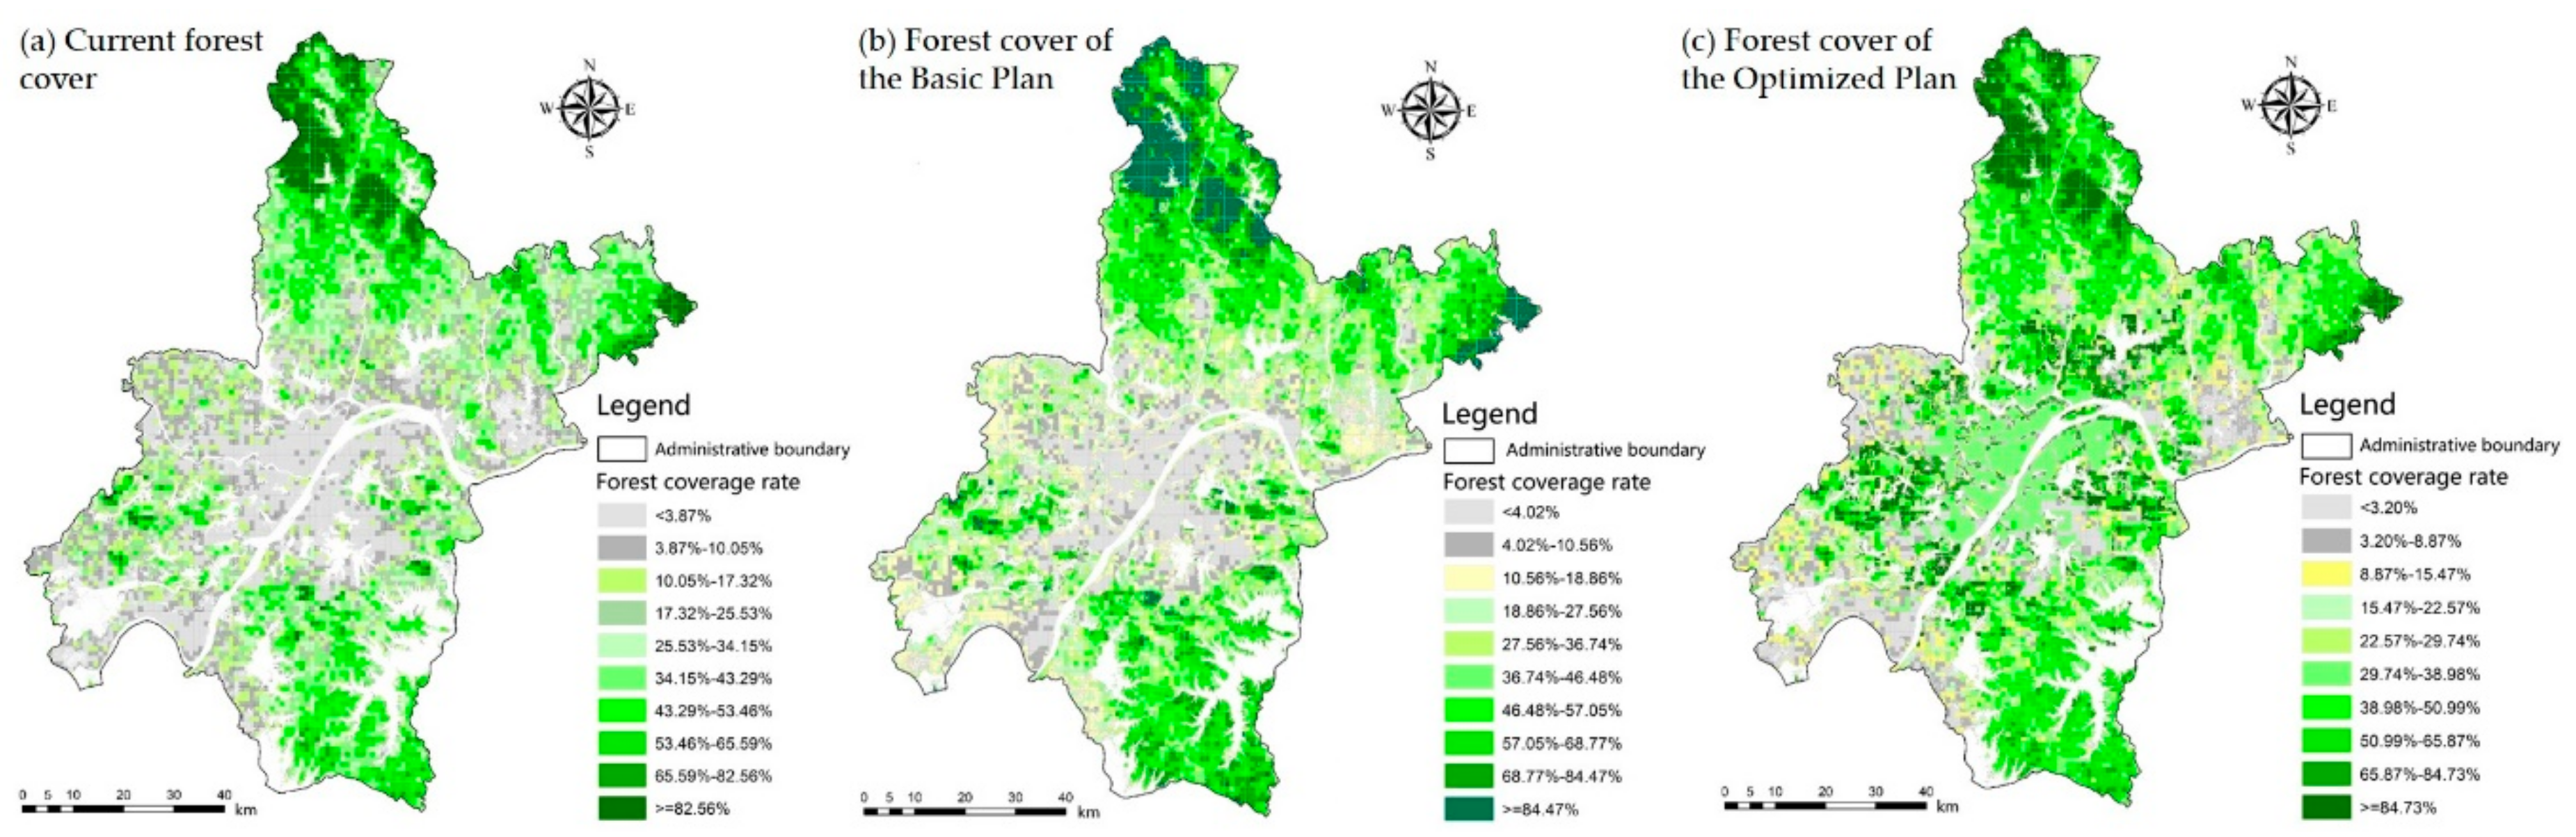
Figure 5.
PM2.5 concentration change and reduction rate for (a) the basic plan and (b) the optimized plan. The Δc and r in the upper right in every sub-figure illustrate the change in the metropolitan development area, while in the lower right represent the change in Wuhan’s administrative region.
Figure 5.
PM2.5 concentration change and reduction rate for (a) the basic plan and (b) the optimized plan. The Δc and r in the upper right in every sub-figure illustrate the change in the metropolitan development area, while in the lower right represent the change in Wuhan’s administrative region.
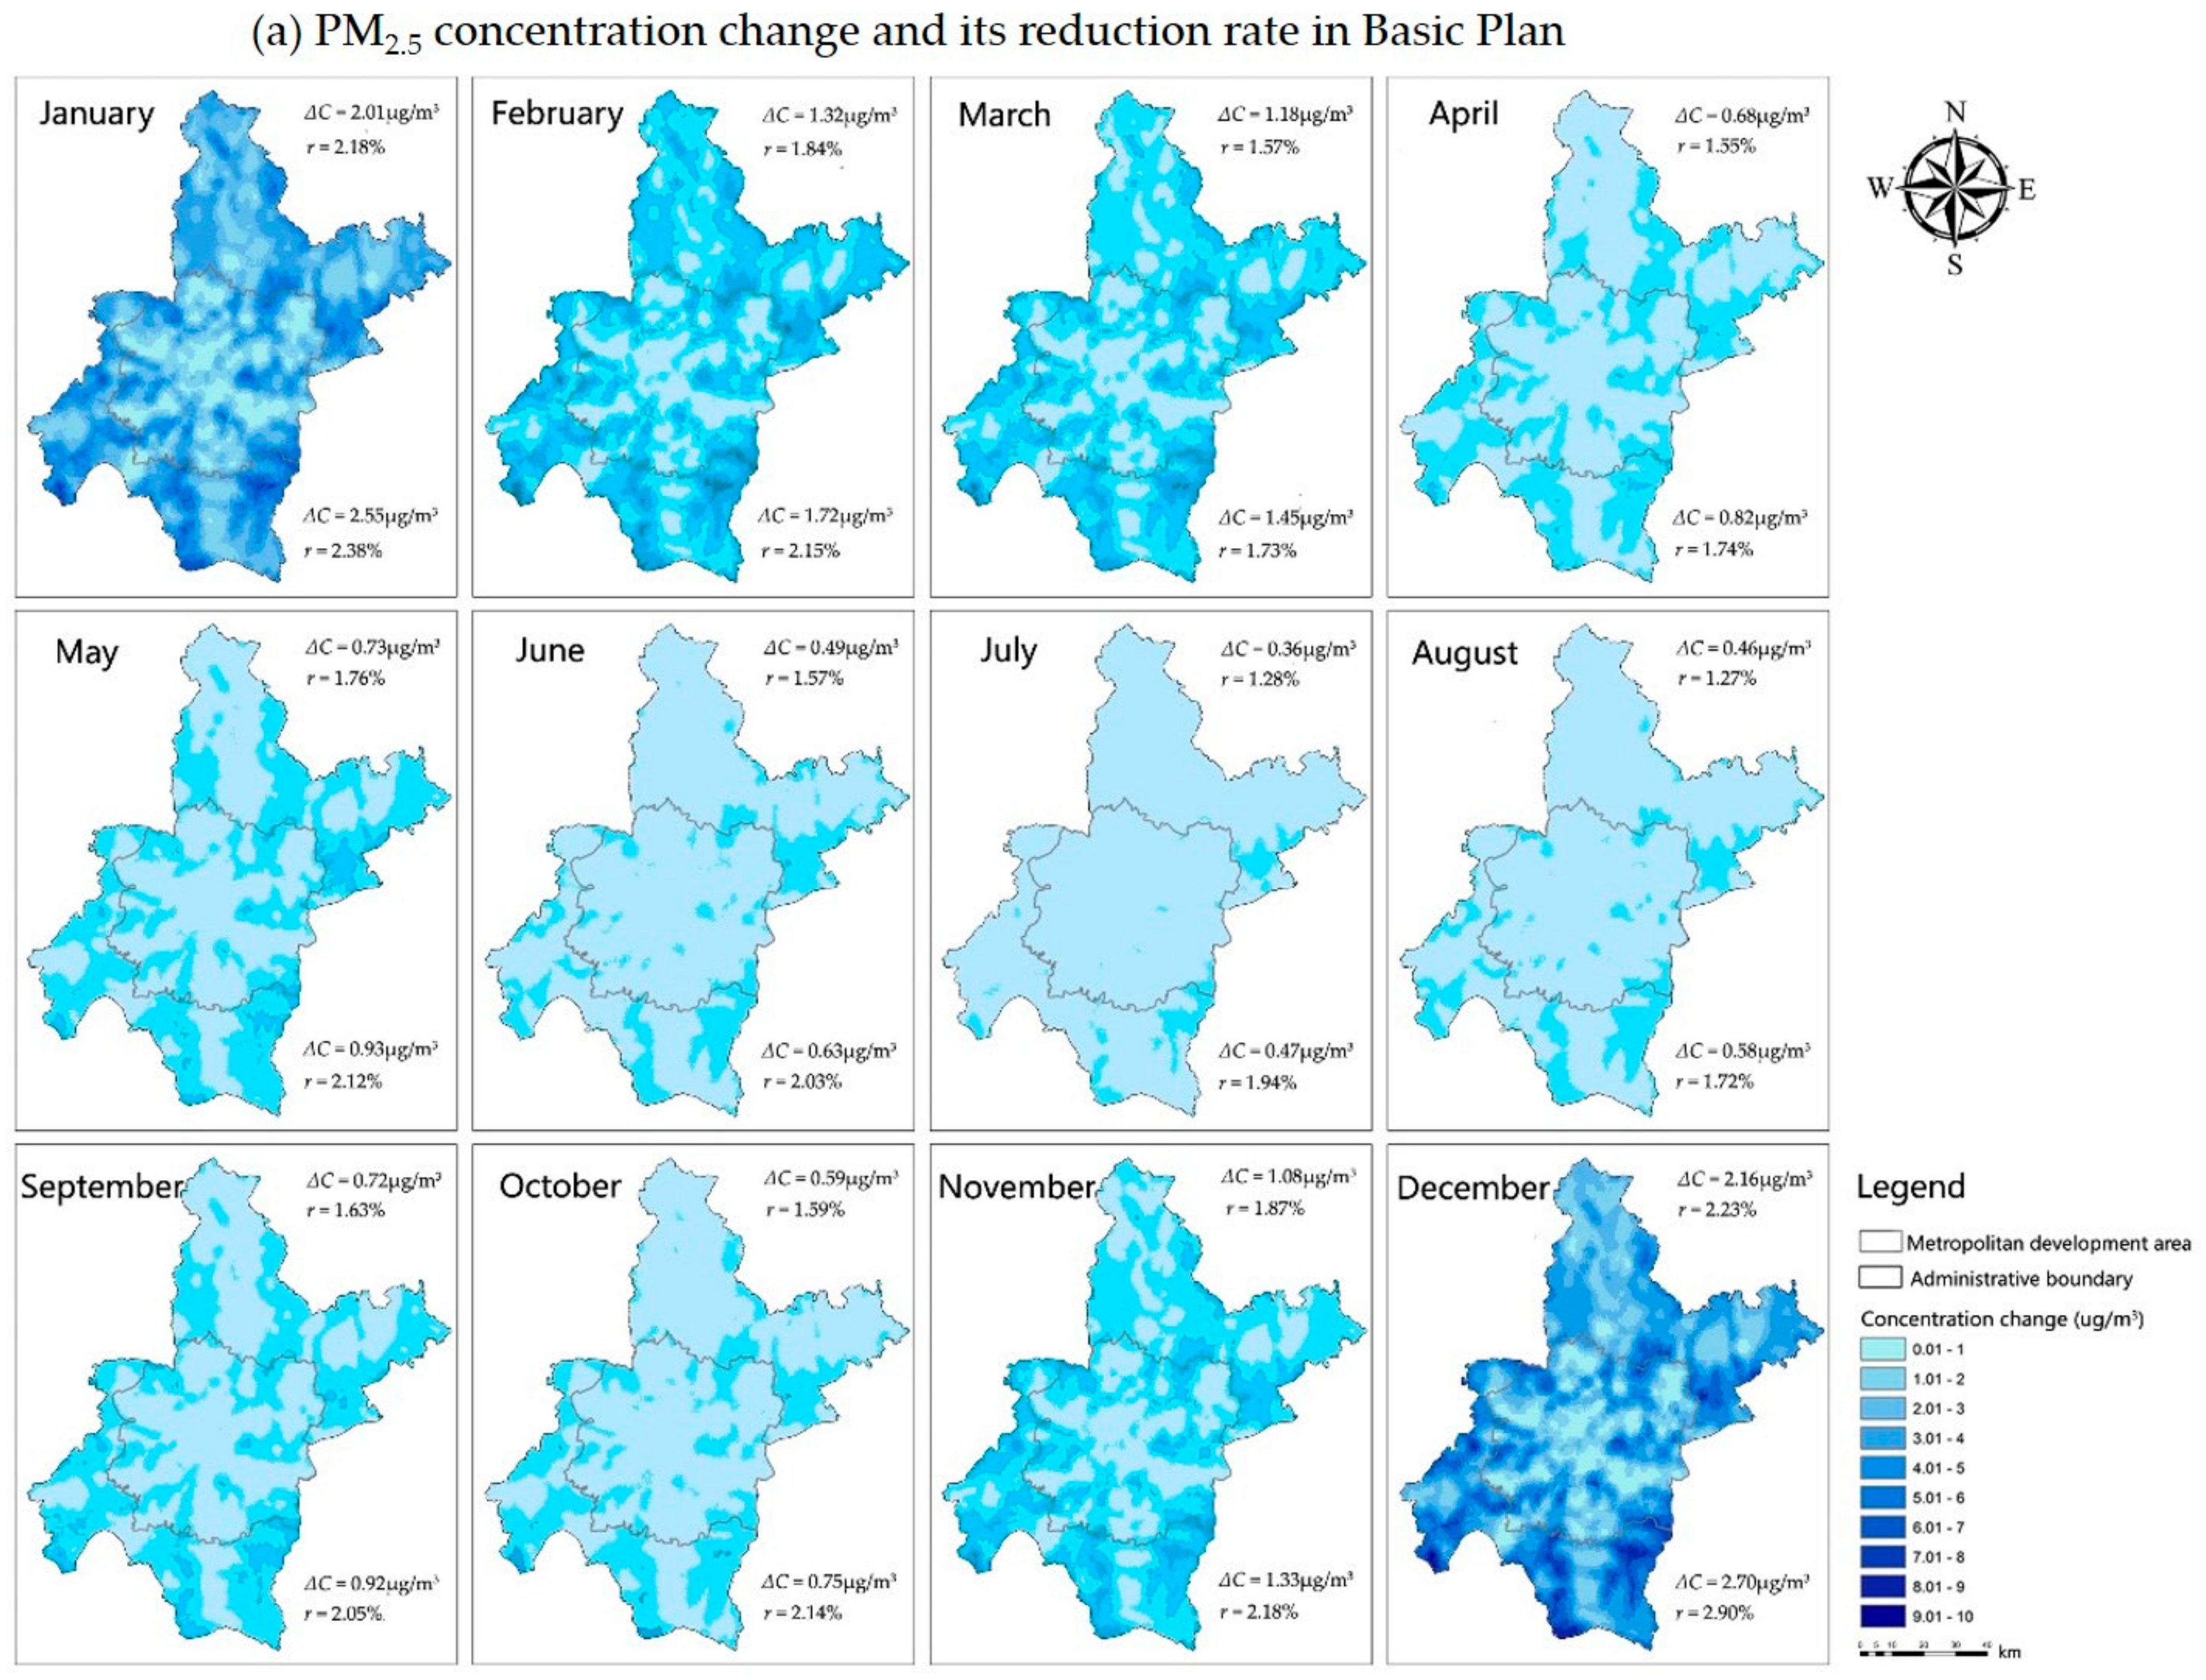
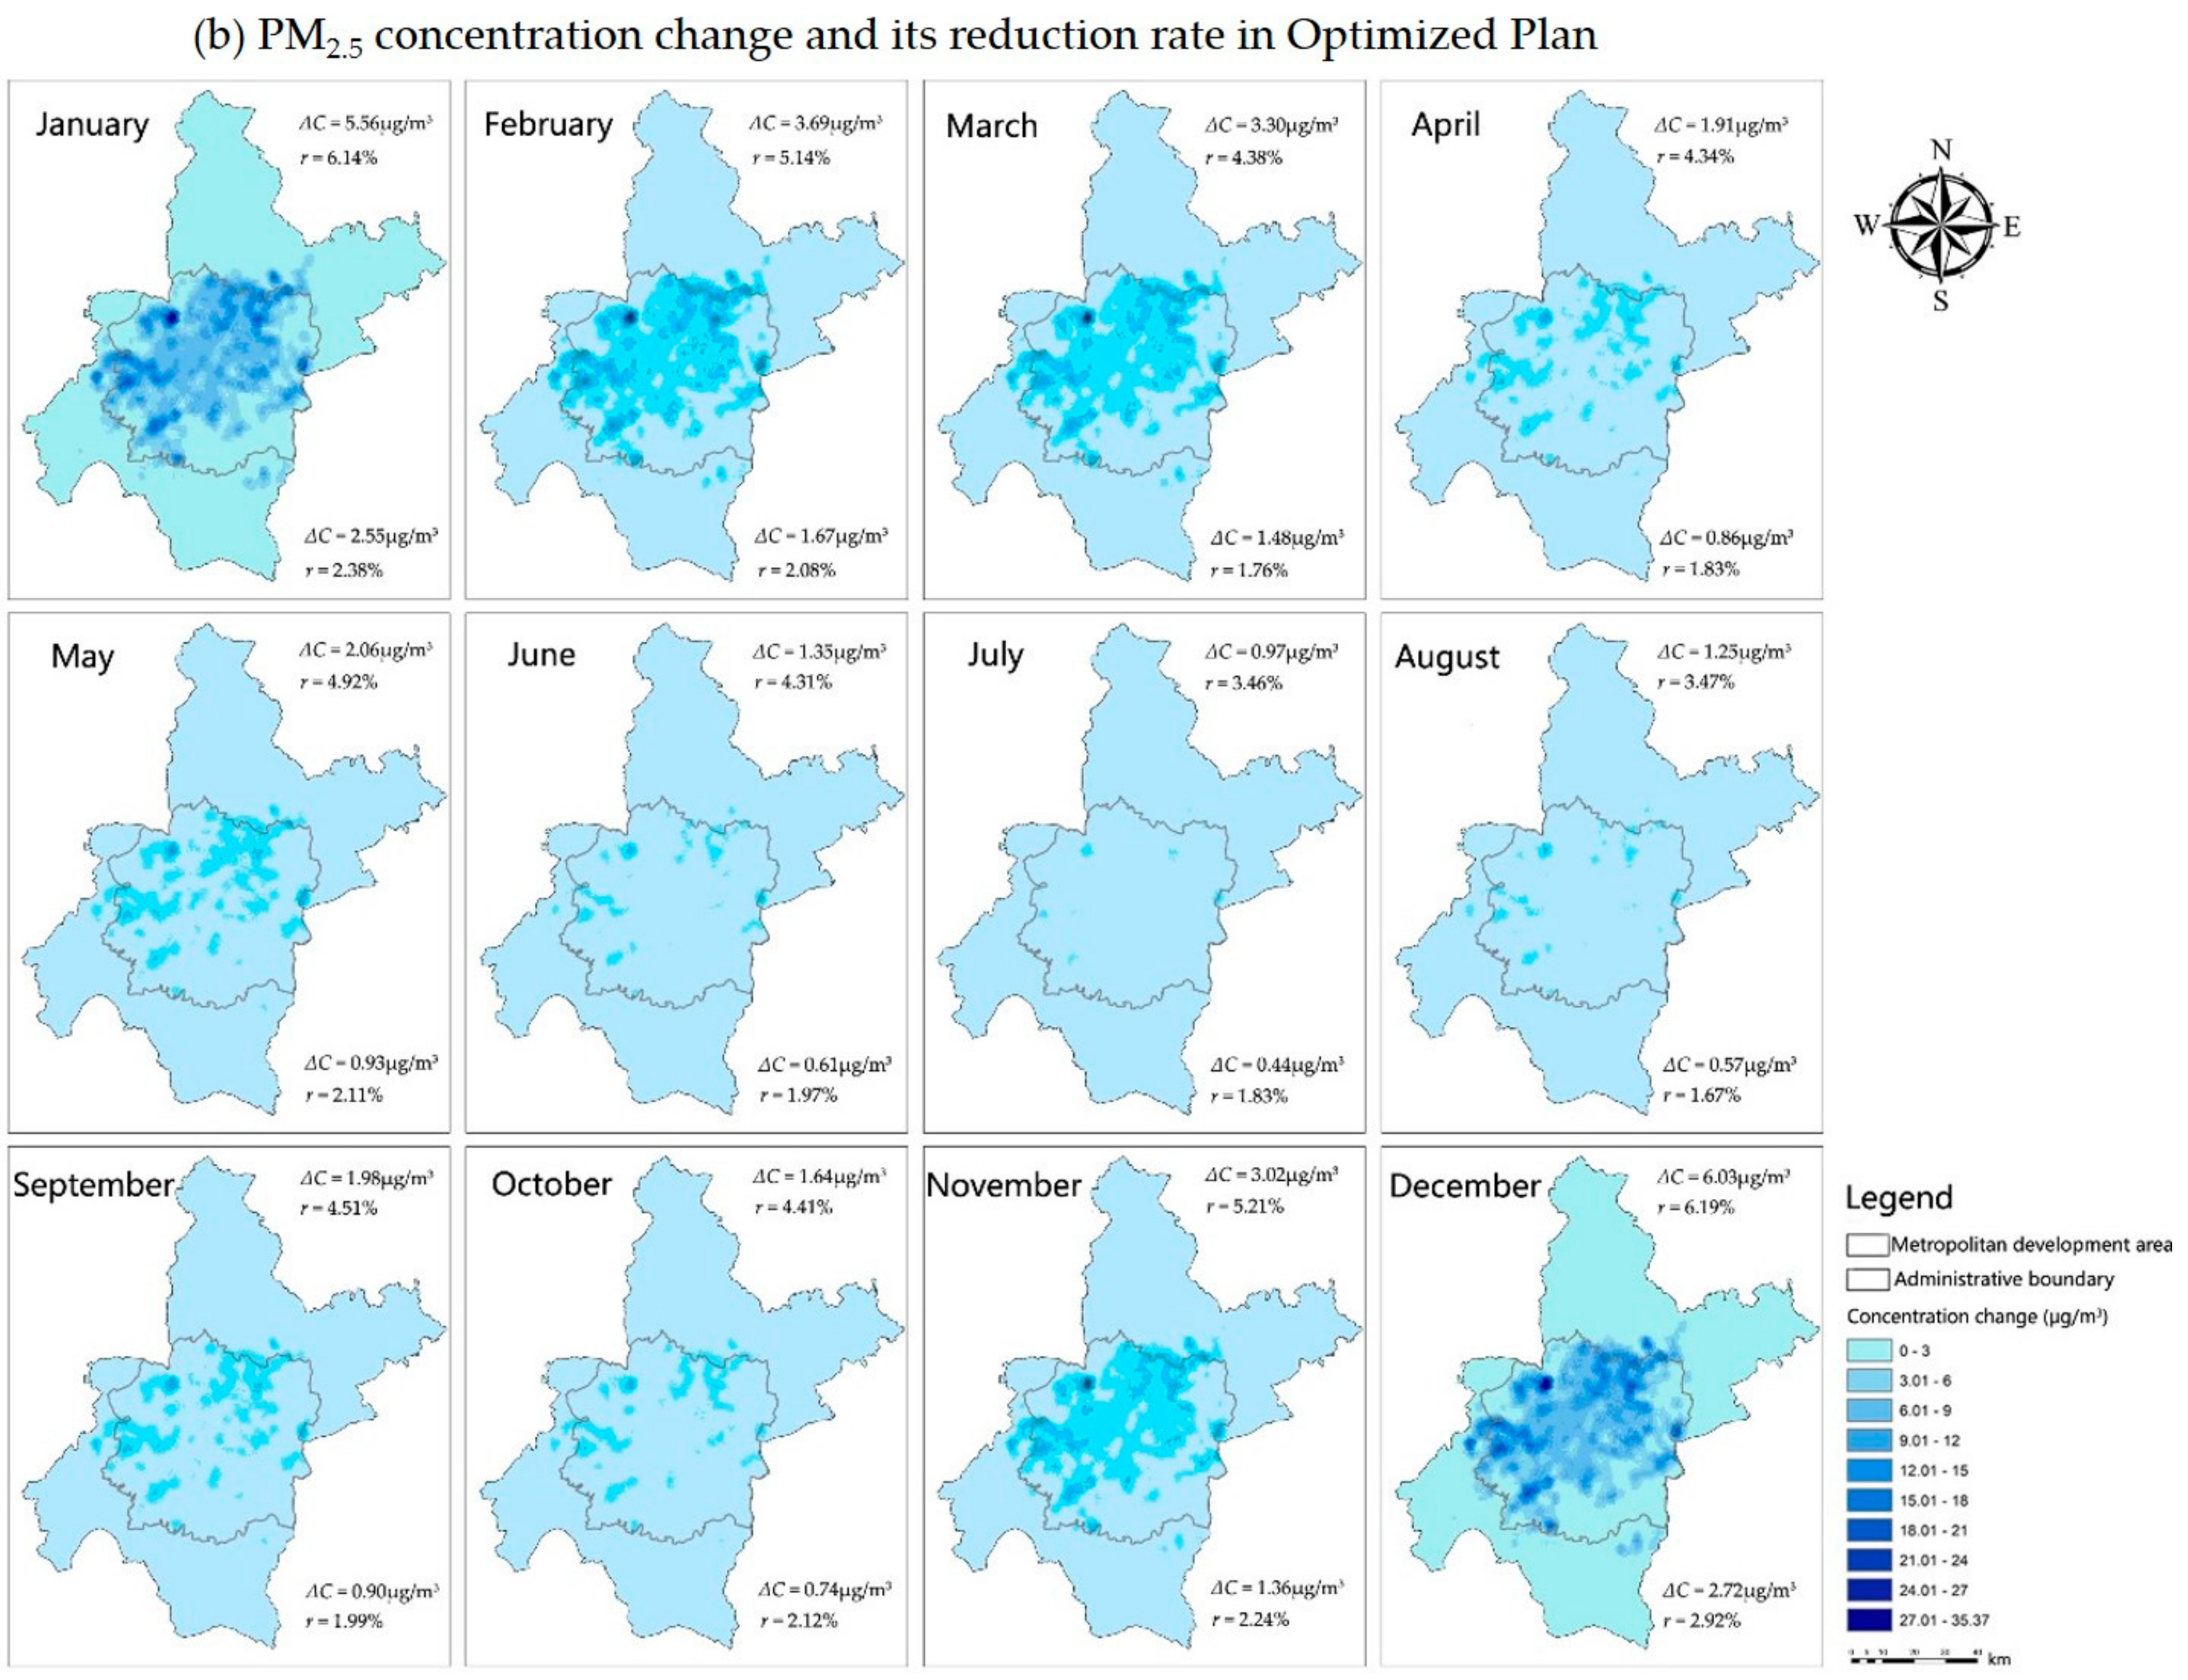
Figure 6.
Afforestation spatial pattern for PM2.5 removal in Wuhan city.

Table 1.
PM2.5 adsorption by sample leaves with different durations of PM2.5 concentration.
| PM2.5 Concentration (μg m−3) | Cinnamomum Camphor | Magnolia Grandiflora | Overall Sample | |||||||
|---|---|---|---|---|---|---|---|---|---|---|
| Time | 3 day | 2 day | 1 day | hour | W-PM2.5 | M-PM2.5 | W-PM2.5 | M-PM2.5 | W-PM2.5 | M-PM2.5 |
| 11 May | 42 | 48 | 45 | 31 | 0.0023 | 0.0029 | 0.0032 | 0.0060 | 0.0028 | 0.0045 |
| 13 May | 55.6 | 61 | 58 | 33 | 0.0018 | 0.0023 | 0.0040 | 0.0075 | 0.0029 | 0.0048 |
| 14 May | 64.3 | 64.5 | 71 | 68 | 0.0030 | 0.0037 | 0.0071 | 0.0134 | 0.0051 | 0.0086 |
| 16 May | 46 | 33.5 | 41 | 44 | 0.0011 | 0.0014 | 0.0023 | 0.0043 | 0.0017 | 0.0028 |
| 17 May | 36.3 | 41.5 | 42 | 45 | 0.0010 | 0.0012 | 0.0055 | 0.0104 | 0.0033 | 0.0058 |
| 18 May | 40.6 | 40.5 | 39 | 25 | 0.0009 | 0.0011 | 0.0031 | 0.0058 | 0.0020 | 0.0034 |
| 19 May | 35.3 | 32 | 25 | 20 | 0.0007 | 0.0008 | 0.0034 | 0.0064 | 0.0020 | 0.0036 |
| 20 May | 28.3 | 23.5 | 22 | 16 | 0.0006 | 0.0007 | 0.0023 | 0.0044 | 0.0015 | 0.0026 |
| 21 May | 29.6 | 32 | 42 | 60 | 0.0033 | 0.0041 | 0.0040 | 0.0075 | 0.0036 | 0.0058 |
| 22 May | 40 | 49 | 56 | 96 | 0.0012 | 0.0015 | 0.0034 | 0.0063 | 0.0023 | 0.0039 |
| 23 May | 48 | 51 | 46 | 46 | 0.0007 | 0.0009 | 0.0023 | 0.0044 | 0.0015 | 0.0026 |
| 24 May | 50.6 | 48 | 50 | 49 | 0.0008 | 0.0010 | 0.0045 | 0.0083 | 0.0026 | 0.0047 |
| 27 May | 19.6 | 16 | 20 | 16 | 0.0005 | 0.0007 | 0.0007 | 0.0013 | 0.0006 | 0.0010 |
| 28 May | 17 | 19.5 | 19 | 29 | 0.0004 | 0.0005 | 0.0013 | 0.0023 | 0.0008 | 0.0014 |
| 29 May | 20.3 | 20.5 | 22 | 36 | 0.0014 | 0.0018 | 0.0016 | 0.0029 | 0.0015 | 0.0023 |
Note: W unit is g, M unit is g m−2.
© 2019 by the authors. Licensee MDPI, Basel, Switzerland. This article is an open access article distributed under the terms and conditions of the Creative Commons Attribution (CC BY) license (http://creativecommons.org/licenses/by/4.0/).
Share and Cite
MDPI and ACS Style
Zhou, Y.; Liu, H.; Zhou, J.; Xia, M. GIS-Based Urban Afforestation Spatial Patterns and a Strategy for PM2.5 Removal. Forests 2019, 10, 875. https://doi.org/10.3390/f10100875
AMA Style
Zhou Y, Liu H, Zhou J, Xia M. GIS-Based Urban Afforestation Spatial Patterns and a Strategy for PM2.5 Removal. Forests. 2019; 10(10):875. https://doi.org/10.3390/f10100875
Chicago/Turabian StyleZhou, Yejing, Helin Liu, Jingxuan Zhou, and Meng Xia. 2019. "GIS-Based Urban Afforestation Spatial Patterns and a Strategy for PM2.5 Removal" Forests 10, no. 10: 875. https://doi.org/10.3390/f10100875
Note that from the first issue of 2016, this journal uses article numbers instead of page numbers. See further details here.