Article

The Profitability of Cross-Cutting Practices in Butt-Rotten Picea abies Final-Felling Stands

1
Stora Enso, Wood Supply Finland, P.O. Box 309, FI-00101 Helsinki, Finland
2
School of Forest Sciences, University of Eastern Finland, P.O. Box 111, FI-80101 Joensuu, Finland
*
Author to whom correspondence should be addressed.
Forests 2019, 10(10), 874; https://doi.org/10.3390/f10100874
Submission received: 22 August 2019 / Revised: 25 September 2019 / Accepted: 30 September 2019 / Published: 5 October 2019
(This article belongs to the Section Forest Ecophysiology and Biology)

Abstract

:
Research Highlights: This study offers new information on the cross cutting of decayed stems with the sounding of short (0.5 m) offcuts and the bucking of longer (3.0 m) butt-rotten poles. Background and Objectives: The root and butt-rot fungus Heterobasidion annosum sensu lato (Fr.) Bref. causes wood quality damage to trees in softwood forests. When timber is harvested in butt-rotten forests, it is essential that the decayed part of the tree is recognized and cut away from a stem, while the healthy and good quality log section of a stem is cross cut with precision sawlogs. The objective of the study was to investigate the impact of two off-cutting methods on stem processing time, cutting productivity, sawlog volume, and commercial value at the roadside landing when harvesting timber from the butt-rotten Norway spruce (Picea abies (L.) Karst.) final-felling forests. Materials and Methods: The length of the short offcuts used was 0.5 m. The results of the cross-cutting practices were compared to the decayed pulpwood poles of 3 m from the butt of the rotten stems. Time and motion studies were carried out in stands before the profitability calculations. The study data consisted of 1980 Norway spruce sawlog stems. Results: Sounding of the short offcuts added significantly to the stem processing time of butt-rotten stems, but the sawlog volume and the timber value recovery of the stems were higher than those of the decayed pulpwood poles of 3 m. Conclusions: The study concluded that sounding of butt-rotten Norway spruce stems with one to three offcuts is economically profitable if the diameter of the decayed column at the stem stump’s height is small (≤5 cm). In contrast, when the width of the decay is larger (>5 cm), it is more profitable to first cross cut the decayed pulpwood pole of 3 m and then to observe the height of the decayed part of the stem.

1. Introduction

The root and butt-rot fungus Heterobasidion annosum sensu lato (Fr.) Bref. is widely distributed in the softwood forest stands of the Northern Hemisphere, particularly in Europe, North America, Russia, China, and Japan [1]. There are three native Heterobasidion annosum species in Europe: (1) Heterobasidion annosum sensu stricto (s.s.) has several hosts and causes mortality to pines (Pinus spp.), especially Scots pine (Pinus sylvestris L.), and root and butt rot to Norway spruce (Picea abies (L.) Karst.) and Sitka spruce (Picea sitchensis (Bong.) Carr.); (2) Heterobasidion parviporum Niemelä and Korhonen causes root and butt rot to Norway spruce; and (3) Heterobasidion abietinum Niemelä and Korhonen causes disease to many Abies species in southern Europe [1,2].
Heterobasidion spp. root and butt-rot fungus cause severe damage to forests and commercial losses to forest owners and the forest industry. For instance, in Europe, annual losses attributed to the growth reduction and degradation of wood are assessed approximately at €800 million [3,4,5]. In Finland, the damage caused by Heterobasidion spp. root and butt rot for Norway spruce has been calculated to be annually more than €40 million and around €5 million for Scots pine [6,7]. In the future, climate change is forecasted to enhance the living conditions of Heterobasidion spp. root and butt rot, which will expedite its spread in forests [8,9]. Hence, management of Heterobasidion spp. root and butt rot and the obstruction of the spread of Heterobasidion spp. rot can be regarded as one of the most significant challenges facing the modern forestry sector [10].
In addition to Heterobasidion spp., there are many other decay fungi (e.g., Armillaria spp., Stereum sanguinolentum (Alb. and Schw.: Fr.) Fr., Amylostereum spp., Climacocystis borealis (Fr.) Kotl. and Pouzar, Cylindrobasidium evolvens (Fr.) Jülich, Resinicium bicolor (Alb. and Schw.: Fr.) Parm., and Sistotrema brinkmannii (Bres.) J. Erikss.) that can cause butt rot in Norway spruce (e.g., [11,12,13,14,15,16,17,18,19,20,21]). However, the effect of these decay fungi on root and butt damage has been proven to be significantly smaller than that of Heterobasidion spp. in northern Europe (e.g., [12,13,14,15,16,22,23,24,25]). Therefore, this study is interested in limiting the negative effects of Heterobasidion spp. on stem damage in Finland.
Evidently, Heterobasidion spp. rot conquers by infecting the heartwood of a stem on its butt. Subsequently, it spreads higher in the stem to a height of several meters. For instance, in the research by Tamminen [22], the height of the decayed column averaged 3.5 m and the diameter of decay at a stump height of 17.8 cm, and thus the ratio between the height and width of the decayed column was 19.7:1. On the other hand, Arhipova et al. [21] reported that the height of the decayed column was, on average, 6.6 m, and the diameter of decay at the stump height was 40.0 cm (i.e., the ratio between the height and width of the decayed column was 16.5:1). In the study by Kallio [26], the mean butting off in the decayed stems was 5.8 m, and Swedjemark and Stenlid [27] measured that the decayed column can reach up to a height of 11 m in butt-rotten stems.
Consequently, Heterobasidion spp. root and butt rot spoils the most valuable part (i.e., the butt-log section) of the Norway spruce stems and transfers it to cheaper timber assortments (i.e., decayed spruce pulpwood or even very decayed spruce energy wood). Mäkelä et al. [28] reported that approximately 80% of decayed Norway spruce pulpwood removed from butt-rotten forest stands can be used for pulping, but the rest has to be utilized in energy generation. The stumpage price of the Norway spruce sawlog from the final fellings is currently (Summer 2019), in Finland, more than €60 m−3 solid over the bark (henceforth referred to only as m3), and the stumpage prices of the decayed Norway spruce pulpwood or very decayed energy wood are around €12 m−3 and €4 m−3, respectively [29]. In Slovenia, Kadunc [30] determined that the incident of rot may decrease the value of usable timber by as much as €19 m−3. Tamminen [22] in Finland reported that in the worst case, Heterobasidion spp. root and butt rot can drop the sawlog removal in the stand by up to 37% (8.5% on average). Furthermore, Kallio [26] and Kallio and Tamminen [31] demonstrated a decrease in sawlog removals by 22% and 30% due to butt rot. In the study by Arhipova et al. [21] 6%–16% of the total standing volume of Latvian Norway spruce stands were found to be damaged by butt rot.
Hence, when stems are cut to length in stands damaged by Heterobasidion spp. root and butt rot, it is important in forestry that the decayed part of the stem is cut away, and the log section of the stem is cut with precision sawlogs. When operating in butt-rotten decayed forest stands, the harvester operator of a single-grip harvester has to use a manual log bucking instead of automated bucking, and he/she can apply two off-cutting methods. The operator can:
(1)
Cross cut a decayed pulpwood (or energy wood) pole of 3 m for pulping (or energy generation);
(2)
Sound short waste pieces (or offcuts or cull pieces).
The offcuts used are typically 0.3 m–1.0 m in length and will remain on the ground at the harvesting site after the logging operation. Generally, the cross cutting of one decayed pulpwood (or energy wood) pole of 3 m or several short offcuts is enough to reach the healthy wood material in the stem. However, there also exists a type of butt-rotten Norway spruce stem in which two or three decayed poles of 3 m must be cut away to reach the healthy wood in the stem (cf., [21,27]). At present, there are no comprehensive instructions for harvester operators to cross cut stems in butt-rotten forest stands. It can be presupposed that when cross cutting many offcuts, the stem processing time increases, and cutting productivity decreases, while the sawlog removal and the value of the recovery of timber from the stand accelerate (cf., [30,32,33,34,35,36]). Nevertheless, we currently have no information about the profitability of cross-cutting practices in different butt-rotten Norway spruce stands. For instance, is it profitable to directly cut a butt-rotten pole of 3 m for pulping, or to sound one or several offcuts from the butt of a rotten tree stem? What is the number of offcuts when a harvester operator cross cuts them?
The objective of this study was to investigate the impact of two off-cutting methods on stem processing time consumption and productivity. In this analysis, sounding of short offcuts (0.5 m) was compared to the cross cutting of the pulpwood poles of 3 m. In this way, we determined how much the sawlog volume removal and the monetary value recovery of timber can be upgraded when sounding offcuts from the butts of rotten Norway spruce stems. The ultimate aim was to clarify the cross-cutting practices of stems for diverse decayed Norway spruce stands afflicted by butt rot. In addition, the advance of butt rot in Norway spruce stems was detected in the study.

2. Materials and Methods

2.1. Collection of Time and Motion Data

There were four single-grip harvesters (John Deere 1270G (by John Deere Forestry Ltd., Joensuu, Finland), Komatsu 911.5 (by Komatsu Forest AB, Umeå, Sweden), Komatsu 931.1 and Ponsse Ergo (by Ponsse Plc, Vieremä, Finland)) and five harvester operators used in the time and motion studies. Two harvester operators worked with the John Deere 1270G harvester. All harvesters were six wheeled machines, and their work weight was around 20 tonnes, with an engine power of 170–210 kW (Table 1), i.e., they were the typical final-felling harvesters used in Finland. The harvester operators were experienced, and each of them had at least nine years of work experience in mechanized cutting work. Each operator said that he cross cuts several decayed butt-rotten stems during each work shift, but the number of stems to be sounded varied greatly by harvesting site.
There were six Norway spruce-dominated final-felling stands in the research. The study stands were located in southern (Loviisa: 60°22′ N, 25°58′ E in WGS84, Myrskylä: 60°34′ N, 25°50′ E, Tuusula: 60°29′ N, 24°57′ E, Vihti: 60°27′ N, 24°16′ E, and Orimattila: 60°54′ N, 25°40′ E) and eastern Finland (Savonlinna: 62°3′ N, 29°20′ E). A total of 2139 butt-rotten and healthy Norway spruce stems were cut in the time and motion studies. In addition, Scots pine, birch (Betula spp.), and European aspen (Populus tremula L.) stems were cut from the stands. A part of the stems cut by the harvester operators could not be bucked into sawlogs because of their small stem volume. Furthermore, some stems required the operator to cross cut more than one decayed pole of 3 m from the stem, i.e., the butt rot had risen high in the stem (for instance, seven–ten m) (cf., [21,27]). These kinds of Norway spruce stems were removed from the final study data because the objective was to compare the cross cutting of one decayed pole of 3 m to the sounding of short offcuts (0.5 m) from the butt of stems. Finally, the data consisted of 1980 Norway spruce sawlog stems.
The measurement and bucking data of the harvesters were collected after each cutting session. The data from the Komatsu harvesters were recorded as *.hpr files, the Ponsse harvester data were recorded as *.stm files, and the John Deere harvester data were *.pri files (cf., [37,38]). The files included stem- and log-specific information (e.g., stem number, tree species, volume (including all logs cut from a stem), height, diameter at breast height (d1.3), and diameter at stump height (d0) (only from the Komatsu harvesters), as well as the volume, length, top and butt diameters, and the timber assortment of each log cut).
In order to investigate the impact of off-cutting practices on stem processing time consumption and productivity, a basic work study method was applied [39]. Based on the time and motion data, the sounding of short offcuts (0.5 m) was compared to the cross cutting of the pulpwood pole of 3 m. When the time and motion studies were conducted, the actual target was that the harvester operators process decayed stems as normally as possible—like the daily cross cut stems in butt-rotten Norway spruce stands. Subsequently, the following cross-cutting instructions for the operators were given: “Sound offcuts of around 0.5 m if you estimate that the height of the decayed column is less than 2.5 m based on the stump’s surface. Otherwise, cross cut the poles of 3 m until the decayed wood is no longer noticeable in the stem”. In addition, the harvester operators cross cut the healthy Norway spruce stems applying the bucking proposals via the harvester computer, i.e., they used the automated bucking option (cf., [34,35]). The maximum numbers of offcuts sounded was five in this study. Hence, there were, in total, seven different cross-cutting practices tested in the time and motion studies:
(1)
Automated cross cutting of healthy stem
(2)
Manual cross cutting of one pole of 3 m from a butt-rotten stem
(3)
Manual sounding of one offcut from a butt-rotten stem
(4)
Manual sounding of two offcuts from a butt-rotten stem
(5)
Manual sounding of three offcuts from a butt-rotten stem
(6)
Manual sounding of four offcuts from a butt-rotten stem
(7)
Manual sounding of five offcuts from a butt-rotten stem.
In cross-cutting practices 2–7, after the manual cross cutting of one decayed pole of 3 m or the sounding of 1–5 offcuts, the operators bucked one to four sawlogs normally by applying automated bucking from the decayed stems. The sawlog lengths were mainly 3.7 m–5.5 m, with increments of 0.3 m. Some shorter (3.1 m and 3.4 m) and longer (5.8 m and 6.1 m) sawlog lengths were also applied. The minimum top diameter of the Norway spruce sawlogs was 16 cm. The lengths of the pulpwood were 2.7 m–4.5 m. The minimum top diameter of the Norway spruce pulpwood was 7 cm.
The work cycle (i.e., all the work elements for processing one butt-rotten or healthy spruce stem) distribution was based on the work cycle distribution used in the work studies by Nuutinen et al. [40] and Palander et al. [41] (Table 2). Delays in cutting work (i.e., personal breaks of the operator, repair or maintenance of the harvester, or breaks due to the study) were not considered.
The cutting work was recorded on video using a GoPro Hero CHDHA-301 (https://gopro.com/en/fi/shop/hero/CHDHA-301.html) action video camera mounted on the inside of the windscreen of the study harvester cabins, and the time and motion study was carried out by analyzing the video material with a tool developed using the Microsoft Visual Basic language (https://www.microsoft.com/en-us/download/details.aspx?id=9639) in the Microsoft Excel software [42]. In this analysis tool, a video clip was browsed in an Excel sheet, and the work element boundaries were determined by the researcher during browsing. By using the time signature in the video clip, the start and end times of each work element were recorded together with the code of the work element. The video clip could be viewed quickly, forwarded and reversed, or viewed in slow motion when needed. The accuracy of the system was one second (s).

2.2. Detecting Relationship between the Diameter and Height of the Decayed Column

After the time and motion studies, the dimensions of the sounded butt-rotten stems were manually measured. The following decay variables were measured from 202 stems: The diameter of the stem at stump height (d0), the diameter of the decay at stump height, and the height of the decayed column in the stem. Diameters of the stem and the decay at the stump height were measured as a cross-measure of 90 degrees, and the mean value was calculated. The height of the decayed column in the stem could be measured after splitting the last offcut of the stem by a lumberjack with chainsaw. The height of the decayed column in the stem was measured to the point after which the decay could no longer be visually observed.

2.3. Data Analysis

The variables relating to time consumption, sawlog removal, value recovery, and the height of the decayed column in the study were analyzed using percentage shares and distributions, mean values, standard deviations (std), and Spearman’s rank correlations (ρ). The study data were initially tested for the assumption of a normal distribution by a Kolmogorv-Smirnov test. Based on the results of the test, the study data did not comply with normal distribution. Since the material was not distributed normally, non-parametrical tests—Mann-Whitney test (U) and Kruskal-Wallis one-way ANOVA test (χ2)—were used in the statistical analysis of the study. The test level with a significance of 0.05 was applied. The different transformations were tested in order to achieve symmetrical residuals for the regression models and to ensure the statistical significance of the coefficients. Furthermore, the different functions were tested in order to fit the best curve for the description of the sawlog removal and value recovery of the stem, as well as the stem processing time consumption and productivity. All statistical analyses of the data were conducted with the IBM SPSS Statistics 21 software (https://www.ibm.com/support/pages/ibm-spss-statistics-21-documentation).

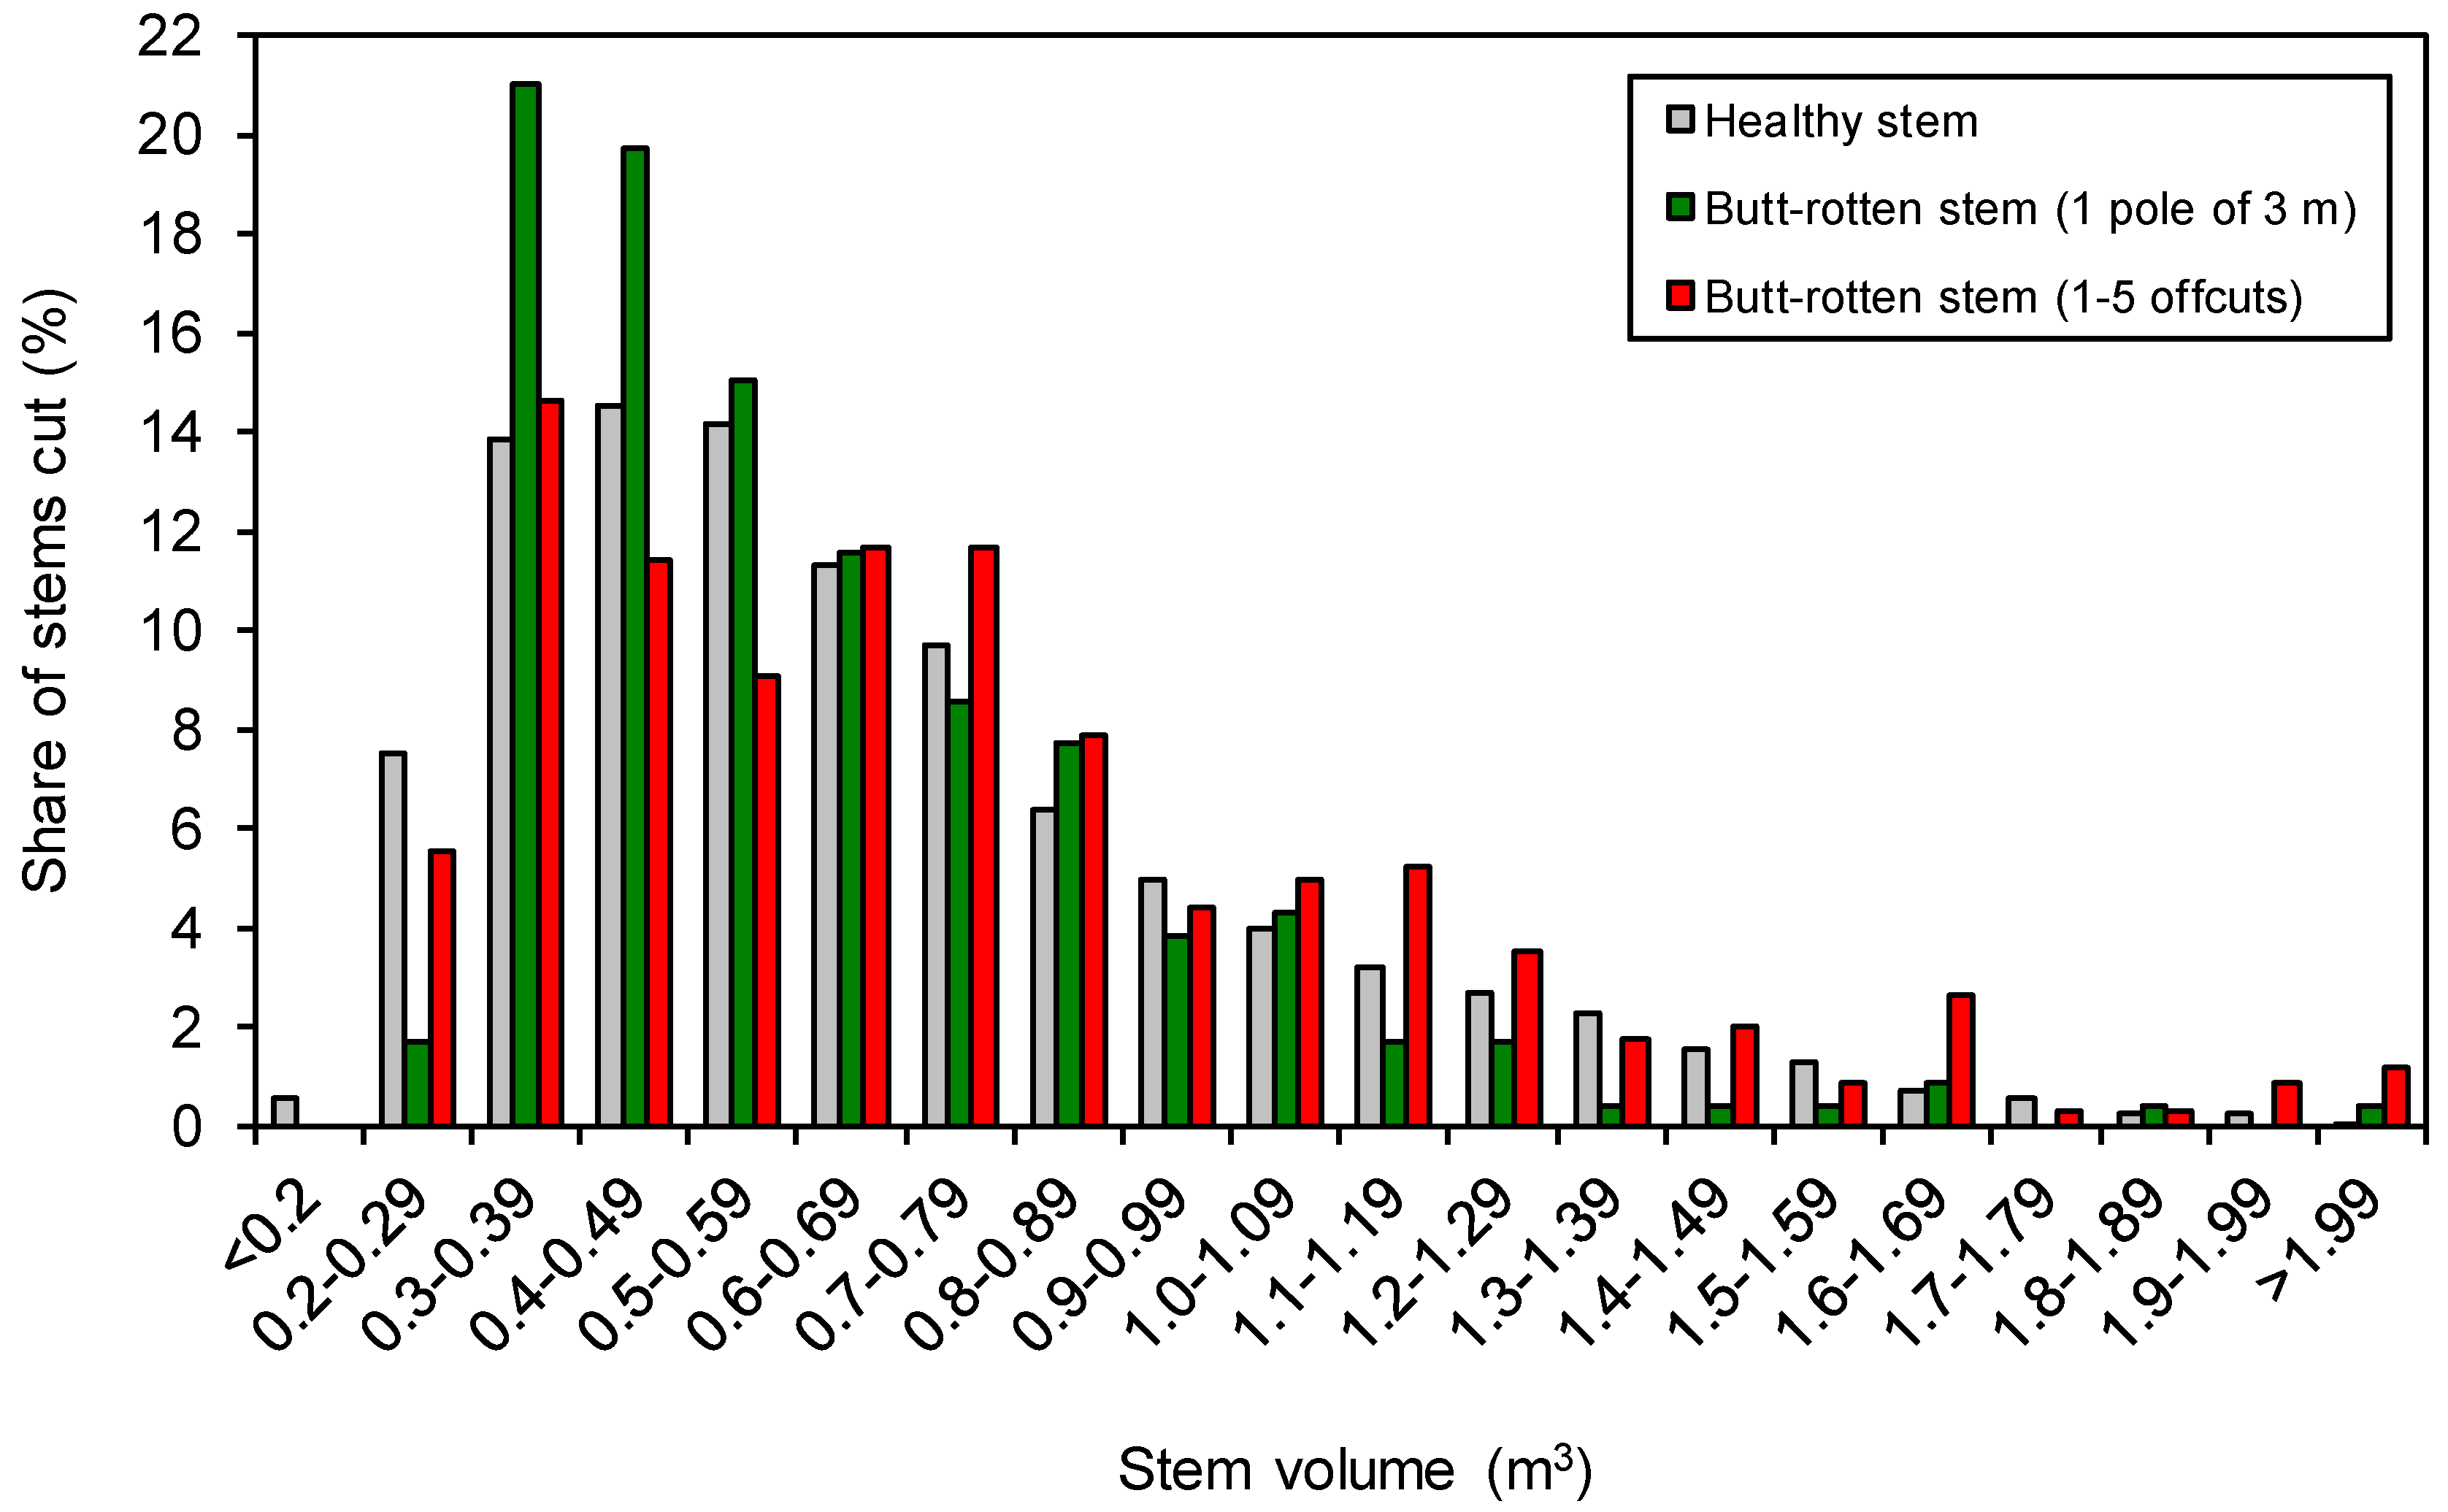
2.4. Description of Study Data

The realized length of the offcuts averaged 0.508 m (std: 0.103 m) in the study. The top diameter of the offcuts was, on average, 31.2 cm (std: 6.9 cm), and the mean volume was 0.044 m3 (std: 0.020 m3). The corresponding figures for the decayed butt-rotten poles of 3 m were, on average, 2.926 m (std: 0.147 m), 24.7 cm (std: 4.4 cm), and 0.172 m3 (std: 0.064 m3), respectively.
The total final data was 1980 butt-rotten and healthy Norway spruce stems, while the majority (71.0%) of the stems (1405) were healthy. There were 233 stems in which one decayed pole of 3 m was cross cut, and, after that, from one to four sawlogs. The number of the sounded offcut-stems was 342, of which the number of the stems with one offcut was 188, 88 had two offcuts-stems, 31 had three offcuts-stems, 27 had four offcuts-stems, and eight had five offcuts-stems. The proportion of the butt-rotten decayed stems was thus 29.0% of the total data stems. Total removal in the study was 1359.7 m3, of which the healthy sawlog removal was 1036.8 m3 and the healthy pulpwood removal was 256.2 m3. The cutting volumes of the offcuts and decayed poles of 3 m were 26.6 m3 and 40.1 m3, respectively. Hence, the share of the butt-rotten wood (i.e., 26.6 m3 and 40.1 m3) was 6.4% of the sawlog removal realized in the study.
The volumes of Norway spruce stems cut were mainly 0.3 to 0.9 m3, but large stems (>1.0 m3) were also cut in the time and motion studies (Figure 1). In the total final data, the stem volume averaged 0.687 m3 with a diameter at breast height (d1.3) of 27.2 cm. The stem volume of the healthy stems was, on average, 0.680 m3 (d1.3 27.0 cm), and the corresponding figures for the stems of one pole of 3 m and the offcut-stems were 0.624 m3 (d1.3 26.6 cm) and 0.757 m3 (d1.3 28.1 cm), respectively. There were statistically significant differences between the stem distributions of the healthy, butt-rotten (1 pole of 3 m), and butt-rotten (1–5 offcuts) stems in the volume (χ2 = 15.1; p < 0.001) and diameter (χ2 = 9.0; p < 0.05).

2.5. Modelling Stem Processing Time and Productivity

For modelling the stem processing time consumption (y1), the time elements of the Boom-out, Felling, Delimbing and cross-cutting, and Boom-in (Table 2) were aggregated. The stem processing time was modelled by applying a non-linear regression analysis with the stem volume as the independent variable. Cross-cutting practice was used as the dummy variable (Equation (1)).
y1 = a + bx + cx2 + dx3 + ekd
where y1 is the stem processing time (s stem−1); x is the stem volume (m3); kd is the dummy variable of cross-cutting practice, d = 1, …, 7): k1 = 1, if it is a healthy stem; otherwise, 0; k2 = 1, if it is a butt-rotten stem (one pole of 3 m); otherwise, 0; k3 = 1, if it is a butt-rotten stem (one offcut); otherwise, 0; k4 = 1, if it is a butt-rotten stem (two offcuts); otherwise, 0; k5 = 1, if it is a butt-rotten stem (three offcuts); otherwise, 0; k6 = 1, if it is a butt-rotten stem (four offcuts); otherwise, 0; k7 = 1, if it is a butt-rotten stem (five offcuts); otherwise, 0; a is the constant; b, c, d and e are the coefficients of the variables.
When in the time and motion studies all tree species of final-felling stands were cut and only Norway spruce sawlog stems were used, the time consumption of movement and miscellaneous times (i.e., seconds per stem harvested from the stand) of the study could not be utilized. Therefore, the time consumption of movement and miscellaneous times by Kärhä et al. [42] were used for the final fellings: A movement time of 6.52 s stem−1 (y2) (under the assumption that the density of the stems harvested is 450 stems ha−1) and a miscellaneous time of 1.50 s stem−1 (y3). The total effective time consumption of the cutting work for a stem by cross-cutting practice was calculated by Equation (2):
T = y1 + y2 + y3
where T is the total effective time consumption of the cutting work (s stem−1); y1 is the stem processing time (s stem−1); y2 is the moving time (6.52 s stem−1); and y3 is the miscellaneous time (1.50 s stem−1).
The effective time consumption was converted to the effective hour productivity of stem cutting (P) by applying Equation (3):
P = 3600 × (x/T)
where P is the effective hour productivity of the stem cutting (m3 E0−1); x is the stem volume (m3); and T is the total effective time consumption of the cutting work (s stem−1).
The cutting productivity by cross-cutting practice was modelled in the study by applying a non-linear regression analysis with the stem volume as the independent variable (Equation (4)):
P = a + bx + cx2 + dx3
where P is the effective hour productivity of stem cutting (m3 E0−1); x is the stem volume (m3); a is the constant; and b, c and d are the coefficients of the variables.
When the productivity of forwarding was calculated, the effective (E0) hour productivity of the forest haulage was determined as a function of the stem volume of the removal, applying the productivity function of forwarding developed by Eriksson and Lindroos [43]. The average payload of the forwarder was 14.5 m3, and the average forwarding distance was 300 m (cf., [44]). The effective (E0) hour productivities of cutting (produced by this study) and forest haulage (by Eriksson and Lindroos [43]) were converted to operating (E15, including delayed times shorter than 15 min) hour (i.e., scheduled machine hour (SMH)) productivities via the coefficients of 1.393 and 1.136 (cf., [43,45]). The conversion from the under the bark volumes [43] to over the bark values was conducted via the coefficient of 1.140 (cf., [46]).

2.6. Calculating Harvesting Costs

The operating hour costs (€ E15−1) of wood harvesting were calculated using the Forest Machine Calculation Program of Metsäteho Ltd. (e.g., [42,45]). The operating hour costs included both time-dependent costs (capital depreciation, interest expenses, labor costs, insurance fees, administration expenses) and variable operating costs (fuel, repair and service, and machine relocations). Cost calculations were prepared for a harvester (weight around 20 tonnes) and a forwarder (carrying capacity: 13–14 tonnes; John Deere 1210G, Komatsu 855 and Ponsse Elk). The cost calculations were prepared using the following values: The purchase price of the harvester was 412,000 € (VAT 0%) and 315,000 € for the forwarder (VAT 0%). The depreciation period for the harvester was 4.6 years and 5.5 years for the forwarder (cf., [47]). An interest rate of 2.0% was also applied. The productivity per operating hour of cutting was 22.0 m3 E15−1 (final fellings) and 10.5 m3 E15−1 (thinnings) for the harvester (cf., [43]). In forwarding, the corresponding figures were 21.0 and 11.5 m3 E15−1, respectively (cf., [43]). The proportion of final fellings was 60% of the total volume of industrial roundwood harvested. For the harvester and forwarder, the annual industrial roundwood volumes harvested were standardized at 40,000 m3 in the cost calculations. The annual operating hours were 2615 E15-h for the harvester and 2534 E15-h for the forwarder.
The operator’s salary was €15.5 h−1 for the harvester operator and €14.5 h−1 for the forwarder operator, with indirect salary costs (59.0%) added (cf., [48]). The fuel consumptions of the harvester and forwarder were 11.5 and 10.5 dm3 E1−1, respectively (cf., [49]). The guide bar costs, chain costs, and chain oil costs were estimated to be €10,930 year−1. Repair and service costs were estimated to be €26,141 year−1 for the harvester and €17,762 year−1 for the forwarder; administration and maintenance cost €11,000 year−1 for the harvesting chain, and the insurance fees were €5,575 year−1 for the harvesting chain (cf., [50]). The relocation costs of the harvesting chain were €16,534 year−1 in the cost calculations. With the above figures factored in, the calculated operating hour costs for the harvester were €102.4 E15−1 and €79.5 E15−1 for the forwarder when harvesting wood with cross-cutting practices of one and two.
When sounding the offcuts (i.e., cross-cutting practices of 3–7), it was assumed that the guide bar costs, chain costs, and chain oil costs for the harvester would be 15% higher (increase of €1640 year−1) than those of the other cross-cutting practices tested (i.e., one and two). Further, the repair and service costs for the harvester were 10% higher (an increase of €2614 year−1) than using the cross-cutting practices of one and two. Thus, the calculated operating hour costs for the harvester were €104.0 E15−1 when sounding the offcuts.
The harvesting costs, including the cutting and forwarding unit costs in final-felling stands, were modelled as a function of the stem volume harvested, and the following harvesting cost functions were applied via cross-cutting practice when investigating the value recovery of timber in the study (Table 3).

2.7. Modelling of the Sawlog Removal and Value Recovery of the Stem

Modelling of the sawlog removals (SLRs) by cross-cutting practice was conducted by applying a linear regression analysis with the stem volume as the independent variable. The cross-cutting practice was used as the dummy variable (Equation (5)).
SLR = a + bx + ckd
where SLR is the sawlog removal of the stem (m3); x is the stem volume (m3); kd is the dummy variable of cross-cutting practice (cf. Equation (1)); a is the constant; and b and c are the coefficients of the variables.
The profitability calculations of the value recovery (VR) of the timber from the final-felling stand at a roadside landing were drawn up. The value recovery of the stem at the roadside landing was calculated by the cross-cutting practice as the sum of the stumpage prices and harvesting costs (Equation (6)) and modelled via cross-cutting practice by applying Equation (7). The stumpage prices used were €61.0 m−3 for the spruce sawlog, €22.3 m−3 for the healthy spruce pulpwood, and €12.0 m−3 for the butt-rotten decayed spruce pulpwood (cf., [29]). There was no stumpage price for the offcuts because they were left on the harvesting site in the study.
VR = (SPSL × xSL) + (SPHPW × xHPW) + (SPDPW × xDPW) + HC × (xSL + xHPW + xDPW)
where VR is the value recovery of the stem at the roadside landing (€ stem−1); SPSL is the stumpage price of the spruce sawlog (€61.0 m−3); SPHPW is the stumpage price of the healthy spruce pulpwood (€22.3 m−3); SPDPW is the stumpage price of the decayed spruce pulpwood (i.e., decayed poles of 3 m) (€12.0 m−3); xSL is the sawlog volume (m3); xHPW is the healthy pulpwood volume (m3); xDPW is the decayed pulpwood volume (m3); and HC is the harvesting costs (€ m−3).
VR = a + bx + ckd
where VR is the value recovery of the stem at the roadside landing (€ stem−1); x is the stem volume (m3); kd is the dummy variable of the cross-cutting practice (cf. Equation (1)); a is the constant; and b and c are the coefficients of the variables.

3. Results

3.1. Time Consumption

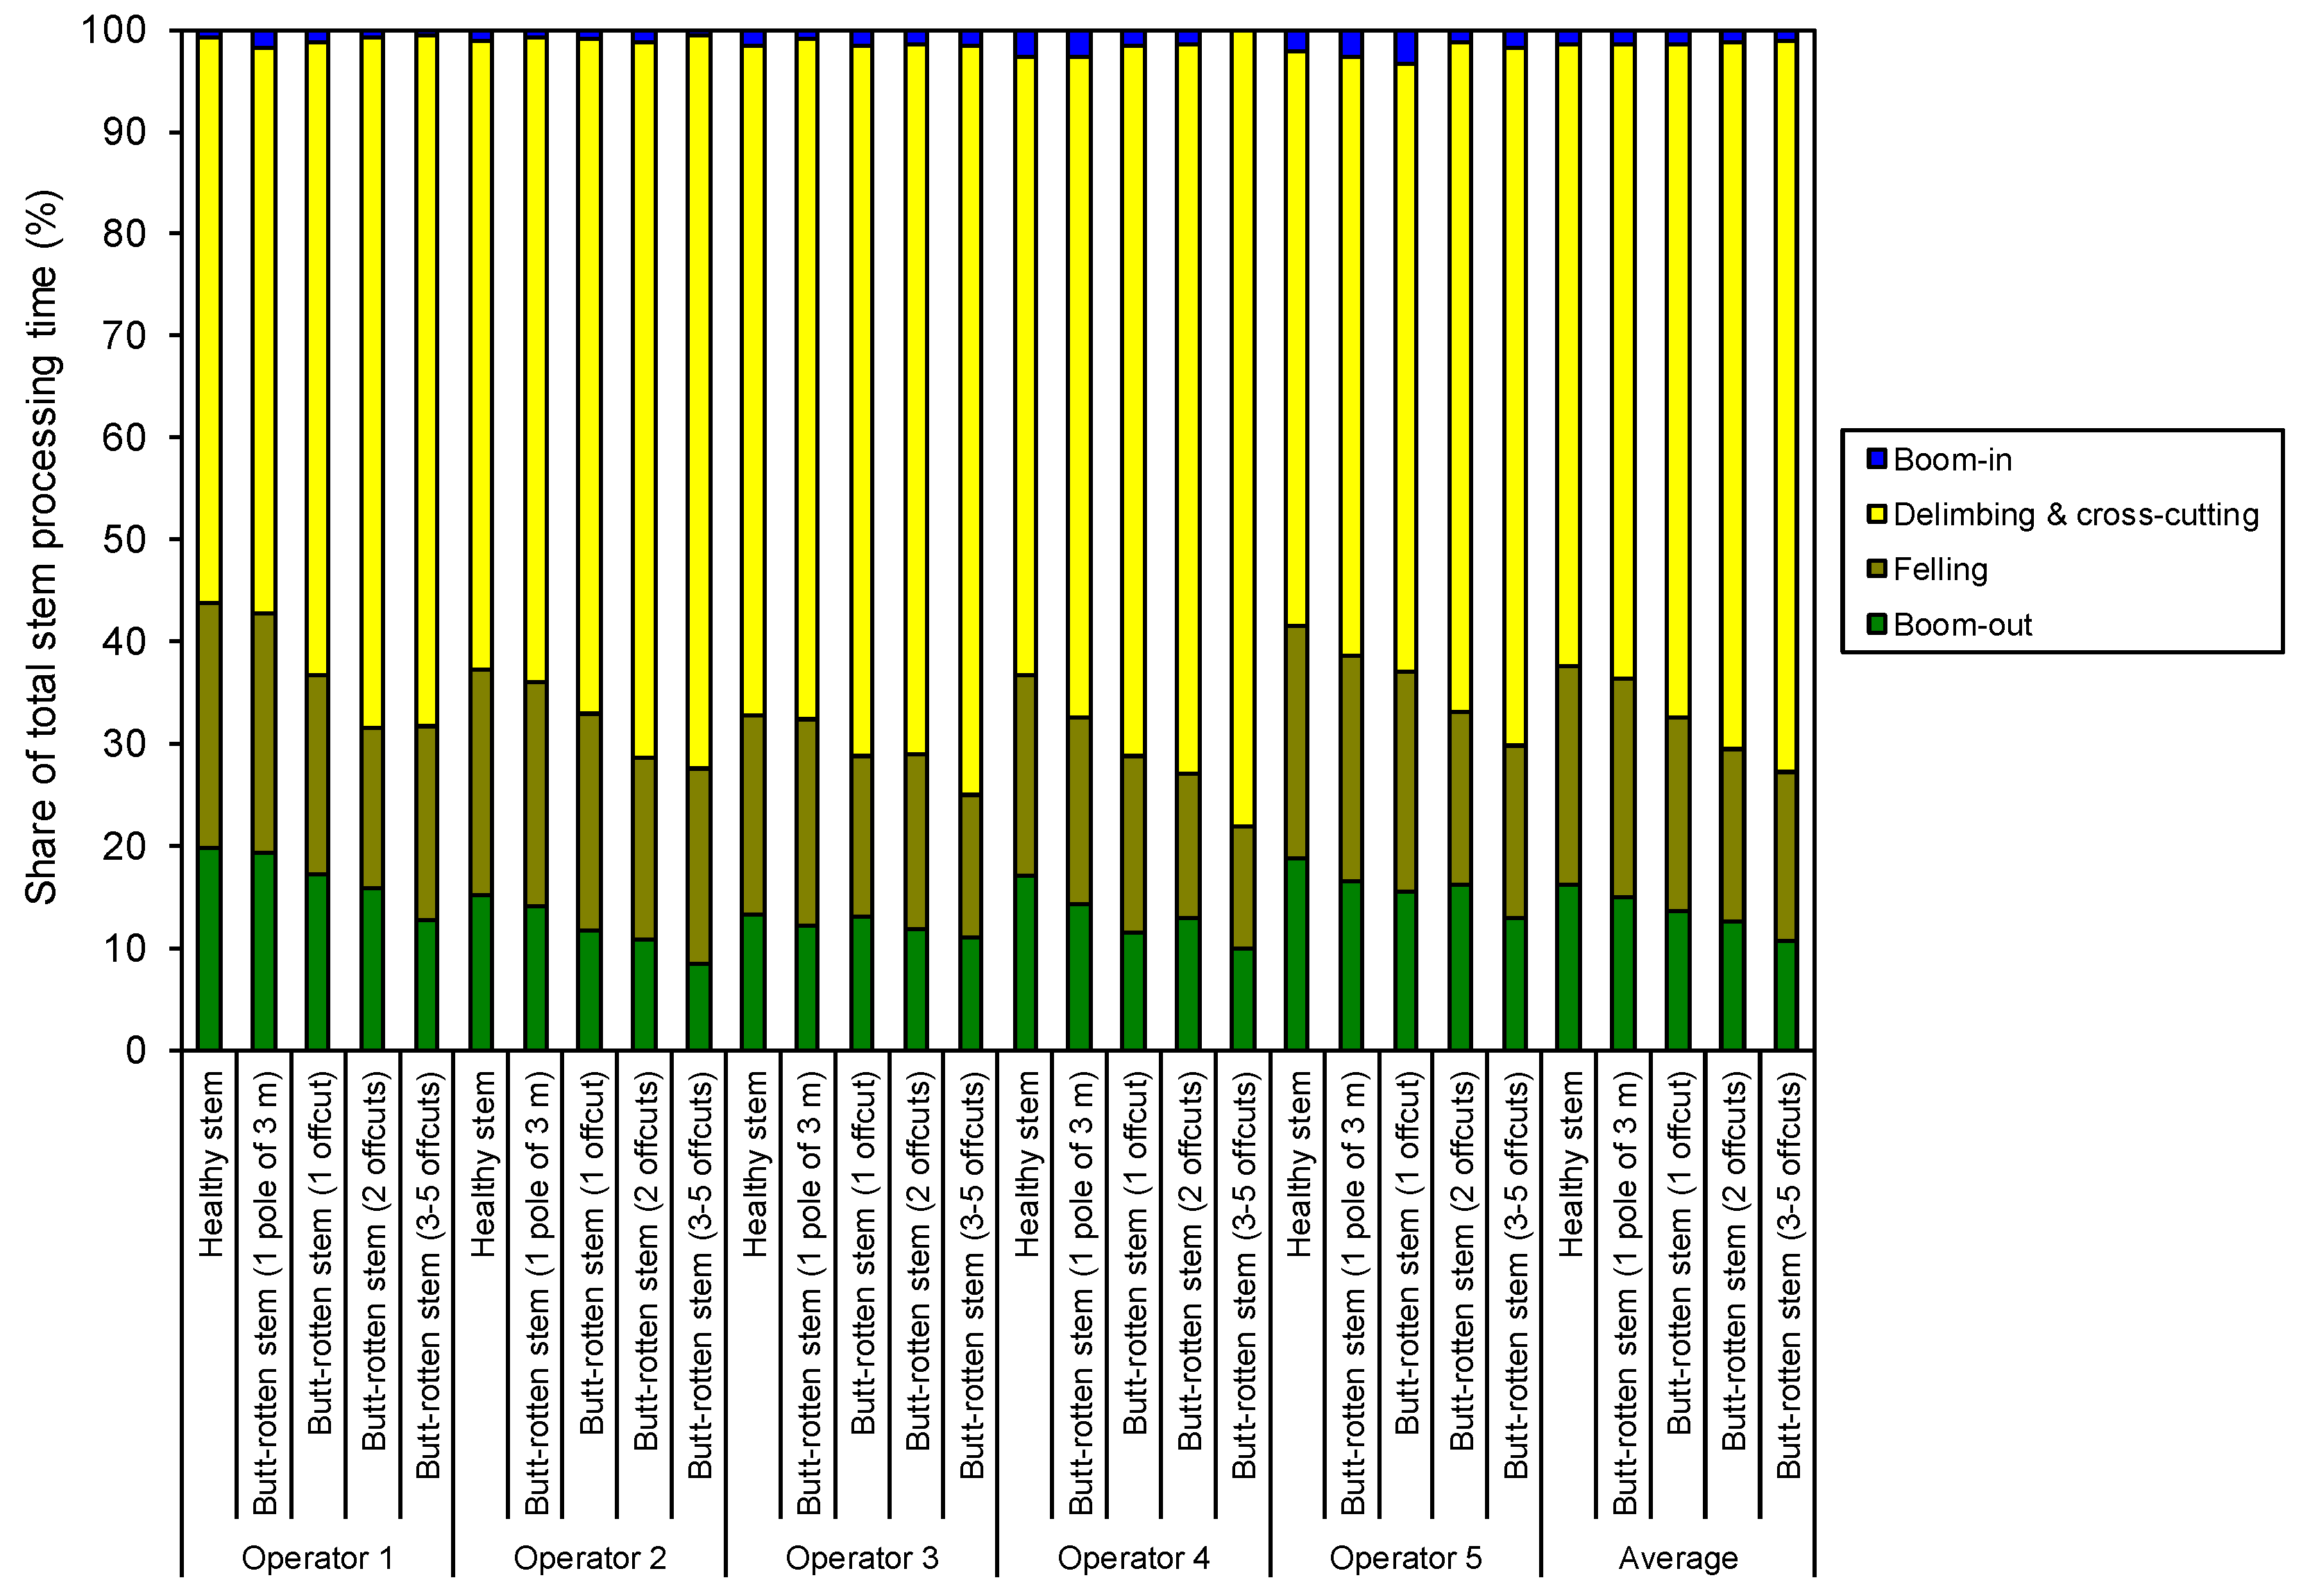
3.1.1. Distribution of the Stem Processing Time

The processing time, including the delimbing and cross-cutting times, took most of the total stem processing time with all cross-cutting practices and harvester operators (Figure 2). With the healthy Norway spruce stems, the share of the processing time from the total stem processing time averaged 61.0% and varied between 55.3% and 65.7% by the operator. When cross cutting one decayed pole of 3 m, the processing time was, on average, 62.1% with a variation range of 55.4%–66.6% by the operator. Further, when sounding one offcut, two offcuts, and 3–5 offcuts, the shares of processing time from the total stem processing time increased, averaging 66.0%, 69.3%, and 71.8% (Figure 2).
Based on the observations in the time and motion studies, it can be seen that the longer processing times with decayed stems consisted of four components: (1) The harvester operator’s evaluation time of the advance of decay in the stem. Here, a decision-making situation occurs: Should one try to sound an offcut, or directly cross cut one decayed pole of 3 m from the butt of the stem? (2) Extra movements of the harvester boom. In order to detect the advance of the decay in the stem, the operator had to move the stem processed with the boom closer to the cabin of the harvester; (3) Slower feeding. The cross-cutting offcuts and decayed poles of 3 m was conducted by applying a manual bucking option; subsequently, the feeding of the decayed stems was somewhat more cautious and slower than that of the healthy stems. Moreover, when feeding the stems there were back and forth movements with the harvester’s head on stems processed when the operator decided to try to sound an offcut instead of cutting the decayed pole of 3 m or observed that there was still decayed wood in the tree stem, even if he thought that it would already be heathy; (4) More cross-cutting sawings naturally took more processing time with decayed stems.
In turn, the shares of the time elements of the boom-out and felling decreased when sounding of the number of offcuts increased (Figure 2). The shares of the boom-out and felling were, on average, 13.6% and 19.0% of the total stem processing time when sounding one offcut. With three to five decayed offcuts, the corresponding figures were 10.7% and 16.5% of the total stem processing time. When bucking one decayed pole of 3 m, the times of the boom-out and felling averaged 15.0% and 21.5%, respectively. The share of the time element of the boom-in was almost at the same level with all cross-cutting practices tested, ranging from 1.0%–1.5%, on average.
As Figure 2 illustrates, there were statistically significant differences between the cross-cutting practices tested in the shares of processing times (χ2 = 275.6; p < 0.001), as well as in the shares of the times of the boom-out (χ2 = 16.2; p < 0.01) and felling (χ2 = 14.0; p < 0.01). In contrast, there was no statistically significant difference between the cross-cutting practices in the shares of the times of the boom-in (χ2 = 2.8; p = 0.589).

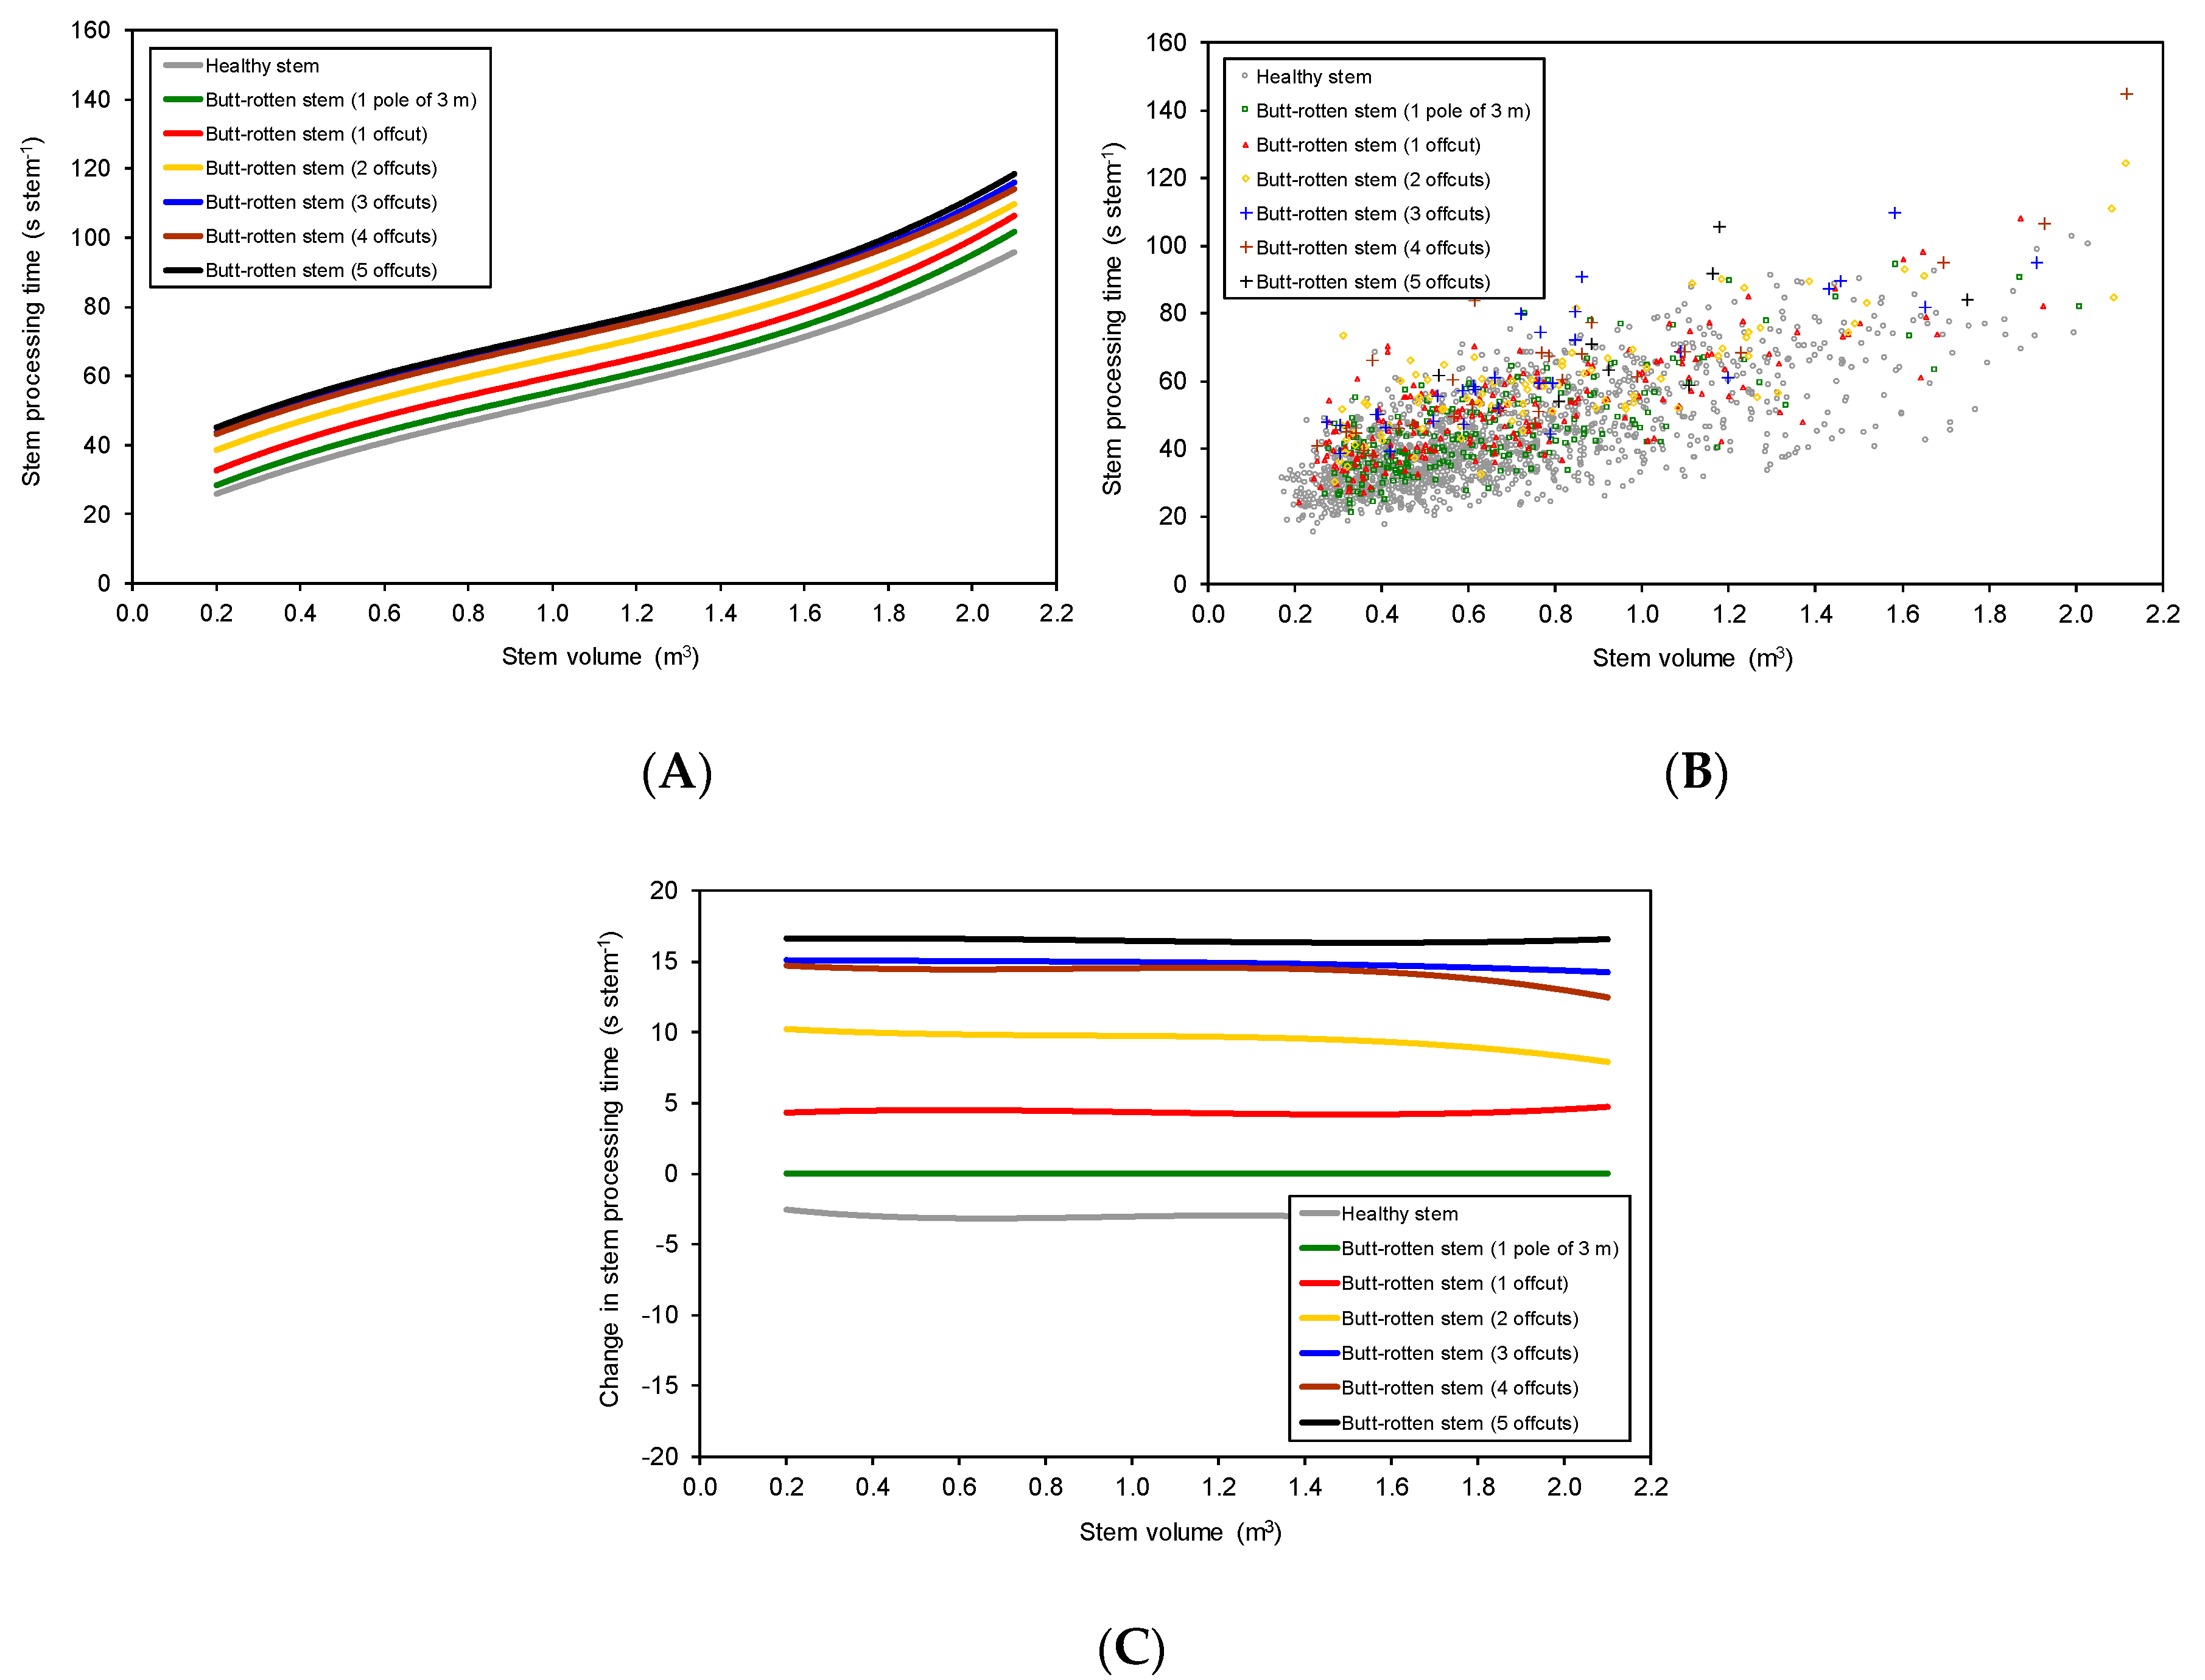
3.1.2. Modeling Stem Processing Time Consumption

There was also a statistically significant difference between the cross-cutting practices in the stem processing time (χ2 = 218.1; p < 0.001). Sounding of the offcuts added significantly to the stem processing time consumption of the decayed butt-rotten Norway spruce stems. Compared to cutting one decayed pole of 3 m, the time consumption of the stems sounded was, on average, 4.2–16.6 s stem−1 higher depending on the number of offcuts with a stem volume of 0.4–1.4 m3 (Figure 3, Table 4).
When sounding one offcut, the stem processing time was 4.2–4.5 s stem−1 (6.3%–12.1%) higher than that when cutting one decayed 3 m pole when the stem volume was 0.4–1.4 m3. When sounding two offcuts, the corresponding increase was 9.5–10.0 s stem−1 (14.2%–26.9%), and when sounding 3–5 offcuts, the increase was 14.5–16.6 s stem−1 (21.5%–45.0%) when the stem volume was 0.4–1.4 m3 (Figure 3).

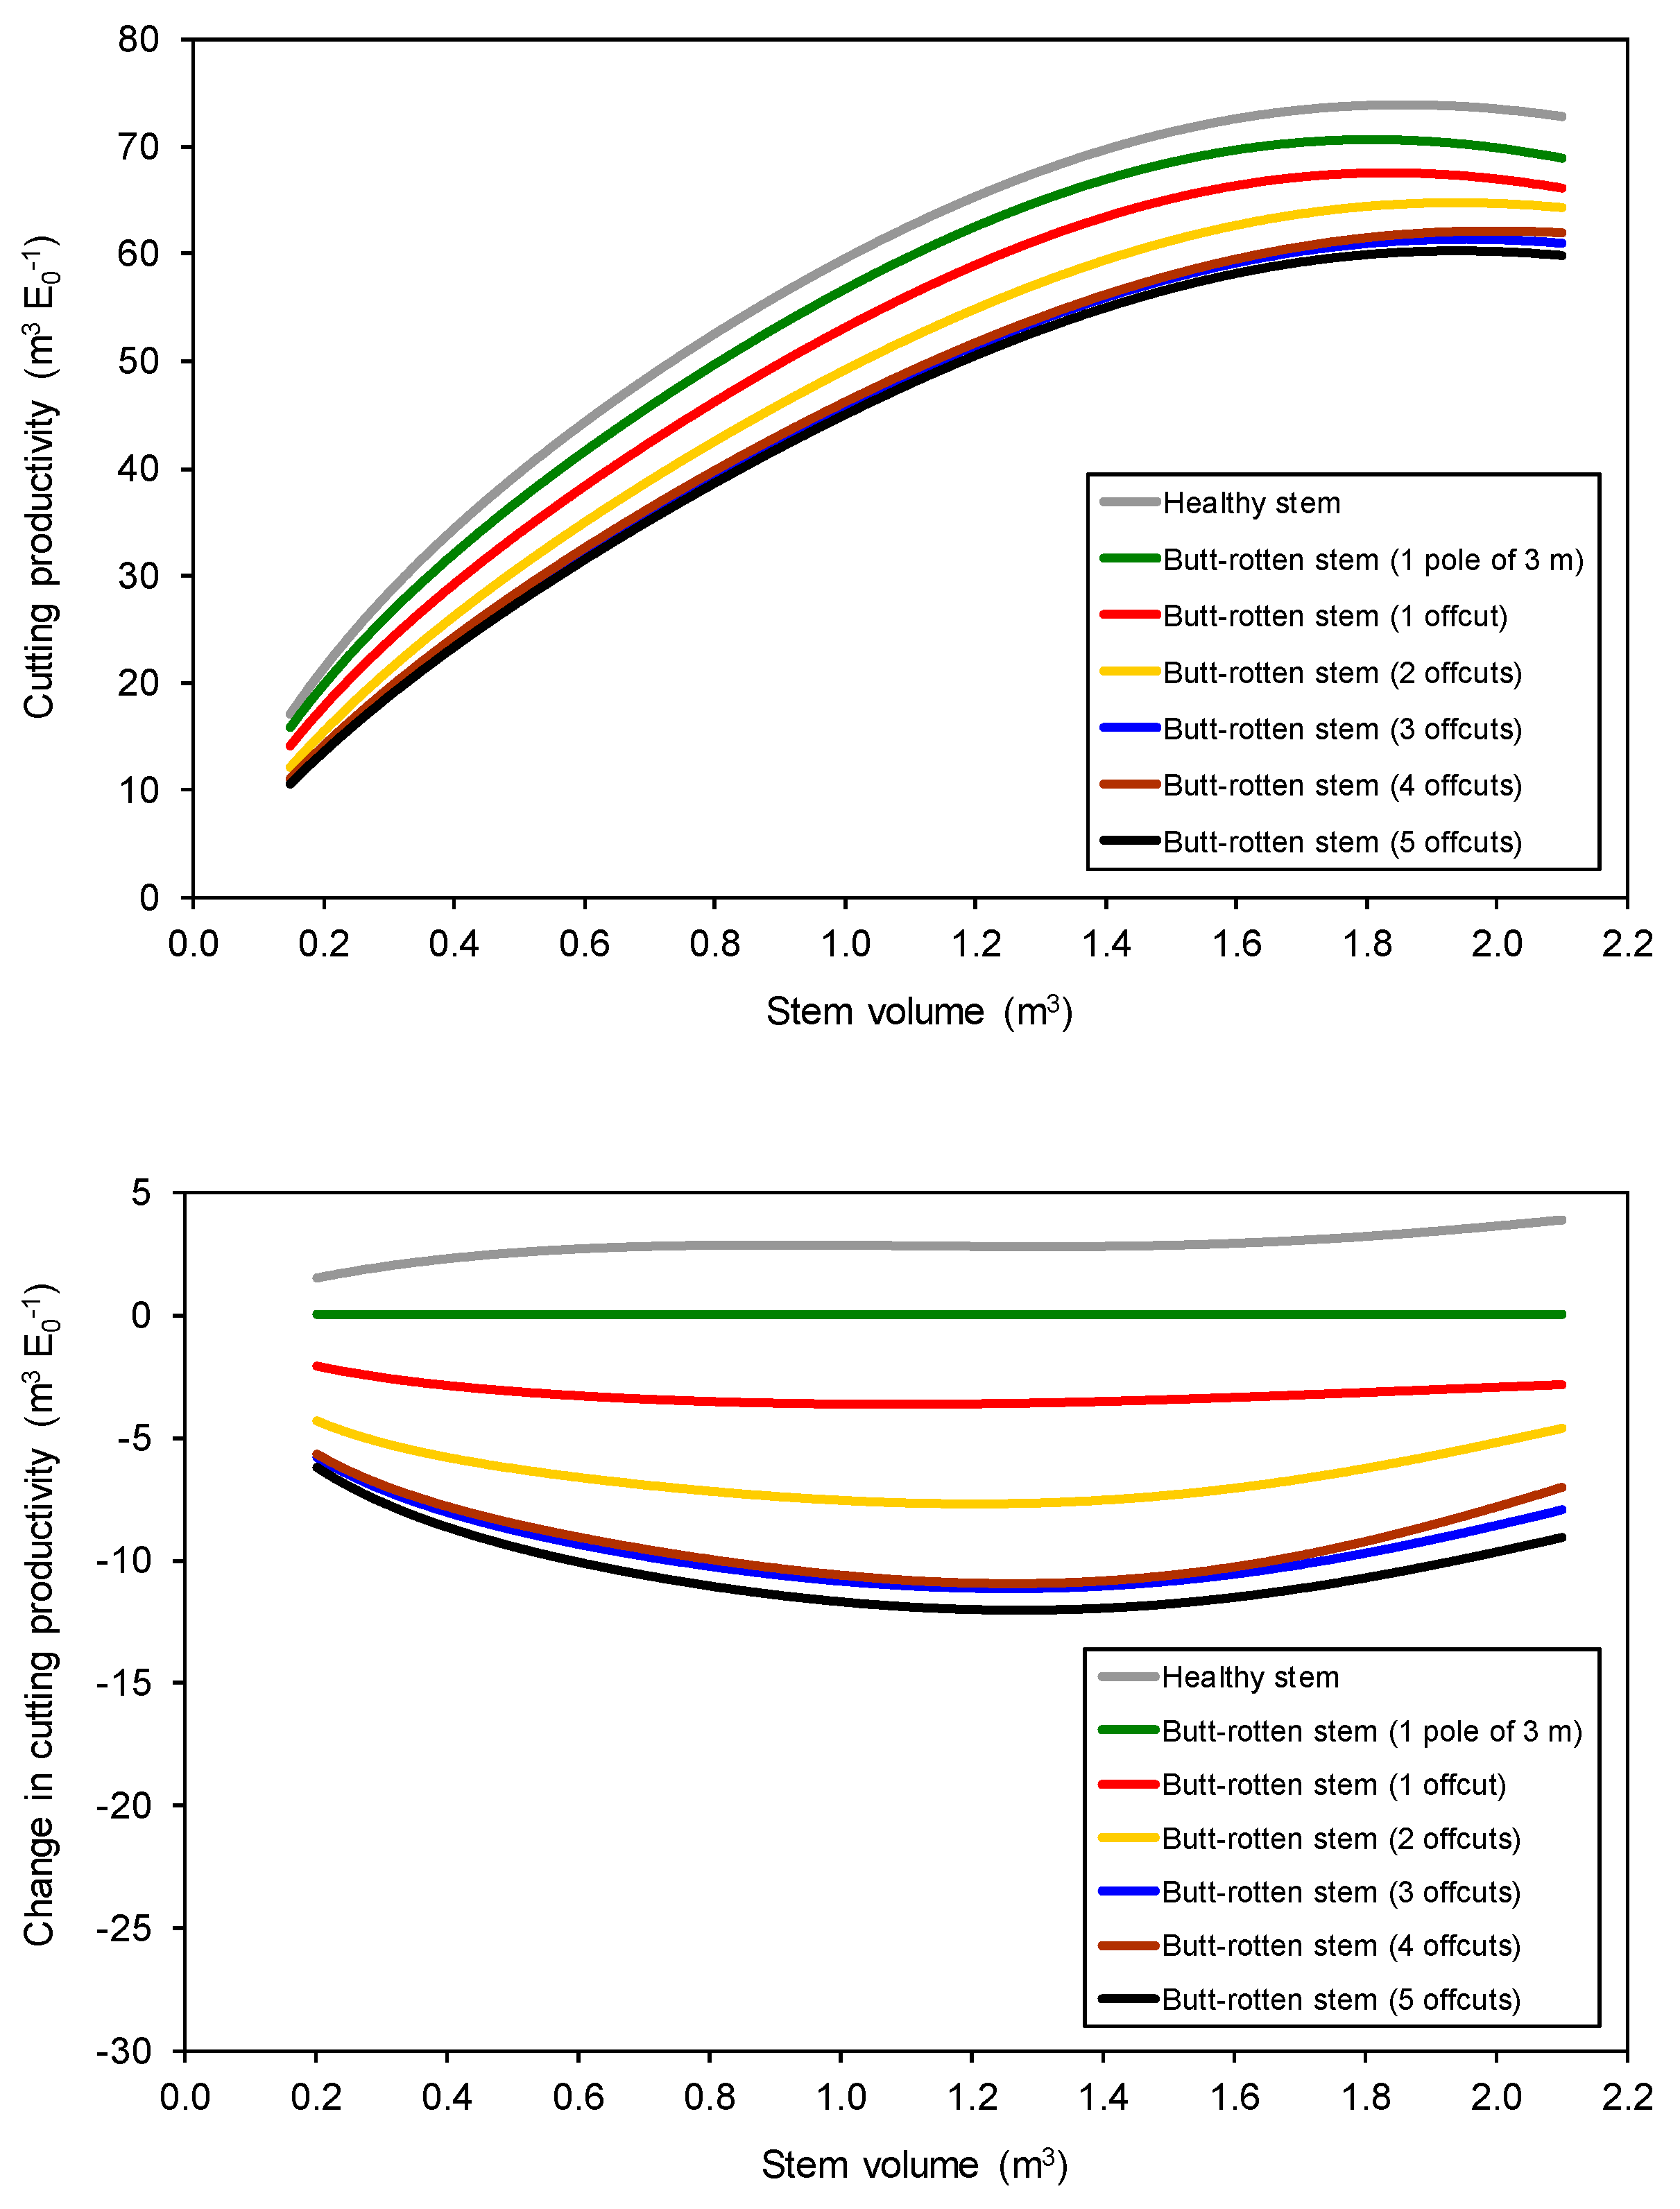
3.2. Cutting Productivity by Using Different Cross-Cutting Practices

When the stem volume was 0.4 m3, the cutting productivity of one offcut-stem was 9.0% (2.9 m3 E0−1-h) lower than that of the stems of one 3 m decayed pole (Figure 4). With the same stem size, the cutting productivity of two offcuts-stems was 18.1% (5.8 m3 E0−1-h) lower, and the cutting productivity for 3–5 offcuts-stems was 24.4%–27.0% (7.8–8.6 m3 E0−1-h) lower than that of the stems of one decayed 3 m pole.
With a bigger stem volume, the relative disparity of the cutting productivity was smaller and, conversely, the absolute productivity disparity was larger between the stems of one pole of 3 m and the sounding of one or several offcuts from the Norway spruce stems of the final fellings (Figure 4). For instance, with a stem volume of 1.4 m3, the cutting productivity of the sounding of one offcut was 5.3% (3.5 m3 E0−1-h) lower. The sounding of two offcuts increased the cutting productivity disparity by 11.2% (7.5 m3 E0−1) and the sounding of 3–5 offcuts added to the productivity disparity by 16.1%–17.8% (10.8–11.9 m3 E0−1) compared to the cutting productivity of the stems of one decayed pole of 3 m (Figure 4).
The highest cutting productivity figures were achieved for cross-cutting practices when the stem volume was 1.81–1.99 m3 (Figure 4). After that, the cutting productivities started to decrease. With the healthy stems, the peak cutting productivity was 73.9 m3 E0−1-h when the stem size was 1.86 m3. Depending on the cross-cutting practice tested, the lowest maximum cutting productivity (60.30 m3 E0−1-h with a stem volume of 1.94 m3) was reached with the stems of the sounding of five offcuts (Figure 4).

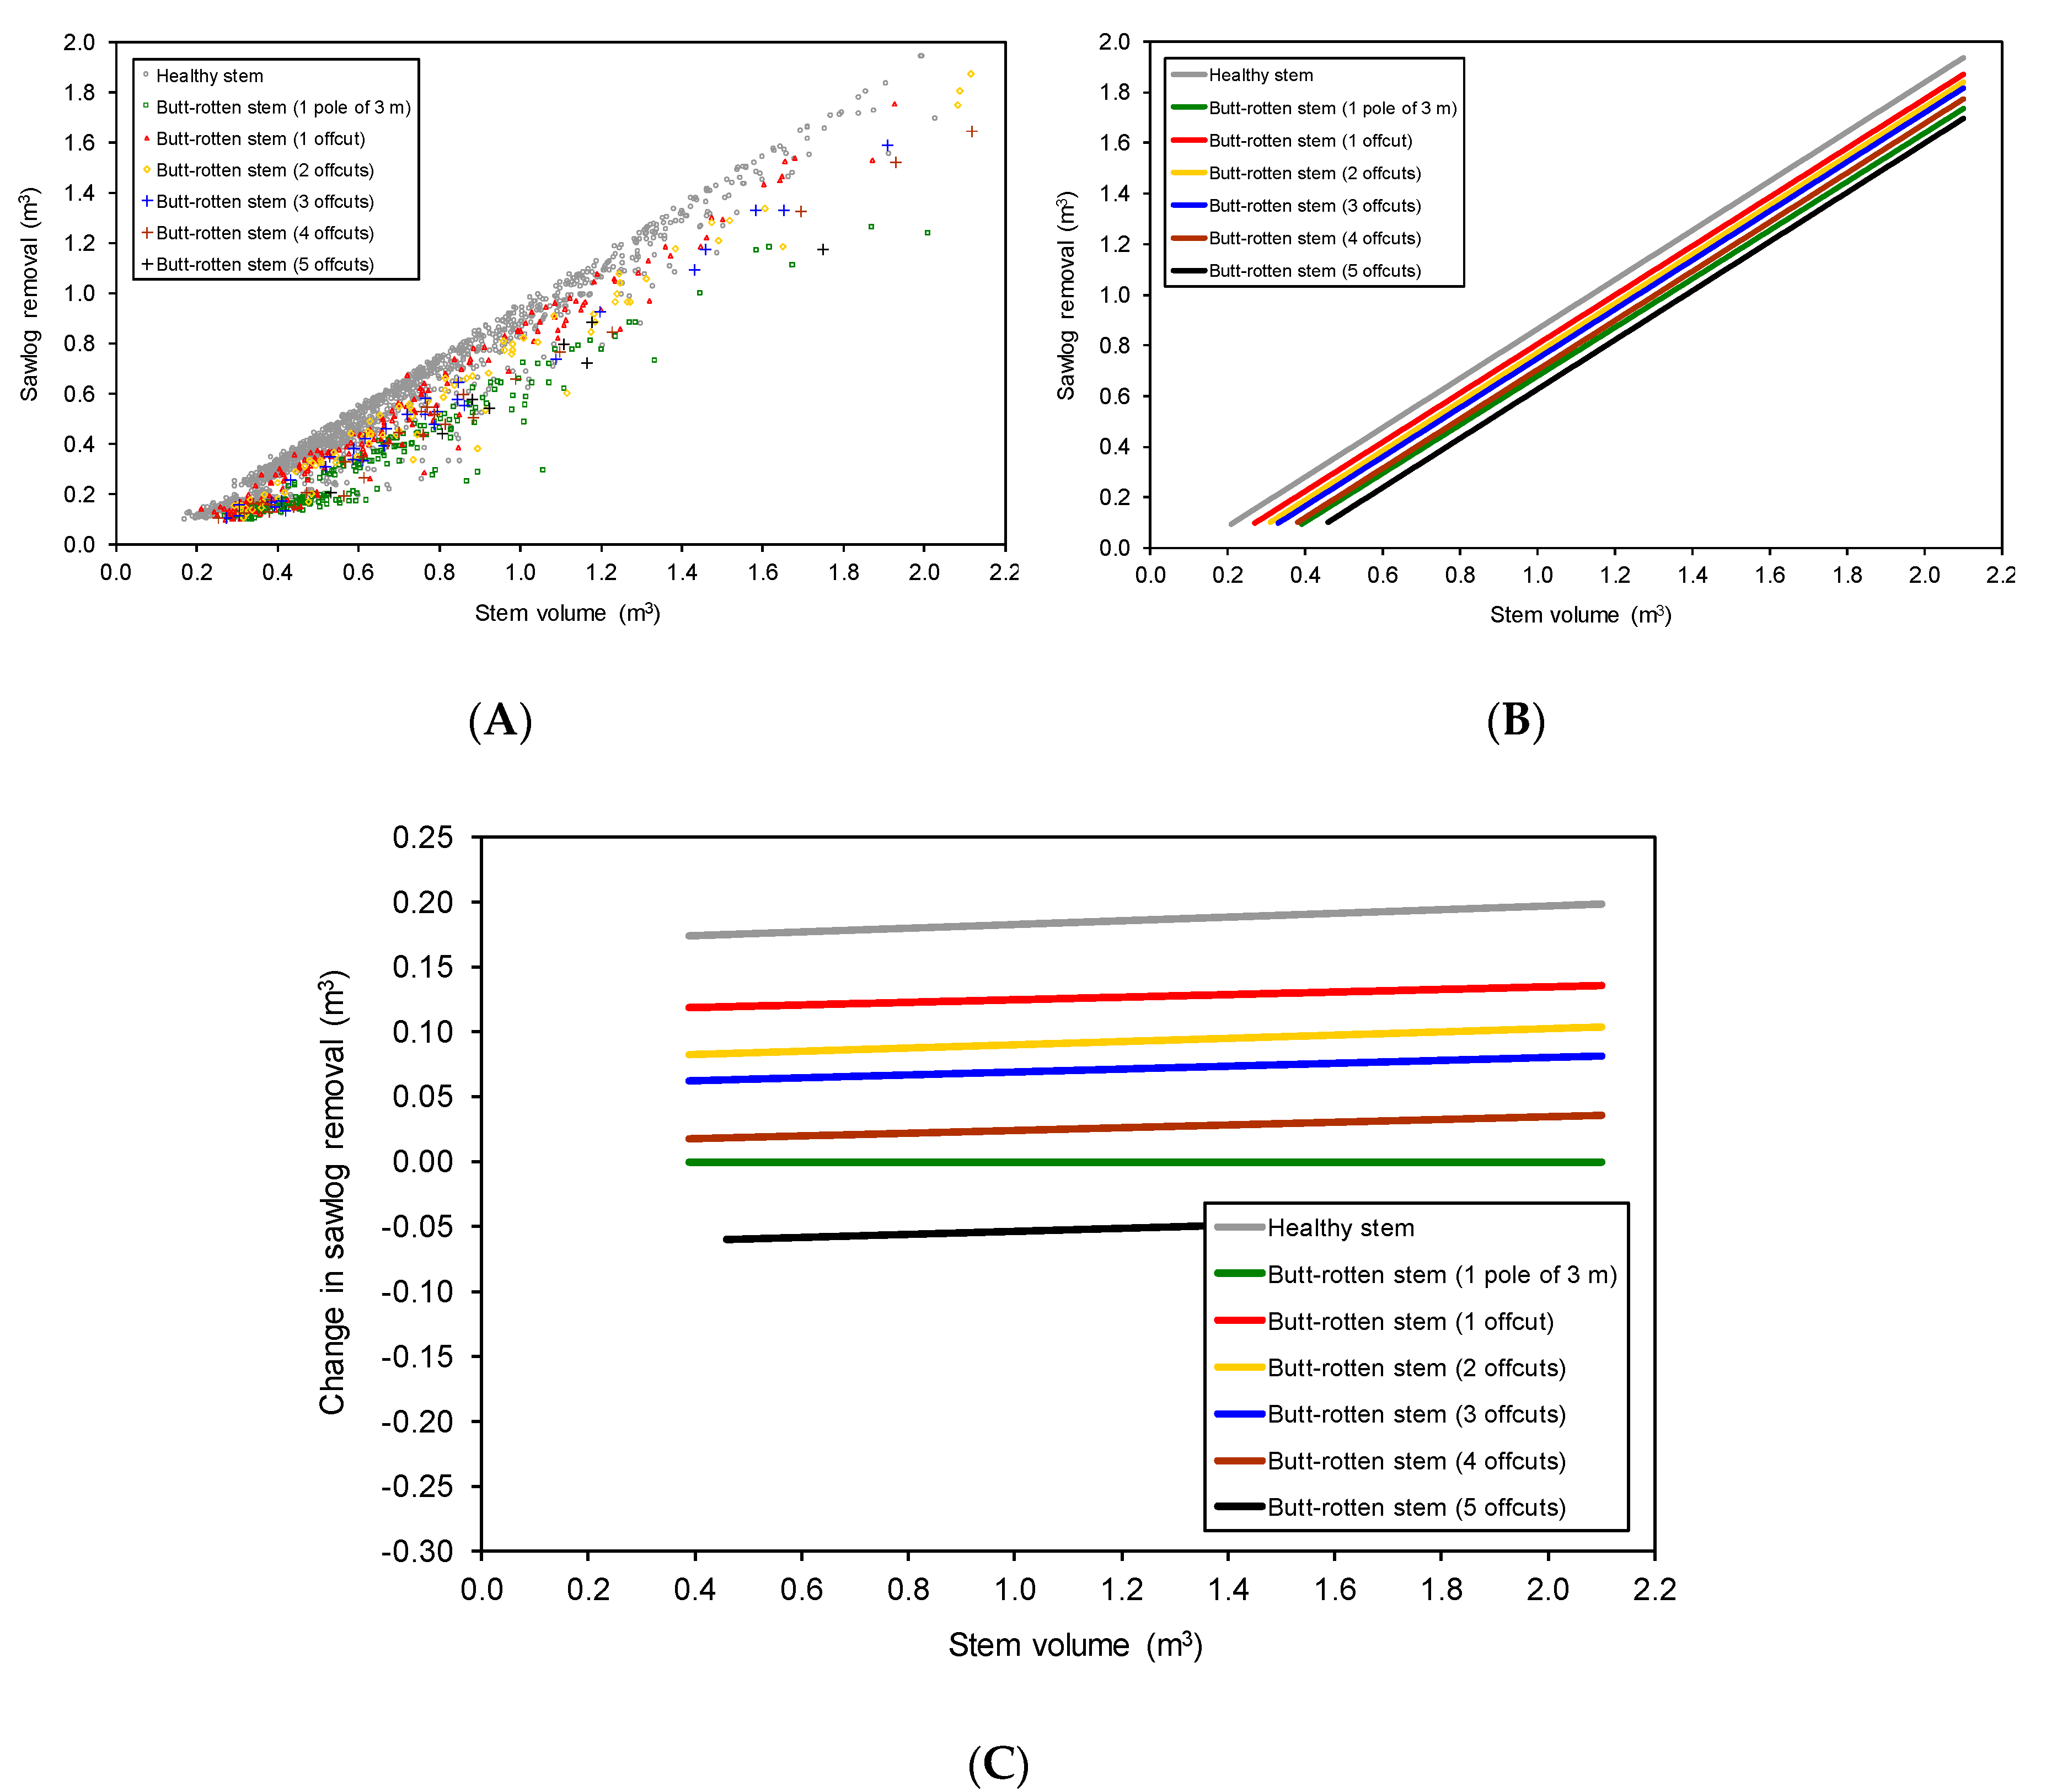
3.3. Sawlog Removal in Different Cross-Cutting Practices

The sounding of offcuts significantly intensified the sawlog removals from the butt-rotten Norway spruce final-felling stands (Figure 5, Table 6). When the stem size was 0.4–1.4 m3, sounding of the four offcuts added the sawlog removal with a 0.017–0.028 m3 stem−1 compared to the cross cutting of one decayed pole of 3 m. Correspondingly, if the decay in a sawlog could be avoided with three offcuts of 0.5 m, the sawlog removal was 0.062–0.073 m3 stem−1 higher, with a stem size of 0.4–1.4 m3. Furthermore, sounding of one and two offcuts produced an increment of 0.083–0.095 m3 stem−1 and 0.119–0.129 m3 stem−1 in the sawlog removals instead of the cross cutting of one decayed 3 m pole. There was statistically significant difference between the cross-cutting practices tested in the sawlog removals (χ2 = 25.9; p < 0.001).

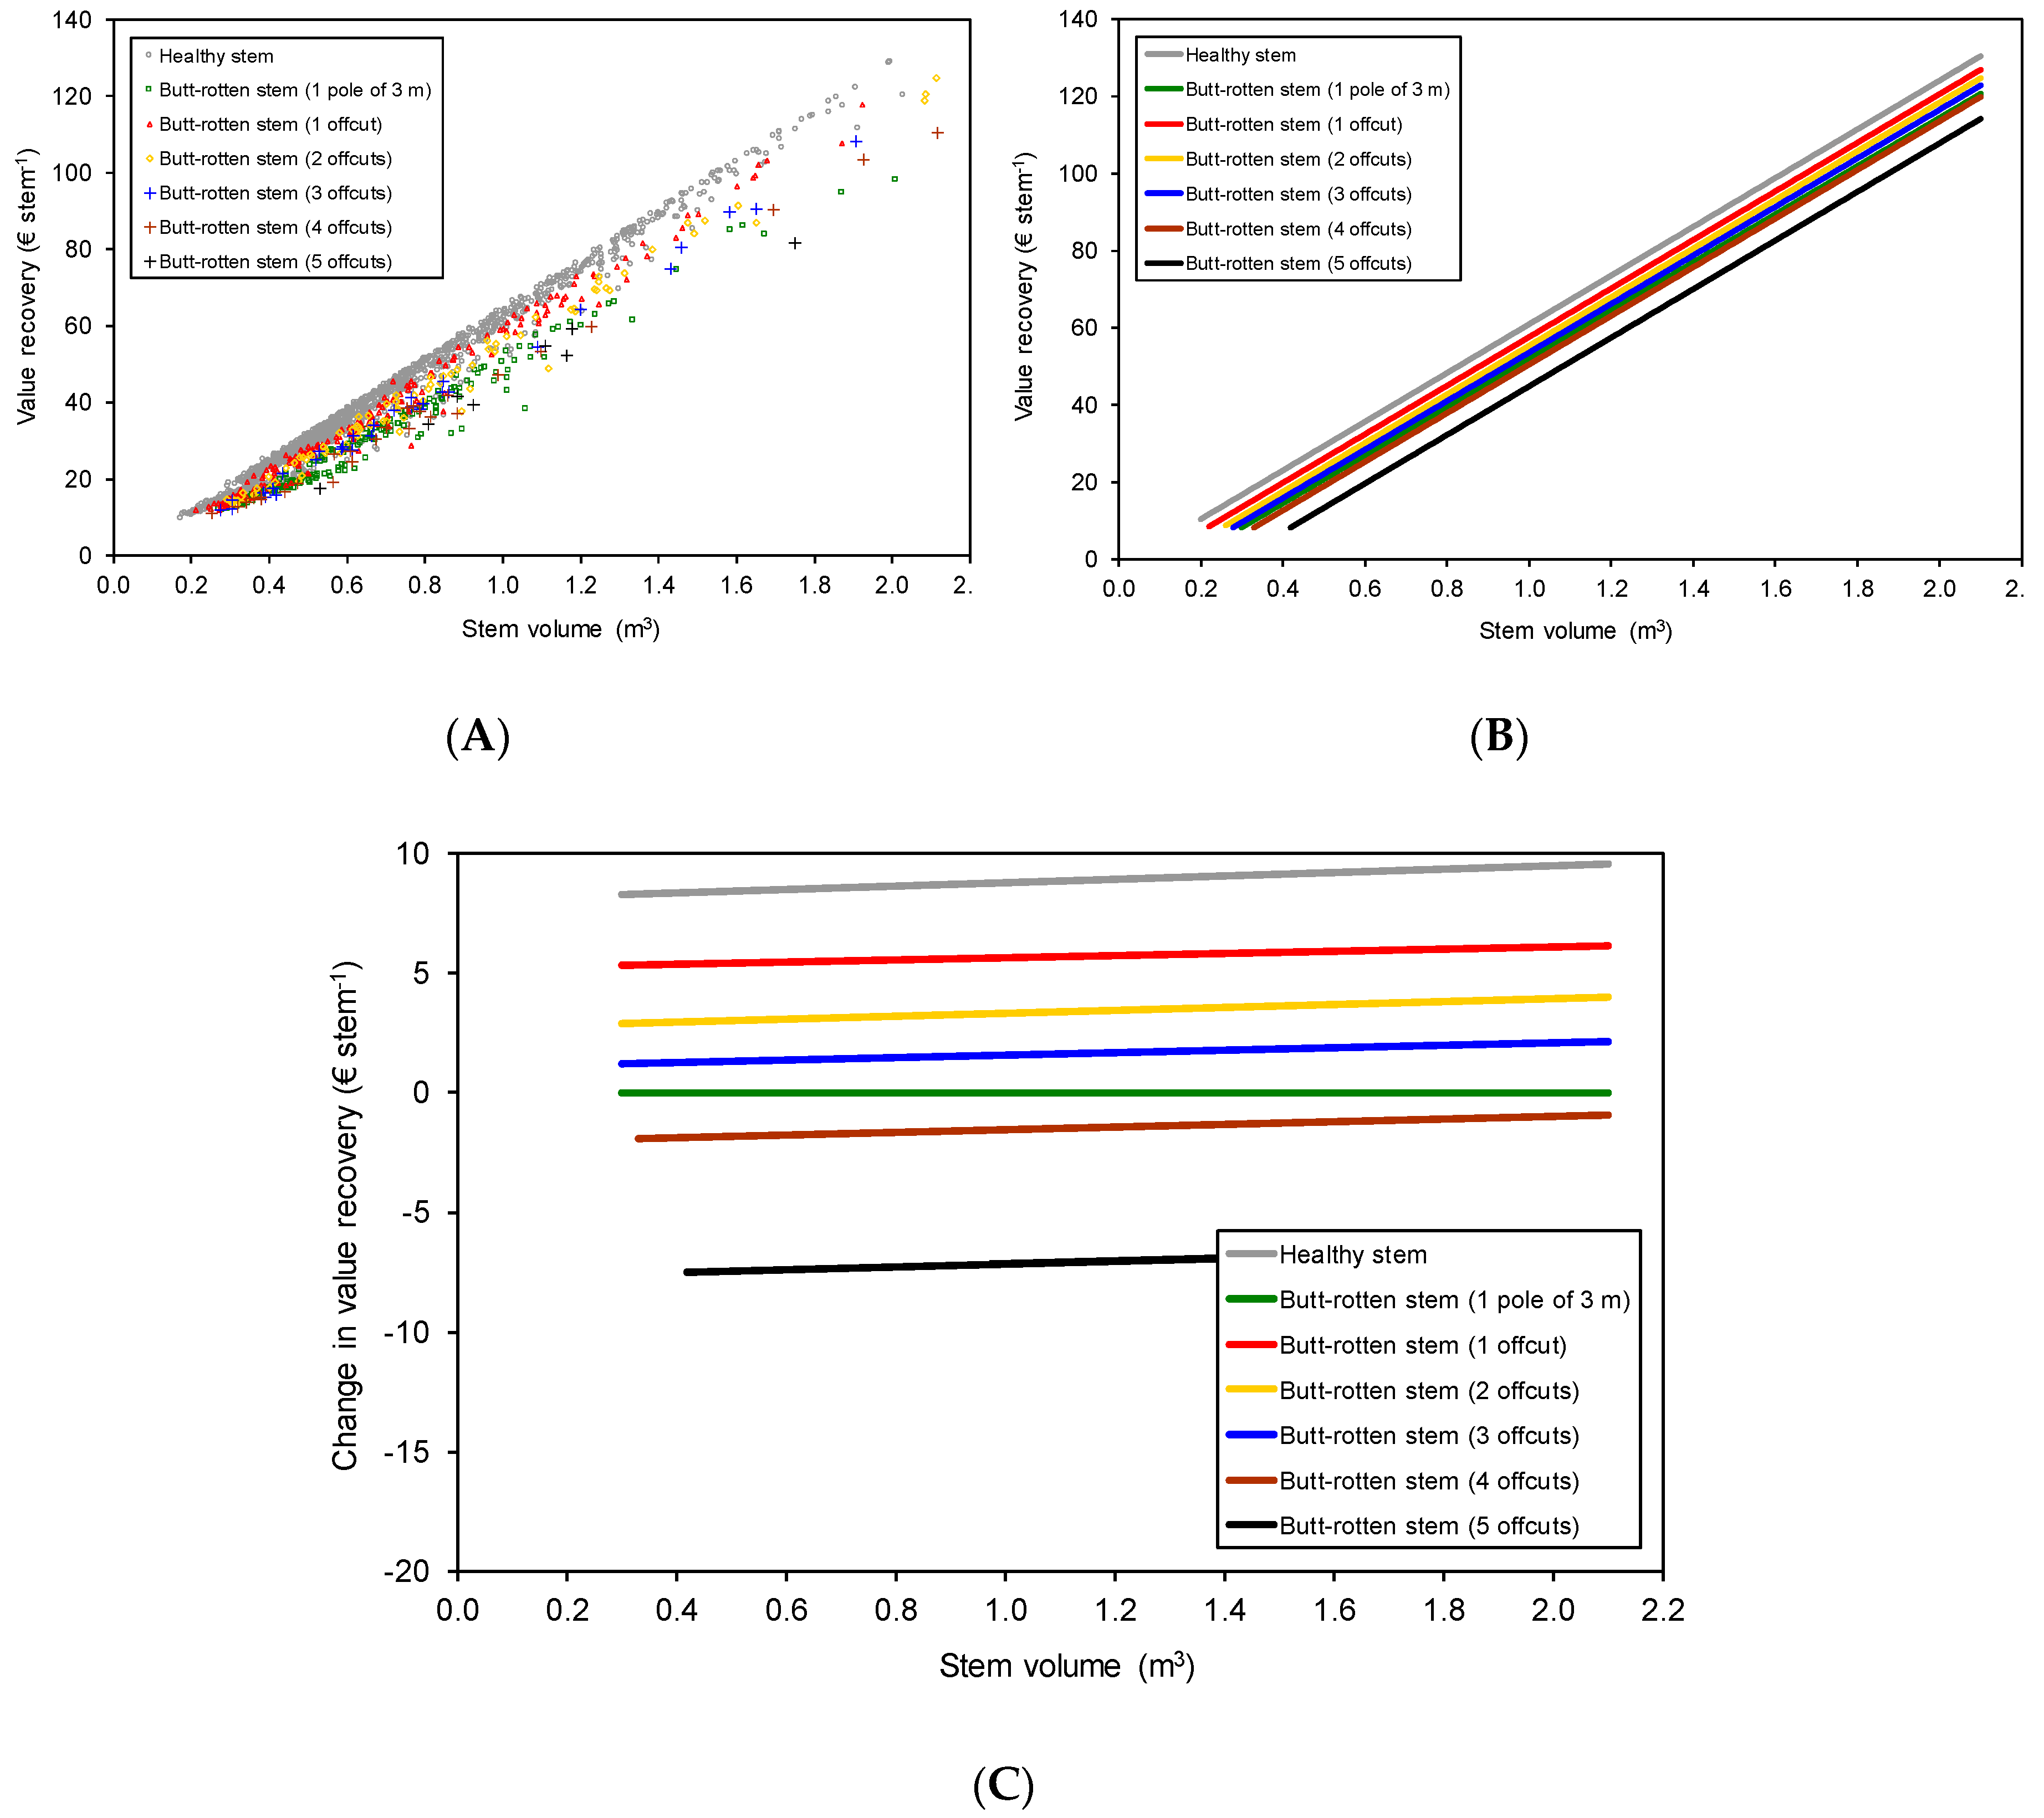
3.4. Value Recovery of Stem at Roadside Landing

According to the Kruskal-Wallis test, there was a statistically significant difference between the cross-cutting practices in the value recovery of the stem at the roadside landings in the study (χ2 = 76.7; p < 0.001). The results showed that it is profitable to sound, at most, three offcuts of 0.5 m, if it could be avoided to cut one decayed pole of 3 m for pulping (Figure 6). With a stem size of 0.4–1.4 m3, the advantage of sounding one offcut was €5.36–5.83 stem−1 (7.6%–36.7%), compared to cutting one pole of 3 m for pulping. On the other hand, the benefits of sounding two and three offcuts were smaller (€2.96–3.58 stem−1 (4.7%–20.3%) and €1.25–1.77 stem−1 (2.3%–8.6%), respectively (Figure 6). When sounding four or five offcuts of 0.5 m, the value recovery of the stem at the roadside landing was smaller than that when cutting one decayed pole of 3 m for pulping (Figure 6). In other words, it was not profitable in terms of the value recovery of the timber at the roadside landing.

3.5. Modelling Relationship between Diameter and Height of Decayed Column in Butt-Rotten Stems

The mean diameter of the stems measured at the stump height was 33.5 cm (std: 8.8 cm), ranging from 18 cm–62 cm. The diameter of the decay at the stump height was, on average, 11.2 cm (std: 5.7 cm), ranging from 2.5 cm–28.5 cm. The height of the decayed columns in the stems averaged 0.87 m (std: 0.62), and the variation was large, ranging between 0.08 m–2.68 m (Figure 7). There was a statistically significant correlation between the diameter and height of the decayed columns in the measured stems (ρ = 0.530; p < 0.001). Figure 7 demonstrates clearly that when the width of the decay at the stump height is less than 6 cm, the height of the decayed column commonly stops under 1.5 m in the stem.
The ratio between the height of the decayed column and the width of the decay at the stump height was 7.36:1, according to the model (Table 8).

4. Discussion

4.1. Assessing the Data

In the earlier studies, several scientists have underlined that there is a significant correlation between the work experience and skills of a machine operator and his/her productivity in forest machine work (e.g., [51,52,53,54,55,56,57,58]). For example, Purfürst and Erler [57] discovered that the stem size and the harvester operator together explain 84% of the total variation in cutting productivity, and the operator alone explains 37% of the variance. To minimize the variability of the cutting work undertaken by the harvester operator and the variability of his work experience and skills on his cutting performance in this study, the harvester operators for the time and motion studies were carefully selected. Each harvester operator was experienced, and all had significant experience in sounding offcuts and working on butt-rotten decayed harvesting sites.
Data for the work study were collected manually by a video camera to record the cutting work in the butt-rotten decayed forest stands, and the time and motion study was conducted by analyzing the video material using the analysis tool, which was the same that Kärhä et al. [42] previously used when studying the cutting of windthrown stems from final cuts. The analysis tool was applicable and workable. It can be concluded that the data collection method and analytical process used were the only possible data processing methodologies that would work for our study where the cutting conditions with decayed stems were abnormal, and the work cycle of the cutting was unpredictable and complex due to the diversity of the damage caused by root and butt rot in the study stands.
Our target was to set the time and motion study stands as the butt-rotten decayed Norway spruce-dominated harvesting sites where possible. This was challenging because one cannot forecast precisely how butt-rotten each harvesting site and tree stem will be. Nonetheless, this process succeeded reasonably well because, in the study, almost every third stem was butt-rotten and decayed (cf., [15,21,22,26,31]). The final data included almost 2000 healthy and decayed Norway spruce stems. Moreover, there were dozens of stems in which the butt rot extended seven to nine meters; in some stems the rot was as far as eleven to twelve meters (cf., [21,27]). However, those types of stems (i.e., height of decayed column > 3 m) were removed out of the final study data because the target was to compare the cross cutting of one decayed pulpwood pole of 3 m to the sounding of offcuts of 0.5 m. To summarize, the size of the time and motion study material was relatively large compared to the cutting material of previous softwood final-felling time studies completed in the 2000s (e.g., [42,54,59]).
Although a large number of Norway spruce stems were decayed in this study, there were a small number of stems with 3–5 offcuts. In particular, there were fewer than ten stems with five offcuts of 0.5 m. This is natural because in the real world, a harvester operator does not sound five offcuts. Instead, he/she will cross cut one or two decayed poles of 3 m depending on the height of the decayed column in the stem. Nevertheless, the models of time consumption, sawlog removal, and value recovery for the stems with 3–5 offcuts were also developed in this study. The significance and goodness of these models was quite good, and the models produced logical results.
In this study, the advance of root and butt rot in the sounded stems was also detected by the data of more than 200 stumps measured. Thus, almost 60% of the stumps from the offcut-stems were measured. These data were, however, small compared to earlier comprehensive butt-rot studies. For example, in the research by Tamminen [22], the number of measured Norway spruce stumps totaled 29,900. In the study by Arhipova et al. [21], a total of 24,745 Norway spruce stumps were examined, and the study by Piri [14] included 12,102 Norway spruce stumps. Nonetheless, the measurement data of the stump and butt-rot dimensions were not the main purpose of the data collection in this study, as the present study was more concerned about controlling the data of the sounding offcuts.

4.2. Evaluation of the Study Findings

This study produced new information on the cross cutting of decayed stems with the sounding of short (~0.5 m) offcuts and the bucking of longer (~3.0 m) butt-rotten poles. As assumed, the results illustrated that when cross cutting butt-rotten decayed stems and sounding offcuts, the stem processing time increases and further cutting productivity decreases. The main reasons for greater stem processing time were the harvester operator’s evaluation time for the advance of the decay in the stem, extra harvester boom movements, slower feeding, and more time for the cross-cutting sawings. Sounding of one 0.5 m offcut increased the stem processing time by around five seconds stem−1 compared to the cross cutting of one decayed 3 m pole. Correspondingly, the sounding of two and three offcuts added a stem processing time consumption of approximately 10 and 15 s stem−1, respectively. Labelle et al. [33] also discovered lower productivity when cutting the decayed stems but did not investigate the different cross-cutting practices in their research. Moreover, the results of this study were consistent with the assumption that the sounding of decayed stems accelerates sawlog removals. Indeed, the sounding of four offcuts increased the sawlog removal compared to the cross cutting of one decayed 3 m pole in the study (cf. Figure 5).
The study data consisted of many healthy stems. The cutting productivity between the healthy stems in this study and the previous studies can thus be compared. When comparing the cutting productivity of the healthy stems in this study to the cutting productivity of Norway spruce stems in the final fellings, for example, in the studies by Nurminen et al. [59] and Kärhä et al. [42], it can be observed that the cutting productivity in this study was at the same level as the cutting productivity in the studies by Nurminen et al. [59] and Kärhä et al. [42]. The cutting productivities reported by Brunberg [60], Jiroušek et al. [61], Brzózko et al. [62], and Eriksson and Lindroos [43] were also close to the cutting productivity level in the final fellings with healthy stems in this study (Figure 8).
Moreover, the study material included larger-sized (stem volume > 1.4 m3) trees, in comparison to the typical Finnish harvesting conditions in the final cuts (cf. Figure 1). Subsequently, the stem processing time consumption functions for the larger Norway spruce stems could be modelled. The stem processing time consumption functions showed that when the stem volume of the removal was more than 1.5 m3, the time consumption started to grow (cf. Figure 3). This further showed that the cutting productivity started to reduce (cf. Figure 4).
The maximum cutting productivity with the study harvesters was achieved when the stem size of removal was 1.8–2.0 m3. This study finding was in line with the figures reported by Kärhä et al. [42]. When cutting Norway spruce stems of 1.8–2.0 m3 in Finland, the stump diameter is typically around 51–55 cm, the diameter at breast height is 41–45 cm, and the weight is more than 1500–1700 kg stem−1. The harvesters of this study were a typical harvester fleet for final fellings in Finland. Their work weight was around 20 tonnes, the maximum feeding diameter of the harvester’s head was 62–65 cm, and the maximum delimbing diameter was 43–75 cm (Table 1). Consequently, it is quite logical that when the stem volume was approximately 1.8–2.0 m3, the cutting productivity with the study harvesters met its high-peak levels in these kinds of harvesting conditions. When aiming to increase cutting productivity with a stem size of more than 1.8 m3 in Finnish softwood forests, larger-sized harvesters are needed (e.g., John Deere 1470G, Komatsu 951, Ponsse Ergo 8w/Scorpion) (cf., [42]).
The operating hour costs of cutting during the cross-cutting practices 3–7 (i.e., the sounding of offcuts) were developed while assuming that the guide bar costs, chain costs, and chain oil costs, as well as the repair and service costs, for the harvester are higher (an increase of €1.6 E15−1) than those of the other cross-cutting practices tested (1 and 2). This presumption has to be made because there is no accurate knowledge of how much higher the operating hour costs of harvesters are in butt-rotten forests that require the sounding of many offcuts. The forwarding of timber cut was not researched in this study. The productivity functions by Eriksson and Lindroos [43] were used to determine the productivity and costs of forwarding in time study stands. When sawlog removal hectare−1 is smaller in butt-rotten decayed stands and/or there is one extra timber assortment (i.e., decayed poles of 3 m) in a stand, it can be presumed that the forwarding productivity for those stands is lower than that for the stands of fully healthy stems. Nevertheless, the effect of decayed timber on forwarding was estimated to be marginal, and, therefore, the same productivity functions and cost factors for forwarding after all tested cross-cutting practices were applied in the study.
The profitability of the sounding of offcuts was investigated at the roadside landing. Thus, the impacts of higher harvesting costs—especially cutting—and sawlog removals on the total profitability of sounding were combined in this study. The results revealed that sounding of the butt-rotten Norway spruce stems with one to three offcuts of 0.5 m is economically profitable. In this study, the realized length of the offcuts was 0.51 m, with a variation range 0.41–0.61 m. Thus, the results cannot be directly generalized to soundings of shorter (e.g., 0.3 m) or longer (e.g., 1.0 m) offcuts, nor can its profitability if shorter or longer offcut lengths are desired to be utilized in cutting butt-rotten Norway spruce stems.
The diameter and height of the decayed column in the stem correlated significantly, and the ratio between the height and width of the decayed column was 7.4:1. This is a lower ratio than that in the studies by Tamminen [22] (19.7:1) and Arhipova et al. [21] (16.5:1). In addition, when simulating Heterobasidion spp. root and butt-rot dynamics and modelling the spreading of Heterobasidion spp. decay in Norway spruce stems, Möykkynen et al. [66,67] and Pukkala et al. [68] applied the ratios of 20.0:1 and 20.5:1. The main reason for the lower ratio in this study was the fact that the dimensions of the decayed column were measured from only the last offcuts split by the lumberjacks before reaching the healthy timber in the stems, i.e., from the first three meters in the stem, because the main interest in this study was the first three meters in decayed stems. In the time and motion studies, there were also stems in which the height of the decayed column was as deep as eleven to twelve meters, but these stems were not used in the final data of the study.
The measured dimensions in the study showed that when the width of the decayed column at the stump height is under 6 cm, the height of the decayed column is commonly around 10–70 cm and, at most, 1.5 m (Figure 7). Hence, a harvester operator can cut away butt rot from the stem by sounding one to three 0.5 m offcuts, which is more profitable than directly cutting one 3 m pole for pulping (cf. Figure 6). Consequently, on the basis of this study, the harvester operator can be instructed that:
(1)
When the diameter of the decayed column at the stump height is small (≤5 cm), try to sound one to three offcuts from the butt-rotten Norway spruce stem.
(2)
When the width of the decay is larger (>5 cm), first cross cut the 3 m decayed Norway spruce pole and then observe the advance of the decayed column in the stem.
Today, a harvester operator visually monitors the advance of the decay in butt-rotten stems, which takes a considerable amount of cutting work (Figure 3). In the future, an application based on machine vision (cf., [69,70]), laser scanning (e.g., [71,72,73]), or tomography (e.g., [74,75]), or a combination, might assist operators to cross cut decayed stems with precision and improve their cutting productivity and the value recovery of timber from butt-rotten Norway spruce stands (cf., [35,76]).

5. Conclusions

Wood harvesting volumes from butt-rotten decayed forest stands are expected to multiply in the future under a warming climate. In this study, it was clarified that the cross-cutting practices of stems for diverse decayed Norway spruce stands are caused by the butt rot and compared particularly between the sounding of short (~0.5 m) offcuts and the cutting of longer (~3.0 m) decayed poles for pulping. The results revealed that the sounding of short offcuts increased the stem processing time in cutting and correspondingly reduced the productivity of cutting work. Thanks to the sounding of offcuts, the sawlog removals were successful in butt-rotten Norway spruce-dominated final fellings. Consequently, the study illustrated that the sounding of one to three offcuts is economically profitable compared to the cutting of a decayed pole of 3 m. The operative instructions for butt-rotten stands presented in this study can be utilized in the field of cutting operations. In the future, it is essential to create the tutorial systems for the harvester operators to achieve more effective cutting performance for butt-rotten final fellings and a higher value recovery of the timber from decayed Norway spruce stands.

Author Contributions

Conceptualization, K.K. and T.P.; Data collection, M.R.; Data analysis, M.R. and K.K.; Writing—original draft preparation, K.K. and M.R.; Writing—review and editing, K.K, T.P., and M.R.; Supervision, K.K. and T.P.; Project administration, K.K.

Funding

This research received no external funding.

Conflicts of Interest

The authors declare no conflict of interest.

References

  1. Garbeletto, M.; Gonthier, P. Biology, Epidemiology, and Control of Heterobasidion Species Worldwide. Ann. Rev. Phytopathol. 2013, 51, 39–59. [Google Scholar] [CrossRef] [PubMed]
  2. Korhonen, K.; Capretti, P.; Karjalainen, R.; Stenlid, J. Distribution of Heterobasidion annosum intersterility groups in Europe. In Heterobasidion annosum: Biology, Ecology, Impact and Control; Woodward, S., Stenlid, J., Karjalainen, R., Hüttermann, A., Eds.; CAB International: Wallingford, UK, 1998; pp. 93–104. [Google Scholar]
  3. Woodward, S.; Stenlid, J.; Karjalainen, R.; Hüttermann, A. Heterobasidion annosum: Biology, Ecology, Impact and Control; CAB International: Wallingford, UK, 1998; p. 589. [Google Scholar]
  4. Asiegbu, F.O.; Adomas, A.; Stenlid, J. Conifer root and butt rot caused by Heterobasidion annosum (Fr.) Bref. s.l. Mol. Plant Pathol. 2005, 6, 395–409. [Google Scholar] [CrossRef] [PubMed]
  5. Seifert, T. Simulating the extent of decay caused by Heterobasidion annosum s. l. in stems of Norway spruce. For. Ecol. Manag. 2007, 248, 95–106. [Google Scholar] [CrossRef]
  6. Müller, M.M.; Piri, T.; Hantula, J. Ilmaston lämpeneminen haastaa nykyistä tehokkaampaan juurikäävän torjuntaan (Global warming is challenging more effective control of Heterobasidion spp. root and butt rot). Metsätieteen Aikakauskirja 2012, 4, 312–315. [Google Scholar] [CrossRef]
  7. Piri, T.; Selander, A.; Hantula, J. Juurikääpätuhojen Tunnistaminen ja Torjunta (Identifying and Prevention of Root and Butt-Rot Damage); Finnish Forest Centre: Lahti, Finland, 2017; p. 50. Available online: https://www.metsakeskus.fi/sites/default/files/juurikaapa.pdf (accessed on 20 July 2019).
  8. La Porta, N.; Capretti, P.; Thomsen, I.M.; Kasanen, R.; Hietala, A.M.; Von Weissenberg, K. Forest pathogens with higher damage potential due to climate change in Europe. Can. J. Plant Pathol. 2008, 30, 177–195. [Google Scholar] [CrossRef]
  9. Müller, M.M.; Sievänen, R.; Beuker, E.; Meesenburg, H.; Kuuskeri, J.; Hamberg, L.; Korhonen, K. Predicting the activity of Heterobasidion parviporum on Norway spruce in warming climate from its respiration rate at different temperatures. For. Pathol. 2014, 44, 325–336. [Google Scholar] [CrossRef]
  10. Kärhä, K.; Koivusalo, V.; Palander, T.; Ronkanen, M. Treatment of Picea abies and Pinus sylvestris Stumps with Urea and Phlebiopsis gigantea for Control of Heterobasidion. Forests 2018, 9, 139. [Google Scholar] [CrossRef]
  11. Kallio, T.; Norokorpi, Y. Kuusikon tyvilahoisuus (Butt rot in a Norway spruce stand). Silv. Fenn. 1972, 6, 4861. [Google Scholar] [CrossRef]
  12. Hallaksela, A.-M. Causal agents of butt-rot in Norway spruce in southern Finland. Silv. Fenn. 1984, 18, 5216. [Google Scholar] [CrossRef]
  13. Stenlid, J.; Wästerlund, I. Estimating the frequency of stem rot in Picea abies using an increment borer. Scand. J. For. Res. 1986, 1, 303–308. [Google Scholar] [CrossRef]
  14. Piri, T.; Korhonen, K.; Sairanen, A. Occurrence of Heterobasidion annosum in Pure and Mixed Spruce Stands in Southern Finland. Scand. J. For. Res. 1990, 5, 113–125. [Google Scholar] [CrossRef]
  15. Huse, K.J.; Solheim, H.; Venn, K. Råte i Gran Registrert på Stubber Etter Hogst Vinteren 1992 (Stump Inventory of Root and Butt Rots in Norway Spruce Cut in 1992); Research Paper 23; Norwegian Forest Research Institute: Ås, Norway, 1994; p. 26. [Google Scholar]
  16. Vasiliauskas, R.; Stenlid, J.; Johansson, M. Fungi in bark peeling wounds of Picea abies in central Sweden. Eur. J. For. Pathol. 1996, 26, 285–296. [Google Scholar] [CrossRef]
  17. Vasiliauskas, R.; Stenlid, J. Fungi inhabiting stems of Picea abies in managed stand in Lithuania. For. Ecol. Manag. 1998, 109, 119–126. [Google Scholar] [CrossRef]
  18. Vasiliauskas, R. Spread of Amylostereum areolatum and A. chailletii decay in living stems of Picea abies. Forestry 1999, 72, 95–102. [Google Scholar] [CrossRef]
  19. Vasiliauskas, R. Damage to trees due to forestry operations and its pathological significance in temperate forests: A literature review. Forestry 2001, 74, 319–336. [Google Scholar] [CrossRef]
  20. Piri, T.; Korhonen, K. Infection of advance regeneration of Norway spruce by Heterobasidion parviporum. Can. J. For. Res. 2001, 31, 937–942. [Google Scholar] [CrossRef]
  21. Arhipova, N.; Gaitnieks, T.; Donis, J.; Stenlid, J.; Vasaitis, R. Butt rot incidence, causal fungi, and related yield loss in Picea abies stands of Latvia. Can. J. For. Res. 2011, 41, 2337–2345. [Google Scholar] [CrossRef]
  22. Tamminen, P. Butt-rot in Norway spruce in southern Finland. Comm. Inst. For. Fenn. 1985, 127, 1–52. [Google Scholar]
  23. Piri, T. The spreading of the S type of Heterobasidion annosum from Norway spruce stumps to the subsequent tree stand. Eur. J. For. Pathol. 1996, 26, 193–204. [Google Scholar] [CrossRef]
  24. Rönnberg, J.; Jørgensen, B.B. Incidence of Root and Butt Rot in Consecutive Rotations of Picea abies. Scand. J. For. Res. 2000, 15, 210–217. [Google Scholar] [CrossRef]
  25. Mattila, U.; Nuutinen, T. Assessing the Incidence of Butt Rot in Norway spruce in Southern Finland. Silv. Fenn. 2007, 41, 473. [Google Scholar] [CrossRef]
  26. Kallio, T. An example on the economic loss caused by decay in growing spruce timber in South Finland. Silv. Fenn. 1972, 6, 116–124. [Google Scholar]
  27. Swedjemark, G.; Stenlid, J. Population Dynamics of the Root Rot Fungus Heterobasidion annosum Following Thinning of Picea abies. Oikos 1993, 66, 247–254. [Google Scholar] [CrossRef]
  28. Mäkelä, M.; Lipponen, K.; Sainio, M. Tyvilahoa Sisältävän Kuusen Määrä, Laatu ja Käyttömahdollisuudet Sellun Raaka-aineena (Quantity, Quality and Use of Butt-rotten Norway Spruce Timber as a Raw Material of Pulping); Metsätehon Raportti 50; Metsäteho Ltd.: Helsinki, Finland, 1998; p. 30. [Google Scholar]
  29. Natural Resources Institute Finland. Teollisuuspuun Kauppa, Kantohinnat 01–05/2019 (Industrial Roundwood Trade, Stumpage Prices, January–May 2019); Natural Resources Institute Finland, Statistics: Vantaa, Finland, 2019; Available online: http://statdb.luke.fi/PXWeb/pxweb/fi/LUKE/LUKE__04%20Metsa__04%20Talous__02%20Teollisuuspuun%20kauppa__02%20Kuukausitilastot/01a_Kantohinnat_kk.px/table/tableViewLayout1/?rxid=7baece36-3f68-4290-a707-3f0cb45404b9 (accessed on 20 July 2019).
  30. Kadunc, A. The Incidence of Rot in Norway Spruce and its Influence on the Value of Trees in Slovenia. Croat. J. For. Eng. 2013, 34, 137–149. [Google Scholar]
  31. Kallio, T.; Tamminen, P. Decay of spruce (Picea abies (L.) Karst.) in the Åland Islands. Acta For. Fenn. 1974, 138, 1–42. [Google Scholar] [CrossRef]
  32. Warren, G.; Baines, P.; Plamondon, J.; Pitt, D.G. Effects of precommercial thinning on the forest value chain in northwestern New Brunswick: Part 3—Incidence of root and butt decay. For. Chron. 2013, 89, 464–473. [Google Scholar] [CrossRef]
  33. Labelle, E.R.; Soucy, M.; Cyr, A.; Pelletier, G. Effect of Tree Form on the Productivity of a Cut-to-Length Harvester in a Hardwood Dominated Stand. Croat. J. For. Eng. 2016, 37, 175–183. [Google Scholar]
  34. Labelle, E.R.; Bergen, M.; Windisch, J. The effect of quality bucking and automatic bucking on harvesting productivity and product recovery in a pine-dominated stand. Eur. J. For. Res. 2017, 136, 639–652. [Google Scholar] [CrossRef]
  35. Kärhä, K.; Änäkkälä, J.; Hakonen, O.; Palander, T.; Sorsa, J.-A.; Räsänen, T.; Moilanen, T. Analyzing the Antecedents and Consequences of Manual Log Bucking in Mechanized Wood Harvesting. Mech. Mater. Sci. Eng. 2017, 12, 1–15. [Google Scholar] [CrossRef]
  36. Labelle, E.R.; Huß, L. Creation of value through a harvester on-board bucking optimization system operated in a spruce stand. Silv. Fenn. 2018, 52, 9947. [Google Scholar] [CrossRef]
  37. Skogforsk. StanForD: Standard for Forest Data and Communications; Skogforsk: Uppsala, Sweden, 2007; p. 97. Available online: http://www.skogforsk.se/contentassets/b063db555a664ff8b515ce121f4a42d1/stanford_main-doc_070327.pdf (accessed on 20 July 2019).
  38. Arlinger, J.; Möller, J.J.; Sorsa, J.-A.; Räsänen, T. Introduction to StanForD 2010. Structural Descriptions and Implementation Recommendations; Skogforsk: Uppsala, Sweden, 2019; p. 102. Available online: https://www.skogforsk.se/cd_490398/contentassets/1a68cdce4af1462ead048b7a5ef1cc06/stanford-2010-introduction-190106.pdf (accessed on 20 July 2019).
  39. Groover, M.P. Work Systems and Methods, Measurement, and Management of Work; Pearson Education International: Upper Saddle River, NJ, USA, 2007; p. 778. [Google Scholar]
  40. Nuutinen, Y.; Väätäinen, K.; Heinonen, J.; Asikainen, A.; Röser, D. The Accuracy of Manually Recorded Time Study Data for Harvester Operation Shown via Simulator Screen. Silv. Fenn. 2008, 42, 63–72. [Google Scholar] [CrossRef]
  41. Palander, T.; Nuutinen, Y.; Kariniemi, A.; Väätäinen, K. Automatic Time Study Method for Recording Work Phase Times of Timber Harvesting. For. Sci. 2013, 59, 472–483. [Google Scholar] [CrossRef]
  42. Kärhä, K.; Anttonen, T.; Poikela, A.; Palander, T.; Laurén, A.; Peltola, H.; Nuutinen, Y. Evaluation of Salvage Logging Productivity and Costs in Windthrown Norway Spruce-Dominated Forests. Forests 2018, 9, 280. [Google Scholar] [CrossRef]
  43. Eriksson, M.; Lindroos, O. Productivity of harvesters and forwarders in CTL operations in northern Sweden based on large follow-up datasets. Int. J. For. Eng. 2014, 25, 179–200. [Google Scholar] [CrossRef]
  44. Strandström, M. Average Wood Harvesting Conditions in Finland, 2010–2017; Metsäteho Ltd., Statistics: Vantaa, Finland, 2018. [Google Scholar]
  45. Kärhä, K.; Poikela, A.; Palander, T. Productivity and Costs of Harwarder Systems in Industrial Roundwood Thinnings. Croat. J. For. Eng. 2018, 39, 23–33. [Google Scholar]
  46. Hakkila, P.; Saranpää, P.; Kalaja, H.; Repola, J. Suomalainen Havukuitupuu—Laadun Hallinta ja Vaihtelu (Finnish Softwood Pulpwood—Quality Management and Variation); Finnish Forest Research Institute: Vantaa, Finland, 2002; p. 92. [Google Scholar]
  47. Malinen, J.; Laitila, J.; Väätäinen, K.; Viitamäki, K. Variation in age, annual usage and resale price of cut-to-length machinery in different regions of Europe. Int. J. For. Eng. 2016, 27, 95–102. [Google Scholar] [CrossRef]
  48. Finlex. Metsäkonealan Työsopimus 1.2.2018–31.1.2020 (Terms of Employment in Forest Machine Business, 1.2.2018–31.1.2020); The Trade Association of Finnish Forestry and Earth Moving Contractors & Industrial Union: Helsinki, Finland, 2018; p. 38. Available online: https://www.finlex.fi/data/tes/3722/MU23Metskon1802.pdf (accessed on 20 July 2019).
  49. Brunberg, T. Fuel Consumption in Forest Machines 2012; Arbetsrapport Från Skogforsk 789; Skogforsk: Uppsala, Sweden, 2013; p. 12. [Google Scholar]
  50. Statistics Finland. Metsäalan Kone- ja Autokustannusindeksi 2015 = 100 (Machine and Truck Cost Index in Forestry, 2015 = 100); Handbook; Statistics Finland: Helsinki, Finland, 2018; p. 29. [Google Scholar]
  51. Sirén, M. One-Grip Harvester Operation, It’s Silvicultural Result and Possibilities to Predict Tree Damage; Research Papers 694; Finnish Forest Research Institute: Vantaa, Finland, 1998; p. 179. [Google Scholar]
  52. Kärhä, K.; Rönkkö, E.; Gumse, S.-I. Productivity and Cutting Costs of Thinning Harvesters. Int. J. For. Eng. 2004, 15, 43–56. [Google Scholar] [CrossRef]
  53. Ovaskainen, H. Timber Harvester Operators’ Working Technique in First Thinning and the Importance of Cognitive Abilities on Work Productivity; Dissertationes Forestales 79; The Finnish Society of Forest Science: Vantaa, Finland, 2009; p. 62. [Google Scholar]
  54. Dvořák, J.; Malkovský, Z.; Macků, J. Influence of human factor on the time of work stages of harvesters and crane-equipped forwarders. J. For. Sci. 2008, 54, 24–30. [Google Scholar] [CrossRef] [Green Version]
  55. Ovaskainen, H.; Uusitalo, J.; Väätäinen, K. Characteristics and Significance of Harvester Operators’ Working Technique in Thinnings. Int. J. For. Eng. 2004, 15, 67–77. [Google Scholar] [CrossRef]
  56. Purfürst, F.T. Learning Curves of Harvester Operators. Croat. J. For. Eng. 2010, 31, 89–97. [Google Scholar]
  57. Purfürst, F.T.; Erler, J. The Human Influence on Productivity in Harvester Operations. Int. J. For. Eng. 2011, 22, 15–22. [Google Scholar] [CrossRef]
  58. Palander, T.; Ovaskainen, H.; Tikkanen, L. An Adaptive Work Study Method for Identifying the Human Factors that Influence the Performance of a Human-Machine System. For. Sci. 2012, 58, 377–389. [Google Scholar] [CrossRef]
  59. Nurminen, T.; Korpunen, H.; Uusitalo, J. Time Consumption Analysis of the Mechanized Cut-to-length Harvesting System. Silva Fenn. 2006, 40, 346. [Google Scholar] [CrossRef]
  60. Brunberg, T. Basic Data for Productivity Norms for Extra Large Single-Grip Harvesters in Final Felling; Redogörelse Från Skogforsk 2; Gälve Offset AB: Gälve, Sweden, 2007; p. 8. [Google Scholar]
  61. Jiroušek, R.; Klvač, R.; Skoupý, A. Productivity and costs of the mechanized cut-to-length wood harvesting system in clear-felling operations. J. For. Sci. 2007, 53, 476–482. [Google Scholar] [CrossRef]
  62. Brzózko, J.; Szereszewiec, B.; Szereszewiec, E. Productivity of machine timber harvesting at the wind-damaged site. Ann. Warsaw Univ. Life Sci. SGGW Agric. 2009, 54, 41–49. [Google Scholar]
  63. Spinelli, R.; Hartsough, B.R.; Magagnotti, N. Productivity Standards for Harvesters and Processors in Italy. For. Prod. J. 2010, 60, 226–235. [Google Scholar] [CrossRef]
  64. Visser, R.; Spinelli, R. Determining the shape of the productivity function for mechanized felling and felling-processing. J. For. Res. 2012, 17, 397–402. [Google Scholar] [CrossRef]
  65. Jylhä, P.; Jounela, P.; Koistinen, M.; Korpunen, H. Koneellinen Hakkuu: Seurantatutkimus (Mechanized Cutting: Follow-Up Study); Natural Resources and Bioeconomy Studies 11; Natural Resources Institute Finland: Helsinki, Finland, 2019; p. 53. [Google Scholar]
  66. Möykkynen, T.; Miina, J.; Pukkala, T.; von Weissenberg, K. Modelling the spread of butt rot in a Picea abies stand in Finland to evaluate the profitability of stump protection against Heterobasidion annosum. For. Ecol. Manag. 1998, 106, 247–257. [Google Scholar] [CrossRef]
  67. Möykkynen, T.; Miina, J.; Pukkala, T. Optimizing the management of a Picea abies stand under risk of butt rot. For. Pathol. 2000, 30, 65–76. [Google Scholar] [CrossRef]
  68. Pukkala, T.; Möykkynen, T.; Thor, M.; Rönnberg, J.; Stenlid, J. Modeling infection and spread of Heterobasidion annosum in even-aged Fennoscandian conifer stands. Can. J. For. Res. 2005, 35, 74–85. [Google Scholar] [CrossRef]
  69. Palander, T.; Eronen, J.; Kärhä, K.; Ovaskainen, H. Development of a wood damage monitoring system for mechanized harvesting. Ann. For. Res. 2018, 61, 1–16. [Google Scholar] [CrossRef]
  70. Palander, T.S.; Eronen, J.P.; Peltoniemi, N.P.; Aarnio, A.I.; Kärhä, K.; Ovaskainen, H.K. Improving a stem-damage monitoring system for a single-grip harvester using a logistic regression model in image processing. Biosyst. Eng. 2019, 180, 36–49. [Google Scholar] [CrossRef]
  71. Murphy, G. Determining Stand Value and Log Product Yields Using Terrestrial Lidar and Optimal Bucking: A Case Study. J. For. 2008, 106, 317–324. [Google Scholar] [CrossRef]
  72. Aruga, K.; Liu, C.; Uemura, R.; Furusawa, T. Economic Balance of a Clearcutting Operation Using Terrestrial LiDAR. Eur. J. For. Eng. 2016, 2, 1–10. [Google Scholar]
  73. Qin, R.; Qiu, Q.; Lam, J.H.M.; Tang, A.M.C.; Leung, M.W.K.; Lau, D. Health assessment of tree trunk by using acoustic-laser technique and sonic tomography. Wood Sci. Technol. 2018, 52, 1113–1132. [Google Scholar] [CrossRef]
  74. Visalga, G.; Petrauskas, E.; Rupšys, P. Method for increasing and accuracy of detecting decay by the Arbotom® 3-D tree tomograph on Picea abies (L.) Karst. tree damaged by Heterobasidion annosum (Fr.) Bref. In Proceedings of the 7th International Scientific Conference Rural Development 2015, Aleksandras Stulginskis University, Kaunas, Lithuania, 19–20 November 2015; Raupelienė, A., Ed.; pp. 1–5. [Google Scholar] [CrossRef]
  75. Gilbert, G.S.; Ballesteros, J.O.; Barrios-Rodriguez, C.A.; Bonadies, E.F.; Cedeño-Sánchez, M.L.; Fossatti-Caballero, N.J.; Trejos-Rodríguez, M.M.; Pérez-Suñiga, J.M.; Holub-Young, K.S.; Henn, L.A.W.; et al. Use of Sonic Tomography to Detect and Quantify Wood Decay in Living Trees. Appl. Plant Sci. 2016, 4, 1–13. [Google Scholar] [CrossRef]
  76. Akay, A.E.; Serin, H.; Pak, M. How stem defects affect the capability of optimum bucking method? J. Fac. For. Istanb. Univ. 2015, 65, 38–45. [Google Scholar] [CrossRef]
Figure 1. Stem volume distribution in the final data of the study (n = 1980).
Forests 10 00874 g001
Figure 2. Distributions of the total stem processing time in the cross-cutting practices by harvester operator.
Forests 10 00874 g002
Figure 3. Stem processing time observations (A), the calculated curves of stem processing time (B) (Table 4), and changes in stem processing time via cross-cutting practice (C) compared to the cross-cutting practice two (Zero level = cutting of one pole of 3 m) as a function of the stem volume.
Forests 10 00874 g003
Figure 4. Calculated effective hour productivity curves of the cutting work (Table 5) and change in the cutting productivity by cross-cutting practice compared to cross-cutting practice two (Zero level = cutting of one pole of 3 m) as a function of the stem volume.
Forests 10 00874 g004
Figure 5. Sawlog removal observations (A), calculated sawlog removal lines (B) (Table 6), and change in sawlog removals by cross-cutting practice (C) compared to cross-cutting practice two (Zero level = cutting of one pole of 3 m) as a function of the stem volume.
Forests 10 00874 g005
Figure 6. Observations of the value recovery of the stem at the roadside landing (A), calculated value recovery lines (B) (Table 7), and change in the value recoveries by cross-cutting practice (C) compared to cross-cutting practice two (Zero level = cutting of one pole of 3 m) as a function of the stem volume.
Forests 10 00874 g006
Figure 7. Measured observations (n = 202) of the diameter and height of the decayed column in the stem, and the calculated line of the height of the decayed column (Table 8) as a function of the diameter of the decayed column at the stump height.
Forests 10 00874 g007
Figure 8. The cutting productivity curves of healthy softwood stems as a function of the stem volume presented by some selected studies from the 21st century in the final fellings [42,43,54,59,60,61,62,63,64,65]. All stem volumes and productivities are over bark figures. The productivities by Brunberg [60] and Spinelli et al. [63] are the operating hour productivities (m3 E15−1), and the rest of the cutting productivity curves are the effective hour productivities (m3 E0−1).
Forests 10 00874 g008
Table 1. Main technical specifications of the study harvesters.
PropertyJohn Deere 1270GKomatsu 911.5Komatsu 931.1Ponsse Ergo
Weight (kg) 122,60019,70021,30020,900
EngineJD 6090 PowerTech PlusAgco Sisu Power 74 AWIAgco Sisu Power 74 AWIMercedes-Benz OM 936 LA
Power (kW)200170193210
BoomJohn Deere CH7Valmet CRH18Komatsu CRH22Ponsse C5
Maximum reach (m)11.710.09.810.0
Lifting capacity gross (kNm)197186217248
Harvester headJohn Deere H414Komatsu 365Komatsu 365Ponsse H7
Weight (kg)1100120012001150
Felling diameter (cm)62656564
Delimbing diameter (cm)43474775
1 In work weight equipped with tracks and chains in the study.
Table 2. Work elements of the stem cutting used in the time and motion studies.
Work ElementDescription
MovingMoving forward and reversing started when the harvester started to move and ended when the harvester stopped to perform another task.
Boom-outSteering out the boom and grabbing (i.e., Boom-out) started when the boom started to swing towards a tree and ended when the harvester’s head rested on a tree and the felling cut began.
FellingFelling started when the felling cut began and ended when the feeding and delimbing of the stem started.
ProcessingProcessing consisted of delimbing and cross-cutting, as well as sounding. Processing started when the feeding rolls started to turn and ended when the last piece of the stem dropped from the harvester’s head.
Boom-inSteering the boom front (i.e., Boom-in) occurred when the harvester operator steered the harvester’s head to the front of the harvester before moving forward or reversing.
Miscellaneous timeMiscellaneous times in cutting work included the planning of work, clearing of undergrowth, sorting of industrial roundwood poles, and removing of logging residues.
Table 3. Cost functions of timber harvesting for calculating the value recoveries of the stems.
Cross-Cutting PracticeHarvesting Cost Function
Healthy stem3.878 + 1.485/x
Butt-rotten stem (1 pole of 3 m)3.906 + 1.588/x
Butt-rotten stem (1 offcut)3.925 + 1.784/x
Butt-rotten stem (2 offcuts)3.898 + 2.021/x
Butt-rotten stem (3 offcuts)3.915 + 2.218/x
Butt-rotten stem (4 offcuts)3.910 + 2.201/x
Butt-rotten stem (5 offcuts)3.918 + 2.278/x
HC = a + b/x where HC = harvesting cost (€ m−3); x = stem volume (m3); a = constant; b = coefficient of the variable.
Table 4. Regression models for the stem processing time consumption by cross-cutting practice.
Cross-Cutting PracticeEstimate of CoefficientStandard Error of Estimatet-Value
Healthy stem
a23.8451.99511.951 ***
b53.8957.4577.227 ***
c–26.6008.321–3.197 ***
d9.0542.7453.298 ***
e–7.7580.519–14.954 ***
Adjusted R2 = 0.561; F value = 634.5 ***; Standard error of the estimate of the model = 10.455
Butt-Rotten Stem (1 pole of 3 m)
a16.8472.0468.234 ***
b59.3697.8647.550 ***
c–32.9748.776–3.757 ***
d11.3002.8943.904 ***
e0.9460.7721.226
Adjusted R2 = 0.512; F value = 520.5 ***; Standard error of the estimate of the model = 11.027
Butt-Rotten Stem (1 offcut)
a16.0042.0267.899 ***
b61.2877.7657.892 ***
c–35.3098.664–4.075 ***
d12.0542.8584.218 ***
e5.8150.8366.955 ***
Adjusted R2 = 0.524; F value = 544.6 ***; Standard error of the estimate of the model = 10.899
Butt-Rotten Stem (2 offcuts)
a17.2502.0038.614 ***
b56.8827.6927.395 ***
c–30.4298.581–3.546 ***
d10.3582.8313.659 ***
e11.1511.1829.436 ***
Adjusted R2 = 0.533; F value = 565.4 ***; Standard error of the estimate of the model = 10.791
Butt-Rotten Stem (3 offcuts)
a16.8342.0138.363 ***
b59.1257.7277.651 ***
c–32.7478.621–3.798 ***
d11.1502.8443.921 ***
e16.1071.9668.194 ***
Adjusted R2 = 0.528; F value = 554.2 ***; Standard error of the estimate of the model = 10.848
Butt-Rotten Stem (4 offcuts)
a17.4122.0218.616 ***
b56.5727.7657.286 ***
c–29.4508.667–3.398 ***
d9.9642.8603.483 ***
e15.5472.1187.341 ***
Adjusted R2 = 0.525; F value = 547.4 ***; Standard error of the estimate of the model = 10.884
Butt-Rotten Stem (5 offcuts)
a16.8822.0368.290 ***
b59.9427.8177.668 ***
c–34.0178.723–3.900 ***
d11.6692.8774.056 ***
e17.4573.8974.479 ***
Adjusted R2 = 0.517; F value = 530.0 ***; Standard error of the estimate of the model = 10.976
*** p < 0.001; y1 = a + bx + cx2 + dx3 + ekd where y1 = stem processing time (s stem−1); x = stem volume (m3); kd = dummy variable of cross-cutting practice: k1 = 1, if healthy stem, otherwise 0; k2 = 1, if butt-rotten stem (one pole of 3 m), otherwise 0; k3 = 1, if butt-rotten stem (one offcut), otherwise 0; k4 = 1, if butt-rotten stem (two offcuts), otherwise 0; k5 = 1, if butt-rotten stem (three offcuts), otherwise 0; k6 = 1, if butt-rotten stem (four offcuts), otherwise 0; k7 = 1, if butt-rotten stem (five offcuts), otherwise 0; a = constant; b, c, d, e = coefficients of the variables.
Table 5. Effective hour productivity functions of the cross-cutting work of the stem.
Cross-Cutting PracticeCutting Productivity Function
Healthy stem8.219 + 72.262x – 21.442x2 + 0.837x3
Butt-rotten stem (1 pole of 3 m)7.778 + 65.628x – 15.578x2 – 0.841x3
Butt-rotten stem (1 offcut)6.588 + 60.140x – 11.858x2 – 1.551x3
Butt-rotten stem (2 offcuts)4.838 + 57.384x – 11.946x2 – 0.880x3
Butt-rotten stem (3 offcuts)4.213 + 52.460x – 9.251x2 – 1.339x3
Butt-rotten stem (4 offcuts)4.067 + 54.003x – 11.002x2 – 0.740x3
Butt-rotten stem (5 offcuts)4.053 + 51.003x – 8.208x2 – 1.612x3
P = a + bx + cx2 + dx3 where P = the effective hour cutting productivity (m3 E0−1); x = stem volume (m3); a = constant; and b, c, d = coefficients of the variables.
Table 6. Regression models for the sawlog removal by cross-cutting practice.
Cross–Cutting PracticeEstimate of CoefficientStandard Error of Estimatet-Value
Healthy Stem
a–0.2300.005–49.845 ***
b0.9730.005202.280 ***
c0.1210.00432.277 ***
Adjusted R2 = 0.955; F value = 20,801 ***; Standard error of the estimate of the model = 0.075
Butt–Rotten Stem (1 pole of 3 m)
a–0.1160.004–29.720 ***
b0.9590.005194.084 ***
c–0.1620.005–29.909 ***
Adjusted R2 = 0.952; F value = 19,738 ***; Standard error of the estimate of the model = 0.077
Butt–Rotten Stem (1 offcut)
a–0.1400.005–30.255 ***
b0.9690.006163.428 ***
c–0.0230.007–3.177 ***
Adjusted R2 = 0.931; F value = 13,354 ***; Standard error of the estimate of the model = 0.093
Butt–Rotten Stem (2 offcuts)
a–0.1410.005–30.936 ***
b0.9710.006164.315 ***
c–0.0590.010–5.814 ***
Adjusted R2 = 0.932; F value = 13,526 ***; Standard error of the estimate of the model = 0.092
Butt–Rotten Stem (3 offcuts)
a–0.1410.005–30.981 ***
b0.9700.006163.950 ***
c–0.0790.017–4.693 ***
Adjusted R2 = 0.931; F value = 13,441 ***; Standard error of the estimate of the model = 0.093
Butt–Rotten Stem (4 offcuts)
a–0.1410.005–31.055 ***
b0.9700.006165.088 ***
c–0.1240.018–6.925 ***
Adjusted R2 = 0.932; F value = 13,628 ***; Standard error of the estimate of the model = 0.092
Butt–Rotten Stem (5 offcuts)
a–0.1420.005–31.306 ***
b0.9710.006164.596 ***
c–0.2020.033–6.165 ***
Adjusted R2 = 0.932; F value = 13,556 ***; Standard error of the estimate of the model = 0.092
*** p < 0.001. SLR = a + bx + ckd where SLR = sawlog removal (m3); x = stem volume (m3); kd = dummy variable of cross-cutting practice: k1 = 1, if healthy stem, otherwise 0; k2 = 1, if butt-rotten stem (one pole of 3 m), otherwise 0; k3 = 1, if butt-rotten stem (one offcut), otherwise 0; k4 = 1, if butt-rotten stem (two offcuts), otherwise 0; k5 = 1, if butt-rotten stem (three offcuts), otherwise 0; k6 = 1, if butt-rotten stem (four offcuts), otherwise 0; k7 = 1, if butt-rotten stem (five offcuts), otherwise 0; a = constant; b, c = coefficients of the variables.
Table 7. Regression models for the value recovery of the stem at the roadside landing by cross-cutting practice.
Cross-Cutting PracticeEstimate of CoefficientStandard Error of Estimatet-Value
Healthy Stem
a–8.6620.197–44.010 ***
b63.1110.205307.924 ***
c6.3980.15940.201 ***
Adjusted R2 = 0.980; F value = 47,886 ***; Standard error of the estimate of the model = 3.213
Butt–Rotten Stem (1 pole of 3 m)
a–2.7460.180–15.244 ***
b62.4130.228273.532 ***
c–7.6180.250–30.523 ***
Adjusted R2 = 0.975; F value = 38,575 ***; Standard error of the estimate of the model = 3.571
Butt–Rotten Stem (1 offcut)
a–3.8370.214–17.924 ***
b62.8840.275228.609 ***
c–1.3540.331–4.095 ***
Adjusted R2 = 0.964; F value = 26,131 ***; Standard error of the estimate of the model = 4.313
Butt–Rotten Stem (2 offcuts)
a–3.9010.210–18.600 ***
b63.0350.273231.211 ***
c–3.7480.466–8.039 ***
Adjusted R2 = 0.964; F value = 26,782 ***; Standard error of the estimate of the model = 4.263
Butt–Rotten Stem (3 offcuts)
a–3.9140.211–18.576 ***
b62.9310.273230.492 ***
c–5.4050.775–6.972 ***
Adjusted R2 = 0.964; F value = 26,564 ***; Standard error of the estimate of the model = 4.279
Butt–Rotten Stem (4 offcuts)
a–3.9010.208–18.797 ***
b62.9600.269234.068 ***
c–8.5660.817–10.479 ***
Adjusted R2 = 0.965; F value = 27,397 ***; Standard error of the estimate of the model = 4.216
Butt–Rotten Stem (5 offcuts)
a–4.0070.209–19.201 ***
b63.0260.271232.759 ***
c–14.1371.505–9.396 ***
Adjusted R2 = 0.965; F value = 27,104 ***; Standard error of the estimate of the model = 4.238
*** p < 0.001. VR = a + bx + ckd where VR = value recovery (€ stem−1); x = stem volume (m3); kd = dummy variable of cross-cutting practice: k1 = 1, if healthy stem, otherwise 0; k2 = 1, if butt-rotten stem (one pole of 3 m), otherwise 0; k3 = 1, if butt-rotten stem (one offcut), otherwise 0; k4 = 1, if butt-rotten stem (two offcuts), otherwise 0; k5 = 1, if butt-rotten stem (three offcuts), otherwise 0; k6 = 1, if butt-rotten stem (four offcuts), otherwise 0; k7 = 1, if butt-rotten stem (five offcuts), otherwise 0; a = constant; b, c = coefficients of the variables.
Table 8. Regression model for the height of the decayed column in the stem.
CoefficientEstimate of CoefficientStandard Error of Estimatet-Value
B7.3620.29425.026 ***
Adjusted R2 = 0.298; F value = 626.3 ***; Standard error of the estimate of the model = 52.578
*** p < 0.001. DH = b×DD where DH = height of the decayed column (cm); DD = diameter of the decay at the stump height (cm); b = coefficient of the variable.

