Article

Environmental Filtering Drives Local Soil Fungal Beta Diversity More Than Dispersal Limitation in Six Forest Types along a Latitudinal Gradient in Eastern China

1
Key Laboratory of Geospatial Technology for the Middle and Lower Yellow River Regions, Ministry of Education, College of Environment and Planning, Henan University, Kaifeng 475004, China
2
Henan Key Laboratory of Integrated Air Pollution Control and Ecological Security, Henan University, Kaifeng 475004, China
*
Author to whom correspondence should be addressed.
Forests 2019, 10(10), 863; https://doi.org/10.3390/f10100863
Submission received: 13 August 2019 / Revised: 13 September 2019 / Accepted: 23 September 2019 / Published: 2 October 2019
(This article belongs to the Section Forest Ecology and Management)

Abstract

:
Biogeographic patterns of soil fungal diversity have been well documented in forest ecosystems, but the underlying mechanisms and processes that shape these patterns remain relatively unknown. This study took soil samples from 300 forest plots spanning six forest types along a latitudinal gradient in eastern China, which ranges from tropical rainforest to boreal forest ecosystems. A null-model analysis was used to compare the observed soil fungal beta diversity (β-diversity) with the β-diversity expected from random sampling of each local species pool. We also compared the relative importance of environmental and spatial variables on soil fungal β-diversity among forest types along the latitudinal gradient. Our results found that observed β-diversity was greater than expected β-diversity in all six forest types, which means that species tend to be more aggregated than expected. We determined that this species aggregation resulted from both environmental filtering and species dispersal limitations. Further, environmental variables had stronger influences on β-diversity than spatial dispersions. Additionally, the co-occurrence network showed that more species interactions occurred in the mid-latitude forests which lead to decreased soil fungal β-diversity and low interpretations of environmental and spatial variables. Study of these processes in different forest types along latitudinal gradients will provide important insights that local differences in the relative importance of different community assembly processes creates different gradients in global biodiversity.

1. Introduction

Over the past several decades, researchers have found that soil microbes exhibit some biogeographic patterns in species diversity and distribution [1]. The mechanisms underlying these biogeographic patterns are difficult to distinguish in forest ecosystems because multiple community assembly processes may govern biogeographic variation in soil microbe diversity [2,3]. For example, soil fungal community composition could result from niche processes (such as environmental filtering) [4,5]. Alternatively, neutral processes associated with dispersal limitations also contribute to the patterns of a soil fungal community [6,7]. These processes are difficult to separate, and therefore a more comprehensive perspective should integrate both processes to understand how and why their relative influences vary across forest types [8].
One way to disentangle multiple community assembly processes is to examine patterns of diversity across forest types, with a particular focus on beta-diversity (β-diversity). Patterns of site-to-site variation in species community assemblage, known as β-diversity, can provide fundamental insights into the importance of community assembly processes in generating community structure along biogeographical gradients [3,9]. The concept of β-diversity links not only the relationship between local diversity and regional diversity, but also captures the fundamental point of environmental gradients on species assemblages [10,11]. Soil microbial β-diversity is often associated with three main community assembly mechanisms. First, niche-based processes, for example, environmental filtering, could increase β-diversity [12]. This is because species are selected from a regional species pool based on their niche, but subsequent filtering of species composition could vary with environmental factors [13,14]. Many environmental factors, such as temperature and soil parameters play important roles in structuring microbial communities [15,16,17,18]. Second, species dispersal limitation, a key component of the neutral theory [19], also could increase β-diversity [20,21]. Increasing evidence shows that dispersal limitation has an important role in determining the composition of soil microbial communities, since individual species tend to disperse to nearby areas, and closer sites will always contain more similar species than those further apart [22]. Thus, dispersal limitation could lead to aggregated distributions of soil microbial species [23] and increase β-diversity. Third, variations in β-diversity patterns can also result from species interactions [14,24], with greater interspecific competition decreasing β-diversity [25]. These mechanisms are widely recognized as key factors for shaping soil microbial distribution but understanding how these processes affect soil microbial β-diversity patterns in forests with different environments have until recently received limited attention [26].
Mechanisms shaping soil microbial communities are ultimately governed by the underlying structure of the environment gradients [21,27]. A strong role of environmental heterogeneity or homogeneity on the microbial community has been observed among different regions [21,28]. The difference in soil microbial diversity among locations may be due to the variety of environmental gradients [29,30]. It is also likely that the striking gradients in species composition may attribute to changes of species dispersal limitation across geographic scales [31]. Dispersal limitation varies with different geographic gradients, and such gradient-dependent patterns have also been observed in soil microorganisms [32]. In addition, biotic interactions within fungal communities may vary along latitudinal gradients, resulting in different strengths of assembly of different mechanisms across forest ecosystems [33]. Yet, few studies to date have focused on how these complex assembly processes shape observed patterns together in soil fungal diversity in different forest types across latitudinal gradients.
Soil fungi are crucial components of microbial communities in forest ecosystems, where they play fundamental ecological roles in soil formation, conservation and regulating nutrient cycling [34]. To investigate the mechanisms underlying soil fungal β-diversity in different forest types along a latitudinal gradient, we took soil samples from 300 forest plots spanning six forest types in eastern China that ranged from tropical (18°43′ N) to cold temperate climates (53°27′ N). We compared soil fungal β-diversity in six forest types and analyzed whether it was different from a null model based on random sampling from the regional species pool [11]. Deviations of β-diversity from the null expectation (β-deviation) would suggest an overriding role for biogeographical processes that determine the distributions of soil fungi. Positive β-deviations would indicate that species are more spatially aggregated (or discrete clustering) due to dispersal limitation or environmental filtering; negative β-deviations indicate that species are over-dispersed as a result of species interactions; finally, β-deviations of zero would indicate that species are determined by stochastic processes [3,11]. We aimed to address the following main questions: (1) How does soil fungal β-diversity vary among forest types along a latitudinal gradient? Do soil fungi show aggregation or over-dispersed distribution? (2) What are the changes of community assembly processes that shape soil fungal β-diversity in different forest types across latitudinal gradients? Does the relative importance of underlying community assembly processes vary across different forest types?

2. Materials and Methods

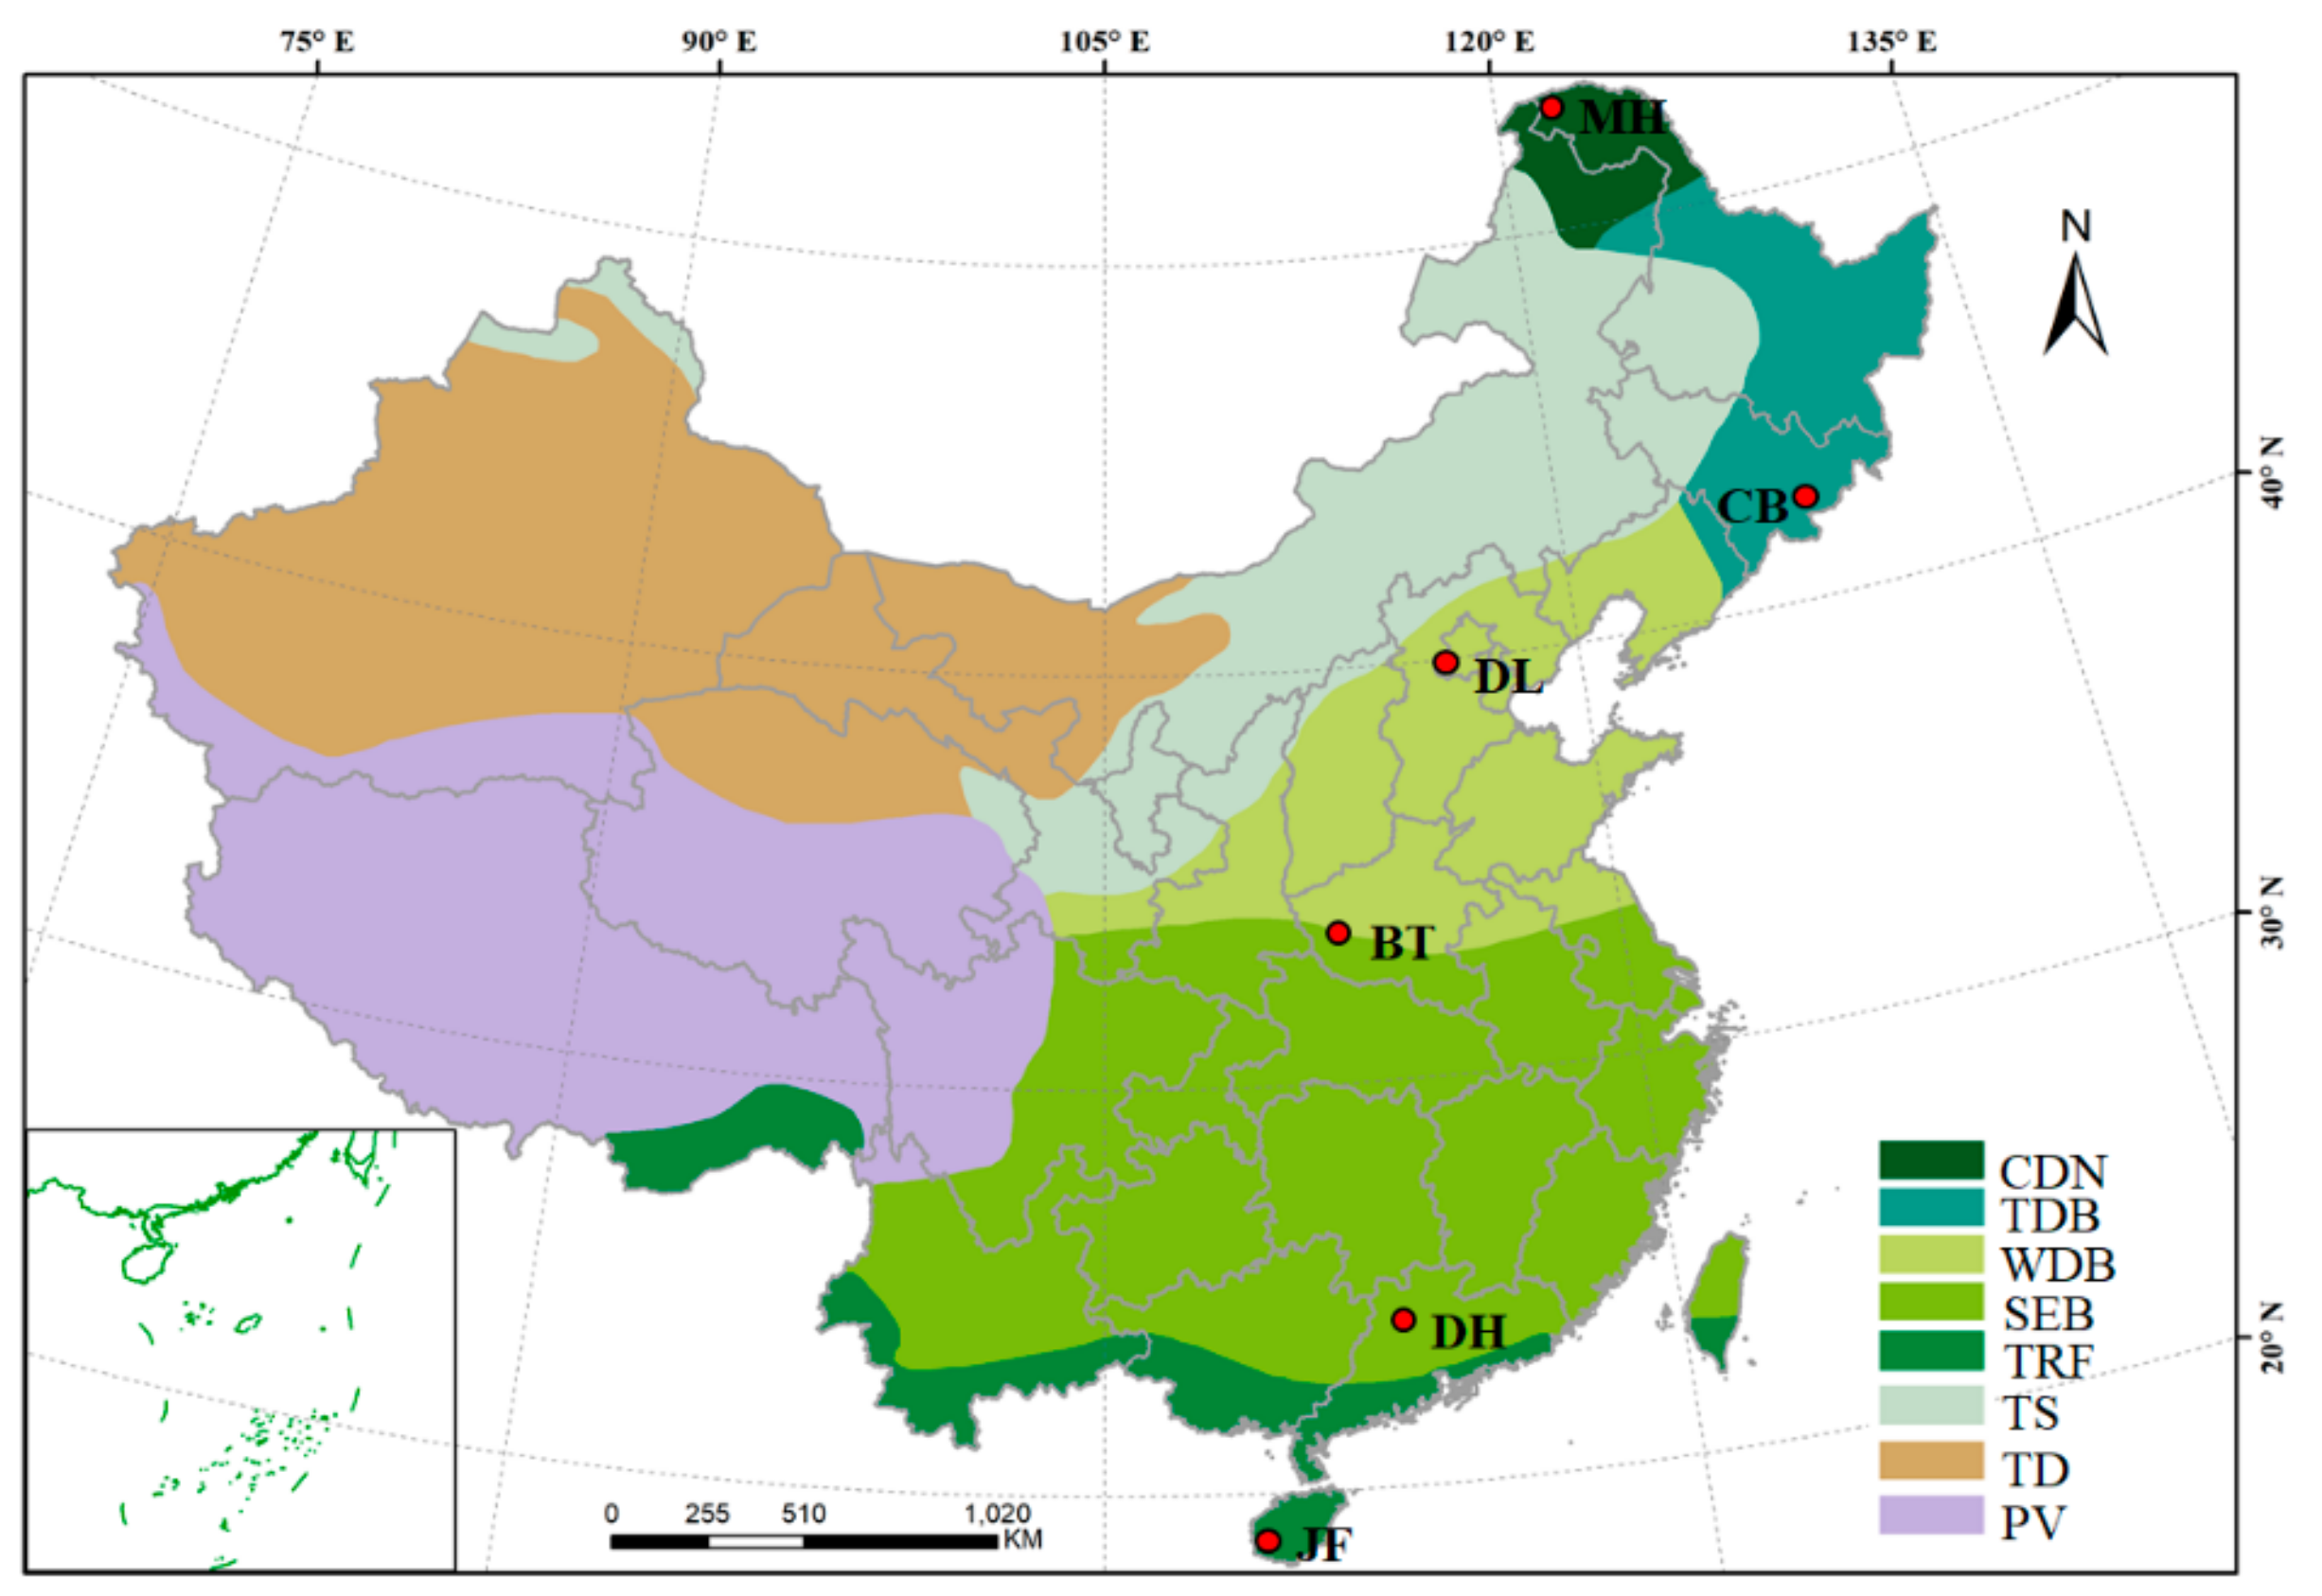
2.1. Experimental Design and Field Sampling

Six forest types from south to north of eastern China across the latitudinal gradient were selected in our study. Those forests span a latitudinal range from 18°43′ N to 53°27′ N (Figure 1). The mean annual temperature ranges from 24.5 to –5.5 °C. The mean annual precipitation ranges from 460 to 2449 mm. The selected forest types were named according to the classification given by Zhang [35]. These forest types are the major forest types of eastern China: tropical rain forest (TRF), subtropical evergreen broad-leaved forest (SEB), subtropical evergreen-deciduous broad-leaved mixed forest (SED), warm-temperate deciduous broad-leaved forest (WDB), temperate needle-leaf and deciduous broad-leaved mixed forest (TDB) and cold-temperate deciduous needle-leaf forest (CDN). Information about site locations and vegetation are given in Table 1.
A total of 300 plots (fifty 20 × 20 m plots in each forest type) were sampled. In each forest type, the ranges of elevations and slopes were similar. The farthest distance between the two plots was about 9 km in each forest type and plots were far from any areas with recent anthropogenic disturbance. Our spatial sampling approach was appropriate to capture the potential responses of soil fungal species composition to fine-grained environmental heterogeneity and the effects of distance among locations at similar scales. Five soil cores taken at depths ranging from 0 to 10 cm were combined into a single sample for each 20 × 20 m plot. Roots and rocks were removed before homogenizing each soil sample. Each soil sample was taken to the laboratory in an ice box and then kept at −80 °C for subsequent DNA extraction and molecular test.

2.2. Climate Data and Geographic Distance

We obtained the mean annual temperature and the mean annual precipitation of each plot from the WorldClim database (www.worldclim.org) [36]. Geographic coordinates and the elevation of each plot were recorded with a handheld GPS. The pairwise geographic distance between plots was calculated using the Imap package in R using the coordinates.

2.3. Soil Physicochemical Analysis

Soil pH was measured with a digital pH meter (Mettler-Toledo GmbH, Greifensee, Switzerland) using a 1:2.5 (volume) soil/water mixture. Soil water content (SWC) was weighed after drying in an oven at 105 °C for 48 h. Soil organic carbon (SOC), soil total nitrogen (STN) and soil available nitrogen (SAN) were measured in the laboratory according to standard methods [37]. Soil C/N ratio was determined from the soil organic carbon and total nitrogen concentrations.

2.4. Amplification, Illumina Sequencing and Bioinformatics

We extracted microbial genomic DNA using the MoBio PowerSoil DNA isolation kit (MoBio Laboratories, Carlsbad, CA, USA) [38]. We assessed the quality and concentrations of the extracted DNA using a NanoDrop Spectrophotometer (NanoDrop Technologies Inc., Wilmington, DE, USA), and each sample was stored at −20 °C until further use. The universal primers ITS4 (5′-TCCTCCGCTTATTGATATGC-3′) and gITS7F (5′-GTGA RTCATCGARTCTTTG-3′) were used for PCR amplification. PCR products for each sample were pooled and purified using SanPrep DNA Gel Extraction Kit (Sangon Biotech, Shanghai, China). All the PCR products were mixed in equal molar amounts for library construction, and then sequenced with the Illumina MiSeq platform. The details of the PCR procedure and Miseq sequencing were described previously [39].
Raw sequence data were processed using the QIIME software platform (1.7.0). The sequence libraries were split and denoised to avoid diversity overestimation. A total of 7000 sequences per sample were performed. Operational taxonomic units (OTUs) were clustered with a 97% similarity cutoff using the UPARSE pipeline, and chimeric sequences were identified and removed using UCHIME [40] Singleton OTUs and OTUs that were assigned to non-fungal organisms or that had unreliable BLAST matches were removed. These OTUs were then used as a foundation for calculating β-diversity metrics using QIIME software platform (1.7.0) [41].

2.5. Statistical Analyses

Soil fungal β-diversity was calculated for each forest type. We defined β-diversity as the community dissimilarity among plots using Bray–Curtis dissimilarity matrices [42]. Principle coordinates analysis (PCoA) was used to explore overall patterns of soil fungal community composition based on Bray–Curtis dissimilarity distances (QIIME software platform 1.7.0.). Soil heterogeneity of each sampling region was tested using the coefficient of variation (CV) for each soil variable. A higher coefficient of variation indicated higher soil heterogeneity [43]. We then used polynomial curve fitting to estimate the relationship between CV and forest types (Origin software 8.5).
A null-model analysis was applied to compare the observed β-diversity with the β-diversity expected from random sampling of each local species pool. After 999 randomization iterations of the null model, a standardized effect size (β-deviation) was calculated as the difference between the observed and expected dissimilarity [3,11]. One-way analysis of variance was used to determine the significant differences of soil fungal β-diversity and β-deviation in all forest types (SPSS 19.0, IBM, New York, NY, USA).
To analyze the influences of environmental and spatial variables on β-diversity, distance-based redundancy analysis (dbRDA) was used to detect the partitioning of variation in β-deviation among environmental and spatial factors (R vegan package) [11]. Environmental variables for each forest type included: six soil variables (soil pH, soil water content, soil organic carbon, soil total nitrogen, soil available nitrogen and soil C/N ratio); two climate variables (the mean annual precipitation and the mean annual temperature); and two topographic variables (elevation and slope). Spatial variables included: coordinates (latitude and longitude of each plot) and spatial eigenfunctions calculated from principal components of neighbor matrices [44,45]. Collinearity among environmental factors was checked before dbRDA was performed [46]. Then, we used forward selection (‘ordiR2step’ in the R vegan package) to partition variation in β-deviations into individual fractions explained by environmental and spatial variables [11,47]. We also analyzed the relationships between matrices for β-diversity and environmental variables using Mantel tests with Spearman correlations (‘vegan’ package in R) [48]. Soil fungal species–species (OTU–OTU) interaction networks were calculated using SparCC, a tool that can estimate correlation values from compositional data. The quality of reads was grouped at 97% sequence identity, and the 500 most abundant OTUs in each forest were selected for calculation. SparCC correlations above 0.6 or below −0.6 and reaching statistical significance (p < 0.01) were used in network analyses [49]. The co-occurrence of networks in each forest was calculated and visualized using the platform Gephi [50]. The nodes in the networks represent the OTUs at 97% identity, and the significant correlations between nodes were represented by edges (connections) [51].

3. Results

The dominant soil fungal phyla across the sampling sites were listed in Table S1. Soil fungal β-diversity showed significant changes along latitudes with the lowest β-diversity in mid-latitude forests (WDB and TDB, p < 0.01; Figure 2). This result was confirmed by the PCoA analysis of community composition, which showed that soil fungal species tend to be more clustered in mid-latitude forests than in high and low latitude forests (TRF, SEB, SED and CDN; Figure 3).
Our null model analysis revealed that observed soil fungal β-diversity was greater than expected in all forest types, regardless of latitude. Consequently, all β-deviations were positive, which suggests that soil fungal species composition is in general aggregated (or clumped) in all six forest types. However, β-deviations were lower in the mid-latitude forests (WDB and TDB, p < 0.01) with less species aggregation (Figure 4).
Whether intraspecific aggregation resulted from environmental filtering or species dispersal limitation was identified, results indicated that both environmental variables and spatial gradients explained a large fraction of the soil fungal β-deviations in each forest type (Figure 5). Environmental and spatial variables explained 26%–34% of the β-deviations in low and high latitude forests (TRF, SEB, SED and CDN), and only explained 14% and 16% in mid-latitude forests (WDB and TDB) (Figure 5a). In addition, environmental variables explained a larger fraction of the β-deviations than spatial variables in all six forest types (Figure 5b). Among these environmental variables, soil pH, soil organic carbon, soil total nitrogen, soil available nitrogen and soil C/N ratio significantly affected β-diversity (Table 2). The CV of soil variables that were significant predictors was higher than those that were not significant, which showed the relative importance of soil heterogeneity in determining β-diversity patterns in low- and high-latitude locations (TRF, SEB, SED and CDN; Figure 6).
The topological features of co-occurrence networks showed that the number of edges was higher in mid-latitude forests (WDB and TDB) than in other forests (Figure 7). Overall, the frequency of soil fungal species co-occurrences showed a hump-shaped pattern with highest competition in the mid-latitude forests.

4. Discussion

Despite these recent efforts to describe different soil fungal β-diversity at different habitats [4,33,52], few studies have focused on whether soil fungi communities present aggregation or diffusion distribution in different forest types along a latitudinal gradient. Although soil fungal β-diversity was found to be remarkably lowest in mid-latitude forests (WDB and TDB) (Figure 2), our null model analysis revealed that soil fungal species tend to be more aggregated in all forest types (Figure 4). Species aggregation can emerge through different community assembly processes, including environmental filtering and dispersal limitation [3]. After applying a model for predicting soil fungal β-diversity that combines spatial and environmental properties, our study further found that environmental filtering by SOC, STN, SAN, soil C/N and soil pH and dispersal limitation appear to work together to determine soil fungal β-diversity (Figure 5a). However, it does not mean that environmental filtering and dispersal limitation processes operate in a similar role in different forest types. The explanation of environmental properties was greater than spatial variables, which means the environmental filter had a stronger influence than dispersal limitation in shaping soil fungal β-diversity patterns in all forest types (Figure 5b). This result is partially consistent with the niche theory which indicates that species can spread anywhere the environment is suitable [53,54]. In addition, the lowest β-deviations in mid-latitude forests suggest that some other community assembly processes (e.g., biotic interactions) decrease species aggregation in those forests [55].
Different soil fungal β-diversity patterns among forest types could be the result of different levels of environmental heterogeneity within forests (Table 2, Figure 6) [33]. Soil fungal community composition has been proven to result from different environmental conditions [4,56]. For example, soil heterogeneity has proved to be an important factor that contributes to soil microbial β-diversity in soils [43]. Habitat specialization resulting from species adaptive strategies has an important role in determining species’ distributions [57]. This crucial process is strongly driven by environmental heterogeneity [58]. Thus, in comparison with relatively homogeneous environments in mid-latitude forests (Figure 6), heterogeneous soil environment in low- and high-latitude forests (TRF, SEB, SED and CDN) may increase β-diversity by enhancing environmental filtering. The effects of different heterogeneous soil factors on soil fungal β-diversity can be explained from the following existing studies. For example, soil nutrients always tend to accumulate heterogeneously in forest ecosystems [59], and the variation of soil nutrients can be extraordinarily high even at fine spatial scales [4]. Due to variation in utilization of edaphic nutrients by fungal species, which vary in their ability to produce enzymes [60,61], soil nutrient heterogeneity can substantially influence soil fungal anabolism and foraging strategies [62,63]. Thus, the heterogeneity of soil C/N and soil pH among forest types along a latitudinal gradient were key factors constraining soil fungal β-diversity patterns in our study. Overall, this result together with other results showing soil nutrients (such as soil C and N) and soil pH are important determinants of soil fungal β-diversity [64,65]. Our results also show that soil fungal β-diversity in different forest types is affected by different soil C/N and soil pH, and there is no one soil parameters that is responsible for β-diversity in all forest types. This result reflects the variability and unpredictability of soil factors that affect β-diversity in different forest types.
Some studies considered that soil pH has little effect on soil fungal communities [66,67], others identified soil pH as an important predictor of soil fungal communities at both global [68] and fine [4] spatial scales. Those uncertainties of the effect of soil pH on soil fungal communities may be due to the lack of comparative study. Our results suggest that soil pH could be a driver that explains β-diversity in TRF and TDB with relatively higher soil pH CVs, however, the lack of a significant relation with other forests shows that it is still weak to confirm soil pH as a determinant of soil fungal β-diversity in a forest ecosystem. This may be because although soil pH can directly affect fungal community composition by imposing a physiological constraint on soil fungal survival and growth [69], little effect will exist if soil pH is in a stable range [70]. Furthermore, soil pH may also affect fungal communities indirectly; only when there is significant interaction can soil pH impact soil fungal β-diversity significantly, for example, through soil nutrient availability and altered interactions between soil fungi and bacteria [71].
In addition, even though mean annual temperature and mean annual precipitation are good predictors of soil fungal community composition at a continental scale [68,72], we showed that these climatic variables cannot predict the pattern of soil fungal β-diversity at local scales along the latitude. This result is inconsistent with those of previous studies which highlighted the weak effects of climate on soil microbial diversity at relatively small spatial scales [73,74]. The weak correlation is likely because climate factors are relatively invariant at local spatial scales.
Soil fungal communities become less similar with increasing geographic distance at both large [75,76] and small spatial scales [31]. Similar dispersal limitation was observed in our study, which showed that there is a limited spatial distribution of soil fungal communities at local scales in six forest types. Dispersal limitation resulted in strong species aggregation of soil fungi, but that effect was second to environmental effects in our study (Figure 5b). This may be because species dispersal itself is affected by environmental factors. Indeed, variation in species dispersal limitation is significantly related to the variability of environmental heterogeneity among different habitats [77]. For example, spatial configuration and environmental variety (e.g., size or isolation of habitats) have important impact on the resistance to movement of many species, and therefore to dispersal abilities in Amazonian forests [78]. Thus, the dispersal limitation of soil fungi in our study may be affected by environmental heterogeneity [79]. In addition, the dispersal limitation of soil fungi may be also due to the property of soil fungal species themselves. Since they are generally larger, soil fungi are more likely to be blocked by geographical barriers than bacteria and archaea [80]. Soil fungi were predominantly hypogenous with relatively short spatial transmission distance, but this may also be due to poor competitions of some fungi that cannot settle in new habitats [5]. For example, fungi in the genus Glomus which exist as arbuscular mycorrhizal symbionts undergo dispersal limitation at small scales (<3 km) [81]. This dispersal limitation then reduces the likelihood that soil fungal species reach all suitable habitats, resulting in intraspecific aggregation in all six forest types.
It is noteworthy that the low β-diversity and β-deviation in the mid-latitude forests (WDB and TDB) may be related to community assembly processes that lead to species homogeneity, such as interspecific competition [14,24]. A co-occurrence network-based analysis was used to evaluate the potential contributions of species interactions. This network method has been effectively applied to explore potential microbial interactions beyond those of simple richness and composition in various ecosystems [55,82]. With a series of significant soil fungal species–species correlations, our results suggest that soil fungal species interaction intensity in mid-latitude forests was higher than in low and high latitudes (Figure 7), leading to a decrease in β-diversity and little effect of environmental and spatial variables. The potential explanation for this strong species interaction may be the homogeneous environment in mid-latitude forests, which results in weak niche differentiation between soil fungal species [83,84].
Although the selected environmental parameters and geographic distance explained 14–34% of the variation in soil fungal β-diversity, a large proportion of the variation could not be explained which indicated that soil fungal β-diversity may reflect a series of undiscovered community assembly processes (e.g., ecological drift) [85], plants [86], species pool [25], or some unmeasured environmental factors, such as soil nutrient availability and soil texture [81]. Clearly, the multiple processes and factors which determine soil fungal β-diversity in different forest types, and accurate prediction of changes in soil fungal β-diversity of forest ecosystems at local to global scales require comprehensive data acquisition and targeted sampling along environmental gradients.

5. Conclusions

This study shows a systematic analysis of local soil fungal community assembly processes in six forest types along a latitudinal gradient, which run from the tropics to the cold temperate forests of eastern China. The results show that soil fungal species tend to be more aggregated than expected in all forest types along a latitudinal gradient. This aggregated distribution of soil fungal β-diversity was explained by a combination of community assembly processes, including environmental filtering and species dispersal limitation. We further found that environmental variables had a stronger influence on soil fungal β-diversity than species dispersal limitation. Additionally, soil fungi showed more species interactions in the mid-latitude forests, which decreased the clustering of soil fungal species. Although it is difficult to disentangle the mechanisms that maintain the compositional patterns of soil fungal communities, our study provides an important attempt to explore fungal β-diversity patterns from forest soil across latitudes, and to consider their complex mechanisms in relation to basic models in theoretical macroecology.

Supplementary Materials

The following are available online at https://www.mdpi.com/1999-4907/10/10/863/s1, Table S1: The dominant soil fungal phyla across the sampling sites.

Author Contributions

Data curation, Y.H.; funding acquisition, X.Z. and S.F.; writing—original draft, Y.H.; writing—review and editing, X.Z., S.F. and W.Z.

Funding

This work was supported by the National Natural Science Foundation of China (No. 31700383, No. 31800375) and the Innovation Scientists and Technicians Troop Construction Projects of Henan Province (182101510005).

Acknowledgments

The authors are grateful to Xiaojing Liu, Ji Ye and Zhanqing Hao for their help during soil sampling. They would like to thank Joshua Daskin at Yale University for his assistance with English language and grammatical editing.

Conflicts of Interest

We declare no conflicts of interest.

References

  1. Hanson, C.A.; Fuhrman, J.A.; Horner-Devine, M.C.; Martiny, J.B.H. Beyond biogeographic patterns: Processes shaping the microbial landscape. Nat. Rev. Genet. 2012, 10, 497. [Google Scholar] [CrossRef] [PubMed]
  2. Ricklefs, R.E. A comprehensive framework for global patterns in biodiversity. Ecol. Lett. 2004, 7, 1–15. [Google Scholar] [CrossRef] [Green Version]
  3. Kraft, N.J.B.; Comita, L.S.; Chase, J.M.; Sanders, N.J.; Swenson, N.G.; Crist, T.O.; Stegen, J.C.; Vellend, M.; Boyle, B.; Anderson, M.J.; et al. Disentangling the drivers of β diversity along latitudinal and elevational gradients. Science 2011, 333, 1755–1758. [Google Scholar] [CrossRef] [PubMed]
  4. Glassman, S.I.; Wang, I.J.; Bruns, T.D. Environmental filtering by pH and soil nutrients drives community assembly in fungi at fine spatial scales. Mol. Ecol. 2017, 26, 6960–6973. [Google Scholar] [CrossRef] [PubMed] [Green Version]
  5. Kivlin, S.N.; Winston, G.C.; Goulden, M.L.; Treseder, K.K. Environmental filtering affects soil fungal community composition more than dispersal limitation at regional scales. Fungal Ecol. 2014, 12, 14–25. [Google Scholar] [CrossRef] [Green Version]
  6. Wu, B.; Tian, J.; Bai, C.; Xiang, M.; Sun, J.; Liu, X. The biogeography of fungal communities in wetland sediments along the Changjiang River and other sites in China. ISME J. 2013, 7, 1299–1309. [Google Scholar] [CrossRef] [PubMed] [Green Version]
  7. Cline, L.C.; Zak, D.R. Dispersal limitation structures fungal community assembly in a long-term glacial chronosequence. Environ. Microbiol. 2014, 16, 1538–1548. [Google Scholar] [CrossRef] [PubMed]
  8. Powell, J.R.; Karunaratne, S.; Campbell, C.D.; Yao, H.; Robinson, L.; Singh, B.K. Deterministic processes vary during community assembly for ecologically dissimilar taxa. Nat. Commun. 2015, 6, 8444. [Google Scholar] [CrossRef] [PubMed] [Green Version]
  9. Condit, R.; Pitman, N.; Leigh, E.G.; Chave, J.; Terborgh, J.; Foster, R.B.; Núñez, P.; Aguilar, S.; Valencia, R.; Villa, G.; et al. Beta-Diversity in Tropical Forest Trees. Science 2002, 295, 666–669. [Google Scholar] [CrossRef] [Green Version]
  10. Anderson, M.J.; Crist, T.O.; Chase, J.M.; Vellend, M.; Inouye, B.D.; Freestone, A.L.; Sanders, N.J.; Cornell, H.V.; Comita, L.S.; Davies, K.F. Navigating the multiple meanings of β diversity: A roadmap for the practicing ecologist. Ecol. Lett. 2011, 14, 19–28. [Google Scholar] [CrossRef]
  11. Myers, J.A.; Chase, J.M.; Jiménez, I.; Jørgensen, P.M.; Araujo-Murakami, A.; Paniagua-Zambrana, N.; Seidel, R. Beta-diversity in temperate and tropical forests reflects dissimilar mechanisms of community assembly. Ecol. Lett. 2013, 16, 151–157. [Google Scholar] [CrossRef] [PubMed]
  12. Bell, T. Experimental tests of the bacterial distance—Decay relationship. ISME J. 2010, 4, 1357. [Google Scholar] [CrossRef]
  13. Tilman, D. Niche tradeoffs, neutrality, and community structure: A stochastic theory of resource competition, invasion, and community assembly. Proc. Natl. Acad. Sci. USA 2004, 101, 10854–10861. [Google Scholar] [CrossRef] [PubMed] [Green Version]
  14. Nemergut, D.R.; Schmidt, S.K.; Fukami, T.; O’Neill, S.P.; Bilinski, T.M.; Stanish, L.F.; Knelman, J.E.; Darcy, J.L.; Lynch, R.C.; Wickey, P.; et al. Patterns and Processes of Microbial Community Assembly. Microbiol. Mol. Biol. Rev. 2013, 77, 342–356. [Google Scholar] [CrossRef] [PubMed] [Green Version]
  15. Maestre, F.T.; Delgado-Baquerizo, M.; Jeffries, T.C.; Eldridge, D.J.; Ochoa, V.; Gozalo, B.; Quero, J.L.; García-Gómez, M.; Gallardo, A.; Ulrich, W.; et al. Increasing aridity reduces soil microbial diversity and abundance in global drylands. Proc. Natl. Acad. Sci. USA 2015, 112, 15684–15689. [Google Scholar] [CrossRef] [PubMed] [Green Version]
  16. Prober, S.M.; Leff, J.W.; Bates, S.T.; Borer, E.T.; Firn, J.; Harpole, W.S.; Lind, E.M.; Seabloom, E.W.; Adler, P.B.; Bakker, J.D. Plant diversity predicts beta but not alpha diversity of soil microbes across grasslands worldwide. Ecol. Lett. 2015, 18, 85–95. [Google Scholar] [CrossRef]
  17. Shen, C.; Xiong, J.; Zhang, H.; Feng, Y.; Lin, X.; Li, X.; Liang, W.; Chu, H. Soil pH drives the spatial distribution of bacterial communities along elevation on Changbai Mountain. Soil Biol. Biochem. 2013, 57, 204–211. [Google Scholar] [CrossRef]
  18. Tripathi, B.M.; Stegen, J.C.; Kim, M.; Dong, K.; Adams, J.M.; Lee, Y.K. Soil pH mediates the balance between stochastic and deterministic assembly of bacteria. ISME J. 2018, 12, 1072–1083. [Google Scholar] [CrossRef]
  19. Hubbell, S.P. The Unified Neutral Theory of Biodiversity and Biogeography (MPB–32); Princeton University Press: Princeton, NJ, USA, 2001. [Google Scholar]
  20. Vanschoenwinkel, B.; Buschke, F.; Brendonck, L. Disturbance regime alters the impact of dispersal on alpha and beta diversity in a natural metacommunity. Ecology 2013, 94, 2547–2557. [Google Scholar] [CrossRef]
  21. Wang, X.B.; Lü, X.T.; Yao, J.; Wang, Z.W.; Deng, Y.; Cheng, W.X.; Zhou, J.Z.; Han, X.G. Habitat–specific patterns and drivers of bacterial β–diversity in China’s drylands. ISME J. 2017, 11, 1345. [Google Scholar] [CrossRef]
  22. Chytrý, M.; Lososová, Z.; Horsák, M.; Uher, B.; Čejka, T.; Danihelka, J.; Fajmon, K.; Hájek, O.; Juřičková, L.; Kintrová, K. Dispersal limitation is stronger in communities of microorganisms than macroorganisms across Central European cities. J. Biogeogr. 2012, 39, 1101–1111. [Google Scholar] [CrossRef]
  23. Bell, G. Neutral macroecology. Science 2001, 293, 2413–2418. [Google Scholar] [CrossRef]
  24. Violle, C.; Nemergut, D.R.; Pu, Z.; Jiang, L. Phylogenetic limiting similarity and competitive exclusion. Ecol. Lett. 2011, 14, 782–787. [Google Scholar] [CrossRef] [PubMed]
  25. De Cáceres, M.; Legendre, P.; Valencia, R.; Cao, M.; Chang, L.W.; Chuyong, G.; Condit, R.; Hao, Z.; Hsieh, C.F.; Hubbell, S.; et al. The variation of tree beta diversity across a global network of forest plots. Glob. Ecol. Biogeogr. 2012, 21, 1191–1202. [Google Scholar] [CrossRef]
  26. Wang, J.; Shen, J.; Wu, Y.; Tu, C.; Soininen, J.; Stegen, J.C.; He, J.Z.; Liu, X.; Zhang, L.; Zhang, E. Phylogenetic beta diversity in bacterial assemblages across ecosystems: Deterministic versus stochastic processes. ISME J. 2013, 7, 1310–1321. [Google Scholar] [CrossRef] [PubMed]
  27. Wang, X.; Van Nostrand, J.D.; Deng, Y.; Lü, X.; Wang, C.; Zhou, J.; Han, X. Scale–dependent effects of climate and geographic distance on bacterial diversity patterns across northern China’s grasslands. FEMS Microbiol. Ecol. 2015, 91, fiv133. [Google Scholar] [CrossRef] [PubMed]
  28. Püttker, T.; de Arruda Bueno, A.; Prado, P.I.; Pardini, R. Ecological filtering or random extinction? Beta-diversity patterns and the importance of niche-based and neutral processes following habitat loss. Oikos 2015, 124, 206–215. [Google Scholar] [CrossRef]
  29. Delgado-Baquerizo, M.; Maestre, F.T.; Reich, P.B.; Trivedi, P.; Osanai, Y.; Liu, Y.R.; Hamonts, K.; Jeffries, T.C.; Singh, B.K. Carbon content and climate variability drive global soil bacterial diversity patterns. Ecol. Monogr. 2016, 86, 373–390. [Google Scholar] [CrossRef]
  30. Lozupone, C.A.; Knight, R. Global patterns in bacterial diversity. Proc. Natl. Acad. Sci. USA 2007, 104, 11436–11440. [Google Scholar] [CrossRef] [Green Version]
  31. Peay, K.G.; Garbelotto, M.; Bruns, T.D. Evidence of dispersal limitation in soil microorganisms: Isolation reduces species richness on mycorrhizal tree islands. Ecology 2010, 91, 3631–3640. [Google Scholar] [CrossRef]
  32. Shi, Y.; Li, Y.; Xiang, X.; Sun, R.; Yang, T.; He, D.; Zhang, K.; Ni, Y.; Zhu, Y.G.; Adams, J.M.; et al. Spatial scale affects the relative role of stochasticity versus determinism in soil bacterial communities in wheat fields across the North China Plain. Microbiome 2018, 6, 27. [Google Scholar] [CrossRef] [PubMed]
  33. Hu, Y.; Veresoglou, S.D.; Tedersoo, L.; Xu, T.; Ge, T.; Liu, L.; Chen, Y.; Hao, Z.; Su, Y.; Rillig, M.C.; et al. Contrasting latitudinal diversity and co-occurrence patterns of soil fungi and plants in forest ecosystems. Soil Biol. Biochem. 2019, 131, 100–110. [Google Scholar] [CrossRef]
  34. Zeilinger, S.; Gupta, V.K.; Dahms, T.E.S.; Silva, R.N.; Singh, H.B.; Upadhyay, R.S.; Gomes, E.V.; Tsui, C.K.M.; Nayak, S.C. Friends or foes? Emerging insights from fungal interactions with plants. FEMS Microbiol. Rev. 2015, 40, 182–207. [Google Scholar] [CrossRef] [PubMed] [Green Version]
  35. Zhang, X. Vegetation and Geographical Patterns in China; Geological Publishing House: Beijing, China, 2007; pp. 1–40. [Google Scholar]
  36. Hijmans, R.J.; Cameron, S.E.; Parra, J.L.; Jones, P.G.; Jarvis, A. Very high resolution interpolated climate surfaces for global land areas. Int. J. Climatol. 2005, 25, 1965–1978. [Google Scholar] [CrossRef]
  37. Huang, Y.; Zhang, X.; Zang, R.; Fu, S.; Ai, X.; Yao, L.; Ding, Y.; Huang, J.; Lu, X. Functional recovery of a subtropical evergreen-deciduous broadleaved mixed forest following clear cutting in central China. Sci. Rep. 2018, 8, 16458. [Google Scholar] [CrossRef]
  38. Zhang, X.; Liu, S.; Huang, Y.; Fu, S.; Wang, J.; Ming, A.; Li, X.; Yao, M.; Li, H. Tree species mixture inhibits soil organic carbon mineralization accompanied by decreased r-selected bacteria. Plant Soil 2018, 431, 203–216. [Google Scholar] [CrossRef]
  39. Zhang, B.; Zhang, Y.; Li, X.; Zhang, Y. Successional changes of fungal communities along the biocrust development stages. Biol. Fertil. Soils 2018, 54, 285–294. [Google Scholar] [CrossRef]
  40. Edgar, R.C. UPARSE: Highly accurate OTU sequences from microbial amplicon reads. Nat. Methods 2013, 10, 996–998. [Google Scholar] [CrossRef]
  41. Caporaso, J.G.; Kuczynski, J.; Stombaugh, J.; Bittinger, K.; Bushman, F.D.; Costello, E.K.; Fierer, N.; Peña, A.G.; Goodrich, J.K.; Gordon, J.I.; et al. QIIME allows analysis of high-throughput community sequencing data. Nat. Methods 2010, 7, 335–336. [Google Scholar] [CrossRef] [Green Version]
  42. Bray, J.R.; Curtis, J.T. An Ordination of the Upland Forest Communities of Southern Wisconsin. Ecol. Monogr. 1957, 27, 325–349. [Google Scholar] [CrossRef]
  43. Curd, E.E.; Martiny, J.B.H.; Li, H.; Smith, T.B. Bacterial diversity is positively correlated with soil heterogeneity. Ecosphere 2018, 9, e02079. [Google Scholar] [CrossRef]
  44. Borcard, D.; Legendre, P.; Avois-Jacquet, C.; Tuomisto, H. Dissecting the spatial structure of ecological data at multiple scales. Ecology 2004, 85, 1826–1832. [Google Scholar] [CrossRef]
  45. Griffith, D.A.; Peres-Neto, P.R. Spatial modeling in ecology: The flexibility of eigenfunction spatial analyses. Ecology 2006, 87, 2603–2613. [Google Scholar] [CrossRef]
  46. Blanchet, F.G.; Legendre, P.; Borcard, D. Forward selection of explanatory variables. Ecology 2008, 89, 2623–2632. [Google Scholar] [CrossRef] [PubMed]
  47. Peres-Neto, P.R.; Legendre, P.; Dray, S.; Borcard, D. Variation partitioning of species data matrices: Estimation and comparison of fractions. Ecology 2006, 87, 2614–2625. [Google Scholar] [CrossRef]
  48. Lichstein, J.W. Multiple regression on distance matrices: A multivariate spatial analysis tool. Plant Ecol. 2007, 188, 117–131. [Google Scholar] [CrossRef]
  49. Friedman, J.; Alm, E.J. Inferring Correlation Networks from Genomic Survey Data. PLoS Comput. Biol. 2012, 8, e1002687. [Google Scholar] [CrossRef]
  50. Bastian, M.; Heymann, S.; Jacomy, M. Gephi: An Open Source Software for Exploring and Manipulating Networks. In Proceedings of the Third international AAAI Conference on Weblogs and Social Media, San Jose, CA, USA, 17–20 May 2009. [Google Scholar]
  51. Dini-Andreote, F.; Silva, M.D.; Triadó-Margarit, X.; Casamayor, E.O.; Van elsas, J.D.; Salles, J.F. Dynamics of bacterial community succession in a salt marsh chronosequence: Evidences for temporal niche partitioning. ISME J. 2014, 8, 1989–2001. [Google Scholar] [CrossRef]
  52. Veresoglou, S.D.; Liu, L.; Xu, T.; Rillig, M.C.; Wang, M.; Wang, J.; Chen, Y.; Hu, Y.; Hao, Z.; Chen, B. Biogeographical constraints in Glomeromycotinan distribution across forest habitats in China. J. Ecol. 2019, 107, 684–695. [Google Scholar] [CrossRef]
  53. Martiny, J.B.H.; Bohannan, B.J.; Brown, J.H.; Colwell, R.K.; Fuhrman, J.A.; Green, J.L.; Horner–Devine, M.C.; Kane, M.; Krumins, J.A.; Kuske, C.R. Microbial biogeography: Putting microorganisms on the map. Nat. Rev. Microbiol. 2006, 4, 102. [Google Scholar] [CrossRef]
  54. Chesson, P. Mechanisms of maintenance of species diversity. Annu. Rev. Ecol. Syst. 2000, 31, 343–366. [Google Scholar] [CrossRef]
  55. Xue, Y.; Chen, H.; Liu, M.; Huang, B.; Yang, J.R.; Yang, J. Distinct patterns and processes of abundant and rare eukaryotic plankton communities following a reservoir cyanobacterial bloom. ISME J. 2018, 12, 2263–2277. [Google Scholar] [CrossRef] [PubMed] [Green Version]
  56. Beck, S.; Powell, J.R.; Drigo, B.; Cairney, J.W.; Anderson, I.C. The role of stochasticity differs in the assembly of soil- and root-associated fungal communities. Soil Biol. Biochem. 2015, 80, 18–25. [Google Scholar] [CrossRef]
  57. Graham, C.H.; Fine, P.V.A. Phylogenetic beta diversity: Linking ecological and evolutionary processes across space in time. Ecol. Lett. 2008, 11, 1265–1277. [Google Scholar] [CrossRef]
  58. Caruso, T.; Chan, Y.; Lacap, D.C.; Lau, M.C.Y.; McKay, C.P.; Pointing, S.B. Stochastic and deterministic processes interact in the assembly of desert microbial communities on a global scale. ISME J. 2011, 5, 1406–1413. [Google Scholar] [CrossRef] [PubMed]
  59. Kraus, T.E.C.; Dahlgren, R.A.; Zasoski, R.J. Tannins in nutrient dynamics of forest ecosystems—A review. Plant Soil 2003, 256, 41–66. [Google Scholar] [CrossRef]
  60. Courty, P.E.; Franc, A.; Garbaye, J. Temporal and functional pattern of secreted enzyme activities in an ectomycorrhizal community. Soil Biol. Biochem. 2010, 42, 2022–2025. [Google Scholar] [CrossRef]
  61. Courty, P.E.; Pritsch, K.; Schloter, M.; Hartmann, A.; Garbaye, J. Activity profiling of ectomycorrhiza communities in two forest soils using multiple enzymatic tests. New Phytol. 2005, 167, 309–319. [Google Scholar] [CrossRef]
  62. Grosso, F.; Bååth, E.; De Nicola, F. Bacterial and fungal growth on different plant litter in Mediterranean soils: Effects of C/N ratio and soil pH. Appl. Soil Ecol. 2016, 108, 1–7. [Google Scholar] [CrossRef]
  63. Nicolas, P.B.; Richard, C.; Samuel, D.; Christophe, M.; Mélanie, L.; Claudy, J.; Hamid Reza, S.; Laure, G.; Dominique, A.; Lionel, R. Validation and application of a PCR primer set to quantify fungal communities in the soil environment by real–time quantitative PCR. PLoS ONE 2011, 6, e24166. [Google Scholar]
  64. Johannes, R.; Brookes, P.C.; Erland, B.T. Fungal and bacterial growth responses to N fertilization and pH in the 150-year ‘Park Grass’ UK grassland experiment. FEMS Microbiol. Ecol. 2015, 76, 89–99. [Google Scholar]
  65. Ni, Y.; Yang, T.; Zhang, K.; Shen, C.; Chu, H. Fungal Communities Along a Small-Scale Elevational Gradient in an Alpine Tundra Are Determined by Soil Carbon Nitrogen Ratios. Front. Microbiol. 2018, 9, 1815. [Google Scholar] [CrossRef] [PubMed]
  66. Barberán, A.; McGuire, K.L.; Wolf, J.A.; Jones, F.A.; Wright, S.J.; Turner, B.L.; Essene, A.; Hubbell, S.P.; Faircloth, B.C.; Fierer, N. Relating belowground microbial composition to the taxonomic, phylogenetic, and functional trait distributions of trees in a tropical forest. Ecol. Lett. 2015, 18, 1397–1405. [Google Scholar] [CrossRef] [PubMed]
  67. Rousk, J.; Brookes, P.C.; Bååth, E. Investigating the mechanisms for the opposing pH relationships of fungal and bacterial growth in soil. Soil Biol. Biochem. 2010, 42, 926–934. [Google Scholar] [CrossRef]
  68. Tedersoo, L.; Bahram, M.; Põlme, S.; Kõljalg, U.; Yorou, N.S.; Wijesundera, R.; Ruiz, L.V.; Vasco-Palacios, A.M.; Thu, P.Q.; Suija, A.; et al. Global diversity and geography of soil fungi. Science 2014, 346, 1256688. [Google Scholar] [CrossRef] [PubMed] [Green Version]
  69. Leprince, F.; Quiquampoix, H. Extracellular enzyme activity in soil: Effect of pH and ionic strength on the interaction with montmorillonite of two acid phosphatases secreted by the ectomycorrhizal fungus Hebeloma cylindrosporum. Eur. J. Soil Sci. 1996, 47, 511–522. [Google Scholar] [CrossRef]
  70. Yamanaka, T. The Effect of pH on the Growth of Saprotrophic and Ectomycorrhizal Ammonia Fungi in vitro. Mycologia 2003, 95, 584–589. [Google Scholar] [CrossRef] [PubMed]
  71. Rousk, J.; Bååth, E.; Brookes, P.C.; Lauber, C.L.; Lozupone, C.; Caporaso, J.G.; Knight, R.; Fierer, N. Soil bacterial and fungal communities across a pH gradient in an arable soil. ISME J. 2010, 4, 1340–1351. [Google Scholar] [CrossRef] [PubMed]
  72. Shi, L.L.; Mortimer, P.E.; Slik, J.F.; Zou, X.M.; Xu, J.; Feng, W.T.; Qiao, L. Variation in forest soil fungal diversity along a latitudinal gradient. Fungal Divers. 2014, 64, 305–315. [Google Scholar] [CrossRef]
  73. Auguet, J.C.; Barberan, A.; Casamayor, E.O. Global ecological patterns in uncultured Archaea. ISME J. 2010, 4, 182. [Google Scholar] [CrossRef]
  74. Lienhard, P.; Tivet, F.; Chabanne, A.; Dequiedt, S.; Lelièvre, M.; Sayphoummie, S.; Leudphanane, B.; Prévost-Bouré, N.C.; Séguy, L.; Maron, P.A. No-till and cover crops shift soil microbial abundance and diversity in Laos tropical grasslands. Agron. Sustain. Dev. 2013, 33, 375–384. [Google Scholar] [CrossRef]
  75. Talbot, J.M.; Bruns, T.D.; Taylor, J.W.; Smith, D.P.; Branco, S.; Glassman, S.I.; Erlandson, S.; Vilgalys, R.; Liao, H.L.; Smith, M.E.; et al. Endemism and functional convergence across the North American soil mycobiome. Proc. Natl. Acad. Sci. USA 2014, 111, 6341–6346. [Google Scholar] [CrossRef] [PubMed] [Green Version]
  76. Green, J.L.; Holmes, A.J.; Westoby, M.; Oliver, I.; Briscoe, D.; Dangerfield, M.; Gillings, M.; Beattie, A.J. Spatial scaling of microbial eukaryote diversity. Nature 2004, 432, 747–750. [Google Scholar] [CrossRef] [PubMed]
  77. Soininen, J.; Mcdonald, R.; Hillebrand, H. The distance decay of similarity in ecological communities. Ecography 2010, 30, 3–12. [Google Scholar] [CrossRef]
  78. Hanna, T.; Kalle, R.; Markku, Y.H. Dispersal, environment, and floristic variation of western Amazonian forests. Science 2003, 299, 241–244. [Google Scholar]
  79. Crist, T.O. The spatial distribution of termites in shortgrass steppe: A geostatistical approach. Oecologia 1998, 114, 410–416. [Google Scholar] [CrossRef] [PubMed]
  80. Finlay, B.J. Global Dispersal of Free-Living Microbial Eukaryote Species. Science 2002, 296, 1061–1063. [Google Scholar] [CrossRef] [Green Version]
  81. Lekberg, Y.; Koide, R.T.; Rohr, J.R.; Morton, J.B.; Aldrich-Wolfe, L. Role of niche restrictions and dispersal in the composition of arbuscular mycorrhizal fungal communities. J. Ecol. 2007, 95, 95–105. [Google Scholar] [CrossRef]
  82. De Menezes, A.B.; Prendergast-Miller, M.T.; Richardson, A.E.; Toscas, P.; Farrell, M.; Macdonald, L.M.; Baker, G.; Wark, T.; Thrall, P.H. Network analysis reveals that bacteria and fungi form modules that correlate independently with soil parameters. Environ. Microbiol. 2015, 17, 2677–2689. [Google Scholar] [CrossRef]
  83. Faust, K.; Raes, J. Microbial interactions: From networks to models. Nat. Rev. Genet. 2012, 10, 538–550. [Google Scholar] [CrossRef]
  84. Ma, B.; Wang, H.; Dsouza, M.; Lou, J.; He, Y.; Dai, Z.; Brookes, P.C.; Xu, J.; Gilbert, J.A. Geographic patterns of co-occurrence network topological features for soil microbiota at continental scale in eastern China. ISME J. 2016, 10, 1891–1901. [Google Scholar] [CrossRef] [PubMed]
  85. Legendre, P.; Mi, X.; Ren, H.; Ma, K.; Yu, M.; Sun, I.F.; He, F. Partitioning beta diversity in a subtropical broad-leaved forest of China. Ecology 2009, 90, 663–674. [Google Scholar] [CrossRef] [PubMed]
  86. Davison, J.; Öpik, M.; Daniell, T.J.; Moora, M.; Zobel, M. Arbuscular mycorrhizal fungal communities in plant roots are not random assemblages. FEMS Microbiol. Ecol. 2011, 78, 103–115. [Google Scholar] [CrossRef] [PubMed] [Green Version]
Figure 1. Locations of the sampling sites in six forest types of eastern China. TRF, tropical rain forest; SEB, subtropical evergreen broad-leaved forest; WDB, warm-temperate deciduous broad-leaved forest; TDB, temperate needle-leaf and deciduous broad-leaved mixed forest; CDN, cold-temperate deciduous needle-leaf forest; TS, temperate steppe; TD, temperate desert; PV, Qinghai–Tibet Plateau alpine vegetation; JF, Jianfeng Mountain; DH, Dinghu Mountain; BT, Baotian Mountain (forest type: subtropical evergreen-deciduous broad-leaved mixed forest (SED)); DL, Dongling Mountain; CB, Changbai Mountain; MH, Mohe.
Forests 10 00863 g001
Figure 2. Soil fungal beta-diversity (β-diversity) in six forest types along a latitudinal gradient. TRF, tropical rain forest; SEB, subtropical evergreen broad-leaved forest; SED, subtropical evergreen-deciduous broad-leaved mixed forest; WDB, warm-temperate deciduous broad-leaved forest; TDB, temperate needle-leaf and deciduous broad-leaved mixed forest; CDN, cold-temperate deciduous needle-leaf forest. The same for below.
Forests 10 00863 g002
Figure 3. Principle coordinates analysis (PCoA) illustrating patterns of soil fungal communities grouped by different forest types.
Forests 10 00863 g003
Figure 4. Variation in soil fungal β-deviation in six forest types along a latitudinal gradient.
Forests 10 00863 g004
Figure 5. Soil fungal β-deviation explained by environmental and spatial variables in six forest types along a latitudinal gradient. (a) Total variation in β-deviation based on distance-based redundancy analysis. (b) Variation in β-deviations explained by environmental and spatial variables after forward model selection.
Forests 10 00863 g005
Figure 6. Coefficient of variation (CV) for soil variables in six forest types along a latitudinal gradient. The higher variation means higher soil heterogeneity. The other CVs for climatic and topographic variables have no significant relationship to soil fungal β-diversity and are not shown in the figure.
Forests 10 00863 g006
Figure 7. Network co-occurrence analysis of soil fungal communities in six forest types along a latitudinal gradient. Nodes are labeled at the phylum level. The correlations between operational taxonomic units (OTUs) are represented by edges that connect these nodes.
Forests 10 00863 g007
Table 1. Site information for the six forest types in eastern China.
SiteForest TypeDominant Tree SpeciesLocation
JFTropical rain forestGironniera subaequalis Planch.18°44′22″ N
108°51′59″ E
Cryptocarya chinensis Hemsl.(Lauraceae)
DHSubtropical evergreen
broad-leaved forest
Schima superba (Theaceae)
Castanea henryi (Skan) Rehd. et Wils
23°10′03″ N
112°10′01″ E
BTSubtropical evergreen-deciduous
broad-leaved mixed forest
Quercus aliena .var. acuteserrata Maxim. ex Wenz.
Quercus variabilis Blume
33°29′32″ N
111°55′32″ E
DLWarm-temperate deciduous
broad-leaved forest
Quercus wutaishanica Mayr39°57′27″ N
115°25′29″ E
CBTemperate needle-leaf and deciduous
broad-leaved mixed forest
Pinus koraiensis Sieb. et Zucc.42°20′51″ N
128°8′55″ E
Betula platyphylla Suk
MHCold-temperate deciduous
needle-leaf forest
Larix gmelinii (Ruprecht) Kuzeneva53°27′46″ N
122°20′20″ E
Betula platyphylla Suk
JF, Jianfeng Mountain; DH, Dinghu Mountain; BT, Baotian Mountain; DL, Dongling Mountain; CB, Changbai Mountain; MH, Mohe.
Table 2. Correlations of soil fungal β-diversity with environmental distance (averaged at the plot level) from Mantel tests in six forest types.
Environmental VariableTRFSEBSEDWDBTDBCDN
ρpρpρpρpρpρp
MAP0.05n.s.0.04n.s.0.07n.s.0.06n.s.0.02n.s.0.06n.s.
MAT0.03n.s.0.07n.s.0.08n.s.0.04n.s.0.01n.s.0.04n.s.
Elevation0.09n.s.0.02n.s.0.05n.s.0.04n.s.0.06n.s.0.02n.s.
Slope0.1n.s.0.03n.s.0.02n.s.0.05n.s.0.04n.s.0.01n.s.
Soil pH0.220.020.08n.s.0.04n.s.0.1n.s.0.160.040.03n.s.
SWC0.09n.s.0.07n.s.0.12n.s.0.04n.s.0.06n.s.0.08n.s.
SOC0.280.0010.230.020.08n.s.0.01n.s.0.02n.s.0.220.02
STN0.250.010.08n.s.0.240.010.1n.s.0.150.040.09n.s.
SAN0.05n.s.0.250.010.230.010.210.020.04n.s.0.05n.s.
Soil C/N0.09n.s.0.140.040.20.020.09n.s.0.01n.s.0.190.02
MAP, mean annual precipitation; MAT, mean annual temperature; SWC, soil water content; SOC, soil organic carbon; STN, soil total nitrogen; SAN, soil available nitrogen; soil C/N, soil C/N ratio; ρ, rho correlation; n.s., not significant.

