Article

Site-Specific Allometric Models for Prediction of Above-and Belowground Biomass of Subtropical Forests in Guangzhou, Southern China

1
Research Institute of Tropical Forestry, Chinese Academy of Forestry, Guangzhou 510520, China
2
Beijiangyuan National Forest Ecosystem Research Station, Nanling Mts. China, Guangzhou 510520, China
*
Author to whom correspondence should be addressed.
Forests 2019, 10(10), 862; https://doi.org/10.3390/f10100862
Submission received: 10 August 2019 / Revised: 26 September 2019 / Accepted: 26 September 2019 / Published: 2 October 2019
(This article belongs to the Section Forest Inventory, Modeling and Remote Sensing)

Abstract

:
Tree allometric models that are used to predict the biomass of individual tree are critical to forest carbon accounting and ecosystem service modeling. To enhance the accuracy of such predictions, the development of site-specific, rather than generalized, allometric models is advised whenever possible. Subtropical forests are important carbon sinks and have a huge potential for mitigating climate change. However, few biomass models compared to the diversity of forest ecosystems are currently available for the subtropical forests of China. This study developed site-specific allometric models to estimate the aboveground and the belowground biomass for south subtropical humid forest in Guangzhou, Southern China. Destructive methods were used to measure the aboveground biomass with a sample of 144 trees from 26 species, and the belowground biomass was measured with a subsample of 116 of them. Linear regression with logarithmic transformation was used to model biomass according to dendrometric parameters. The mixed-species regressions with diameter at breast height (DBH) as a single predictor were able to adequately estimate aboveground, belowground and total biomass. The coefficients of determination (R2) were 0.955, 0.914 and 0.954, respectively, and the mean prediction errors were −1.96, −5.84 and 2.26%, respectively. Adding tree height (H) compounded with DBH as one variable (DBH2H) did not improve model performance. Using H as a second variable in the equation can improve the model fitness in estimation of belowground biomass, but there are collinearity effects, resulting in an increased standard error of regression coefficients. Therefore, it is not recommended to add H in the allometric models. Adding wood density (WD) compounded with DBH as one variable (DBH2WD) slightly improved model fitness for prediction of belowground biomass, but there was no positive effect on the prediction of aboveground and total biomass. Using WD as a second variable in the equation, the best-fitting allometric relationship for biomass estimation of the aboveground, belowground, and total biomass was given, indicating that WD is a crucial factor in biomass models of subtropical forest. Root-shoot ratio of subtropical forest in this study varies with species and tree size, and it is not suitable to apply it to estimate belowground biomass. These findings are of great significance for accurately measuring regional forest carbon sinks, and having reference value for forest management.

1. Introduction

The carbon cycle of the earth has been massively altered by anthropogenic activities [1]. Forests represent a major reservoir of global carbon, and the carbon sequestration function is important for mitigation of climate change. Thus, quantification of amounts of carbon stored at scales ranging from local to global levels is crucial for accurately predicting future changes in atmospheric carbon dioxide and climate, and to help define management options for the global carbon cycle [2]. An accurate estimation of the magnitude of carbon stocks in various vegetation types is therefore essential for understanding global and regional carbon budgets [1], and is the basis for reporting changes in carbon stock as required in the emerging Reducing Emissions from Deforestation and Forest Degradation in developing countries (REDD+) mechanism.
Forest biomass and carbon stock can be estimated by using direct or indirect methods [3]. Direct methods are the most accurate, but require destructive sampling, making this method costly and time consuming, and unsuitable for large forest areas. Remote sensing techniques are ideal indirect methods for quantifying the forest biomass over vast areas, but are limited by technology, cloud cover and fly-over frequency [4]. An indirect approach using allometric models is the most appropriate option in biomass estimation. The allometric technique initially requires an extensive destructive sampling to establish allometric models, and the models can be used as a non-destructive method to estimate the whole or partial weight of a tree from measurable tree dimensions (e.g., stem diameter and height) [5,6]. The allometric method is so far the most widely used method today, where individual tree data are available from a forest inventory, and it is also considered the most accurate method [7,8].
Allometric models are based on correlations between biomass and morphological characteristics, such as stem diameter and plant height [9]. The choice of an appropriate allometric model is often the most critical step towards minimizing the errors and increasing the accuracy in the estimation of forest biomass [10]. There exists a very large literature on the development and use of allometric models for estimating forest biomass [11], and many researchers have tried to develop generalized allometric models for different forests and tree species [12]. However, the biomass might differ due to variations in topography, environmental conditions, stand age, species composition, and natural and anthropogenic disturbances, therefore, the use of generalized equations can lead to a bias in estimating biomass for a particular species [13]. To reduce this uncertainty in the estimation of biomass, it is generally best to use species- and site-specific allometric models [6,14]. However, in practical operation, species-specific allometric models may be suitable for temperate and cold regions, where relatively few tree species are found, but not suitable for tropical and subtropical forest, where hundreds of species can coexist in a given area [15,16].
The East Asian monsoon region includes the eastern part of China and the southern parts of Japan and Korea [17], and is characterized by wet, warm summers and dry, mild winters. Forest in this region is typically composed of subtropical evergreen broad-leaved species with high biodiversity, and the dominant species are Fagaceae, Lauraceae and Theaceae on canopy [18]. This forest type has considerable net ecosystem productivity (NEP), and is higher than that of Asian tropical and temperate forests, and is also higher than that of forests in Europe–Africa and North America at the same latitude [2]. The total NEP of East Asian monsoon subtropical forests accounts for 8% of the global forest NEP, and its role in the current global carbon cycle cannot be ignored [2]. In China, this forest type covers approximately a quarter of the area and plays a critical role in regional carbon storage and cycling [19,20]. This forest is unique in terms of its climate characteristics, forest structure and species composition; therefore, predictions of biomass based on data from temperate and tropical forests in the world may not provide a reliable estimate of this region [21]. A limited number of allometric equations are available for subtropical tree species, and the applicability of these equations has not been tested [22,23]. Therefore, biomass and carbon budgets of subtropical forests remain uncertain.
In general, most allometric equations have been developed specifically for aboveground biomass [24,25,26], while the below-ground root biomass has rarely been studied [27,28]. As a nonnegligible part of forest biomass, tree roots account for approximately 30% of the total tree biomass, and may yet reveal both an additional and a greater role in carbon storage capacity [15,29]. It is difficult to quantify root biomass in the field because of the large size of the portion hidden in soil and the estimates needed to harvest the whole root system. Unlike the aboveground component, studies of belowground biomass estimates are seldom documented, and models of belowground biomass are lacking. Of the 373 forest biomass models in Sub-Saharan Africa reviewed by Henry et al. (2011) [7], only 16 were developed for belowground biomass. Due to the lack of allometric data pertaining to the belowground root biomass, many investigators have to use root-shoot ratios to estimate root biomass [30]. These ratios vary among forest types, which may lead to extremely biased estimates of total biomass [23]. Estimating root biomass using allometric equations could provide a better understanding of biomass and carbon allocation and ultimately help to accurately assess forest carbon sequestration potential [23]. To date, only a few studies have developed belowground allometric equations for subtropical tree species in China [27,28].
Diameter at breast height (DBH) is generally the most common independent variable found in the available allometric models, and using DBH as a single variable in biomass equation can provide high accuracy in estimating tree biomass. Tree height (H) is often added to the biomass equation to improve the model accuracy, which can be used as the second variable in the equation [9,31] or combined with DBH, in the form of DBH2H, as one variable [28]. However, there is considerable divergence in previous research on the effect of adding H and its form of addition in allometric models for the prediction of tree biomass [27,32]. Wood density (WD) is a basic characteristic of trees and has been considered as important variable in allometric models for biomass estimation [24], but its performance in biomass prediction of subtropical evergreen broadleaved forest needs more examination.
The objectives of the present study were to (1) develop site-specific allometric models to estimate above and belowground biomass of subtropical forest in Guanzhou; (2) reveal the variation of root-shoot ratio between species and with tree size class, and assess the suitability of using root-shoot ratio to predict belowground biomass; (3) examine the fitness of models adding H and WD as a second variable following with DBH or combined with DBH as one variable.

2. Materials and Methods

2.1. The Experimental Site

The study site was located at a latitude of 23°16′35.67″–23°17′12.85″ N and a longitude of 113°30′ 15.65″~113°30′52.65″ E, close to the village of Fushan, approximately 26 km to the northeast of Guangzhou City, southern China (Figure 1). The climate is classified as humid a subtropical climate (Cfa in Köppen climate classification system), with an average annual temperature of 21.4~21.9 °C. The average annual rainfall ranges from 1612 to1909 mm, and the rainy season (April to September) contributes about 80% of the annual rainfall, while the dry season contributes about 20%. The soils are classified as red soils (Humic Planosol, FAO) that developed from granite. The elevations of sample site are between 128 m and 153 m above sea level. The region was covered with subtropical evergreen broadleaf forests that were naturally regenerated from a forest selective logging about 40 years ago. The experimental area was about 0.4 km2 and had been approved to change land use from forest to industry by government in 2015, so the destructive sampling was allowed.

2.2. Sample Tree Selection

Systematic sample plot inventories based on a kilometer grid for the purpose of carbon sink estimation were carried out in 2015 in Guangzhou city. There were 312 standard plant plots with a format of 30 × 40 m in total, and we selected 23 plots in a radius of 30 km from the study site and used the inventory data to select the most common tree species and diameter classes for destructive measurements. Finally, a total of 144 sampled trees, including the four most dominant species—Castanopsis fissa (30 trees), Aleurites montana (18 trees), Castanopsis chinensis (17 trees), Machilus chinensis (14 trees)—as well as the other most common companion species (65 trees, 22 species), were selected. The diameter distributions of sampled trees are listed in Table 1. Prior to the destructive procedure, all sample trees were recorded by species. DBH was measured with diameter tape, and H was measured with graduated pole. Belowground biomass was measured on a subsample of the sampled trees, and the representative species and DBH distributions were again selected, for a total of 116 trees, including 24 species and 7 diameter classes.

2.3. Tree Biomass Measurement

Tree biomass measurement was taken from September to October in 2015. Firstly, the sample trees were divided into two main parts: the part above a stump height of 10 cm is the aboveground part, and the root system and stump part comprise the belowground part. After cutting the sample trees on the ground using a chainsaw, the branches and leaves were separated from the main stem, and then the main stem was divided into three sections, large branches (diameter at the small end ≥2 cm), small branches (diameter at the large end <2 cm), and leaves. The stems were cut at 1.3 m and at 2 m intervals thereafter up to the apex of the crown. The branches were trimmed and cross-cut into manageable billets ranging from 1 m to 2.5 m in length. All these tree components were directly weighed in the field to determine their fresh weight using an electronic hanging balance with an accuracy of 0.01 kg. Three disks with a thickness of 5 cm were collected from stem at the height of 1.3 m, 3.3 m and 5.3 m as the subsamples of stem. Three cylinders with a length of 5–10 cm and diameter of 5 cm, 2 cm and 1 cm, respectively, were collected from branches as the subsamples of branch. Subsamples of leaves with a weight of about 300 g were collected from different parts of branch. The subsamples were given identification codes and measured for their fresh weight with an electronic balance with an accuracy of 0.1 g. All samples were placed in cloth bags and then taken to the laboratory. All samples were oven-dried at 65 °C until constant weight, and their dry weight was measured. The dry and fresh weights were used for the determination of moisture content of each tree section. The fresh mass of all aboveground components was converted to a dry mass by way of its respective moisture content. Aboveground biomass was the sum of the stem, branch and leaf components. For wood density determination, the fresh volume of the stem was measured by the water displacement method. The stem disks were saturated in a container of water for 30 min and then immersed in glassware with volumetric scales and partially filled with water. The volume of stem disk could be directly read from the displacement of water. The wood density of the stem was computed by the ratio of the dry weight to its fresh volume.
Excavation was used to determine the biomass of belowground part. All of the trees at the study site were cleared, making it relatively easy to excavate entire roots. We first used a backhoe to dig a 1.5–3.0 m cylindrical trench extending from the tree stump and dig it to a depth of 1.5–2.5 m according to the stump size. Then the soil in the hole was excavated and sifted through a wire sieve (20 mm mesh) to separate the roots. Finally, stumps and the attached taproots were pulled out. Using this approach, most of the root systems were extracted intact, but not all of the fine roots. All harvested roots were shaken, brushed and washed to remove the attached soil and were divided into four classes: root crown, big roots (2.0–5.0 cm), middle roots (0.5–2.0 cm), and small roots (<0.5 cm). The total fresh weight of each category was measured, and the subsamples were brought to the laboratory to determine the moisture content for the calculation of dry mass. Total root biomass was the sum of the dry masses of all root categories.

2.4. Allometric Model Development and Evaluation

The form of a power function or its logarithmic form is commonly used for allometric equations in biomass studies [26,28]. DBH is the most frequently used variable for predicting biomass. Other variables, such as H, WD, and crown area, have also often been used as additional variables, or have been combined with DBH as a single variable in allometric models in previous studies [27,31].
In this study, we developed 5 allometric equations to estimate tree aboveground and belowground biomass to test the performance of models with H and WD as additional variables. Model 1 used DBH alone as the predictor variable, Model 2 and Model 3 used DBH and H in combination or separately as the predictor variables, and Model 4 and Model 5 used DBH and WD in combination or separately as the predictor variables.
ln(B) = a + bln(DBH2)
ln(B) = a + bln(DBH2 × H)
ln(B) = a + bln(DBH2) + cln(H)
ln(B) = a + bln(DBH2 × WD)
ln(B) = a + bln(DBH2) + cln(WD)
where B represents the biomass of the tree, a, b and c are the estimated parameters of the fitted models, DBH is the diameter at breast height (cm), H is the tree height (m), and WD is the wood density (g·cm−3) of a given tree. The data were analyzed using R version 3.3.0, package ‘nlme’ (Linear and Nonlinear Mixed Effects Models).
For multivariate predictive models, in order to avoid the effect of multi-collinearity, analysis of the variance inflation factor (VIF) was added to assess the collinearity of two variables (ln(DBH2) and ln(H), ln(DBH2) and ln(WD)) in predicting biomass, following the methods of Zuur (2010) [33].
The criteria for evaluating the performance and fitness of the 5 models were the coefficient of determination (R2), root mean square error (RMSE), coefficient of variation (CV), and systematic errors (Bias) [24,34].
R 2 = 1 i = 1 n ( Y i Y ^ i ) 2 / i = 1 n ( Y i Y ¯ ) 2
R M S E = 1 n × i = 1 n ( Y i Y ^ i ) 2
C V = 1 n p × i = 1 n ( Y i Y ^ i ) 2 / Y ¯
B i a s = 1 n i = 1 n Y i Y ^ i Y i
where n is the number of sampled trees, Yi is the observed biomass, Y ^ i is the predicted biomass and Y ¯ is the mean observed biomass of trees, p is the number of parameters.

3. Results

3.1. Biomass Allocation Patterns and Correlations with DBH

The biomass allocation was different in different tree compartments between species and varied with the size of tree (DBH) (Figure 2). Castanopsis fissa had the largest fraction of biomass in leaves (7.3%), significantly higher than Machilus chinensis (5.3%) and companion trees (6.0%). The fraction of biomass stored in leaves of total biomass had a significant positive correlation with DBH of Castanopsis chinensis, while there was an extremely significant negative correlation of Aleurites montana and Machilus chinensis, but when using all species data for statistics, the relation was negligible (Table 2). There was no significant difference in the proportion of branches between species except Machilus chinensis, and the proportion of branches was lower than in other species. For all species, the branch fraction of total biomass had significantly positive correlations with DBH. The stem consistently accounted for the largest part of the total tree biomass, and its proportion in the total biomass was negatively correlated with DBH in all species. The root proportion of total biomass of different species was different, among which the root proportion of Machilus chinensis was the largest (22.2%), and the root proportion of Castanopsis fissa was the smallest (14.3%). In all species except Machilus chinensis, the root proportion decreased with the increase of DBH, and the correlation between companion trees and all species was significant.

3.2. Wood Density and Correlation with DBH

The wood density ranged from 0.403 to 0.531 g·cm−3 depending on the species. There was no significant difference in stem wood density between species except Aleurites montana, and the wood density was significantly lower than that of other species (p < 0.05) (Figure 3). The wood density of Castanopsis fissa and Aleurites montana was higher, but Castanopsis chinensis was lower than the wood density reported in the Global Wood Density Database [35]. Of all species, only the wood density of Castanopsis fissa had a positive correlation with DBH (r = 0.486, p < 0.01).

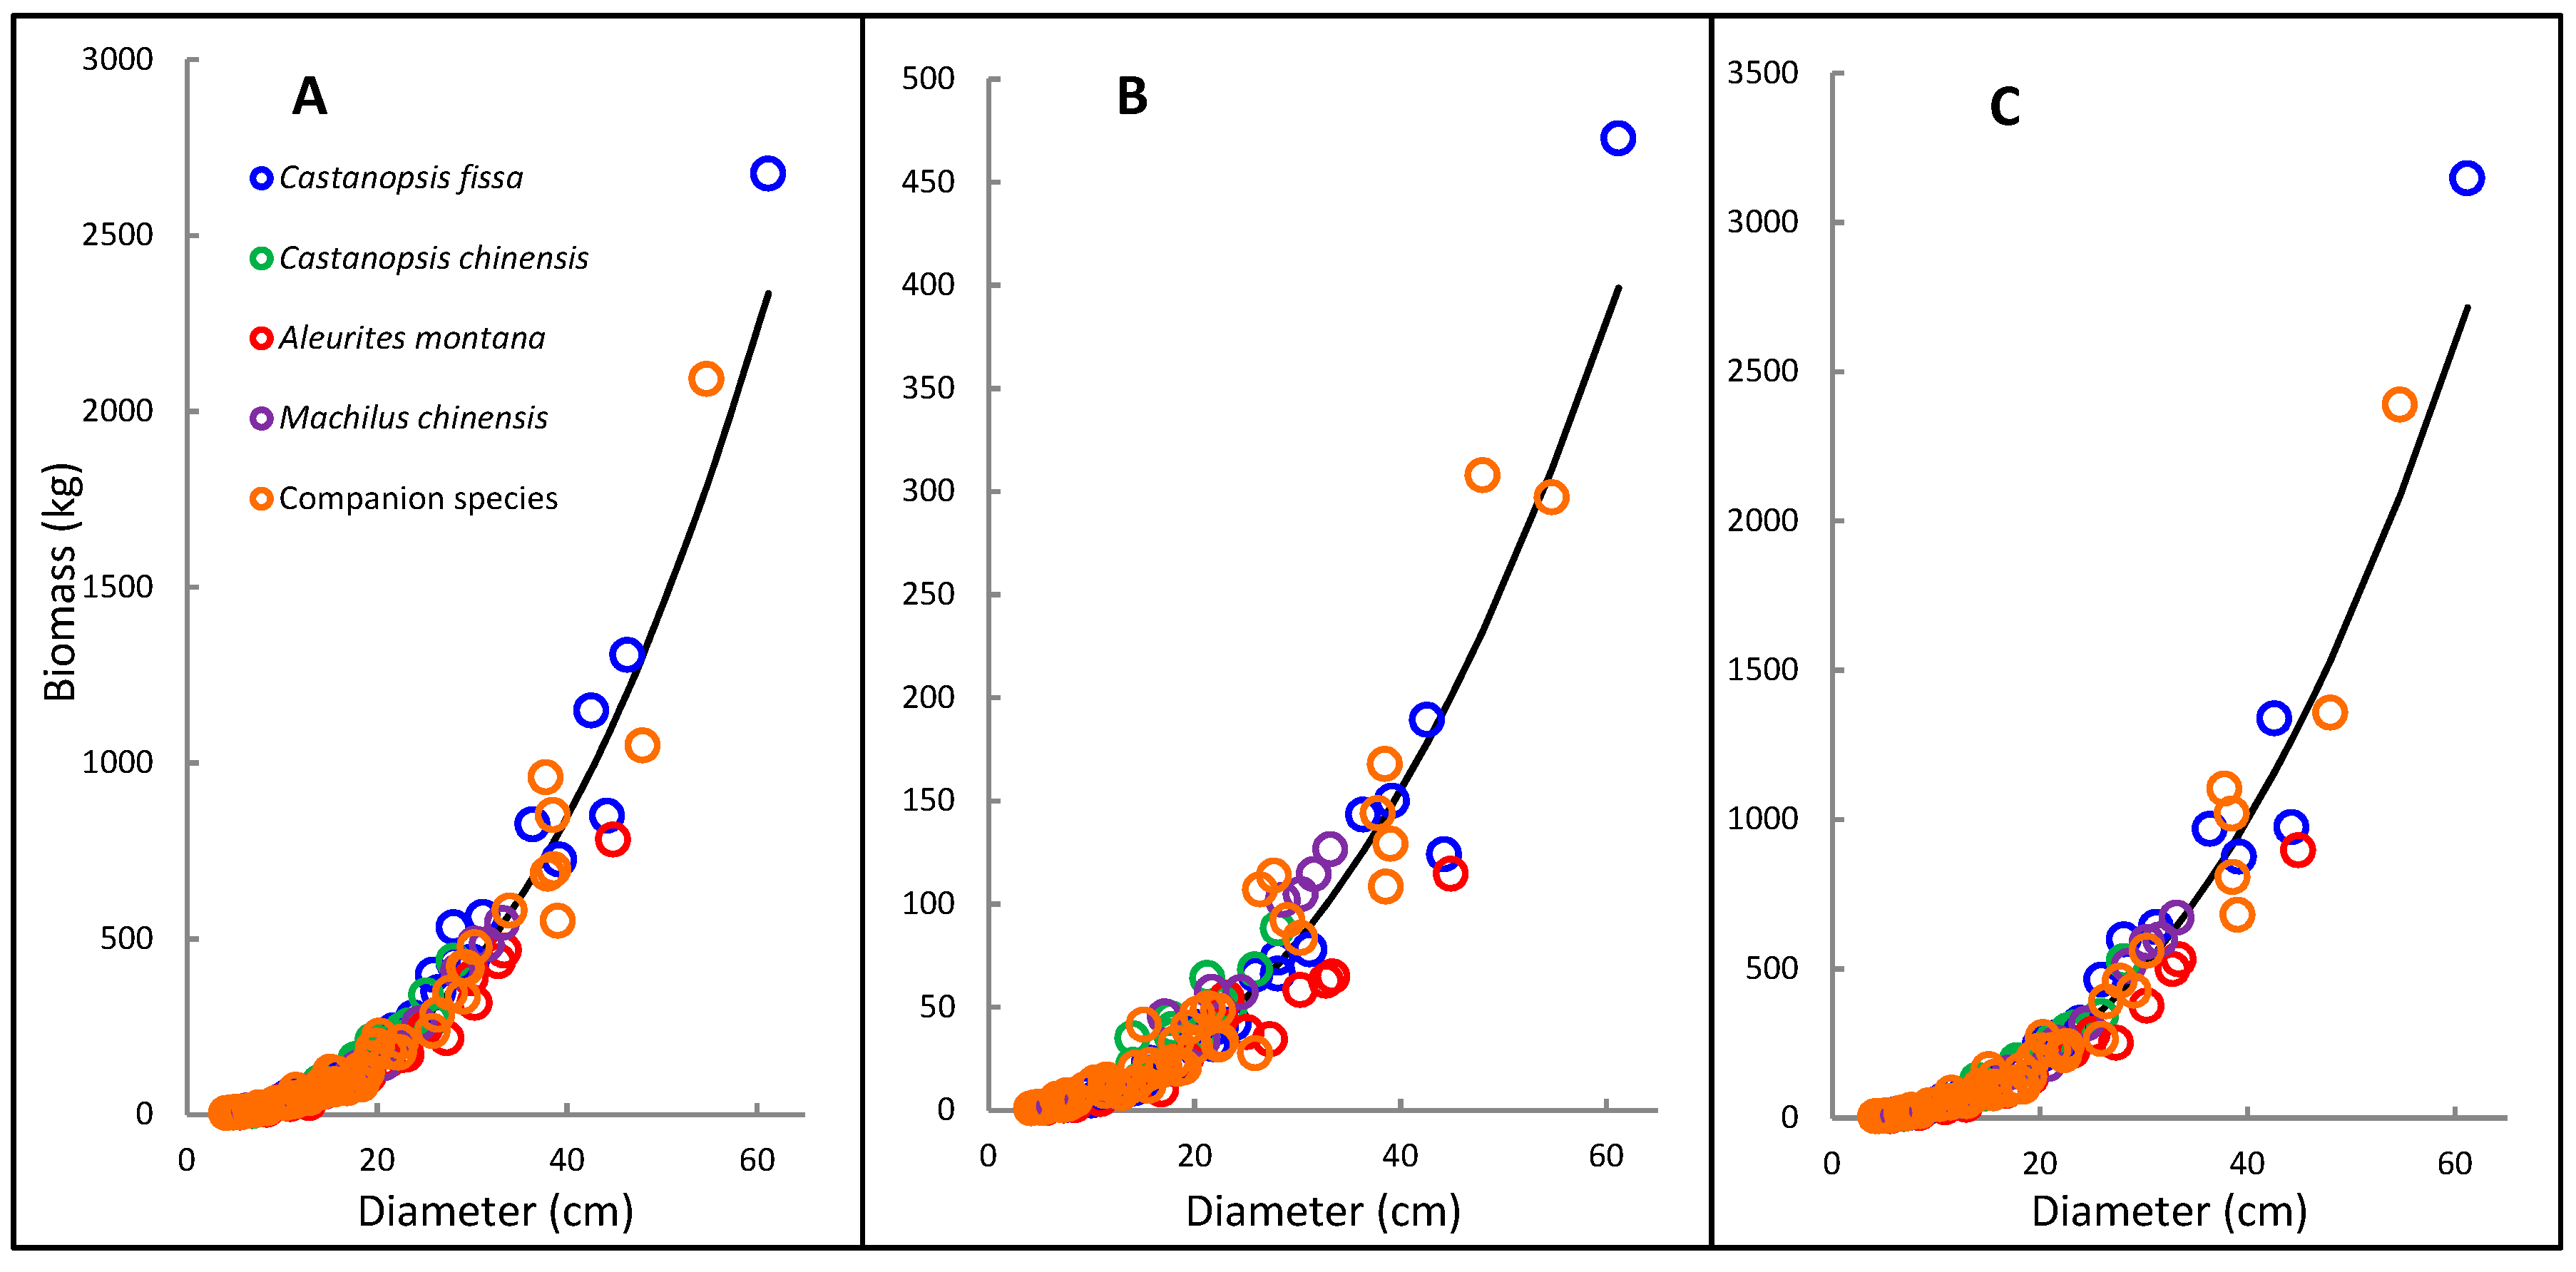
3.3. Allometric Models for Biomass Estimation with Different Variables

The estimated parameters of 5 allometric models for estimations of biomass of aboveground, belowground, total tree, stem, branch, leaf and the evaluated results of the model performance are listed in Table 3 and Table A1. Allometric equations including DBH as a single predictor (Equation (1)) fitted well with our data for the estimation of aboveground, belowground and total biomass (Figure 4) with high R2 (0.914~0.955) and low CV (29.81~38.49%) and Bias (−1.96~−5.84%). This equation had its highest accuracy in estimation of aboveground biomass, followed by total and belowground biomass.
The addition of tree height as an explanatory variable as the compound variable DBH2H in the equations (Equation (2)) resulted in a lower R2, and a higher RMSE, CV and Bias, than using DBH as a single variable in the equations of all biomass components, which means that combining H with DBH can decrease the model’s accuracy. The alternative equations (Equation (3)) in which H was allowed to vary with its own exponent slightly improved the model fitness in the estimation of belowground biomass, but had similar accuracy in the estimation of aboveground and total biomass compared to the equations using DBH as a single variable (Table 3).
Because DBH and H were highly correlated (Pearson r = 0.747), these variables were tested for collinearity effects using the variance inflation factor (VIF). The VIF values obtained were 3.114 when predicting aboveground biomass and 3.145 when predicting belowground and total biomass. These values indicated that DBH and tree height were highly collinear and exhibited redundancy with respect to explaining the distribution of the dependent variable. This collinearity resulted in increased standard errors of the coefficient for Equation (3).
When using WD compounded with DBH as a single variable DBH2WD (Equation (4)) in the equations, the model fitness in prediction of belowground biomass was slightly improved, but the model fitness in prediction of aboveground and total biomass was decreased compared with the equations using DBH as a single variable. When using WD as the second variable to follow DBH in the equation (Equation (5)), the result was the highest R2 and the lowest RMSE, CV and Bias among all of the equations (Table 3). Additionally, there was no significant correlation between DBH and WD (r = 0.037), and the obtained VIF values close to 1.0 indicated no collinearity. This result indicates that adding WD can improve the model fitness, and Equation (5) has the best accuracy.

4. Discussion

Since we considered it important to develop precise biomass models that can be used to make predictions for specific area estimations of biomass and carbon in REDD+ projects, or as inputs to forest decision-support management generally, we aimed to collect data with much variation. The selection of sample trees was guided by systematic sample plot inventories, and trees were selected based on their species-specific proportions according to their basal area. The selected sample trees in our dataset were the most common species, and approximately represented the proportion of community species distribution. The applied sampling strategy, however, also meant that many species in the sample plot inventories were not represented, because there were identical family or genus trees in the dataset, or these species constitute too little of the total basal area. Therefore, the absence of some species will have little impact on the accuracy of biomass estimation.

4.1. Effect of Adding Tree Height on Biomass Estimation

There has considerable divergence in the previous research on the effect of adding H to the biomass models to predict tree biomass: while some studies reported no improvement—or even deterioration [12,22,27]—other studies reported improvement [32,36]. Many workers suggest that including height in models will offset the site effect [37,38], but Dutcă et al. reported that height inclusion reduces model site specificity only for stem biomass and increases site specificity for total trees and total aboveground biomass [39]. Our results show that the use of DBH as a predictor variable provided a highly significant fit (p < 0.001), which indicated that DBH was a strong predictor of tree biomass. This result is consistent with the previous reports [22,40]. Although the difference was small, the model with the compound variable DBH2H resulted in a worse model than the DBH alone. Similar findings have been reported by many other studies [27]. Adding H as the second predictor variable was slightly better than the single DBH variable model, which was consistent with previous findings [25,41].
Although the use of two independent variables (DBH and H) in the equation has a better fit than the equation using DBH alone and combining DBH and H, there is a collinearity matter in allometric models. Collinearity is a phenomenon in which there is a strong linear relationship between two or more independent variables in multiple regressions [42]. This is clearly relevant to biomass allometric models, as DBH and H are always correlated. When highly correlated, DBH and H will inevitably exceed or repeat a certain proportion of biomass variation. Dutcă (2018) pointed out that in the biomass allometric models, collinearity increases the standard error of regression coefficients, extending the range of confidence intervals, and increases the uncertainty of model [39]. Furthermore, collinearity makes the regression coefficients sensitive to small changes in the dataset, such that the changes alter the coefficients and profoundly affect biomass prediction. The collinearity affects model prediction seriously when the predictors are highly correlated (r > 0.7) [42]. In our study, DBH and H were also found to be highly correlated (r = 0.747), the VIF of aboveground biomass was 3.114, and the underground biomass and total biomass were 3.145, confirming that the predictors were highly collinear.
Additionally, tree height data is difficult to obtain in the field, especially in dense forests, because treetops may hide in the forest canopy. Therefore, we do not recommend adding H as a second variable or combining with DBH as a variable to predict biomass.

4.2. Effect of Adding Wood Density on Biomass Estimation

Wood density is the basic characteristic of special trees, which has great differences in geographical regions, climate gradients, and correlated with forest structure, tree architecture [24,43]. Wood density is considered to be an important variable in allometric model for biomass estimation, especially for general biomass models covering many tree species [24]. Some studies indicate that taking wood density as variables in allometric models can greatly improve accuracies of biomass model in tropical forests and subtropical evergreen broadleaved forest [23,32], but others demonstrated that adding wood density did not improve model performance [28]. In this study, combining WD and DBH as a single variable (DBH2WD) did not improve model fitness, but adding WD as a second variable to DBH could reduce the CV and Bias and increase the R2 and perform the best fitness among all of the models. Unlike tree height, wood density has less correlation with DBH. In this study, the correlation between DBH and H of the total dataset (r = 0.037) was not obvious, and the VIF of aboveground biomass and underground biomass was 1.036 and 1.041, respectively, indicating that the two predictors were not collinear. Therefore, we recommend adding WD as the second variable after DBH to predict biomass if there is wood density data available.

4.3. Belowground Biomass

In this study, the contribution of individual root biomass to total tree biomass ranged from 10.4% to 31.8%. The average contribution of belowground biomass (17.9%) is close to that of other subtropical species reported by Xiang et al. [22]. The root-shoot ratio measured as 0.221 was between the value of subtropical humid forest with above-ground biomass <125 tons ha−1 (0.20) and with above-ground biomass >125 tons ha−1 (0.24) documented by the IPCC [44]. The between-species difference in root proportion may be explained by differences in tree species rooting structures, with, e.g., Koala et al. (2017) reporting root-shoot ratios ranging from 0.3 to 2.9, depending on tree species [45]. The finding in this study that root proportion has a negative correlation with tree size is consistent with those reported in other studies [15,46]. The low correlation coefficient (r = −0.301) indicated a weak relationship between aboveground and belowground biomass, and the high variation coefficient (0.326) indicated an unstable root-shoot ratio in this study. The unstable root-shoot ration means that the average root-shoot ration is not suitable for estimating belowground biomass.
Root structure and biomass are species dependent [47]. In the development of belowground biomass allometric equations, especially for mixtures of tropical or subtropical forests, abundant sample trees are required, with as many species and diameter classes as possible. Due to the high cost and labor requirements needed to excavate whole root systems, the number of sampled trees and their sizes were often limited although there is a critical need to reduce uncertainty in parameter estimates [23,34]. Some scientists did not fully excavate the root system but excavate few for sampling. For example, Kuyah et al. [48] did not excavate roots to depths below 2 m, estimate the missing weights by regression equations and then add them to the observed data. In this study, a total of 116 trees contained most of the sampling species and diameter classes were selected from 144 sampling trees, and the root systems were excavated, which can ensure that the developed allometric models were more accurate for belowground biomass estimation.

5. Conclusions

This study developed allometric models for quantifying the aboveground, belowground and total biomass in south subtropical humid forest of Southern China. The models were based on destructive and regression methods, with samples of 144 trees for aboveground biomass and 116 subsamples for belowground biomass. The models with only DBH as a predictor could adequately estimate aboveground, belowground and total biomass. Adding H or WD compounded with DBH as one variable (DBH2H or DBH2WD) did not improve model performance. Using H as the second variable in the equation could improve the model fitness in the estimation of belowground biomass, but there was a collinearity effect, which resulted in an increased standard error of the regression coefficients. Using WD as the second variable in the equation, the best-fitting allometric relationship for aboveground, belowground and total biomass estimation was given, indicating that WD is a crucial factor in the biomass models of subtropical forest. Root-shoot ratio of subtropical forest in this study varies between species and tree size, indicating that it is not suitable for estimating belowground biomass.

Author Contributions

Conceptualization, H.Z. and G.Z.; software and formal analysis, H.Z., investigation, Z.L. and Z.Q.; writing and review, H.Z. and G.Z.; funding acquisition, Z.W.

Funding

This research was funded by the Basic Science Foundation of Research Institute of Tropical Forestry, Chinese Academy of Forestry, grant number CAFYBB2017ZX002-3, CAFYBB2019SZ003, and Key Scientific and Technological Projects of Guangzhou forestry and garden bureau, grant number 2016-06.

Acknowledgments

We would like to thank Wu and Xiong for their assistance in field work.

Conflicts of Interest

The authors declare no conflict of interest.

Appendix A

Table A1. Allometric models for estimations of biomass of stem, branch and leaf.
ComponentsRegression ModelCoefficient SymbolVIFSEER2RMSECV (%)Bias (%)
abc
Stem(1)−2.202 ± 0.11.138 ± 0.017 0.5290.93353.8 35.02 −2.65
(2)−3.364 ± 0.10.927 ± 0.012 0.1950.93254.2 35.32 −1.91
(3)−3.112 ± 0.1470.979 ± 0.0250.712 ± 0.0943.1140.5010.94051.0 33.22 −1.85
(4)−1.494 ± 0.0941.155 ± 0.018 0.4030.93951.3 33.43 −2.98
(5)−1.933 ± 0.1191.15 ± 0.0170.483 ± 0.1271.0360.2400.94847.1 30.67 −2.40
Branch(1)−4.342 ± 0.1871.352 ± 0.032 0.0000.88145.3 53.35 −9.93
(2)−5.499 ± 0.2681.075 ± 0.032 0.0000.77162.9 74.11 −15.13
(3)−3.202 ± 0.3051.551 ± 0.053−0.891 ± 0.1953.1140.0000.89841.9 49.41 −8.74
(4)−3.528 ± 0.1621.378 ± 0.031 0.0000.81057.3 67.59 −9.10
(5)−3.846 ± 0.2231.374 ± 0.0310.891 ± 0.2381.0360.0000.85450.3 59.25 −8.92
Leaf(1)−4.156 ± 0.2261.092 ± 0.039 0.4910.68917.1 89.84 −15.92
(2)−5.075 ± 0.2950.866 ± 0.035 0.4170.57420.0 105.10 −19.48
(3)−3.078 ± 0.3781.28 ± 0.066−0.843 ± 0.2423.1140.2200.75615.1 79.61 −14.88
(4)−3.54 ± 0.1911.121 ± 0.037 0.4920.78114.3 75.30 −14.16
(5)−3.493 ± 0.2661.121 ± 0.0371.192 ± 0.2851.0360.4120.78514.2 74.67 −14.14
Note: (1) ln(B) = a + bln(DBH2), (2) ln(B) = a + bln(DBH2 × H), (3) ln(B) = a+bln(DBH2) + cln(H), (4) ln(B) = a + bln(DBH2 × WD), (5) ln(B) = a + bln(DBH2) + cln(WD); Letters a, b and c are the coefficient symbol of regression model; The number is unstandardized coefficients ± standard error, VIF is variance inflation factor; SEE is the standard error of estimate, R2 is the coefficient of determination; RMSE is root mean square error; CV (%) is coefficient of variation, Bias (%) is systematic error.

References

  1. Houghton, R.A. Aboveground forest biomass and the global carbon balance. Glob. Chang. Biol. 2005, 11, 945–958. [Google Scholar] [CrossRef]
  2. Yu, G.; Chen, Z.; Piao, S.; Peng, C.; Ciais, P.; Wang, Q.; Li, X.; Zhu, X. High carbon dioxide uptake by subtropical forest ecosystems in the East Asian monsoon region. Proc. Natl. Acad. Sci. USA 2014, 111, 4910–4915. [Google Scholar] [CrossRef] [PubMed] [Green Version]
  3. Brown, S. Measuring carbon in forests: Current status and future challenges. Environ. Pollut. 2002, 116, 363–372. [Google Scholar] [CrossRef]
  4. Xie, Y.; Sha, Z.; Yu, M. Remote sensing imagery in vegetation mapping: A review. J. Plant Ecol. 2008, 1, 9–23. [Google Scholar] [CrossRef]
  5. Molto, Q.; Rossi, V.; Blanc, L. Error propagation in biomass estimation in tropical forests. Methods Ecol. Evol. 2013, 4, 175–183. [Google Scholar] [CrossRef]
  6. Hossain, M.; Saha, C.; Abdullah, S.M.R.; Saha, S.; Siddique, M.R.H. Allometric biomass, nutrient and carbon stock models for Kandelia candel of the Sundarbans, Bangladesh. Trees 2016, 30, 709–717. [Google Scholar] [CrossRef]
  7. Henry, M.; Picard, N.; Trotta, C.; Manlay, R.J.; Valentini, R.; Bernoux, M.; Saintandré, L. Estimating tree biomass of sub-Saharan African forests: A review of available allometric equations. J. Physiol. 2011, 547, 963. [Google Scholar] [CrossRef]
  8. Ubuy, M.H.; Eid, T.; Bollandsås, O.M.; Birhane, E. Aboveground biomass models for trees and shrubs of exclosures in the drylands of Tigray, northern Ethiopia. J. Arid Environ. 2018, 156, 9–18. [Google Scholar] [CrossRef]
  9. Kuyah, S.; Sileshi, G.W.; Rosenstock, T.S. Allometric models based on bayesian frameworks give better estimates of aboveground biomass in the miombo woodlands. Forests 2016, 7, 13. [Google Scholar] [CrossRef]
  10. Picard, N.; Bosela, F.B.; Rossi, V. Reducing the error in biomass estimates strongly depends on model selection. Ann. For. Sci. 2015, 72, 811–823. [Google Scholar] [CrossRef]
  11. Roxburgh, S.H.; Paul, K.I.; Clifford, D.; England, J.R.; Raison, R.J. Guidelines for constructing allometric models for the prediction of woody biomass: How many individuals to harvest? Ecosphere 2016, 6, 1–27. [Google Scholar] [CrossRef]
  12. Basuki, T.M.; Laake, P.E.V.; Skidmore, A.K.; Hussin, Y.A. Allometric equations for estimating the above-ground biomass in tropical lowland Dipterocarp forests. For. Ecol. Manag. 2009, 257, 1684–1694. [Google Scholar] [CrossRef]
  13. Melson, S.L.; Harmon, M.E.; Fried, J.S.; Domingo, J.B. Estimates of live-tree carbon stores in the Pacific Northwest are sensitive to model selection. Carbon Balance Manag. 2011, 6, 2. [Google Scholar] [CrossRef] [PubMed]
  14. Chaturvedi, R.K.; Raghubanshi, A.S. Allometric models for accurate estimation of aboveground biomass of teak in tropical dry forests of India. For. Sci. 2015, 61, 938–949. [Google Scholar] [CrossRef]
  15. Mugasha, W.A.; Eid, T.; Bollandsås, O.M.; Malimbwi, R.E.; Chamshama, S.A.O.; Zahabu, E.; Katani, J.Z. Allometric models for prediction of above- and belowground biomass of trees in the miombo woodlands of Tanzania. For. Ecol. Manag. 2013, 310, 87–101. [Google Scholar] [CrossRef]
  16. Paul, K.I.; Roxburgh, S.H.; England, J.R.; Ritson, P.; Hobbs, T.; Brooksbank, K.; Raison, R.J.; Larmour, J.S.; Murphy, S.; Norris, J. Development and testing of allometric equations for estimating above-ground biomass of mixed-species environmental plantings. For. Ecol. Manag. 2013, 310, 483–494. [Google Scholar] [CrossRef]
  17. Huang, R.; Zhou, L.; Chen, W. The progresses of recent studies on the variabilities of the east Asian monsoon and their causes. Adv. Atmos. Sci. 2003, 20, 55–69. [Google Scholar] [CrossRef]
  18. Zhong, Z. The typical subtropical evergreen broadleaved forest of China. J. Southwest China Norm. Univ. 1987, 3, 109–121. [Google Scholar]
  19. Wang, X.H.; Kent, M.; Fang, X.F. Evergreen broad-leaved forest in Eastern China: Its ecology and conservation and the importance of resprouting in forest restoration. For. Ecol. Manag. 2007, 245, 76–87. [Google Scholar] [CrossRef]
  20. Fang, J.; Chen, A.; Peng, C.; Zhao, S.; Ci, L. Changes in forest biomass carbon storage in China between 1949 and 1998. Science 2001, 5525, 2320–2322. [Google Scholar] [CrossRef]
  21. Lin, D.; Lai, J.; Muller-Landau, H.C.; Mi, X.; Ma, K. Topographic variation in aboveground biomass in a subtropical evergreen broad-leaved forest in China. PLoS ONE 2012, 7, e48244. [Google Scholar] [CrossRef] [PubMed]
  22. Xiang, W.; Zhou, J.; Ouyang, S.; Zhang, S.; Lei, P.; Li, J.; Deng, X.; Fang, X.; Forrester, D.I. Species-specific and general allometric equations for estimating tree biomass components of subtropical forests in southern China. Eur. J. For. Res. 2016, 135, 1–17. [Google Scholar] [CrossRef]
  23. Xu, Y.; Zhang, J.; Franklin, S.B.; Liang, J.; Ding, P.; Luo, Y.; Lu, Z.; Bao, D.; Jiang, M. Improving allometry models to estimate the above- and belowground biomass of subtropical forest, China. Ecosphere 2015, 6, 1–15. [Google Scholar] [CrossRef]
  24. Chave, J.; Réjouméchain, M.; Búrquez, A.; Chidumayo, E.; Colgan, M.S.; Delitti, W.B.; Duque, A.; Eid, T.; Fearnside, P.M.; Goodman, R.C. Improved allometric models to estimate the aboveground biomass of tropical trees. Glob. Chang. Biol. 2014, 20, 3177–3190. [Google Scholar] [CrossRef] [PubMed]
  25. Zeng, W.; Fu, L.; Xu, M.; Wang, X.; Chen, Z.; Yao, S. Developing individual tree-based models for estimating aboveground biomass of five key coniferous species in China. J. For. Res. 2018, 29, 1251–1261. [Google Scholar] [CrossRef]
  26. Moussa, M.; Mahamane, L. Allometric models for estimating aboveground biomass and carbon in Faidherbia albida and Prosopis africana under agroforestry parklands in drylands of Niger. J. For. Res. 2018, 29, 1703–1717. [Google Scholar] [CrossRef]
  27. Gou, M.; Xiang, W.; Song, T.; Lei, P.; Zhang, S.; Ouyang, S.; Zeng, Y.; Deng, X.; Fang, X.; Wang, K. Allometric equations for applying plot inventory and remote sensing data to assess coarse root biomass energy in subtropical forests. Bioenergy Res. 2017, 10, 536–546. [Google Scholar] [CrossRef]
  28. Lin, K.; Lyu, M.; Jiang, M.; Chen, Y.; Li, Y.; Chen, G.; Xie, J.; Yang, Y. Improved allometric equations for estimating biomass of the three Castanopsis carlesii H. forest types in subtropical China. New For. 2017, 48, 1–21. [Google Scholar] [CrossRef]
  29. Brassard, B.W.; Chen, H.Y.H.; Bergeron, Y.; Paré, D. Coarse root biomass allometric equations for Abies balsamea, Picea mariana, Pinus banksiana, and Populus tremuloides in the boreal forest of Ontario, Canada. Biomass Bioenergy 2011, 35, 4189–4196. [Google Scholar] [CrossRef]
  30. Addo-Danso, S.D.; Prescott, C.E.; Smith, A.R. Methods for estimating root biomass and production in forest and woodland ecosystem carbon studies: A review. For. Ecol. Manag. 2016, 359, 332–351. [Google Scholar] [CrossRef]
  31. Carl, C.; Biber, P.; Landgraf, D.; Buras, A.; Pretzsch, H. Allometric models to predict aboveground woody biomass of black locust (Robinia pseudoacacia L.) in short rotation coppice in previous mining and agricultural areas in Germany. Forests 2017, 8, 328. [Google Scholar] [CrossRef]
  32. Peng, S.; He, N.; Yu, G.; Wang, Q. Aboveground biomass estimation at different scales for subtropical forests in China. Bot. Stud. 2017, 58, 45. [Google Scholar] [CrossRef] [PubMed]
  33. Zuur, A.F.; Ieno, E.N.; Elphick, C.S. A protocol for data exploration to avoid common statistical problems. Methods Ecol. Evol. 2010, 1, 3–14. [Google Scholar] [CrossRef]
  34. Ifo, A.S.; Gomat, H.Y.; Wenina, Y.E.M.; Lokegna, D.L.; Nzonzi, O.R.M.; Ngala, G.C.A.; Henry, M.; Boundzanga, G.C.; Jourdain, C.; Picard, N. Carbon stocks and tree allometries in the savannahs of the Plateau Batéké, central Africa. For. Ecol. Manag. 2018, 427, 86–95. [Google Scholar] [CrossRef]
  35. Zanne, A.E.; Lopez-Gonzalez, G.; Coomes, D.A.; Ilic, J.; Jansen, S.; Lewis, S.L.; Miller, R.B.; Swenson, N.G.; Wiemann, M.C.; Chave, J. Data from: Global wood density database. Dry. Digit. Repos. 2009. [Google Scholar] [CrossRef]
  36. Mcnicol, I.M.; Berry, N.J.; Bruun, T.B.; Hergoualc’h, K.; Mertz, O.; Neergaard, A.D.; Ryan, C.M. Development of allometric models for above and belowground biomass in swidden cultivation fallows of Northern Laos. For. Ecol. Manag. 2015, 357, 104–116. [Google Scholar] [CrossRef]
  37. Chave, J.; Andalo, C.; Brown, S.; Cairns, M.A.; Chambers, J.Q.; Eamus, D.; Fölster, H.; Fromard, F.; Higuchi, N.; Kira, T.; et al. Tree allometry and improved estimation of carbon stocks and balance in tropical forests. Oecologia 2005, 145, 87–99. [Google Scholar] [CrossRef]
  38. Feldpausch, T.R.; Lloyd, J.; Lewis, S.L.; Brienen, R.J.W.; Gloor, M.; Monteagudo Mendoza, A.; Lopez-Gonzalez, G.; Banin, L.; Abu Salim, K.; Affum-Baffoe, K.; et al. Tree height integrated into pantropical forest biomass estimates. Biogeosciences 2012, 9, 3381–3403. [Google Scholar] [CrossRef] [Green Version]
  39. Dutcă, I.; Mather, R.; Blujdea, V.N.B.; Ioraș, F.; Olari, M.; Abrudan, I.V. Site-effects on biomass allometric models for early growth plantations of Norway spruce (Picea abies (L.) Karst.). Biomass Bioenergy 2018, 116, 8–17. [Google Scholar] [CrossRef]
  40. Kuyah, S.; Dietz, J.; Muthuri, C.; Jamnadass, R.; Mwangi, P.; Coe, R.; Neufeldt, H. Allometric equations for estimating biomass in agricultural landscapes: I. Aboveground biomass. Agric. Ecosyst. Environ. 2012, 158, 216–224. [Google Scholar] [CrossRef]
  41. Bi, H.; Murphy, S.; Volkova, L.; Weston, C.; Fairman, T.; Li, Y.; Law, R.; Norris, J.; Lei, X.; Caccamo, G. Additive biomass equations based on complete weighing of sample trees for open eucalypt forest species in south-eastern Australia. For. Ecol. Manag. 2015, 349, 106–121. [Google Scholar] [CrossRef]
  42. Dormann, C.F.; Elith, J.; Bacher, S.; Buchmann, C.; Carl, G.; Carré, G.; Marquéz, J.R.G.; Gruber, B.; Lafourcade, B.; Leitão, P.J.; et al. Collinearity: A review of methods to deal with it and a simulation study evaluating their performance. Ecography 2013, 36, 27–46. [Google Scholar] [CrossRef]
  43. Ubuy, M.H.; Eid, T.; Bollandsas, O.M. Variation in wood basic density within and between tree species and site conditions of exclosures in Tigray, northern Ethiopia. Trees 2018, 32, 967–983. [Google Scholar] [CrossRef]
  44. Aalde, H.; Gonzalez, P.; Gytarsky, M.; Krug, T. 2006 IPCC Guidelines for National Greenhouse Gas Inventories, Volume 4: Agriculture, Forestry and Other Land Use; IPCC: Geneva, Switzerland, 2006. [Google Scholar]
  45. Koala, J.; Sawadogo, L.; Savadogo, P.; Aynekulu, E.; Heiskanen, J.; Saïd, M. Allometric equations for below-ground biomass of four key woody species in West African savanna-woodlands. Silva Fenn. 2017, 51, 1631. [Google Scholar] [CrossRef]
  46. Kachamba, J.D.; Eid, T.; Gobakken, T. Above- and belowground biomass models for trees in the miombo woodlands of Malawi. Forests 2016, 7, 38. [Google Scholar] [CrossRef]
  47. Vennetier, M.; Zanetti, C.; Meriaux, P.; Mary, B. Tree root architecture: New insights from a comprehensive study on dikes. Plant Soil 2015, 387, 81–101. [Google Scholar] [CrossRef]
  48. Kuyah, S.; Dietz, J.; Muthuri, C.; Jamnadass, R.; Mwangi, P.; Coe, R.; Neufeldt, H. Allometric equations for estimating biomass in agricultural landscapes: II. Belowground biomass. Agric. Ecosyst. Environ. 2012, 158, 225–234. [Google Scholar] [CrossRef]
Figure 1. Location of the sample area in Guangzhou, Southern China.
Forests 10 00862 g001
Figure 2. Distribution of biomass among different tree compartments (leaves, branches, stem, root). The percentages within the sections of each bar indicate the mean values for trees while the different lowercase letters follow the number indicate significant differences between species tested by one-way ANOVA LSD.
Forests 10 00862 g002
Figure 3. The average wood density measured in the stems of different species. The different lowercase letters at the top of each bar represent significant differences between species tested by one-way ANOVA LSD.
Forests 10 00862 g003
Figure 4. The distributions of aboveground (A), underground (B) and total (C) biomass at different diameter classes. The black line is the allometric model regressed based on the DBH as single variables.
Forests 10 00862 g004
Table 1. The dendrometric characteristics and the number distribution in DBH classes of sampled tree species.
SpeciesMin DBH (cm)Max DBH (cm)<10 cm10–15 cm15–20 cm20–25 cm25–30 cm>30 cm
ABABABABABAB
Castanopsis fissa7.4 61.2 334355664386
Aleurites montana5.6 44.9 322222423244
Castanopsis chinensis6.9 28.1 114343543200
Machilus chinensis6.3 33.2 223121331133
Ormosia semicastrata5.9 27.7 202041112200
Canarium pimela7.2 48.0 111121001144
Sapium discolor7.2 29.2 222222111000
Euodia meliaefolia19.4 38.5 000011111022
Cratoxylum cochinchinense7.6 20.3 220011110000
Sterculia lanceolata4.2 11.3 331100000000
Erythrina variegata12.4 15.6 002211000000
Schefflera octophylla16.9 22.4 000022110000
Archidendron lucidum8.5 37.8 110000000011
Cinnamomum camphora11.5 18.5 001110000000
Cinnamomum porrectum11.4 29.1 001100001100
Schima superba8.4 18.0 110011000000
Altingia chinensis34.0 34.0 000000000010
Cyclobalanopsis myrsinifolia22.6 22.6 000000110000
Diospyros morrisiana4.5 4.5 110000000000
Elaeocarpus japonicus15.8 15.8 000011000000
Engelhardtia roxburghiana38.0 38.0 000000000010
Eurya Thunb4.9 4.9 110000000000
Evodia lepta5.3 5.3 110000000000
Machilus breviflora14.3 14.3 001100000000
Sinosideroxylon pedunculatum54.7 54.7 000000000011
Wikstroemia nutans7.7 7.7 110000000000
Total4.2 61.2 252224182922242117122521
Note: Capital letter A represent the number of sampled trees that measured aboveground biomass and capital letter B represent the number of sampled trees that measured belowground biomass.
Table 2. Correlations between biomass proportion of different tree compartments and DBH of different species tested by Pearson Correlation Coefficients. * means significant at level α = 0.05 and ** means significant at level α = 0.01.
SpeciesLeaves ProportionBranches ProportionStem ProportionRoots Proportion
Castanopsis fissa0.1770.460 *−0.464 *−0.017
Castanopsis chinensis0.587 *0.823 **−0.657 *−0.406
Aleurites montana−0.795 **0.764 **−0.383−0.371
Machilus chinensis−0.743 **0.502−0.2670.059
Companion species−0.1240.539 **−0.389 **−0.278 *
All species−0.0910.501 **−0.314 **−0.303 **
Table 3. Allometric models for estimations of biomass of aboveground, belowground and total tree.
ComponentsRegression ModelCoefficient SymbolVIFSEER2RMSECV (%)Bias (%)
abc
Aboveground(1)−2.081 ± 0.0861.195 ± 0.015 0.1970.95576.7 29.81 −1.96
(2)−3.225 ± 0.1220.965 ± 0.015 0.2420.902112.5 43.72 −2.82
(3)−2.275 ± 0.1481.161 ± 0.0260.152 ± 0.0953.1140.1960.95278.7 30.58 −1.91
(4)−1.350 ± 0.0741.216 ± 0.014 0.1900.94286.5 33.59 −1.83
(5)−1.712 ± 0.0931.212 ± 0.0130.662 ± 0.1001.0360.1730.96468.7 26.68 −1.48
Belowground(1)−3.151 ± 0.1591.111 ± 0.027 0.3410.91419.5 38.49 −5.84
(2)−4.248 ± 0.1970.900 ± 0.023 0.3590.89221.9 43.24 −6.43
(3)−3.440 ± 0.2841.062 ± 0.0480.223 ± 0.1813.1450.3400.91719.2 37.89 −5.74
(4)−2.514 ± 0.1301.137 ± 0.025 0.3100.92018.8 37.10 −4.72
(5)−2.644 ± 0.1781.136 ± 0.0250.936 ± 0.1891.0410.3100.92817.8 35.21 −4.67
Total(1)−1.768 ± 0.0991.176 ± 0.017 0.2110.95494.9 30.42 −2.26
(2)−2.928 ± 0.1340.953 ± 0.016 0.2450.905136.6 43.79 −2.89
(3)−2.052 ± 0.1741.128 ± 0.0300.218 ± 0.1113.1450.2080.95198.4 31.56 −2.15
(4)−1.073 ± 0.0801.200 ± 0.016 0.1900.947101.7 32.62 −1.84
(5)−1.365 ± 0.1021.196 ± 0.0150.746 ± 0.1081.0410.1780.96682.1 26.32 −1.57
Note: (1) ln(B) = a + bln(DBH2), (2) ln(B) = a + bln(DBH2 × H), (3) ln(B) = a + bln(DBH2) + cln(H), (4) ln(B) = a + bln(DBH2 × WD), (5) ln(B) = a + bln(DBH2) + cln(WD); Letters a, b and c are the coefficient symbol of regression model; The number is unstandardized coefficients ± standard error, VIF is variance inflation factor; SEE is the standard error of estimate, R2 is the coefficient of determination; RMSE is root mean square error; CV (%) is coefficient of variation, Bias (%) is systematic error.

