Article

Whitebark Pine in Crater Lake and Lassen Volcanic National Parks: Assessment of Stand Structure and Condition in a Management and Conservation Perspective

1
Humboldt State University, Department of Biological Sciences, 1 Harpst St. Arcata, CA 95521, USA
2
National Park Service, Klamath Network Inventory and Monitoring Program, 1250 Siskiyou Blvd, Ashland, OR 97520, USA
3
National Park Service, Sierra Nevada Network Inventory & Monitoring Program, 47050 Generals Highway, Three Rivers, CA 93271, USA
4
Western EcoSystems Technology, Inc., 2725 NW Walnut Blvd, Corvallis, OR 97333, USA
5
Crater Lake National Park, PO Box 7 Hwy 62 Sager Building, Crater Lake, OR, 97604, USA
6
Lassen Volcanic National Park, PO Box 100, Mineral, CA 96063, USA
*
Author to whom correspondence should be addressed.
Forests 2019, 10(10), 834; https://doi.org/10.3390/f10100834
Submission received: 25 June 2019 / Revised: 27 August 2019 / Accepted: 18 September 2019 / Published: 21 September 2019
(This article belongs to the Special Issue Ecology and Restoration of Whitebark Pine)

Abstract

:
Whitebark pine (Pinus albicaulis. Engelm.) is vulnerable to a number of threats including an introduced pathogen (Cronartium ribicola J.C. Fisch.), epidemic levels of native mountain pine beetle (Dendroctonus ponderosae Hopkins), fire suppression, and climate change. To describe the structure of whitebark pine populations in two national parks in the southern Cascades (Crater Lake, Oregon, USA (CRLA) and Lassen Volcanic, California, USA (LAVO) National Parks), we surveyed trees in 30 × 50 × 50 m plots in both parks. We used these plots to describe the extent of white pine blister rust (the disease caused by Cronartium ribicola), mountain pine beetle occurrence, and to elucidate factors influencing the presence of pests and pathogens, cone production, and canopy kill. In each plot, we recorded data related to tree health, including symptoms of blister rust and mountain pine beetle, and reproductive vigor (cone production). In both parks, encroachment from other species, particularly mountain hemlock (Tsuga mertensiana (Bong.) Carrière), was negatively associated with cone production. In CRLA, water stress was a good predictor of blister rust infection and cone production. For CRLA and LAVO, the presence of mountain pine beetle and blister rust was associated with higher canopy kill for whitebark pine. Lastly, we found evidence for a pest-pathogen interaction, mountain pine beetle attack was greater for trees that showed symptoms of blister rust infection in CRLA. Our results indicate that whitebark pine populations in the southern Cascade Range are experiencing moderate levels of blister rust infection compared with other sites across the species range, and that competition from shade-tolerant species may result in an additional threat to whitebark pine in both parks. We present our findings in the context of park management and situate them in range-wide and regional conservation strategies aimed at the protection and restoration of a declining species.

1. Introduction

Five-needle white pines (Family Pinaceae, Genus Pinus, Subgenus Strobus), and in particular whitebark pine (Pinus albicaulis Engelm.), limber pine (P. flexilis James), and foxtail pine (P. balfouriana Balf.), are described as keystone or foundational species in upper subalpine and treeline forests [1,2,3]. At these higher elevations, five-needle pines are often dominant species and are thought to serve key ecosystem functions, including modulating springtime snowmelt (thereby increasing summer water availability), moderating local environments allowing for establishment of shade-tolerant species, and, during mast years producing large seed crops critical to wildlife, such as Clark’s nutcrackers (Nucifraga Columbiana Wilson) [4,5]. However, these same taxa are currently facing unprecedented challenges from climate change, upsurges of pests and pathogens, and fire exclusion [5].
High-elevation forests in several National Park Service (NPS) Pacific West Region parks in the USA including Crater Lake National Park (CRLA) and Lassen Volcanic National Park (LAVO) are known for their whitebark pine, which often exhibit a stunted, twisted appearance near treeline, and are an important part of the visitor experience at both parks. A particularly pernicious threat to whitebark pine is the exotic fungal pathogen Cronartium ribicola J.C. Fisch. (Division Basidiomycota, Order Pucciniales), which was accidentally introduced into North America in 1910 and causes white pine blister rust (herein referred to as blister rust) in all five-needle white pines [6]. The fungus exhibits a complex life cycle that includes five different spore types alternating between five-needle white pines and plants of the genera Ribes, Pedicularis, and Castilleja [7]. Blister rust damages and can ultimately kill five-needle white pines by girdling branches and boles. Whitebark pine is also impacted by increasing populations of the native mountain pine beetle (Dendroctonus ponderosae Hopkins), competition with encroaching vegetation (such as mountain hemlock, Tsuga mertensiana (Bong.) Carrière) due to fire exclusion [8], and changing climate [5,9]. These factors, acting singly or in combination, are likely to change the structure, function, and composition of these high elevation forests.
In 1998, Goheen et al. [10] surveyed whitebark pine stands in an area just north of, and adjacent to, CRLA (i.e., Umpqua National Forest). They found 46% of living trees were infected with blister rust and 10% of trees were dead. Of the dead trees, 67% were killed by blister rust, 13% by mountain pine beetle alone, and 18% were killed by mountain pine beetle and exhibited signs of blister rust. Within CRLA, in 2003 Murray and Rasmussen [11] surveyed 1200 whitebark pine trees in 24 transects to determine the level of blister rust in the park. They found that an average of 8% (range 0%–20%) of whitebark pine was infected with blister rust. In a separate study conducted from 2003–2009, Murray [12] surveyed whitebark pine in permanent plots across CRLA and found an average annual loss of 1% of trees across all size classes. Blister rust was found in 31% of trees in his study. However, most mortality appeared to be due to mountain pine beetle. In 2009, Smith et al. [13] surveyed whitebark pine in CRLA and found that 21% of tree deaths were attributed to mountain pine beetle, 20% to blister rust, and 54% were of unknown causes. To the best of our knowledge, no work has been done on the condition of whitebark pine stands in LAVO, although numerous biologists have noted, through casual observation that, blister rust did not appear to be abundant in the park.
The range-wide whitebark pine conservation principals are outlined by Keene et al. [3,14] are to promote rust resistance, conserve genetic diversity, protect declining seed sources, and employ restoration treatments. These principal goals are largely echoed in The Pacific Northwest Regional Goals of Aubrey et al. [15] and the CRLA whitebark pine conservation plan [8]. Lassen does not currently have a formalized conservation plan, but hews largely to the principles articulated in the CRLA plan. For management and conservation of whitebark pine, parks need to consider the broader conservation principles and applications to mitigate local stressors. Local-scale management actions include: identifying likely rust-resistant trees and collecting seeds for propagation [16], and ultimately out-planting individuals showing highest levels of resistance [8,17], use of verbenone [18,19] to repel aggregation of mountain pine beetle (especially on cone producing whitebark pine displaying rust resistance), reducing interspecific competition through fire or thinning [3,20], and focusing efforts on areas most likely to support whitebark pine given projected climate change [21,22].Managers should tailor region-wide strategies to suit local conditions for the most effective restoration treatments [23]. Identifying specific stressors and individual park patterns can be aided by inventory and monitoring data, which further assists park managers in developing best practices for park restoration.
This work summarizes our findings from the establishment of 30 long-term demographic plots in both CRLA and LAVO (Figure 1). In particular, the specific objectives of our work are to 1) describe the structure of high elevation forests containing whitebark pine presence within selected areas of CRLA and LAVO, 2) report the extent of blister rust infection, and mountain pine beetle occurrence on whitebark pine, and 3) determine the relationship of these stressors with environmental and tree demographic characteristics. We present our findings in the context of current park management and range-wide and regional conservation strategies for protection of a declining species.

2. Materials and Methods

Data were collected during the summers of 2012–2014 (available at https://irma.nps.gov/DataStore/Reference/Profile/2218564). In CRLA, whitebark pine occupies ~2000 ha (2.1% of the total park), and in LAVO whitebark pine covers 257 ha (0.6% of the total park, Figure 2 and Figure 3). Over the three years of monitoring, 30 long-term whitebark pine plots were established in each of the two parks and 10 plots were visited per park per year. Sampling design and response design are fully described in McKinney et al. [24]. Due to safety and logistical constraints on sampling, the target population excluded areas with slopes greater than 30 degrees, and locations <100 m or >1 km from a road or trail. The sampling points were generated using the Generalized Random Tessellation Stratified (GRTS) algorithm in GIS [25]. An oversample of points was also drawn using the GRTS algorithm to support any eventual site rejections. Sites were rejected if (1) no whitebark pine was present, or (2) they would result in unsafe working conditions (e.g., terrain that was too steep to work on). Sampled points were used as the southwest corner of the 50 × 50 m plots if one or more whitebark pine trees ≥1.37 m in height were found within the plot boundary. We delineated the sampling frames for Crater Lake and Lassen using a combination of known whitebark pine locations and aerial photos. Sampling frames are defined as suitable habitat, with the presence of at least one whitebark pine confirming that assumption. If there were no whitebark pine individuals in a plot, an offset procedure was employed [24]. If the offset procedure did not generate a usable plot, a new plot location was selected from the first unused oversample point. Each 50 × 50 m plot consisted of five 10 × 50 m subplots and nine 3 × 3 m regeneration plots where we recorded heights and diameter (cm) at breast height (dbh) of all species and tagged all whitebark pine seedlings <1.37 m in height.
Within the 50 × 50 m plot, all trees ≥1.37 m in height were identified to species and tagged with a unique identification number. The dbh and height of each tree was recorded. In addition, each whitebark pine was assessed for symptoms of blister rust. The upper, middle, and bottom thirds of each tree were assessed separately and assigned to one of three conditions: (1) absent—no sign of rust infection, (2) active cankers (aeciospores present), or (3) inactive cankers, defined by the presence of at least three of the following six indicators of infection: rodent chewing, flagging, swelling, roughened bark, oozing sap, and old aecia. Also in thirds, we assessed canopy condition for all whitebark pine trees, defined here as canopy kill, an estimate of recent canopy damage and needle death. This metric does not account for how much canopy the tree had to begin with but is in proportion to the trees current structure. Also, for whitebark pine individuals, mountain pine beetle activity was recorded if pitch tubes, frass, and/or J-shaped galleries were found. Dead trees ≥1.37 m in height and >5 cm dbh were also tagged with unique identification numbers and their dbh measured. Seedlings (trees >20 cm and <1.37 m in height) were counted by species and height class in the nine regeneration plots.
Climate data (monthly precipitation and temperature means spanning 1981–2014, derived values averaged across all years) were modeled for each plot location at a spatial resolution of 800 m (~30 arc seconds) from the Parameter-elevation Regression on Independent Slopes Model developed by the PRISM Group at Oregon State University [26,27,28,29]. We modeled soil water availability for both parks from the Soil Survey Geographic Database (SSURGO) at the 2 km grid resolution from the Natural Resources Conservation Service [30]. Our presentation of climate data is, therefore, a historic site average. We do not intend to assess climatic fluctuations between our sampling periods (2012–2014), rather we aim to quantify differences between historically high and low water stress plots and the trees present within them.
To estimate climatic water deficit (Cwd), a measure of water stress, we used a Thornthwaite-type water balance model to make estimates for all plots in both parks [31,32,33,34,35]. Thornthwaite-type methods are most appropriate for the development of water-balance models when inputs are limited to precipitation and temperature [36]. In the Thornthwaite-type model, water is considered either to be stored in snowpack, transpired by vegetation, evaporated from the soil, or as surplus in the form of runoff which reflects potential evapotranspiration (PET) [37]. These calculations assume that the terrain is flat. However, other researchers have combined measure of PET and heat load to generate more accurate estimates of Cwd [37]. Therefore, we used a dimensionless heat-load (HL) index developed by McCune and Keon [38] where equations for direct radiation are based on latitude, slope, and aspect. Direct radiation is a metric that reflects the higher temperatures and evaporative demands that occur in the afternoon [37]. Using HL values to scale PET values, we were able to account for the variability in terrain for calculations of Cwd. Model outputs included estimates of monthly Cwd (mm), which we chose to average for the entire year.
Next, to assess potential drivers of pathogen and pest occurrence, reproductive output, and proportion of average canopy killed, we used a series of generalized linear mixed-effects models (GLMM). Fixed effects in the model included ‘tree-level’ covariates (Dbh, wpbr, mbp, cones) and ‘plot-level’ covariates (BAwbp, BAother, Cwd) (Table 1). The random effect for all models was plot. Models were constructed such that each ‘tree-level’ covariates were fit before ‘plot-level’ covariates. For models of blister rust infection, mountain pine beetle infestation, and the presence of cones where the dependent variable takes the response 0 or 1, we used the binomial family and logit link function. To model the proportion of average canopy killed, we employed beta regression. Beta regression is a favorable approach to modeling proportions that fall between 0 and 1 but not values of exactly 0 or 1 [39]. In both parks, the proportion of average canopy killed included proportions of 0 and 1, and therefore, we used a common transformation of the dependent variable that constrains the distribution to values that occur within the interval (0, 1) [39]. In the case of the model predicting proportion of canopy kill, wbpr and mpb were included as ‘tree-level’ covariates, despite the obvious redundancy. However, this arrangement allows for ‘plot-level’ covariates to be evaluated after fitting the model for obvious agents of crown loss. Therefore, our analysis represents relationships present even after accounting for wpbr and mpb presence. Crown kill due to either of these agents cannot be separated when present together, and we do not present them separately.
We provide general summaries of the size and structure of whitebark pine in our plots. This includes descriptions of size distributions of trees (both alive and dead), the proportion of dead trees (Table 2, Figure 3 and Figure 4), the amount of new recruitment present (Figure 5), and cone production (Figure 6. We calculated the proportion of average canopy kill by averaging all values of percent canopy kill recorded for the lower, middle, and upper portions of each tree. In addition, we summarized the current prevalence of blister rust and mountain pine beetle across the plots.
Our models did not account for the design weights associated with the GRTS sample design to adjust the model-based estimators. Since equiprobable samples were drawn within each park with a probabilistic method unrelated to the outcome of interest, the design can be ignored in a model-based approach [40]. However, nonresponse error due to inaccessible sites may impact inference if the mean of the outcome of interest for accessible sites is significantly different from the mean at inaccessible sites. In CRLA, two of 32 sites were not successfully surveyed. One site was deemed to be outside of the target population because no whitebark pine was present, this frame error would impact design weights of all sites equally under equiprobable sampling. One site was inaccessible, which is considered nonresponse error because the site is assumed to be within the target population to which inference is made. This small proportion of nonresponse at CRLA does not provide a large enough sample of missing sites for standard nonresponse adjustment procedures. At LAVO, three of 53 sites were classified as outside the target population. However, the rate of nonresponse was much higher at LAVO where 20 of the target 50 sites were not surveyed due to inaccessibility. If the blister rust prevalence rate is substantially different at the inaccessible sites, then inference based on only the accessible sites may be biased. We, therefore, conducted an analysis to examine how the nonresponse rate might have influenced the results by examining three different approaches to calculating estimates of blister rust prevalence. We compared the results of the GLMM to population-level prevalence rates obtained from design-based and model-assisted estimators [41]. We compared a synthetic estimator [42], the design-based Horvitz-Thompson [43] estimator based on the GRTS sample [25], and a weighting-class adjustment estimator based on categories of the Slope, Aspect, and Elevation covariates. The estimates of blister rust prevalence from the three estimators were comparable to those obtained from the GLMM where design weights were ignored. We found no evidence of biased blister rust inference from treating the missing data as completely random and applied the GLMM to the observed data.
For all analyses we chose to include the following predictor variables as plot-level metrics: average yearly Cwd, basal area of all non-whitebark pine, the majority of which was mountain hemlock (both live and dead trees) (BAOther), and basal area of whitebark pine (BaWBP) (both live and dead, Table 1). We chose to include dead trees here for several reasons. The basal area of dead non-whitebark pine was a relatively small fraction of the total non-whitebark pine basal area. For CRLA, we observed ~12% dead basal area (median among plots = 6%), and in LAVO we observed ~3% dead basal area (median = 0.2%). Second, removing dead trees has the potential to omit the increased competition these trees created when they were alive (both above- and below-ground), which may have been recently enough to influence long-lived trees such as whitebark pine. Tree-level covariates included dbh (Dbh), blister rust presence (Wpbr, both active and inactive infections combined), and mountain pine beetle presence (Mpb, includes all symptoms, Table 1).
All plot- and tree-level variables we included in the analysis represent measures of the major stressors affecting whitebark pine populations, namely, climate-induced water stress, intraspecific (BaWBP) and interspecific (BaOther) competition, mountain pine beetle, and blister rust. Our models also incorporate tree-level covariates (Dbh, Wpbr, and Mpb), allowing all inferences for plot-level variables to be evaluated after accounting for individual differences. Fixed effects in the model included ‘tree-level’ covariates (Dbh, wpbr, mbp, cones) and ‘plot-level’ covariates (BAwbp, BAother, cwd). The random effect for all models was plot. Models were constructed such that each ‘tree-level’ covariates were fit before ‘plot-level’ covariates.
For all models, we centered continuous covariates so that each covariate demonstrated a mean of 0.0 and a standard deviation equal to that of the unshifted variable. Standardizing variables aids in the interpretation of coefficients, especially if they are on very different scales [44]. Standard errors, p-values, and 95% confidence intervals were generated for each model. To determine the sensitivity of candidate models (the number of correctly classified trees) we used the area under the receiver operating characteristic (ROC) curve [45]. The ROC curve (AUC (Area under curve)) >0.80 suggests excellent model discrimination (i.e., the ability of the model to correctly classify those with and without the disease [46]. To assess model fit, we computed both marginal and conditional R2 for models employing the binomial distribution (marginal, R2GLMMm and conditional, R2GLMMc) [47], and pseudo R2 values for models employing the beta distribution [48]. We assessed all models (except those utilizing beta regression) for overdispersion, a common problem associated with modeling count data, where the variance of the response variable is greater than the mean [49].
We assessed the relationship between predictor variables and each outcome of interest (i.e., cone production, Mpb, etc.) by referring to both the associated p-values and confidence intervals of regression coefficients obtained from each model. We considered parks separate, and data are not pooled for analysis. Here, p-values represent the significance of a Wald test of each regression coefficient assuming a normal distribution (based on sample size, n = 30 at each park, and within levels defined by covariates and if covariates are not collinear). Separately, confidence intervals represent the level of uncertainty around the measure of effect, which in the case of binomial models are expressed as a log-odds ratio. However, some factors have confidence intervals that barely overlap zero and suggesting some relationship exists p-values (<0.1). By convention, these cases are included as useful and predictive factors.
We performed all statistical analysis in R version 3.2.3 [50]. For beta regression, we utilized the function glmmADMB in the R package glmmABMB [51], for models utilizing the binomial distribution we used the glmer function in the R package “lme4” [52], and for zero-inflated Poisson regression we used the zeroinfl function in the R package “pscl” [53].

3. Results

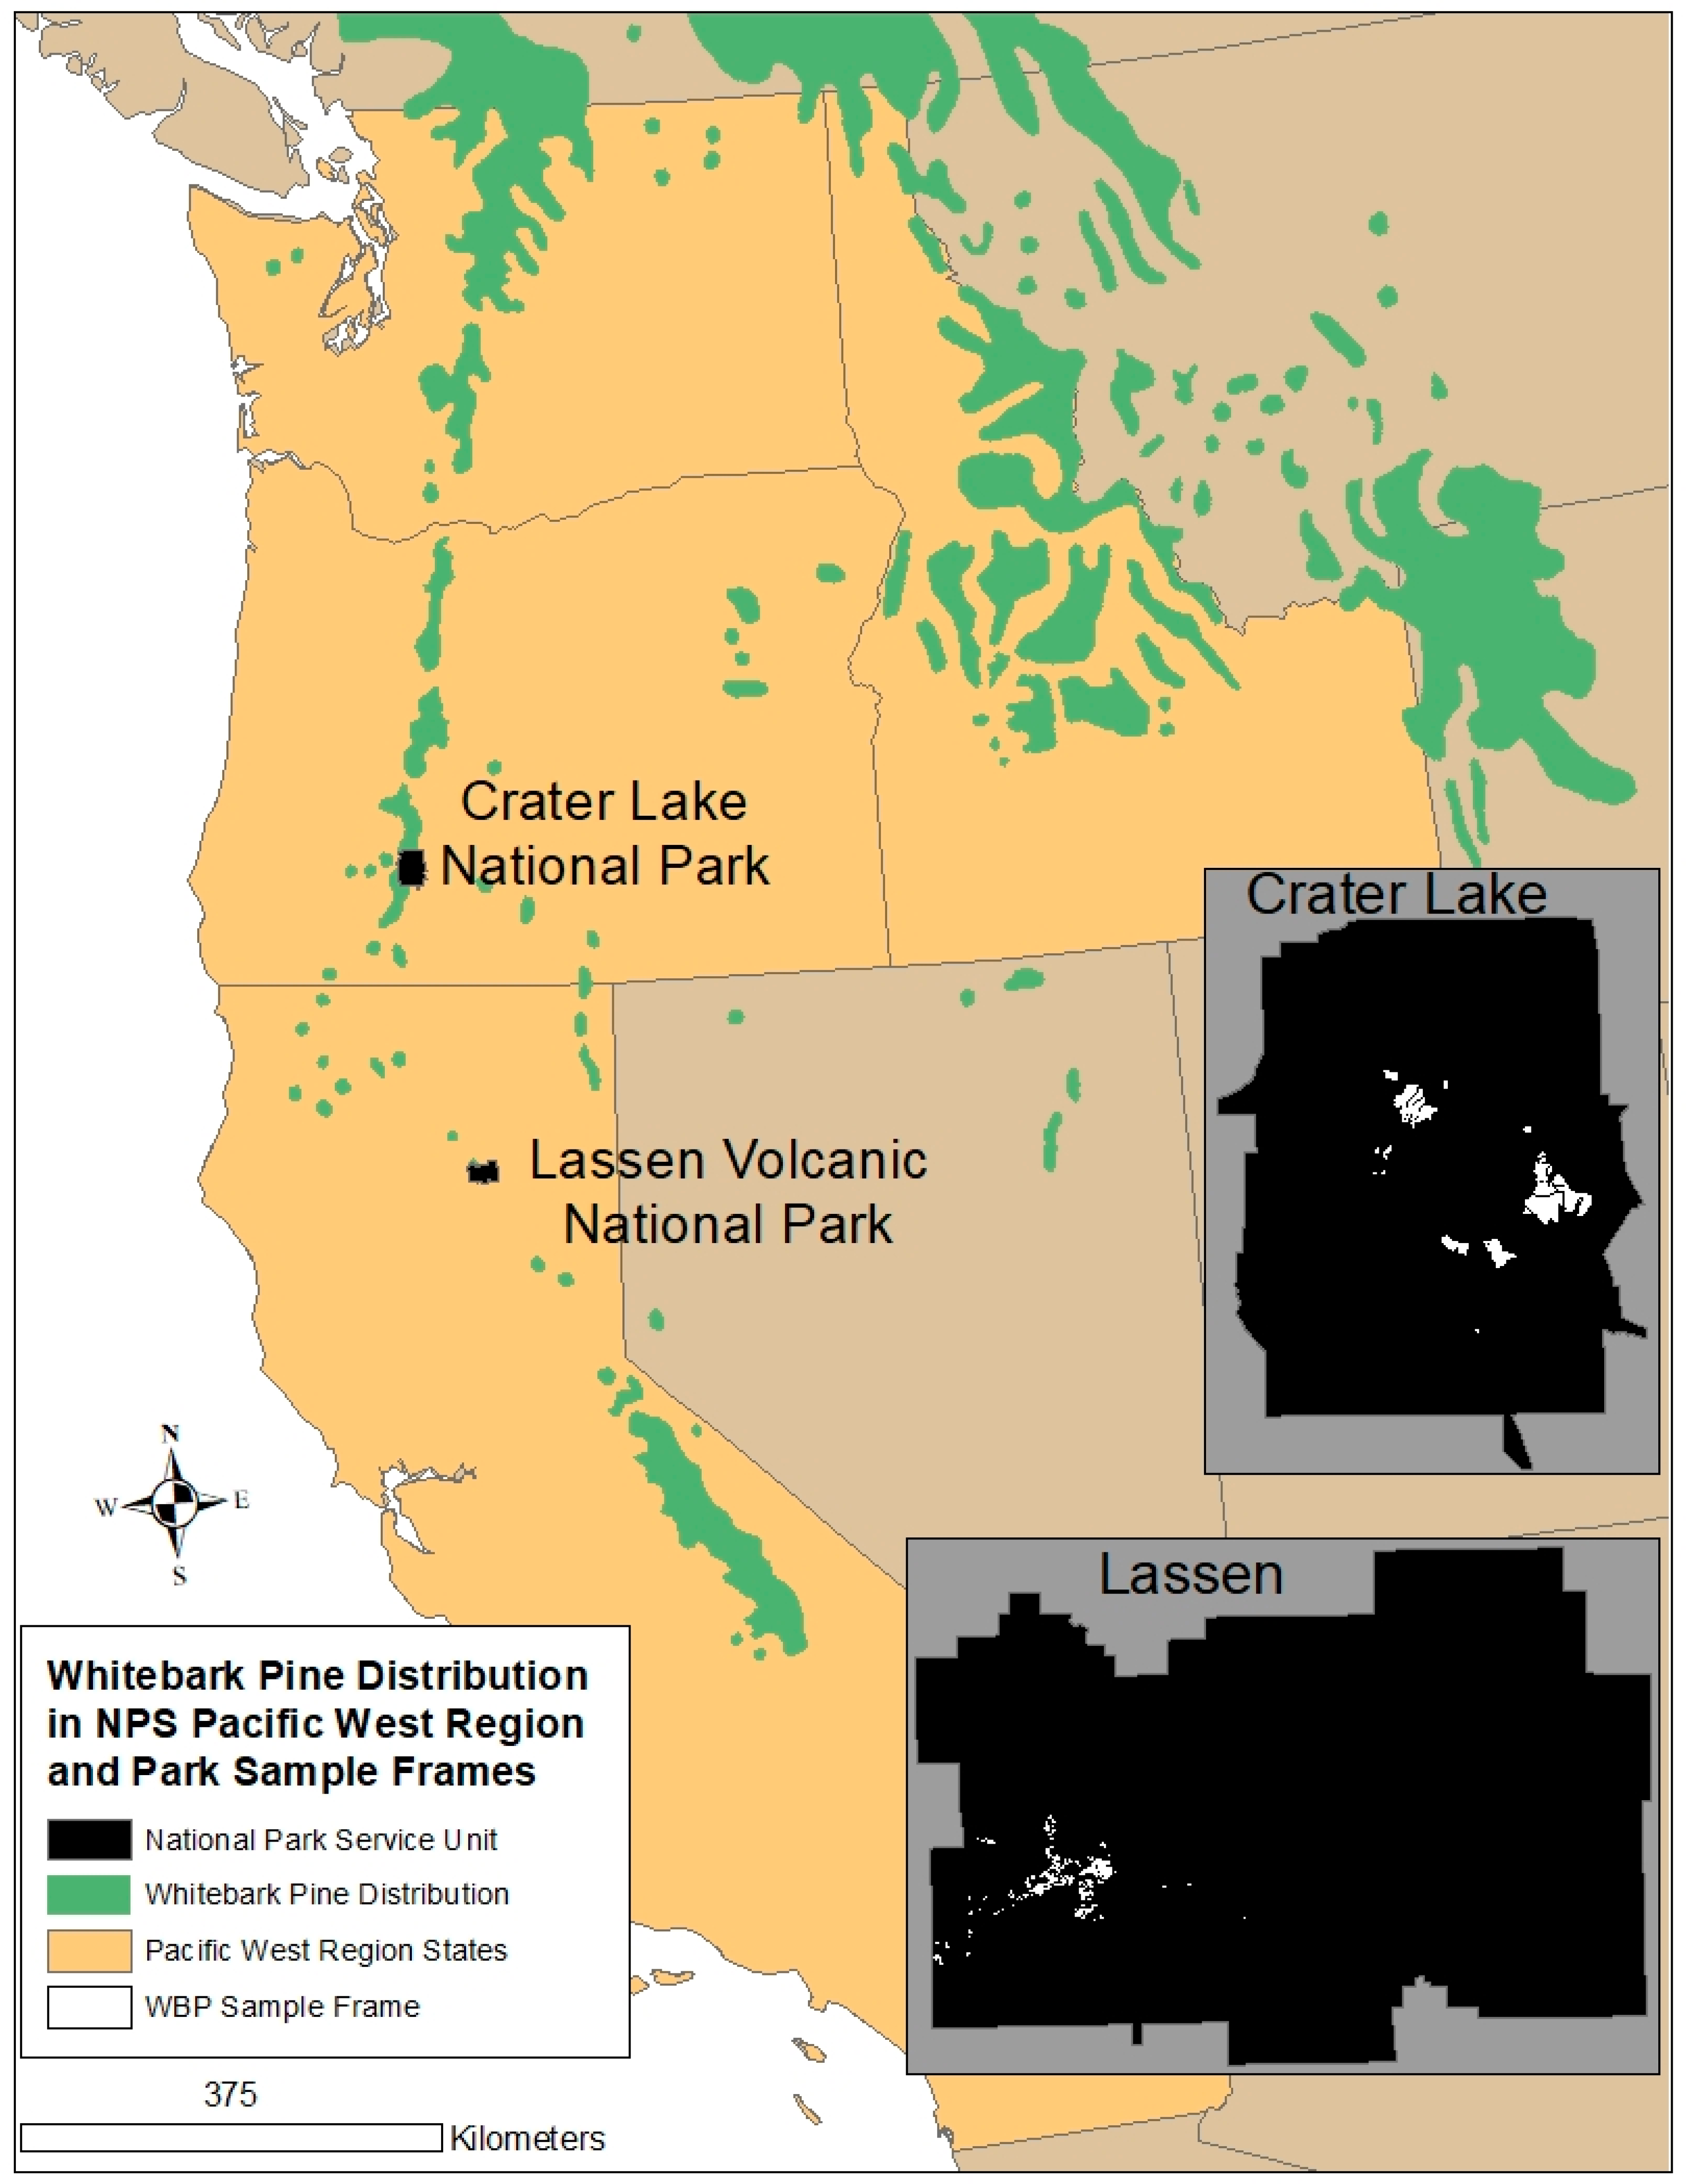
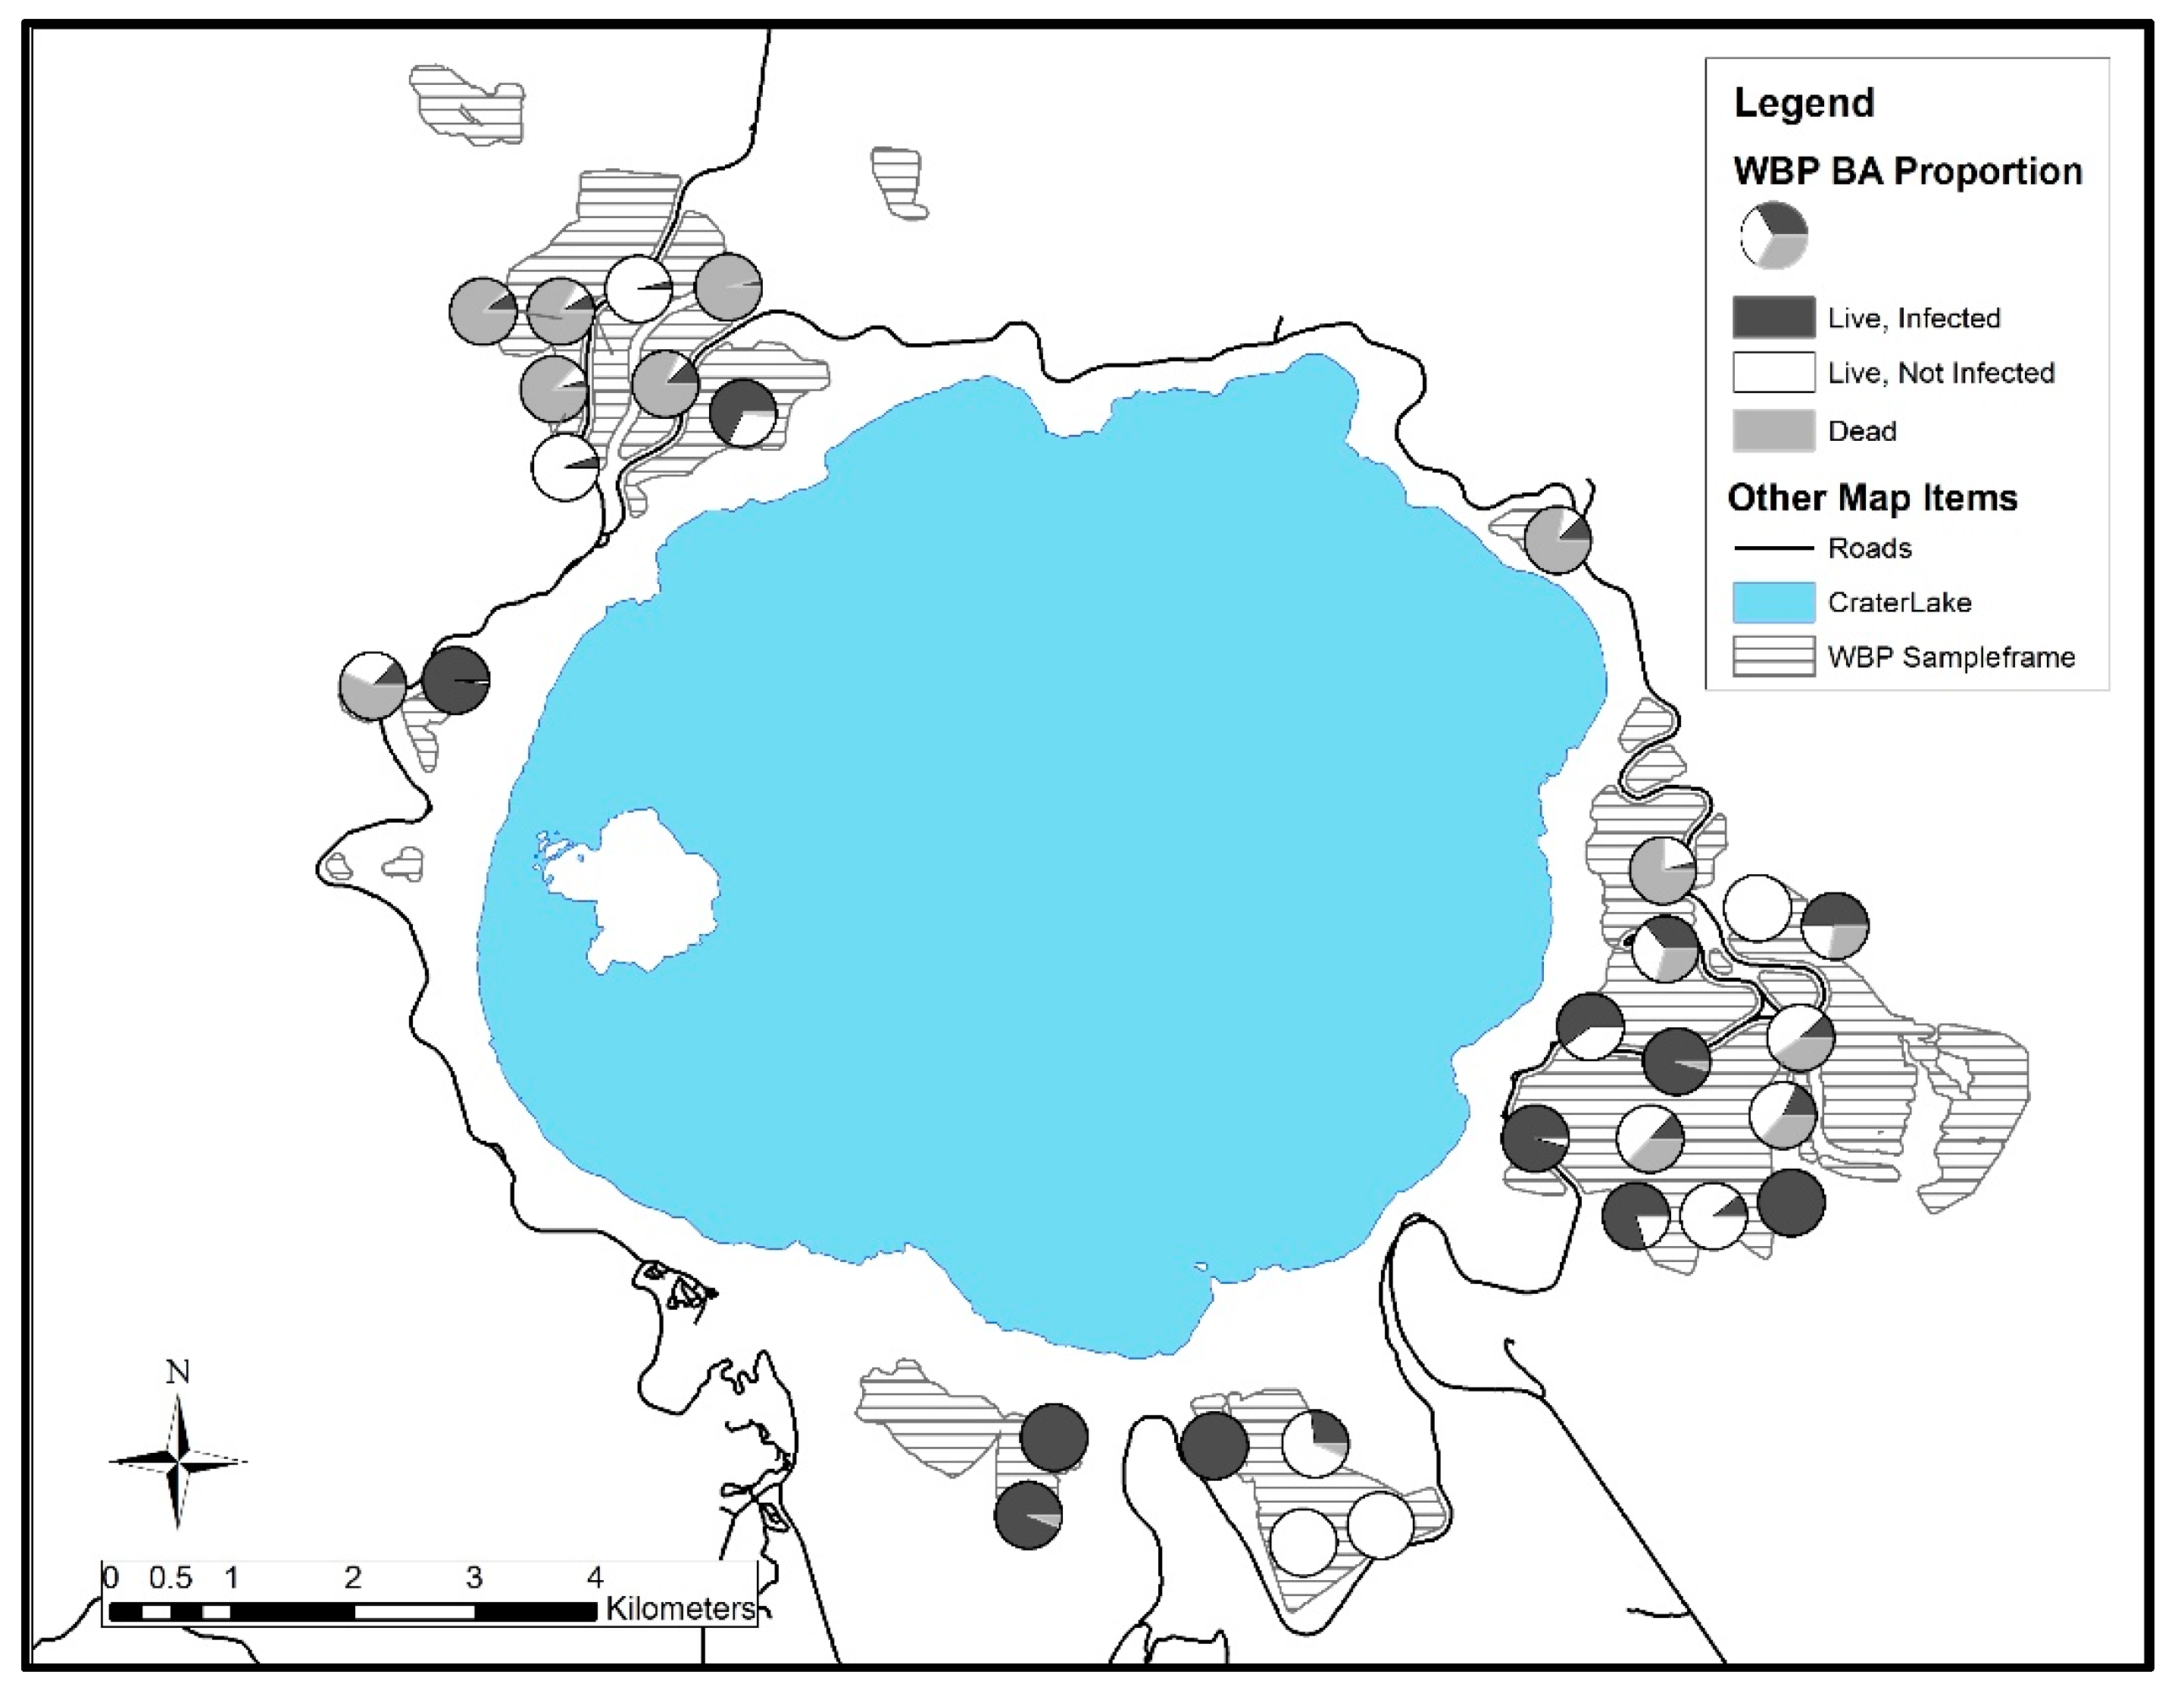
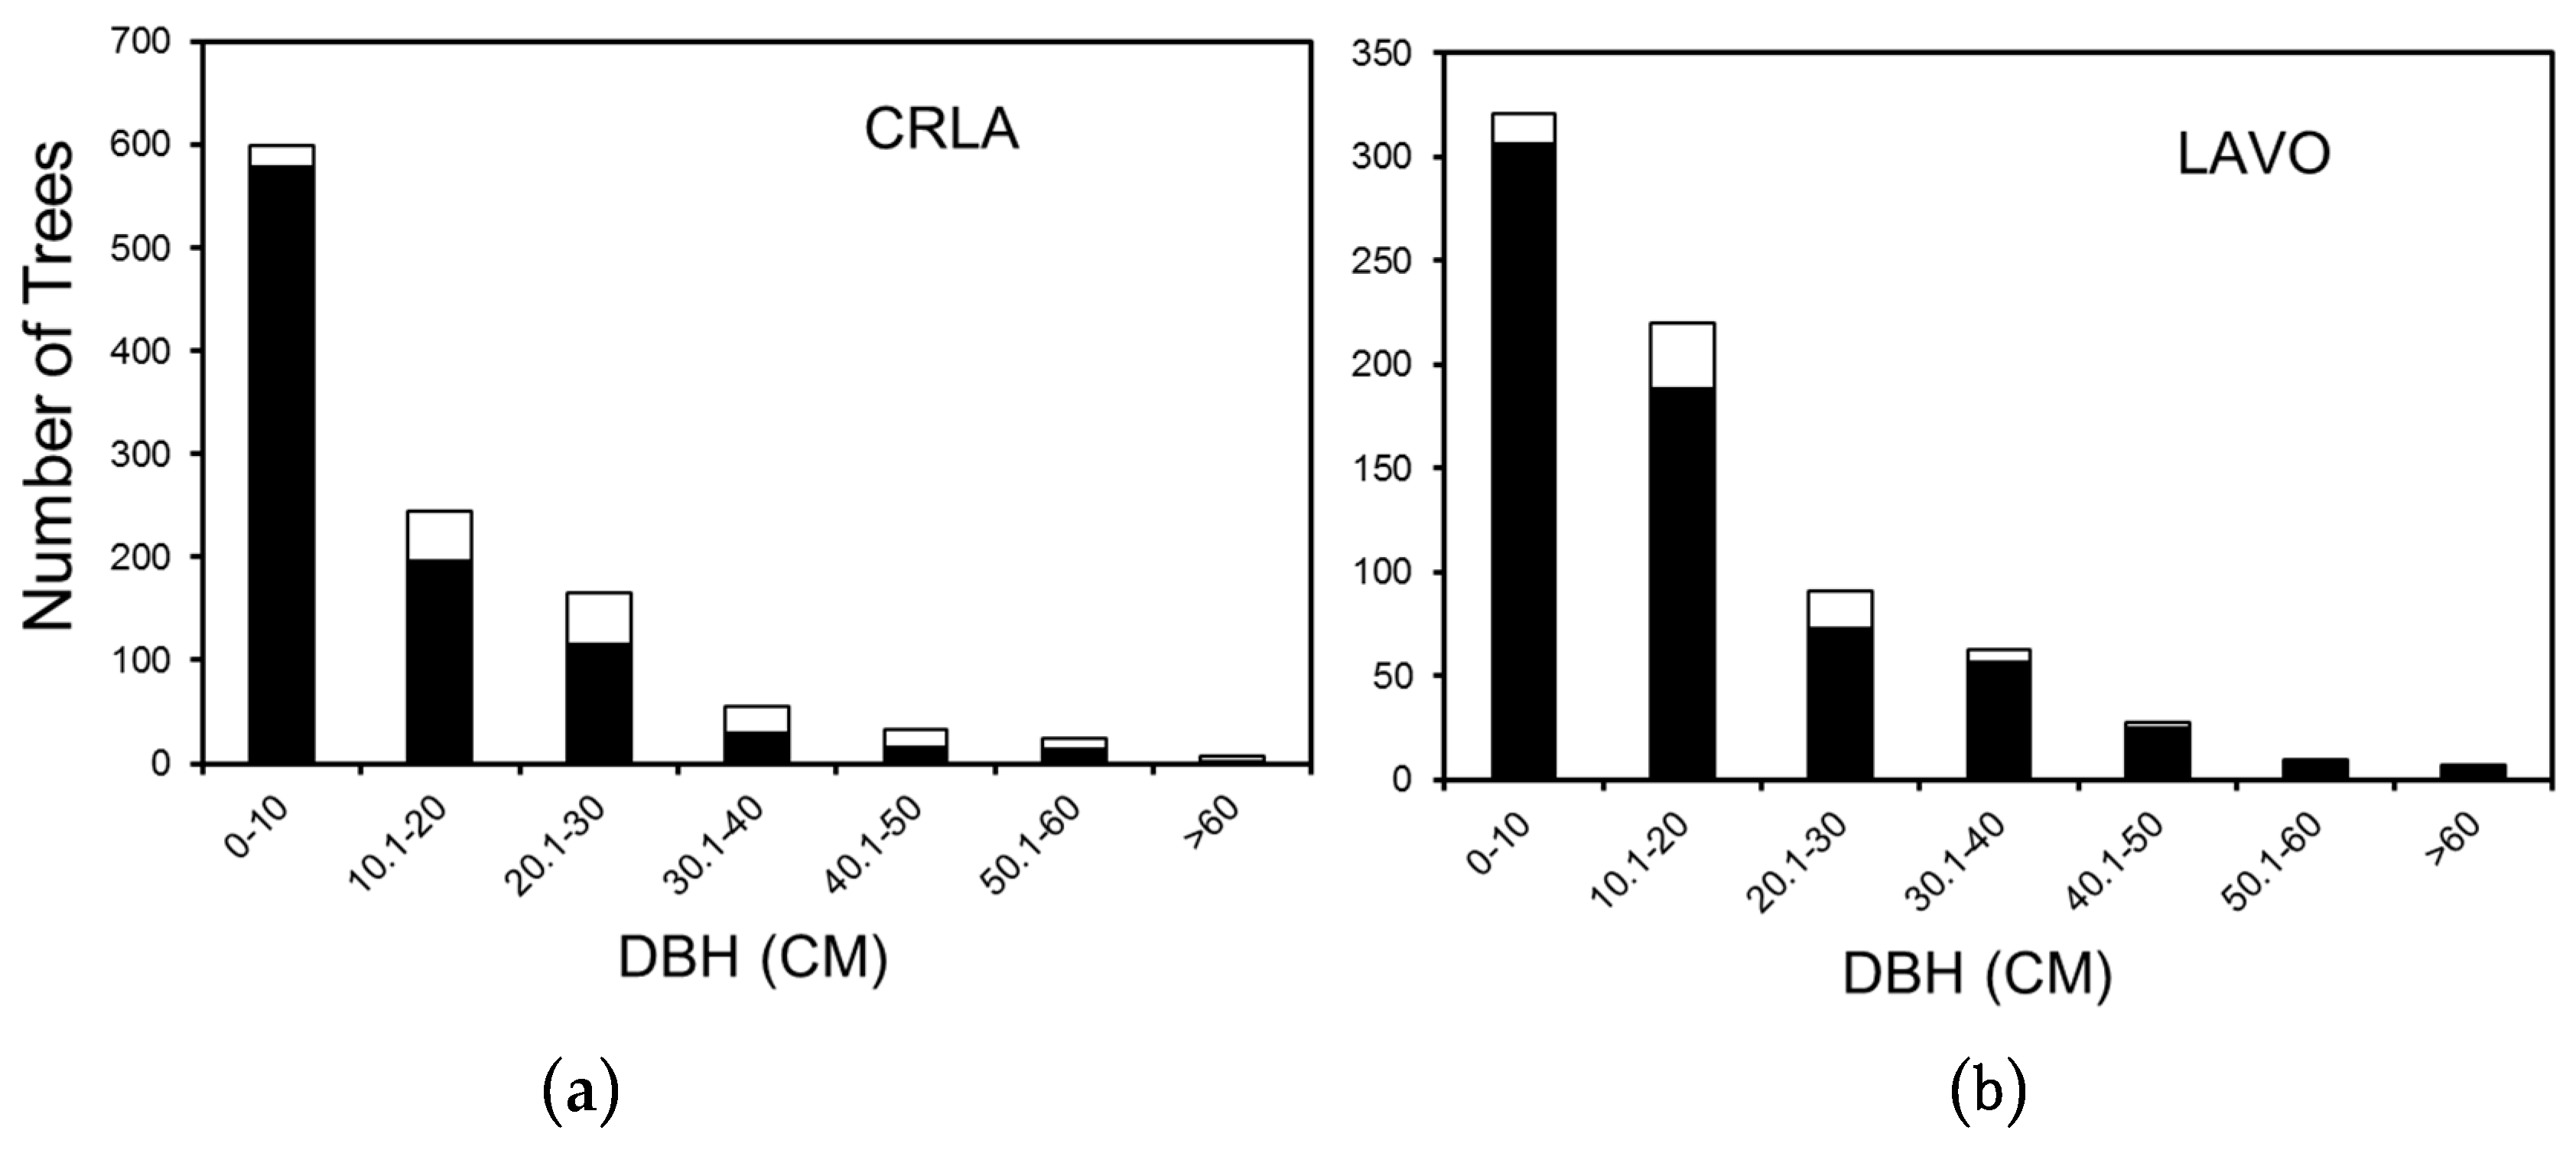
3.1. Crater Lake National Park

A total of 3637 live trees ≥1.37 m in height were found across the 30 CRLA plots, of which 952 (26%) were whitebark pine, 2344 (64%) were mountain hemlock, 259 (7%) were lodgepole pine (Pinus contorta Douglas ex Loudon var. murrayana (Balf.) Engelm.), 73 (2%) were red fir (Abies magnifica A. Murray bis), three (0.08%) were Englemann spruce (Picea engelmannii Parry ex Engelm), four (0.10%) were subalpine fir (Abies lasiocarpa (Hook.) Nutt.), and two (0.05%) were western white pine (Pinus monticola Douglas ex D. Don), (Table 2, Figure 4). Whitebark pine represented 11% of the total living basal area in the 30 plots, the remaining basal area was comprised of mountain hemlock 82%, lodgepole pine 6%, and red fir 1% (Table 2 and Table 3, Figure 7). We failed to record Dbh values for a few trees or we recorded erroneously large values (~16 trees, 1.7% of whitebark pine), and these were left out of analyses that included dbh. On average, 16% of whitebark pine individuals ≥1.37 m in height were dead, and 26% of the total whitebark pine basal area was dead (Table 2, Figure 7). Most living whitebark pines were small, with only 3% of trees being >40 cm dbh (Figure 4), but which represented 33% of the total basal area of living whitebark pine. A total of 34 seedlings were found in the 30 CRLA plots (Figure 5). Seedlings are only assessed in regeneration plots, which cover 81 m2 in each plot. Mean values of whitebark pines with female cones per plot are shown in Figure 6, cones were found at 50% of the plots.
The incidence of infection of whitebark pine by blister rust in CRLA ranged from 0.0% to 100% of trees per plot, and the average rate of infection among plots was 51% (Figure 8). Of the 952 live trees assessed, 443 showed signs of infection. Of the 177 dead trees that could be identified as whitebark pine in CRLA, 40 (23%) showed evidence of mountain pine beetle, and 28 (16%) had signs of blister rust cankers. Forty (22%) trees also showed evidence of bark beetles other than mountain pine beetle, and one (1%) appeared to have died from mechanical damage. We did not observe symptoms of any specific mortality agent in the remaining 67 (38%) dead whitebark pine.
The probability of blister rust occurrence on individual trees in CRLA increased with both tree size (Dbh, cm) (β = 0.372, 95% CI = 0.203 to 0.540, Table 4) and average yearly climate water deficit (β = 0.596, 95% CI = 0.101 to 1.091, Table 4). The model predicting the incidence of blister rust provided moderate discrimination and correctly classified 68% of all observed cases of blister rust (AUC = 0.756, error rate = 0.318). The R2GLMMm and R2GLMMc for this model were 0.131 and 0.394, respectively. The probability of observing mountain pine beetle infestation increased with the previous infection by blister rust (β = 2.359, 95% CI = 0.881 to 3.387, Table 4). The model correctly classified 97.5% of all observed cases of mountain pine beetle and provided moderate discrimination (AUC = 0.797, error rate = 0.0242). The R2GLMMm and R2GLMMc for this model were both 0.372. The probability of observing cones decreased with increases in the basal area of other species (β = −1.24, 95% CI = −2.123 to 0.362, Table 4) and increased with tree size (Dbh, cm) (β = 1.425, 95% CI = 1.128 to 1.721, Table 4) and average yearly climate water deficit (β = 0.717, 95% CI = −0.086 to 1.521, Table 4). The final model correctly classified 90.8% of all observed cases (AUC = 0.906, error rate = 0.091). The R2GLMMm and R2GLMMc for this model were 0.423 and 0.605, respectively. The proportion of average canopy killed increased with tree size (β = 0.243, 95% CI = 0.182 to 0.304, Table 4), the basal area of other species (β = 0.185, 95% CI = 0.061 to 0.310, Table 4), and the basal area of whitebark pine (β = 0.303, 95% CI = 0.092 to 0.515, Table 4). Average canopy kill was also higher on trees with current or past blister rust infection (β = 0.228, 95% CI = 0.104 to 0.351, Table 4) and on trees with mountain pine beetle infestation (β = 0.433, 95% CI = 0.083 to 0.782, Table 4). The beta dispersion parameter for this model was found to be 4.6123 (standard error = 0.20376) and pseudo R2 was 0.16.

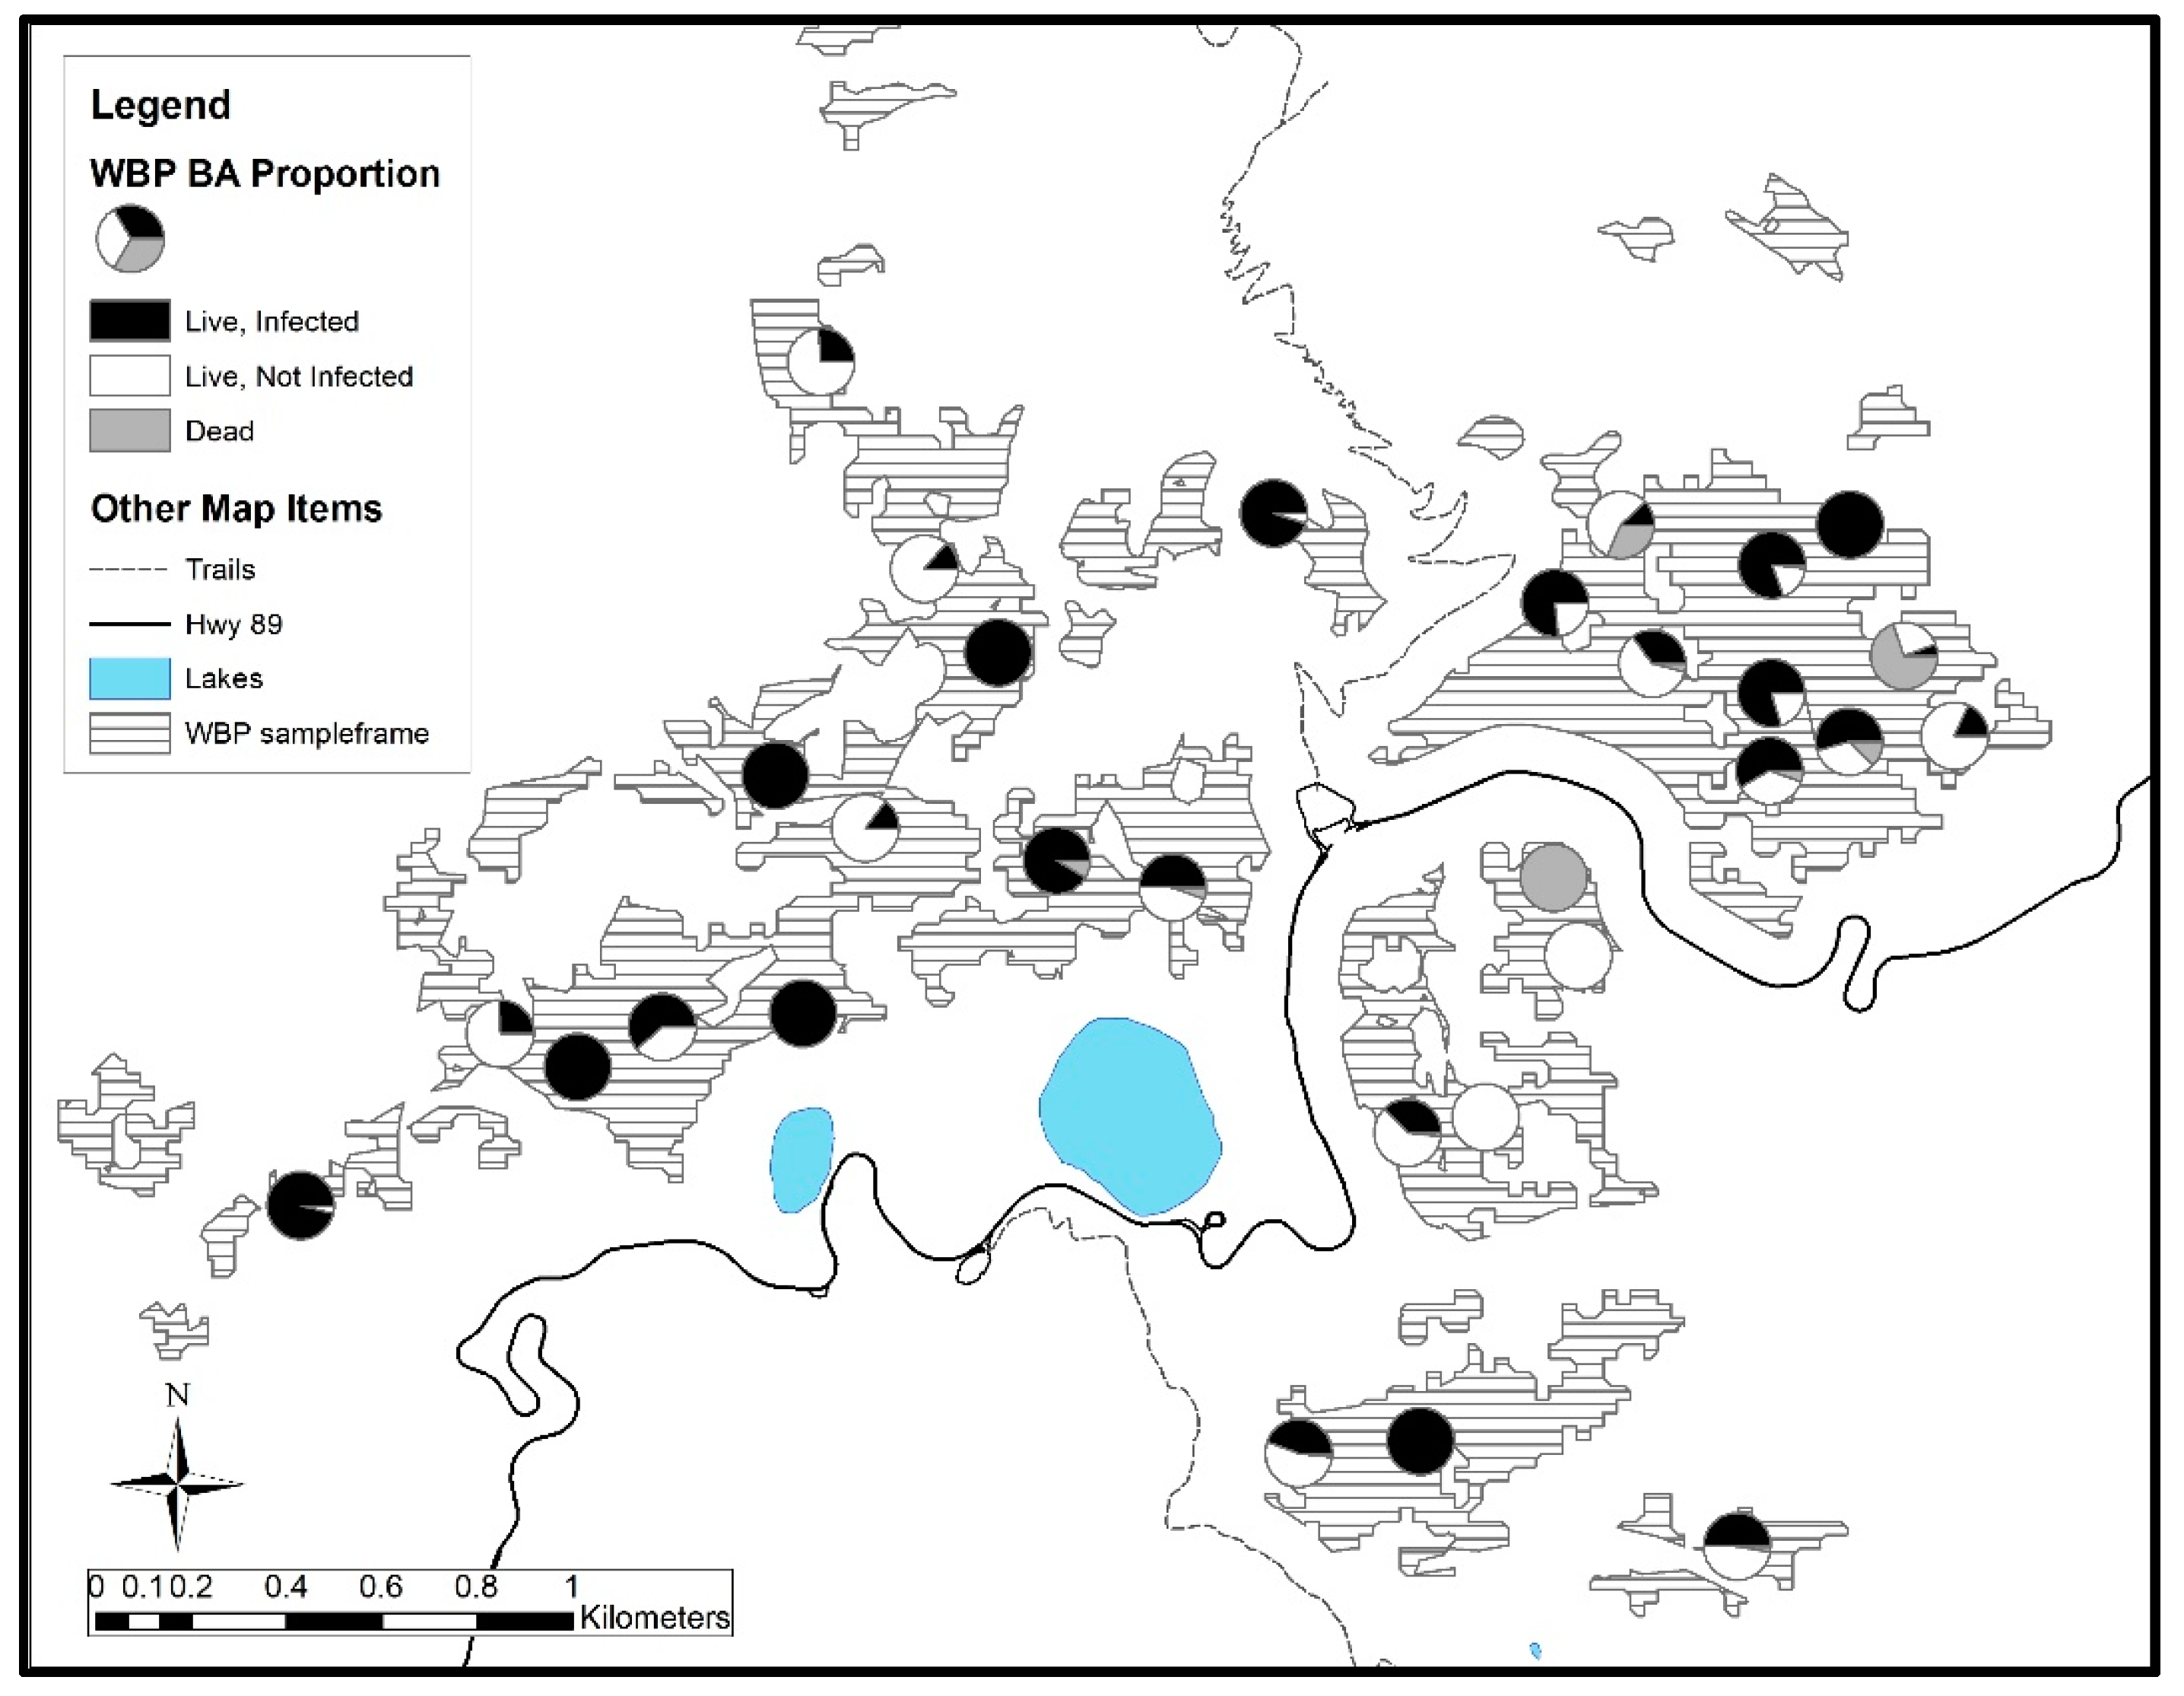
3.2. Lassen Volcanic National Park

In LAVO, a total of 4,647 live trees ≥1.37 m in height were found across the 30 plots, of which 657 (14%) were whitebark pine, 3944 (85%) were mountain hemlock, 43 (0.9%) were red fir, and one (0.02%) was lodgepole pine (Table 2, Figure 4). Western white pine is another host of blister rust, and a single western white pine (0.02%) was found on a LAVO plot. Living whitebark pine represented 16% of the total basal area in the LAVO plots, while the most basal area in the plots was from other species (Table 2 and Table 3, Figure 7). Mountain hemlock represented 83%, and red fir represented 1% of living basal area. As with the CRLA data, dbh for a few trees (20; 3% of whitebark pine) were removed due to suspect values or lack of species identification and were not included in the basal area estimates. On average, 10% of whitebark pine individuals ≥1.37 m in height were dead, and <1% of the total whitebark pine basal area was dead (Table 2, Figure 7). Most living whitebark pines were small, with only 7.5% of trees measuring >40 cm Dbh (Figure 4). A total of six seedlings were found in the 30 LAVO plots (i.e., 25 seedlings/ha, Figure 5). Plots at LAVO had a mean value of nearly 8 whitebark pine trees with cones present, while CRLA had just under 4 (Figure 6).
In LAVO, the incidence of infection of whitebark pine by blister rust ranged from 0.0% to 100% of whitebark pine per plot, and the average rate of infection among plots was 54% (Figure 8). Of the 657 live trees assessed, 316 showed signs of infection. Of the 75 dead trees that could be identified as whitebark pine in LAVO, three (4%) appeared to have died from mountain pine beetle, eight (11%) from blister rust, 14 (19%) from other bark beetles, and 50 (67%) died from unknown causes.
For trees in LAVO, our model indicated that none of the covariates were associated with the probability of observing blister rust on live trees. The model correctly classified 78.9% of observed cases and provided excellent model discrimination (AUC = 0.854, error rate = 0.210). The R2GLMMm and R2GLMMc for this model were 0.063 and 0.504, respectively. The probability of observing cones increased with tree size (Dbh, cm) (β = 1.087, 95% CI = 0.849 to 1.325, Table 5) and decreased with increases in the basal area of other species (β = −0.325, 95% CI = −0.672 to 0.022, Table 5). The final model correctly classified 76% of all observed cases of cone production (AUC = 0.826, error rate = 0.233). The R2GLMMm and R2GLMMc for this model were 0.267 and 0.349, respectively. The proportion of average canopy killed decreased with increases in average yearly climate water deficit (β = −0.232, 95% CI = −0.441 to −0.023, Table 5). The proportion of average canopy killed increased for trees with current or past blister rust infection (β = 0.464, 95% CI = 0.293 to 0.635, Table 5) and for trees with mountain pine beetle infestation (β = 0.509, 95% CI = −0.011 to 1.030, Table 5). The beta dispersion parameter for this model was calculated at 4.832 (standard error = 0.26145) and pseudo R2 was 0.15.
We chose not to model the incidence of the mountain pine beetle in LAVO because of low sample sizes (total # of infested trees = 11). However, of the 11 infested individuals, eight showed signs of blister rust infection. Thus, eight of 316 blister rust-infected trees (2.5%) had mountain pine beetle, while three of 338 uninfected trees (0.89 %) had mountain pine beetle. A chi-square test suggests there may be association between blister rust infection and mountain pine beetle (X2 = 2.579, df = 1.0, p = 0.1082).

4. Discussion

Rates of blister rust infection in LAVO and CRLA were similar between parks with nearly half of all whitebark pine surveyed showing signs of active or inactive infections (Figure 8). We also found that the proportion of dead trees in CRLA (~16%) was slightly greater than in LAVO (~11%). In addition, mountain hemlock was the dominant species in our plots in CRLA and LAVO and was negatively associated with whitebark pine cone production, possibly through increased competition. Our study cannot be used to assess the role of alternate hosts because we do not have complete vegetation data associated with our plots.
We also found strong evidence that blister rust infection, mountain pine beetle infestation, and whitebark pine survivorship and fecundity were influenced by several site and demographic factors. These may help managers focus their efforts on higher risk sites and individual trees. Our results from CRLA match many other studies of the factors influencing the incidence of blister rust, but this was not true in LAVO. In the sections below, we discuss the patterns we found in each park and implications for park management and conservation of whitebark pine. We then discuss the overall implications of our study for understanding the status of whitebark pine in these parks.

4.1. Crater Lake National Park

Blister rust incidence in CRLA was highest in sites with greater values of average yearly Cwd (Table 4), a result which is consistent with previous studies that demonstrated the vulnerability of water-stressed trees to attack by mountain pine beetle and possibly of blister rust infection [54,55]. Climate-induced stressors, directly and indirectly, impact forests, reducing tree fitness through chronic or acute stress, which may predispose trees to insect and pathogen attack [56]. For trees in CRLA the effect of climate (and ultimately blister rust infection) may be more pronounced on the east side of the park. Conditions on the west side of the park are wetter while the east side conditions are generally drier and we found that many plots exhibit the same trend with respect to climate water deficit. Trees in plots on the east side of the park experienced significantly greater levels of climate water deficit over those located on the west side of the park (t = 3.37, d.f. = 28, p = 0.002). Our study found that east side plots are drier and have higher blister rust, but a direct link between these measures has not been established. Trees located in cooler and wetter microclimates with reduced water stress likely have a higher chance for success and these environments are possibly more suitable habitat for whitebark pine in future climate change scenarios [22]. However, this does not account for other variables, such as competitive exclusion, disturbance, phenotypic plasticity, or regional/localized wind patterns distributing spores.
Future climate scenarios are generally warmer and drier with decreased snowfall in the Pacific Northwest [57,58]. Given these projections, the already wetter western half of CRLA is likely to have better widespread climatic conditions for whitebark pine in the future, but competition with competitors (especially mountain hemlock) may negate this advantage. However, while overall the east side is drier, it could be important to identify micro-climate areas [21,22,59] that aren’t already occupied by competitor conifer species such as mountain hemlock where whitebark pine have better odds of persistence. Shannahan et al. [21] suggest targeting sites with low water deficit associated with finer-textured soils, but in less humid settings, these areas should be considered a higher restoration priority [14]. We did not assess soil type at plots, but suggest future efforts take soils into account. Rust-resistant trees from more southerly locations outside of, but adjacent to, the park are also of value as possible genotypes adapted to warmer and drier areas [8]. If climate predictions hold true, these genotypes could be well suited for out-planting in the portions of the park as most likely to sustain healthy whitebark pine populations.
Blister rust was more commonly found on larger whitebark pine in CRLA (Table 4). These patterns match those found in several other studies where larger trees show higher blister rust incidence [3,60,61,62] but contrast with other studies where infection was equally likely to be found in all size classes [10,63,64]. We note that most studies of whitebark pine and blister rust do not assess the relationship of tree size and infection risk, and those that do are hindered by the significant, previous mortality that may obscure the proportion of large trees that are infected.
Mountain pine beetle infestation was more likely to be found in CRLA trees with previous blister rust infection (Table 4). The preferential selection of blister rust-infected trees has been noted in other studies [54,65] and is likely due to beetles preferentially selecting trees weakened by stress. There was weak evidence of this same pattern in LAVO. Identifying the factors associated with tree stressors is essential to identifying and employing restoration strategies. Trees of high conservation value or rust-resistant parent trees can be protected from MBP attack by verbenone application [66], a practice already in use by the park.
Pests and pathogens are important factors influencing tree health. In CRLA, trees with mountain pine beetle infestation and blister rust infection demonstrated significantly higher levels of canopy kill over uninfested or uninfected trees (Table 4 and Table 5), and a comparison of plot-level averages of canopy kill indicates that trees are responding similarly to stressors in both parks (CRLA mean = 0.28 (± 0.14 1.0 SD), LAVO mean = 0.27 (± 0.16 1.0 SD)). In addition, we found that the proportion of average canopy kill was greater for trees in CRLA plots with higher basal area of both whitebark pine and other tree species (Table 4). This may indicate that trees in plots with higher basal area are experiencing higher levels of intraspecific and interspecific competition, which is affecting crown health. The degree to which intraspecific competition affects stand health remains a question, as we also found larger Dbh whitebark pines have more blister rust infection, independent of total site basal area. Even high values of whitebark pine basal area are low compared to high values of mountain hemlock (Table 3). Either way, increases in proportion of canopy kill can reduce the reproductive potential of trees by killing cone-bearing branches [64], which limits seed dispersal [67]. Reductions in canopy have been found to limit the reproductive potential of a tree throughout its life resulting in fewer successful cone crops and limited opportunities for dispersal [64].
Most whitebark pine plots were dominated by mountain hemlock in CRLA. Including both living and dead trees, hemlock represented 61% of the trees and 77% of the basal area, while whitebark pine represented 29% of the trees and 16% of the basal area. Including only living trees, mountain hemlock represented 64% of the trees and 82% of the basal area, while whitebark pine represented 26% of the trees and 11% of the basal area. Beck and Holm [8] and Klamath Network unpublished data suggest that interspecific competition between whitebark pine and shade-tolerant mountain hemlock is substantial (likely much more so than intraspecific), especially along the west side of the caldera. Our study highlights the issues of increased encroachment by mountain hemlock. First, the proportion of cone producing whitebark pine was reduced in plots that had higher levels of basal area of other species, primarily mountain hemlock. Second, mountain hemlock abundance in these sites can be observed at the seedling level, seedlings were considerably more abundant than for any other species within our plots, including whitebark pine (Figure 5). The role of competition, and its relationship with fire exclusion and climate change, is a key consideration for whitebark pine management [3]. Management practices for reducing competition between whitebark pine and mountain hemlock involves fire (natural managed or prescribed) and/or thinning. Siderius and Murray [68] found historic natural fire to be relatively infrequent, of high severity and occurring at a small scale at CRLA. However recent fires have shown that WBP stands have the potential to burn at larger scales during present-day fire seasons than in the past. The opportunity to manage natural fires is more likely today in this forest community if it can be balanced with sociopolitical factors such as air quality, accommodating park visitation, and availability of fire management resources. They note re-introduction of fire (natural or prescribed) should be done with caution, to preserve large healthy whitebark pine trees, this sentiment is echoed and procedures suggested in the CRLA management plan. Without fire, these stands will likely succeed to mountain hemlock dominance [20], but there can be situations where fire is not the best tool for reducing competition, in these cases manual thinning is recommended [8]. Mechanical thinning or daylighting around suppressed whitebark pine trees has been shown to increase radial growth rates. However, there may be a 10–15-year lag before diameter growth commences [69]. Larger-diameter whitebark pine has shown a greater response to thinning treatments than smaller-diameter trees. This ‘release’ may increase cone production in thinned stands [69].

4.2. Lassen Volcanic National Park

Blister rust incidence was surprisingly high, with an average rate of infection among plots of 54% (Figure 8). Although we are not aware of any studies of blister rust in LAVO, several biologists suggested little blister rust had been observed in the park prior to this work. Our study shows clearly that blister rust is well-established in LAVO, but the duration of occurrence is unknown. In contrast, the record of blister rust in CRLA is quite robust, and we are certain it has been in CRLA since at least 1936 [8]. Interestingly, a study by Kauffmann et al. [70] indicated that among five areas surveyed in the surrounding Lassen National Forest blister rust incidence was quite variable. Three of the five sites in that study were infected (70%, 14%, and 13%), while the other two showed no infection. Unlike CRLA, LAVO does not yet have a formal conservation plan, due, in part, to the large percentage of the whitebark pine distribution within the park that is found in designated wilderness. Restoration and conservation efforts are much more complicated in a wilderness setting, as management interventions are constrained due to legislation (Wilderness Act of 1964) aimed at the preservation of natural conditions that seek to leave the area untrammeled and free of human manipulation. This restriction does not prevent restoration activities. However, any suggested ecological interventions would require a deliberate analysis process using a Minimum Requirement Decision Guide, to determine if an activity is necessary and how such activities might impact wilderness character [71]. Within wilderness, any of the management recommendations described for LAVO would be subject to this analysis. As nearly 48% of whitebark pines range is within the designated wilderness, restoration efforts in wilderness need to be considered to maintain region-wide and local conservation goals [14].
At LAVO, managers are presently working to establish the phylogeography and genetic structure of the populations found in the park and on adjacent US Forest Service sites to the north of the park. Once this is better understood, the precise conservation value of the population can be better understood. In particular, the populations at LAVO are disjunct islands from other nearby populations, suggesting some genetic variability exists in the population but also heightening its vulnerability to extinction [72]. Conservation concern would be further heightened for this island population because it sits at the junction between the Sierra Nevada, Cascades, and Great Basin ecoregions. Once the uniqueness of this population is ascertained, it might provide managers with further incentive to explore the exact parameters of ecological intervention in the wilderness. Whether this would result in active management and restoration actions, would depend in large part upon the importance of the population relative to other nearby populations, as well as what value the population might hold for rust resistance.
In LAVO, strong relationships relating environmental variables to whitebark structure or condition were not found (Table 5). Unlike CRLA, we suspect that the simple relationship of arid east-side slopes may be more complicated in LAVO. Also, the whitebark pine sampling area was much smaller in LAVO as compared with CRLA (Figure 1 and Figure 2). In CRLA, the large caldera separates stands of whitebark pine on all sides of the lake, while the LAVO stands are restricted to a small area, near Lassen Peak, that does not have an easily modeled environmental gradient.
Although we were unable to run similar models predicting mountain pine beetle incidence in LAVO because of low sample sizes, we found that eight of the 11 trees infested with mountain pine beetle, were also infected with blister rust. We believe that differences in infestation rates between LAVO and CRLA are influenced by differences in proximity to alternate beetle hosts and differences in the mosaic of whitebark pine stands across the landscape. Within our sampling frame, whitebark pine is represented in fewer numbers and is found in sparser stands in LAVO, compared to the dense, homogenous stands present at CRLA. Furthermore, we found greater numbers of alternate host trees in CRLA than were present in LAVO. Perhaps whitebark pines in LAVO have, so far, been buffered from mountain pine beetle attacks because tree densities do not support mountain pine beetle outbreaks, or mountain pine beetles have not yet moved out of lower elevation lodgepole pine forests to whitebark pines found at higher elevations which may be due in part to the intense climatic conditions found in and around Lassen Peak. However, with continued warming trends, we expect that mountain pine beetles will continue to move upward in elevation and more whitebark pine will fall prey to mountain pine beetle infestation [9,73]. Furthermore, given that the rate of blister rust incidence in LAVO is comparable to CRLA (where we found associations between mountain pine beetle and blister rust), whitebark pine in LAVO may be increasingly susceptible to mountain pine beetle infestation and mortality in the future. Use of verbenone on large whitebark pine trees that do not show signs of blister rust (and may have some level of resistance), is recommended as a conservation step. Similar to our findings for trees in CRLA, our model indicated that the proportion of average canopy kill was greater for trees experiencing mountain pine beetle infestation or blister rust infection.
We also found some evidence that the basal area of other species was negatively associated with the probability of producing cones, similar to trees in CRLA (Table 5). McCaughey and Tomback [74] found that unsuppressed trees produce large, full crowns with cones, and we suspect that competition for light with mountain hemlock may be a factor limiting cone production. We also observed more cone-bearing trees in LAVO (33%) than in CRLA (10%). Despite these differences, we observed lower whitebark pine regeneration in LAVO (Figure 5). We hypothesize the low whitebark pine regeneration is tied to factors regarding seedling survival over cone and seed production or interspecific competition. Mountain hemlock seedlings were numerous at LAVO, even more so than at CRLA. Unfortunately, given so few seedlings, we were unable to associate whitebark pine regeneration to topographical and climatic variables. As with CRLA, reducing competition (fire or thinning) between mountain hemlock and whitebark pine appears important to long term conservation efforts in LAVO.

4.3. Regional Patterns

In general, we found that the incidence of blister rust infection was nearly equal between CRLA and LAVO. We consider the larger regional context of both parks. While we treat parks as separate data sets here, we plan future efforts to examine data by fitting a model to the pooled data from both parks. The initial introduction of blister rust into western North America in 1910 in Vancouver, British Columbia, and spread of the disease along the Cascades occurred quite rapidly [6]. The moist conditions and ample hosts have led to variable but high infection rates in the Cascades Range of Oregon and Washington [10,55,60]. Less is known about blister rust in the southern portion of the Cascades and in the rest of California. In an analysis of blister rust infection rates on five-needle pines in high-elevation sites of California, Maloney [75] found a significant positive relationship of latitude with infection, many sites in southern California, including national parks [76], have very low blister rust infection rates.
Mountain pine beetle dynamics were different between CRLA and LAVO, and several reasons might explain this difference. Mountain pine beetle activity has increased markedly near and in CRLA since 2008 presumably because of extended dry seasons and warmer temperatures [77,78]. The same high levels of mountain pine beetle activity have been observed in a small number of whitebark pine stands of eastern California where pronounced mortality was observed [9,79]. Interestingly, these eastern California sites have no blister rust infections. Very little is known about mountain pine beetle activity in LAVO, but they are observed within the park on lodgepole pine [80].

5. Conclusions

Our study provides a baseline assessment of whitebark pine populations in CRLA and LAVO and may also provide some insight into the future of whitebark pine demographics in the southern Cascades. Roughly 55% of the basal area of whitebark pine was infected with blister rust in both parks. The similarity of infection rates between LAVO and CRLA was somewhat of a surprise given the scarcity of previous observations in LAVO. The level of blister rust infection at both parks emphasizes the importance of promoting rust resistance as a valuable conservation objective. We observed far more standing dead trees and basal area of dead trees in CRLA than in LAVO (Table 2), and this may be in part due to higher mountain pine beetle activity in CRLA since 2007. In both parks, the presence of mountain pine beetle and blister rust was associated with increased canopy kill for whitebark pine. Given that we observed mountain pine beetles at both parks, the use of verbenone to protect high-value trees should continue to be considered as a means to protect genetic resources and protect declining seed sources. Both parks have large components of mountain hemlock within the subalpine zone. In areas where disturbances such as fire are suppressed or limited, mountain hemlock encroachment can reduce whitebark pine growth and recruitment. We found that higher densities of mountain hemlock were associated with decreased numbers of cone producing whitebark pine. Reduction of interspecific competition through restoration treatments is a good option to consider, as natural fires are challenging to manage and could result in stand replacing high severity burns. In CRLA, water stress was a good predictor of blister rust infection. The relationship between water stress and blister rust infection may be influenced by other factors and should be further researched, especially as sites with limited water stress could be a higher priority for restoration efforts. Careful management, informed by results of monitoring, will be an essential part of conserving and restoring whitebark pine trees and habitat.

Author Contributions

J.I.J. performed fieldwork, data analysis, and writing; S.B.S. contributed to fieldwork, data management, and review and revision of draft manuscript; J.C.B.N. contributed to conceptual design, study design, sampling procedures, and selection of analytical approach, data management, review and revision of draft manuscript; L.A.S. contributed to the initial analysis and manuscript revisions; E.S.J. contributed writing, and revision and review of draft manuscript; J.S.H contributed to manuscript revisions. S.B. contributed to manuscript revisions. J.I.J. and E.S.J. wrote the paper.

Funding

Funding for this work was provided by the National Park Service (Task Agreement No. P12AC10931, Contract for Services Order # P15PX04316).

Acknowledgments

We are grateful to the following people for help with fieldwork: Alex Borst, Emily DeStigter, Kelsey Guest, Kasey Graue, David McLean, Rachel Patton, and April Sahara. Sean Mohren provided critical support with the database we used to archive data. Jen Beck and Elena Thomas in Crater Lake National Park, and Mike Magnuson in Lassen Volcanic National Park, helped us understand the whitebark pine system and provided us with logistical support throughout the study. Alice Chung-MacCoubrey and Devin Stucki provided useful feedback on earlier versions of this report. This report is dedicated to Daniel A. Sarr (1964–2015). Daniel was the first Klamath Network Inventory and Monitoring Program Manager. He served as Manager for 13 years and one of his many contributions was initiating a robust program aimed at assessing threats to five-needle pine. ecosystems.

Conflicts of Interest

Any use of trade, firm, or product names is for descriptive purposes only and does not imply endorsement by the U.S. Government.

References

  1. Tomback, D.F.; Achuff, P. Blister rust and western forest biodiversity: Ecology, values, and outlook for white pines. For. Pathol. 2010, 40, 186–225. [Google Scholar] [CrossRef]
  2. Ellison, A.M.; Bank, M.S.; Clinton, B.D.; Colburn, E.A.; Elliott, K.; Ford, C.R.; Foster, D.R.; Kloeppel, B.D.; Knoepp, J.D.; Lovett, G.M.; et al. Loss of foundation species: consequences for the structure and dynamics of forested ecosystems. Front. Ecol. Environ. 2005, 3, 479–486. [Google Scholar] [CrossRef]
  3. Keane, R.E.; Tomback, D.F.; Aubry, C.A.; Bower, A.D.; Campbell, E.M.; Cripps, C.L.; Jenkins, M.B.; Mahalovich, M.F.; Manning, M.; McKinney, S.T.; et al. A Range-wide Restoration Strategy for Whitebark Pine (Pinus albicaulis); Gen. Tech. Rep. RMRS-GTR-279; U.S. Department of Agriculture, Forest Service, Rocky Mountain Research Station: Fort Collins, CO, USA, 2012; p. 118.
  4. Tomback, D.F. Dispersal of whitebark pine seeds by Clark’s nutcracker: A mutualism hypothesis. J. Anim. Ecol. 1982, 51, 451–467. [Google Scholar] [CrossRef]
  5. Barringer, L.E.; Tomback, D.F.; Wunder, W.B. The Relationship Between whitebark pine health, cone production, and nutcracker occurrence across four National parks. In The future of high-Elevation, Five-Needle White Pines in Western North America: Proceedings of the High Five Symposium, Missoula, MT USA 28-30 June 2010; Keane, R.E., Tomback, D.F., Murray, M.P., Eds.; U.S. Department of Agriculture, Forest Service, Rocky Mountain Research Station RMRS-P-63: Fort Collins, CO, USA, 2010; pp. 45–46. [Google Scholar]
  6. McDonald, G.I.; Hoff, R.J. Blister rust: An introduced plague. In Whitebark Pine Communities: Ecology and Restoration; Tomback, D.F., Arno, S.F., Keane, R.E., Eds.; Island Press: Washington, DC, USA, 2001; pp. 193–220. [Google Scholar]
  7. McDonald, G.I.; Richardson, B.A.; Zambino, P.J.; Klopfenstein, N.B.; Kim, M.S. Pedicularis and Castilleja are natural hosts of Cronartium ribicola in North America: A first report. For. Pathol. 2006, 36, 73–82. [Google Scholar] [CrossRef]
  8. Beck, J.S.; Holm, G.W. Crater Lake National Park Whitebark Pine Conservation Plan; Crater Lake, OR, USA, Unpublished Report; 2014. [Google Scholar]
  9. Millar, C.I.; Westfall, R.D.; Delany, D.L.; Bokach, M.J.; Flint, A.L.; Flint, L.E. Forest mortality in high-elevation whitebark pine (Pinus albicaulis) forests of eastern California, USA; influence of environmental context, bark beetles, climatic water deficit, and warming. Can. J. For. Res. 2012, 42, 749–765. [Google Scholar] [CrossRef]
  10. Goheen, E.M.; Goheen, D.J.; Marshall, K.; Danchok, R.S.; Petrick, J.A.; White, D.E. The Status of Whitebark Pine along the Pacific Crest National Scenic Trail on the Umpqua National Forest; U.S. Department Agriculture, Forest Service, Pacific Northwest Research Station: Portland, OR, USA, 2002; p. 21.
  11. Murray, M.P.; Rasmussen, M.C. Non-native blister rust disease on whitebark pine at Crater Lake National Park. Northwest Sci. 2003, 77, 87–90. [Google Scholar]
  12. Murray, M. Will whitebark pine not fade away? Insight from CRLA National Park (2003–2009). Park Sci. 2010, 27, 64–67. [Google Scholar]
  13. Smith, S.B.; Odion, D.C.; Sarr, D.A.; Irvine, K.M. Monitoring direct and indirect climate effects on whitebark pine ecosystems at CRLA National Park. Park Sci. 2011, 28, 82–84. [Google Scholar]
  14. Keane, R.E.; Holsinger, L.M.; Mahalovich, M.F.; Tomback, D.F. Restoring Whitebark Pine Ecosystems in the Face of Climate Change; Gen. Tech. Rep. RMRS-GTR-361; U.S. Department of Agriculture, Forest Service, Rocky Mountain Research Station: Fort Collins, CO, USA, 2017; p. 123.
  15. Aubry, C.; Goheen, D.; Shoal, R.; Ohlson, T.; Lorenz, T.; Bower, A.; Mehmel, C.; Sniezko, R. Whitebark Pine Restoration Strategy for the Pacific Northwest Region: 2009–2013, Region 6 Report; USDA Forest Service, Pacific Northwest Region: Portland, Oregon, USA, 2008; pp. 1–96.
  16. Sniezko, R.A.; Mahalovich, M.F.; Schoettle, A.W.; Vogler, D.R. Past and current investigations of the genetic resistance to Cronartium ribicola. In The Future of High-elevation, Five-needle White Pines in Western North America: Proceedings of the High Five Symposium, Missoula, MT USA 28-30 June 2010; Keane, R.E., Tomback, D.F., Murray, M.P., Smith, C.M., Eds.; U.S. Department of Agriculture, Forest Service, Rocky Mountain Research Station RMRS-P-63: Fort Collins, CO, USA, 2011; pp. 246–264. [Google Scholar]
  17. Sniezko, R.A.; Kegley, A.J. Whitebark Pine Blister Rust Screening and Experimental Restoration at Crater Lake National Park: March 2012 Update; Dorena, OR, USA, Unpublished Report; 2012. [Google Scholar]
  18. Bentz, B.J.; Kegley, S.; Gibson, K.; Their, R. A test of high-dose verbenone for stand-level protection of lodgepole and whitebark pine from mountain pine beetle (Coleoptera: Curculionidae: Scolytinae) attacks. J. Econ. Entomol. 2005, 98, 1614–1621. [Google Scholar] [CrossRef]
  19. Kegley, S.; Gibson, K. Protecting Whitebark Pine Trees from Mountain Pine Beetle Attack Using Verbenone; Forest Health Protection Report 04-8; Department of Agriculture, Forest Service, Northern Region: Missoula, MT, USA, 2004.
  20. Arno, S.F. Community types and natural disturbance processes. In Whitebark Pine Communities: Ecology and Restoration; Tomback, D.F., Arno, S.F., Keane, R.E., Eds.; Island Press: Washington, DC, USA, 2001; pp. 74–88. [Google Scholar]
  21. Shannahan, E.; Irvine, K.M.; Thoma, D.; Wilmoth, S.; Ray, A.; Legg, K.; Shovic, H. Whitebark pine mortality related to white pine blister rust, mountain pine beetle outbreak, and water availability. Ecosphere 2016, 7, 1–18. [Google Scholar] [CrossRef]
  22. Chang, T.; Hansen, A.J.; Piekielek, N. Patterns and variability of project bioclimatic habitat for Pinus albicaulis in the Greater Yellowstone Area. PLoS ONE 2014, 9, e111669. [Google Scholar] [CrossRef] [PubMed]
  23. Diggins, C.; Fulé, P.Z.; Kaye, J.P.; Covington, W.W. Future climate affects management strategies for maintaining forest restoration treatments. Int. J. Wildland Fire 2010, 19, 903–913. [Google Scholar] [CrossRef]
  24. McKinney, S.T.; Rodhouse, T.; Chow, L.; Chung-Mac Coubrey, A.; Dicus, G.; Garrett, L.; Irvine, K.; Mohren, S.; Odion, D.; Sarr, D.; et al. Monitoring White Pine (Pinus albicaulis, P. balfouriana, P. flexilis) Community Dynamics in the Pacific West Region—Klamath, Sierra Nevada, and Upper Columbia Basin Networks: Narrative Version 1.0; Natural Resource Report NPS/PWR/–2012/532; National Park Service: Fort Collins, CO, USA, 2012.
  25. Stevens, D.L.; Olsen, A.R. Spatially balanced sampling of natural resources. J. Am. Stat. Assoc. 2004, 99, 262–278. [Google Scholar] [CrossRef]
  26. Daly, C.; Neilson, R.P.; Phillips, D.L. A statistical-topographic model for mapping climatological precipitation over mountainous terrain. J. Appl. Meteorol. 1994, 33, 140–158. [Google Scholar] [CrossRef]
  27. Daly, C.; Taylor, G.H.; Gibson, W.P.; Parzybok, T.W.; Johnson, G.L.; Pasteris, P.A. High-quality spatial climate data sets for the United States and beyond. Trans. ASAE 2000, 43, 1957–1962. [Google Scholar] [CrossRef]
  28. Daly, C.; Gibson, W.P.; Taylor, G.H.; Johnson, G.L.; Pasteris, P. A knowledge-based approach to the statistical mapping of climate. Clim. Res. 2002, 22(2), 99–113. [Google Scholar] [CrossRef] [Green Version]
  29. PRISM Climate Group. Available online: http://prism.oregonstate.edu (accessed on 4 February 2014).
  30. Soil Survey Staff. Natural Resources Conservation Service, United States Department of Agriculture. Web Soil Survey, 2016. Available online: http://websoilsurvey.nrcs.usda.gov/ (accessed on 6 January 2016).
  31. Thornthwaite, C.W. An approachtowards a rational classification of climate. Geogr. Rev. 1948, 38, 55–102. [Google Scholar] [CrossRef]
  32. Thornthwaite, C.W.; Mather, J.R. The water balance. Publicat. Climatol. 1955, 8, 1–104. [Google Scholar]
  33. Hamon, W.R. Computation of direct runoff amounts from storm rainfall. Int. Assoc. Sci. Hydrol. 1963, 63, 52–62. [Google Scholar]
  34. Willmott, C.T.; Rowe, C.M.; Mintz, Y. Climatology of the terrestrial seasonal water cycle. Int. J. Climatol. 1985, 5(6), 589–606. [Google Scholar] [CrossRef]
  35. Dingman, S.L. Physical Hydrology; Prentice Hall: Upper Saddle River, NJ, USA, 2002; pp. 272–325. [Google Scholar]
  36. Vorosmarty, C.J.; Federer, C.A.; Schloss, A.L. Evaporation functions compared on US watersheds: Possible implications for global-scale water balance and terrestrial ecosystem modeling. J. Hydrol. 1998, 207, 147–169. [Google Scholar] [CrossRef]
  37. Lutz, J.A.; van Wagtendonk, J.W.; Franklin, J.F. Climatic water deficit, tree species ranges, and climate change in Yosemite National Park. J. Biogeogr. 2010, 37, 936–950. [Google Scholar] [CrossRef]
  38. McCune, B.; Keon, D. Equations for potential annual direct incident radiation and heat load. J. Veg. Sci. 2002, 13, 603–606. [Google Scholar] [CrossRef]
  39. Smithson, M.; Verkuilen, J. A better lemon squeezer? Maximum-Likelihood Regression with beta-distributed dependent variables. Psychol. Methods 2006, 11, 54–71. [Google Scholar] [CrossRef] [PubMed]
  40. Schreuder, H.T.; Gregoire, T.G.; Weyer, J.P. The use of probability and non-probability sampling. Environ. Monit. Assess. 2001, 66, 281–291. [Google Scholar] [CrossRef] [PubMed]
  41. Jules, E.S.; Jackson, J.I.; Smith, S.B.; Nesmith, J.C.B.; Starcevich, L.A.; Sarr, D.A. Whitebark Pine in Crater Lake and Lassen Volcanic National Parks: Initial Assessment of Stand Structure and Condition; Natural Resource Report NPS/KLMN/NRR—2017/1459; National Park Service: Fort Collins, CO, USA, 2017.
  42. Särndal, C.-E.; Swensson, B.; Wretman, J. Model Assisted Survey Sampling; Springer: New York, NY, USA, 1992. [Google Scholar]
  43. Horvitz, D.G.; Thompson, D.T. A generalization of sampling without replacement from a finite universe. J. Am. Stat. Assoc. 1952, 47, 663–685. [Google Scholar] [CrossRef]
  44. Gelman, A. Scaling regression inputs by dividing by two standard deviations. Stat. Med. 2008, 27, 2865–2873. [Google Scholar] [CrossRef] [PubMed]
  45. Saveland, J.M.; Neuenschwander, L.F. A signal detection framework to evaluate models of tree mortality following fire damage. Forest Sci. 1990, 36, 66–76. [Google Scholar]
  46. Hosmer, D.W.; Lemeshow, S. Applied Logistic Regression; John Wiley & Sons: New York, NY, USA, 2000; pp. 160–164. [Google Scholar]
  47. Nakagawa, S.; Schielzeth, H. A general and simple method for obtaining R2 from generalized linear mixed-effects models. Methods Ecol. Evol. 2013, 4, 133–142. [Google Scholar] [CrossRef]
  48. Ferrari, S.; Cribari-Neto, F. Beta regression for modelling rates and proportions. J. Appl. Stat. 2004, 31, 799–815. [Google Scholar] [CrossRef]
  49. Hilbe, J.M. Negative Binomial Regression; Cambridge University Press: New York, USA, 2011; pp. 141–180. ISBN 9780521198158. [Google Scholar]
  50. R Developement Core Team. R: A Language and Environment for Statistical Computing; R Developement Core Team: Vienna, Austria, 2016. [Google Scholar]
  51. Fournier, D.A.; Skaug, H.J.; Ancheta, J.; Ianelli, J.; Magnusson, A.; Maunder, M.N.; Nielsen, A.; Sibert, J. AD Model Builder: Using automatic differentiation for statistical inference of highly parameterized complex nonlinear models. Optim. Methods Softw. 2012, 27, 233–250. [Google Scholar] [CrossRef]
  52. Bates, D.; Maechler, M.; Bolker, B.; Walker, S. Fitting linear mixed-effects models using lme4. J. Stat. Softw. 2015, 67, 1–48. [Google Scholar] [CrossRef]
  53. Zeileis, A.; Kleiber, C.; Jackman, S. Regression models for count data in R. J. Stat. Softw. 2008, 27, 1–25. [Google Scholar] [CrossRef]
  54. Six, D.L.; Adams, J. White pine blister rust severity and selection of individual whitebark pine by the mountain pine beetle (Coleoptera: Curculionidae, Scolytinae). J. Entomol. Sci. 2006, 42, 345–353. [Google Scholar] [CrossRef]
  55. Larson, E.R. Influences of the biophysical environment on blister rust and mountain pine beetle, and their interactions, in whitebark pine forests. J. Biogeogr. 2011, 38, 453–470. [Google Scholar] [CrossRef]
  56. Logan, J.; Powell, J. Ghost forests, global warming, and the mountain pine beetle (Coleoptera: Scolytidae). Am. Entomol. 2001, 47, 160–173. [Google Scholar] [CrossRef]
  57. Mote, P.W.; Salathé, E.P., Jr. Future climate in the Pacific Northwest. Clim. Change 2010, 102. [Google Scholar] [CrossRef]
  58. Bachelet, D.; Johnson, B.R.; Bridgham, S.D.; Dunn, P.V.; Anderson, H.E.; Rogers, B.M. Climate change impacts on western Pacific Northwest prairies and savannas. Northwest Sci. 2011, 85, 411–429. [Google Scholar] [CrossRef]
  59. Dobrowski, S.Z. A climatic basis for microrefugia: the influence of terrain on climate. Glob. Chang. Biol. 2011, 17, 1022–1035. [Google Scholar] [CrossRef]
  60. Campbell, E.M.; Antos, J.A. Distribution and severity of white pine blister rust and mountain pine beetle on whitebark pine in British Columbia. Can. J. For. Res. 2000, 30, 1051–1059. [Google Scholar] [CrossRef]
  61. Smith, J.P.; Hoffman, J.T. Site and stand characteristics related to white pine blister rust in high-elevation forests of southern Idaho and western Wyoming. West. N. Am. Nat. 2001, 61, 409–416. [Google Scholar]
  62. Kearns, H.S.J.; Jacobi, W.R.; Reich, R.M.; Burns, K.S.; Geils, B.W. Risk of white pine blister rust to limber pine in Colorado and Wyoming, USA. For. Path. 2014, 44, 21–38. [Google Scholar] [CrossRef]
  63. Zeglen, S. Whitebark pine and white pine blister rust in British Columbia, Canada. Can. J. For. Res. 2002, 32, 1265–1274. [Google Scholar] [CrossRef]
  64. Smith, C.M.; Wilson, B.; Rasheed, S.; Walker, R.C.; Carolin, T.; Shepherd, B. Whitebark pine and white pine blister rust in the Rocky Mountains of Canada and northern Montana. Can. J. For. Res. 2008, 38, 982–995. [Google Scholar] [CrossRef]
  65. Bockino, N.K.; Tinker, D.B. Interactions of white pine blister rust and mountain pine beetle in whitebark pine ecosystems in the Southern Yellowstone Area. Nat. Area. J. 2012, 32, 31–40. [Google Scholar] [CrossRef]
  66. Perkins, D.L.; Jorgensen, C.L.; Rinelle, M.J. Verbenone Decreases Whitebark Pine Mortality Throughout a Mountain Pine Beetle Outbreak. For. Sci. 2015, 61, 747–752. [Google Scholar] [CrossRef] [Green Version]
  67. McKinney, S.T.; Fiedler, C.E.; Tomback, D.F. Invasive pathogen threatens bird-pine mutualism: Implications for sustaining a high-elevation ecosystem. Ecol. Appl. 2009, 19, 597–607. [Google Scholar] [CrossRef] [PubMed]
  68. Murray, M.P.; Siderius, J. Historic Frequency and Severity of Fire in Whitebark Pine Forests of the Cascade Mountain Range, USA. Forests 2018, 9, 78. [Google Scholar] [CrossRef]
  69. Keane, R.E.; Gray, K.L.; Dickinson, L.J. Whitebark Pine Diameter Growth Response to Removal of Competition; Res. Note RMRS-RN-32; U.S. Department of Agriculture, Forest Service, Rocky Mountain Research Station: Fort Collins, CO, USA, 2007; pp. 1–9.
  70. Kauffmann, M.; Taylor, S.; Sikes, K.; Evens, J. Lassen National Forest: Whitebark Pine Pilot Fieldwork Report; Unpublished report; California Native Plant Society Vegetation Program: Sacramento, CA, USA, 2014. [Google Scholar]
  71. Naficy, C.E.; Keeling, E.G.; Landres, P.; Hessburg, P.F.; Veblen, T.T.; Sala, A. Wilderness in the 21st century: A framework for testing assumptions about ecological intervention in wilderness using a case study of fire ecology in the Rocky Mountains. J. For. 2015, 114, 384–395. [Google Scholar] [CrossRef]
  72. Morgan, P.; Murray, M. Implications for Conservation of Whitebark Pine. In Whitebark Pine Communities: Ecology and Restoration; Tomback, D.F., Arno, S.F., Keane, R.E., Eds.; Island Press: Washington, DC, USA, 2001; pp. 289–309. [Google Scholar]
  73. Weed, A.S.; Bentz, B.J.; Ayres, M.P.; Holmes, T.P. Geographically variable response of Dendroctonus ponderosae to winter warming in the western United States. Landsc. Ecol. 2015, 30, 1075–1093. [Google Scholar] [CrossRef]
  74. McCaughey, W.W.; Tomback, D.F. The natural regeneration process. In Whitebark Pine Communities: Ecology and Restoration; Tomback, D.F., Arno, S.F., Keane, R.E., Eds.; Island Press: Washington, DC, USA, 2001; pp. 105–120. [Google Scholar]
  75. Maloney, P.E. Incidence and distribution of white pine blister rust in the high-elevation forests of California. For. Pathol. 2011, 41, 308–316. [Google Scholar] [CrossRef]
  76. Nesmith, J.C.B.; Wright, M.; Jules, E.S.; McKinney, S.T. Whitebark and Foxtail Pine in Yosemite, Sequoia, and Kings Canyon National Parks: Initial Assessment of Stand Structure and Condition. Forests 2019, 10, 35. [Google Scholar] [CrossRef]
  77. Preisler, H.K.; Hicke, J.A.; Ager, A.A.; Hayes, J.L. Climate and weather influences on spatial temporal patterns of mountain pine beetle populations in Washington and Oregon. Ecology 2012, 93, 2421–2434. [Google Scholar] [CrossRef] [PubMed]
  78. Meigs, G.W.; Kennedy, R.E.; Gray, A.N.; Gregory, M.J. Spatiotemporal dynamics of recent mountain pine beetle and western spruce budworm outbreaks across the Pacific Northwest Region, USA. For. Ecol. Manage. 2015, 339, 71–86. [Google Scholar] [CrossRef] [Green Version]
  79. Meyer, M.; Bulaon, B.; MacKenzie, M.; Safford, H. Mortality structure and regeneration in whitebark pine stands impacted by mountain pine beetle in the southern Sierra Nevada, Can. J. For. Res. 2016, 46, 572–581. [Google Scholar]
  80. Ganz, D.J.; Dahlsten, D.L.; Shea, P.J. The post-burning response of bark beetles to prescribed burning treatments. In Fire, Fuels and Ecological Restoration: Conference Proceedings, Fort Collins, CO, USA, 16–18 April 2002; U.S. Department of Agriculture, Forest Service Rocky Mountain Research Station, RMRS-P-29: Fort Collins, CO, USA, 2003; pp. 143–158. [Google Scholar]
Figure 1. Whitebark pine distribution in the western United States, states within the National Park Service Pacific West Region, and location of Crater Lake National Park and Lassen Volcanic National Park Inset maps show the whitebark pine sampling frames from Crater Lake National Park and Lassen Volcanic National Park.
Forests 10 00834 g001
Figure 2. The whitebark pine sampling frame from Crater Lake National Park. Circular symbols show the 30 plots installed between 2012 and 2014, and each symbol is divided into the basal area of whitebark pine that is live, infected with blister rust (black), live, not infected with blister rust (white), and dead.
Forests 10 00834 g002
Figure 3. The whitebark pine sampling frame from Lassen Volcanic National Park. Circular symbols show the 30 plots installed between 2012 and 2014, and each symbol is divided into the basal area of whitebark pine that is live, infected with blister rust (black), live, not infected with blister rust (white), and dead.
Forests 10 00834 g003
Figure 4. Diameter at breast height distribution of whitebark pine found in 30 plots established in both (a) Crater Lake (CRLA) and (b) Lassen Volcanic (LAVO) National Parks. Black fill represents living trees and white fill represents dead trees.
Forests 10 00834 g004
Figure 5. Number of seedlings in 30 whitebark pine plots in (a) Crater Lake and (b) Lassen Volcanic National Parks. Points are jittered to allow easier viewing. PIAL = Pinus albicaulis, ABMA = Abies magnifica, PICOM = Pinus contorta var. murrayana, TSME = Tsuga mertensiana.
Forests 10 00834 g005
Figure 6. Number of whitebark pine trees with cones from 30 whitebark pine plots in Crater Lake and Lassen Volcanic National Parks. Means and SD are shown.
Forests 10 00834 g006
Figure 7. Basal area (m2) statistics from 30 whitebark pine plots in Crater Lake and Lassen Volcanic National Parks. Means and SD are shown. (a) Basal area of all other trees. Black bars represent living trees and white bars represent dead trees, (b) Basal area of dead whitebark pine, (c) Basal area of live whitebark pine.
Forests 10 00834 g007
Figure 8. (a) Incidence of mountain pine beetle and (b) white pine blister rust from 30 whitebark pine plots in Crater Lake (CRLA) and Lassen Volcanic (LAVO) National Parks. Means with ± SD are shown. Here, rust is blister rust and MPB is mountain pine beetle.
Forests 10 00834 g008
Table 1. Plot- and tree-level variables included in generalized linear mixed-effects models (GLMMs) conducted for all dependent variables in two parks Crater Lake and Lassen Volcanic National Parks. The acronyms WBP, stands for whitebark pine.
CodeDescription
Plot-level variables
BaOtherSummed basal area of all non-WBP individuals in a plot (m2/ha)
BaWBPSummed basal area of all WBP individuals in a plot (m2/ha).
CwdAverage climatic water deficit (potential evapotranspiration-actual evapotranspiration, mm)
Tree-level variables
Dbh Diameter at breast height (cm)
WpbrBlister rust infection (Active and inactive cankers) (y/n)
MpbMountain pine beetle infestation (y/n)
ConesFemale cones (y/n)
Table 2. Summary statistics of living and dead trees sampled in 30 plots in each of two parks Crater Lake (CRLA) and Lassen Volcanic (LAVO) National Parks. Mean values among plots (n = 30) in each park and standard deviations (SD) are shown.
ParameterCRLALAVO
MeanSDMeanSD
Live Trees (# individuals/ha)
mountain hemlock312.53444.57525.87505.55
whitebark pine126.93218.2487.6086.30
lodgepole pine34.5355.670.130.73
red fir9.7345.905.7310.85
western white pine0.271.460.130.73
Live Trees (basal area, m2/ha)
mountain hemlock20.0125.6914.4714.52
whitebark pine2.603.732.793.73
lodgepole pine1.332.46<0.010
red fir0.261.370.160.43
western white pine<0.010.01<0.010
Dead whitebark pine (# individuals/ha)7.089.011018.66
Dead whitebark pine (basal area, m2/ha)1.853.490.401.06
Proportion blister rust infected trees (basal area, m2/ha)0.510.320.540.35
Proportion mountain pine beetle infested trees
(basal area, m2/ha)
0.020.070.010.03
Table 3. Summary statistics of unstandardized covariates included in each of the five generalized linear mixed-effects models in both Crater Lake (CRLA) and Lassen Volcanic (LAVO) National Parks. The values below represent averages and standard deviations for each covariate across all plots (n = 30) in each park.
CovariateCRLALAVO
BaWBP (m2/ha)4.45 (5.55)3.19 (3.99)
BaOther (m2/ha)29.76 (28.76)16.99 (15.2)
Cwd (mm)8.04 (2.32)8.81 (1.74)
Dbh (cm)14.11 (7.04)15.32 (13.33)
Table 4. Estimated effects of site characteristics from the best supported Generalized Linear Mixed Model (GLMM) of the probability of producing cones (no = 0, yes = 1), probability of white pine blister rust infection (uninfected = 0, infected = 1), the probability of mountain pine beetle infestation (uninfested = 0, infested = 1), and the proportion of average canopy kill in Crater Lake National Park. p-values indicate the significance of the Wald Z-test statistic.
CharacteristicModelEstStd. Errorp95% CI
Incidence of white pine
blister rust
Dbh0.3720.086<0.001(0.203, 0.540)
Cwd0.5960.252<0.05(0.101, 1.091)
BaWBP−0.3650.3210.255(−0.994, 0.263)
BaOther−0.0690.1850.707(−0.434, 0.294)
Incidence of mpbWpbr2.3590.754<0.01(0.881, 3.387)
Cwd0.3840.2630.144(−0.131, 0.900)
Dbh−0.2730.2680.308(−0.798, 0.252)
BaOther0.1600.2310.488(−0.293, 0.614)
BaWBP−0.1270.2630.628(−0.644, 0.389)
Production of conesDbh1.4250.151<0.001(1.128, 1.721)
BaOther−1.240.449<0.01(−2.123, −0.362)
Cwd0.7170.4100.080(−0.086, 1.521)
Wpbr0.1570.2790.572(−0.389, 0.704)
Mpb0.6450.7490.389(−0.823, 2.114)
BaWPB−0.0770.3740.836(−0.811, 0.657)
Proportion of average
canopy killed
Dbh0.2430.031<0.001(0.182, 0.304)
Wpbr0.2280.063<0.001(0.104, 0.351)
BaOther0.1850.063<0.01(0.061, 0.310)
BaWBP0.3030.107<0.01(0.092, 0.515)
Mpb0.4330.178<0.05(0.083, 0.782)
Cwd−0.0280.0850.739(−0.194, 0.138)
Table 5. Estimated effects of site characteristics from the Generalized Linear Mixed Model (GLMM) of the probability of producing cones (no = 0, yes = 1), probability of blister rust infection (uninfected = 0, infected = 1), the probability of mountain pine beetle infestation (uninfested = 0, infested = 1), and the proportion of average canopy in Lassen Volcanic National Park. p-values indicate the significance of the Wald Z-test statistic.
CharacteristicModelEstStd. Errorp95% CI
Incidence of white pine
blister rust
Dbh−0.0490.1060.644(−0.257, 0.159)
Cwd0.3120.3570.383(−0.375, 1.005)
BaWBP−0.6040.4510.180(−1.475, 0.261)
BaOther−0.1610.3470.642(−0.830, 0.508)
Production of conesDbh1.0870.121<0.001(0.849, 1.325)
BaOther−0.3250.1770.067(−0.672, 0.022)
Cwd0.0790.1760.651(−0.264, 0.424)
Wpbr−0.1020.2360.664(−0.566, 0.361)
BaWPB0.1990.2060.333(−0.202, 0.603)
Mpb−0.7120.8710.413(−2.41, 1.00)
Proportion of average
canopy killed
Wpbr0.4640.074<0.001(0.293, 0.635)
Cwd−0.2320.1060.030(−0.441, −0.023)
Mpb0.5090.2650.055(−0.011, 1.030)
Dbh−0.0310.0380.421(−0.107, 0.044)
BaOther0.0740.1020.471(−0.127, 0.275)
Ba_WBP0.0640.1310.623(−0.322, 0.193)

