Article

Modeling the Effect of Climate Change on the Potential Distribution of Qinghai Spruce (Picea crassifolia Kom.) in Qilian Mountains

1
State Key Laboratory of Grassland Agro-ecosystems, Key Laboratory of Grassland Livestock Industry Innovation, Ministry of Agriculture and Rural Affairs, College of Pastoral Agriculture Science and Technology, Lanzhou University, Lanzhou 730020, China
2
State Key Laboratory of Grassland Agro-ecosystems, School of Life Sciences, Lanzhou University, Lanzhou 730000, China
3
Qilian Mountains National Natural Reserve Management Bureau, Zhangye 734000, Gansu, China
*
Author to whom correspondence should be addressed.
Forests 2019, 10(1), 62; https://doi.org/10.3390/f10010062
Submission received: 9 November 2018 / Revised: 9 January 2019 / Accepted: 12 January 2019 / Published: 14 January 2019
(This article belongs to the Special Issue Influence of Climate Change on Tree Growth and Forest Ecosystems)

Abstract

:
Qinghai spruce forests play a key role in water conservation in the dry region of northwest China. So, it is necessary to understand the impacts of climate change on the species to implement adaptation strategies. Based on the four-emission scenario (i.e., RCP2.6 (Representative Concentration Pathway), RCP4.5, RCP6.0 and RCP8.5) set by the Intergovernmental Panel on Climate Change (IPCC) fifth assessment report, in the study, we predicted the potential distribution of Qinghai spruce (Picea crassifolia Kom.) under current and future scenarios using a maximum entropy (Maxent) model. Seven variables, selected from 22 variables according to correlation analysis combining with their contribution rates to the distribution, are used to simulate the potential distribution of the species under current and future scenarios. Simulated results are validated by area under the operating characteristic curve (AUC). Results demonstrate that elevation, mean temperature of wettest quarter, annual mean temperature, and mean diurnal range are more important in dominating the potential distribution of Qinghai spruce. Ratios of the suitable area to the total study area are 34.3% in current climate condition, 34% in RCP2.6, 33.9% in RCP4.5, 33.8% in RCP6.0, and 30.5% in RCP8.5, respectively. The warmer the climate condition is, the more area of higher suitable classification is changed to that of lower suitable classification. The ratios of real distribution area in simulated unsuitable class to the real distribution area change from 4.3% (60.7 km2) in the current climate to 13% (185 km2) in RCP8.5, suggesting that the real distribution area may decrease in the future. We conclude that there is a negative effect of climate change on the distribution of Qinghai spruce forest. The result can help decision-makers to draft adaptation countermeasures based on climate change.

1. Introduction

Global warming is an indisputable fact, and the global annual temperature has increased 0.85 °C between 1880 and 2012 and will continuously rise in the future [1]. Climate warming has been widely proved to have a great influence on community composition and structure, vegetation pattern, and ecosystem functions, especially, on species’ distribution [2,3,4,5,6,7,8,9]. Predicting the potential species distribution is significant to take safe and effective countermeasures to reduce the ecological risk happening under climate change [10,11,12].
Species distribution model (SDM) is a useful tool to understand the effect of climatic change on species’ distribution, which was developed by combining present data of a species with relevant environment variables [13,14,15,16,17,18,19]. Many SDMs have been developed for predicting the potential distribution of species under climate change, such as the Genetic Algorithm for Rule-set Prediction (GARP) [20,21], Surface Range Envelope (SRE; usually called BIOCLIM) [22], Random Forests (RFs) [23], Ecological Niche Factor Analysis (ENFA) [24], and Maximum Entropy (Maxent) [25]. They have been applied to predict the potential distribution of the selected species under current as well as the future scenarios in many places [18,26,27].
Among these models, Maxent has been widely used in the world due to its advantages: (1) needing only species occurrence data, that makes data easily collected; (2) using both continuous and categorical environmental data at the same time; (3) generating a continuous probabilistic output, that is apt to classify species suitability; (4) small sample size can meet its demand [28,29,30,31,32,33], that reducing laborious jobs in data collection; (5) facilitating model interpretation [10,25,34,35]. Compared to other algorithms such as GARP, BIOCLIM, and DOMAIN, Maxent has been found to be consistently better in its prediction performance [25,36]. It has been extensively used in the studies on the prediction of species distribution [18,26,27,37,38].
Qilian Mountains located in the northwest China and surrounded by desert and Gobi, is a crucial water source in the northwest China because of the higher precipitation. Many inland rivers, such as Shiyanghe River, Heihe River and Shulehe River, are originated from Qilian Mountains [39]. Qinghai spruce (Picea crassifolia Kom.), the dominant tree species in the Qilian Mountains, is distributed in the north-facing slope. It is characterized by a small population, a limited geographic range, and habitat specialization [40]. The population with these characteristics has remarkable sensitivity to climate change [41,42]. Qinghai spruce forest plays an important role in ecological service functions, especially water conservation. Given this, Qinghai spruce becomes the protected object in Qilian Mountains National Natural Reserve. One widespread hypothesis is that global warming will change distribution ranges of species. Understanding changed distribution ranges of Qinghai spruce is meaningful for maintaining ecological services and protection strategies.
The objectives in this study are to: (1) predict the potential distribution of the species under the current situation; (2) forecast its suitability areas under four future climate scenarios, and (3) evaluate the effects of climate change on the distribution of Qinghai spruce. Identifying the shift ranges of suitable area under future scenarios is the innovation in the study.

2. Materials and Methods
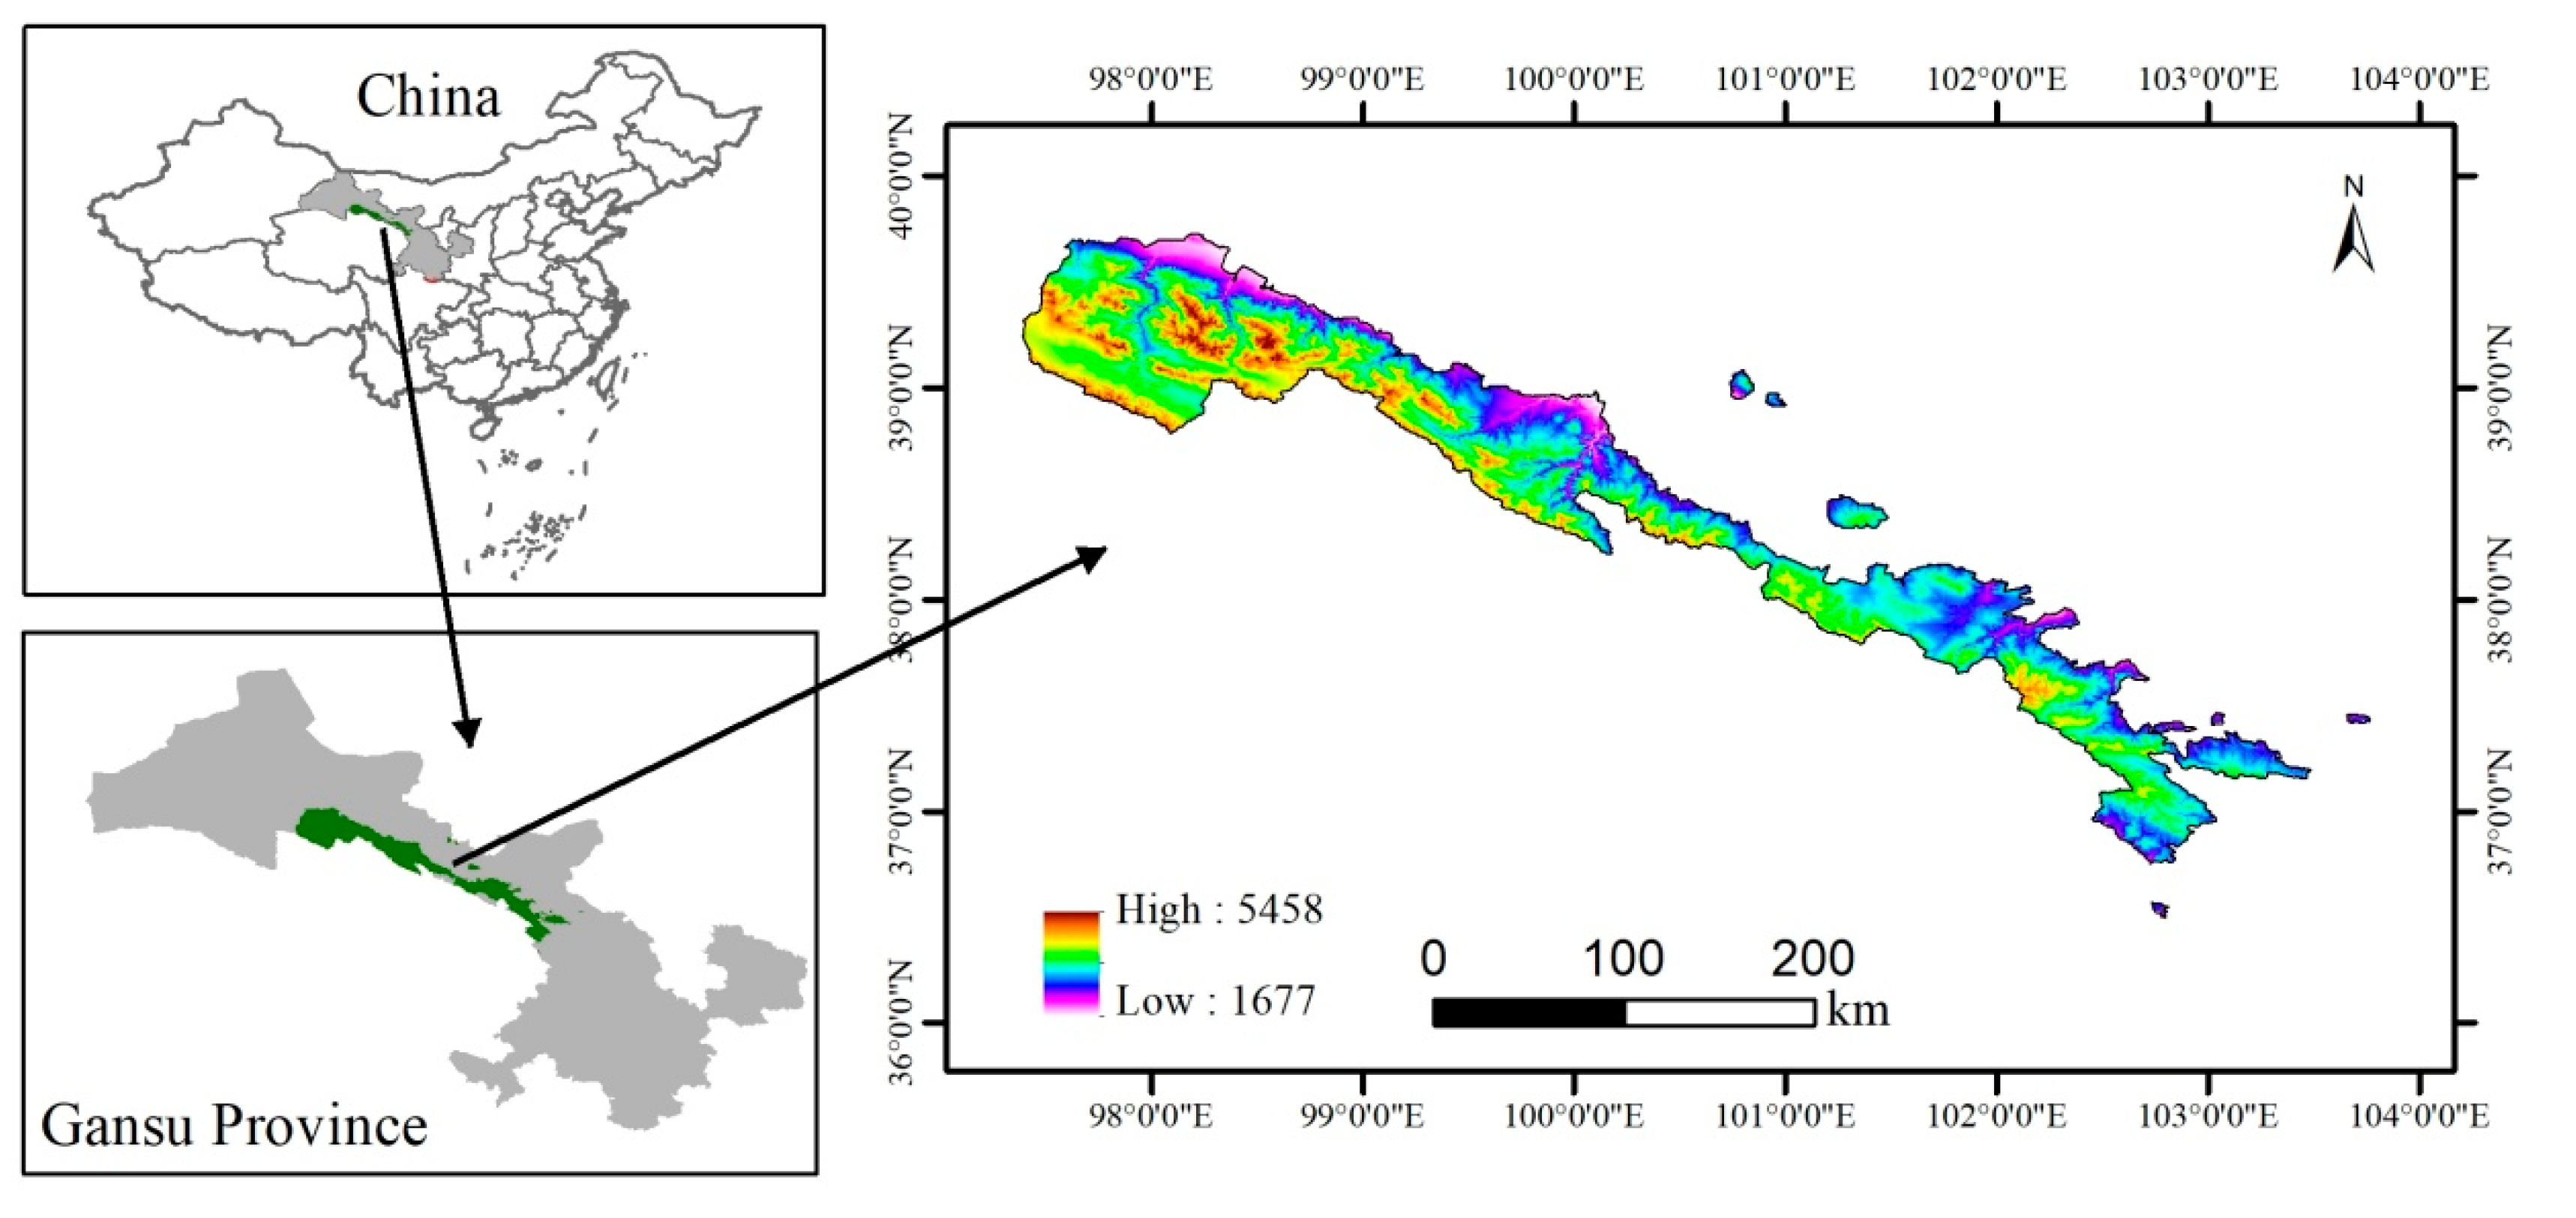
2.1. Study Area

Qilian Mountains selected as our study area is situated at the northeast edge of the Tibet Plateau, between 99°25′–103°28′ E and 36°45′–39°36′ N (Figure 1). The elevation ranges from 2000 to 6000 m. In the southeast, the Southeast Asian monsoon is the influencing weather system, and in the northwest the westerlies bring relatively dry air from Central Asia. Two atmospheric circulation systems together with high elevation differences result in a significant precipitation gradient. Observations at various meteorological stations (for the period 1960–2009) present that horizontally, higher mean annual precipitation (525.9 mm) appeared in the southeast part and lower mean annual precipitation (293.1 mm) occurred in the northwest part, vertically, the mean annual precipitation ranged from 250 mm in lowlands to 700 mm in high elevations. Approximately 88% of precipitation occurs from May to September. The mean annual temperature is 6 ℃ in lowlands and −10 ℃ in high elevations [43]. The combination of precipitation and temperature results in horizontal and vertical differentiations of vegetation and soil. Vegetation types in the study area are displayed in spatial sequences (from low to high elevations): desert, desert steppe, steppe, steppe-forest, sub-alpine shrubby meadow and alpine frost-action barren zone. Qinghai spruce forests distributed from 2500 m to 3500 m are in the steppe-forest zone [44].

2.2. Qinghai Spruce Distribution Data

The date on the locations of Qinghai spruce was obtained from field survey conducted from 2015 to 2017 in the study area. A total of 178 species occurrence were recorded. To minimize the spatial autocorrelation of the species occurrence points and reduce its impact on the model’s results, the sampling sites were selected based on different environmental conditions and the distance between two sampling points was more than 5 km. The real distribution map of forests was collected from Gansu Qilian Mountains National Nature Reserve administration. We extracted the distribution of Qinghai spruce forests after digitalizing the forests map.

2.3. Environmental Data

Environmental variables included three terrain variables and 19 bioclimatic variables. Terrain variables like elevation, aspect, slope with a 90m spatial resolution were downloaded from the USGS website (www.srtm.usgs.gov), which were re-sampled into 1 km spatial resolution using the nearest neighbor re-sampling technique in ArcGIS10.3. The 19 bioclimatic variables for the current and future scenarios with a 1 km spatial resolution were downloaded from the WorldClim data set (http://www.worldclim.org/bioclim). The dataset was generated by interpolation of observed weather data using a thin-plate smoothing spline during the period of 1950–2000. The interpolation method considers latitude, longitude and elevation as independent variables [45,46]. The future climate scenarios were present by 2070s data (the average data for 2060–2080) modeled by the Community Climate System Model version 4 (CCSM4) representing four future greenhouse gases concentration trajectories (i.e., RCP2.6 (Representative Concentration Pathway), RCP4.5, RCP6.0, and RCP8.5). The four scenarios described the total radiative forcing values in 2100 would have reached 2.6 W/m2, 4.5 W/m2, 6.0 W/m2, and 8.5 W/m2 over the value in preindustrial period [47]. The 19 variables downloaded were on a global scale, so they were extracted for the study area by GIS tool.
In order to avoid the cross-correlation within 19 bioclimatic variables and three terrain variables, first, we assessed the contribution rate of each variable by the jackknife test of Maxent model, then we conducted the multi-collinearity test using Pearson’s correlation coefficient in IBM-SPSS statistical software (Statistical Product and Service Solutions, Version 20.0, SPSS Inc., Chicago, IL, USA), If two variables have a Pearson correlation > |0.8|, only one with a high contribution rate was selected [48].

2.4. Ecological Niche Modeling

We used the Maxent model to predict the current and future potential distribution of Qinghai spruce in the Qilian Mountains. The Maxent model is a machine learning technique that has successfully been applied to model species distribution by only occurrence data and environmental data [25]. The Maxent model contains two accessional procedures; one is area under the curve (AUC) calculation. AUC values were used to evaluate the model performance, which are automatically generated using random pseudo absence background points [49], ranging from 0 to 1. Performance of the model can be divided into five groups according to AUC values: excellent (>0.9), good (0.8–0.9), accepted (0.7–0.8), bad (0.6–0.7), and invalid (<0.6) [26]. The other is the jackknife test; it can be used to evaluate the importance of variables.
The species distribution point data should be saved in CSV format and contains coordinate information such as species name, longitude and latitude. All environmental variables converted to ASCII raster grids and species occurrence coordinates were converted to decimal degrees in ArcGIS 10.3. Other settings were kept as default (500 iterations, 0.00001 convergence threshold, 10,000 maximum background points). The program ran with 75% of presence locations and tested the model performance with the remaining 25% of the presence locations [25]. A detailed mathematical definition of Maxent was described in Phillips et al. [25].
The output of the model is a continuous probabilistic layer, ranging from 0 to 1. Areas with higher values imply more favorable conditions for the species growth [25]. We selected the minimum of the output by training presences (MTP) as a threshold or “cutoff” value for each scenario [50]. Ecologically, the MTP can be interpreted to contain those cells that are predicted to be at least as suitable as those where the species was identified as present. We divided habitat suitability into four classes: unsuitability, low suitability, moderate suitability, and high suitability.

3. Results

3.1. Variables Analysis

According to the contribution rate and Pearson’s correlation coefficient (see Table S1), only seven variables were retained for modelling (see Table 1 in bold), including Elevation, Slope, Aspect, Bio1, Bio2, Bio3, and Bio8. Bio1 is annual mean temperature, Bio2 is mean diurnal range, that is, mean of monthly (max temp-min temp), Bio3 is isothermality that equals (Bio2/Bio7) (* 100), and Bio7 is temperature annual range that is the maximum temperature of warmest month minus minimum temperature of coldest month, bio8 is mean temperature of wettest quarter. The wettest quarter is three months with the most rainfall during a year. The driest quarter is three months with minimum precipitation during a year. In the study area, the wettest quarter includes June, July, and August, and the driest quarter is December, January, and February. The wettest quarter is consistent with the warmest season. During the wettest quarter, precipitation is in the form of rain.
We suppose the terrain variables would not change in the future scenarios. The contribution of the other four variables to the climate variability under the four scenarios was shown in Table 2. Bio2 and Bio3 had little contribution to the climate variability, while Bio1 had great contribution to the climate variability. Bio1 increased rapidly with the increase in the greenhouse gas concentrations, being 0.30 °C in RCP2.6, 1.05 °C in RCP4.5, 1.15 °C in RCP6.0, and 2.48 °C in RCP8.5. Comparing Bio1 in the present situation, the change rates of Bio1 in four scenarios were 118.52, 118.52, 170.99, and 253.09%. Bio8 had less contribution than Bio1 but larger contribution than Bio2 and Bio3, to the climate variability. It would increase with the increases in greenhouse gas concentrations, being 11.21 °C, 12.22 °C, 12.32 °C and 13.74 °C in RCP2.6, RCP4.5, RCP6.0 and RCP8.5, respectively. Its change rates in four scenarios were 18.54%, 18.54%, 30.20% and 45.26% comparing with Bio8 in the present situation.

3.2. Accuracy of the Maxent Model

AUC values were greater than 0.98 under the current and four climatic scenarios (Table 3). According to the performance classification standard, the prediction accuracy was excellent in our study, as AUC values are more than 0.9 in both training and test.

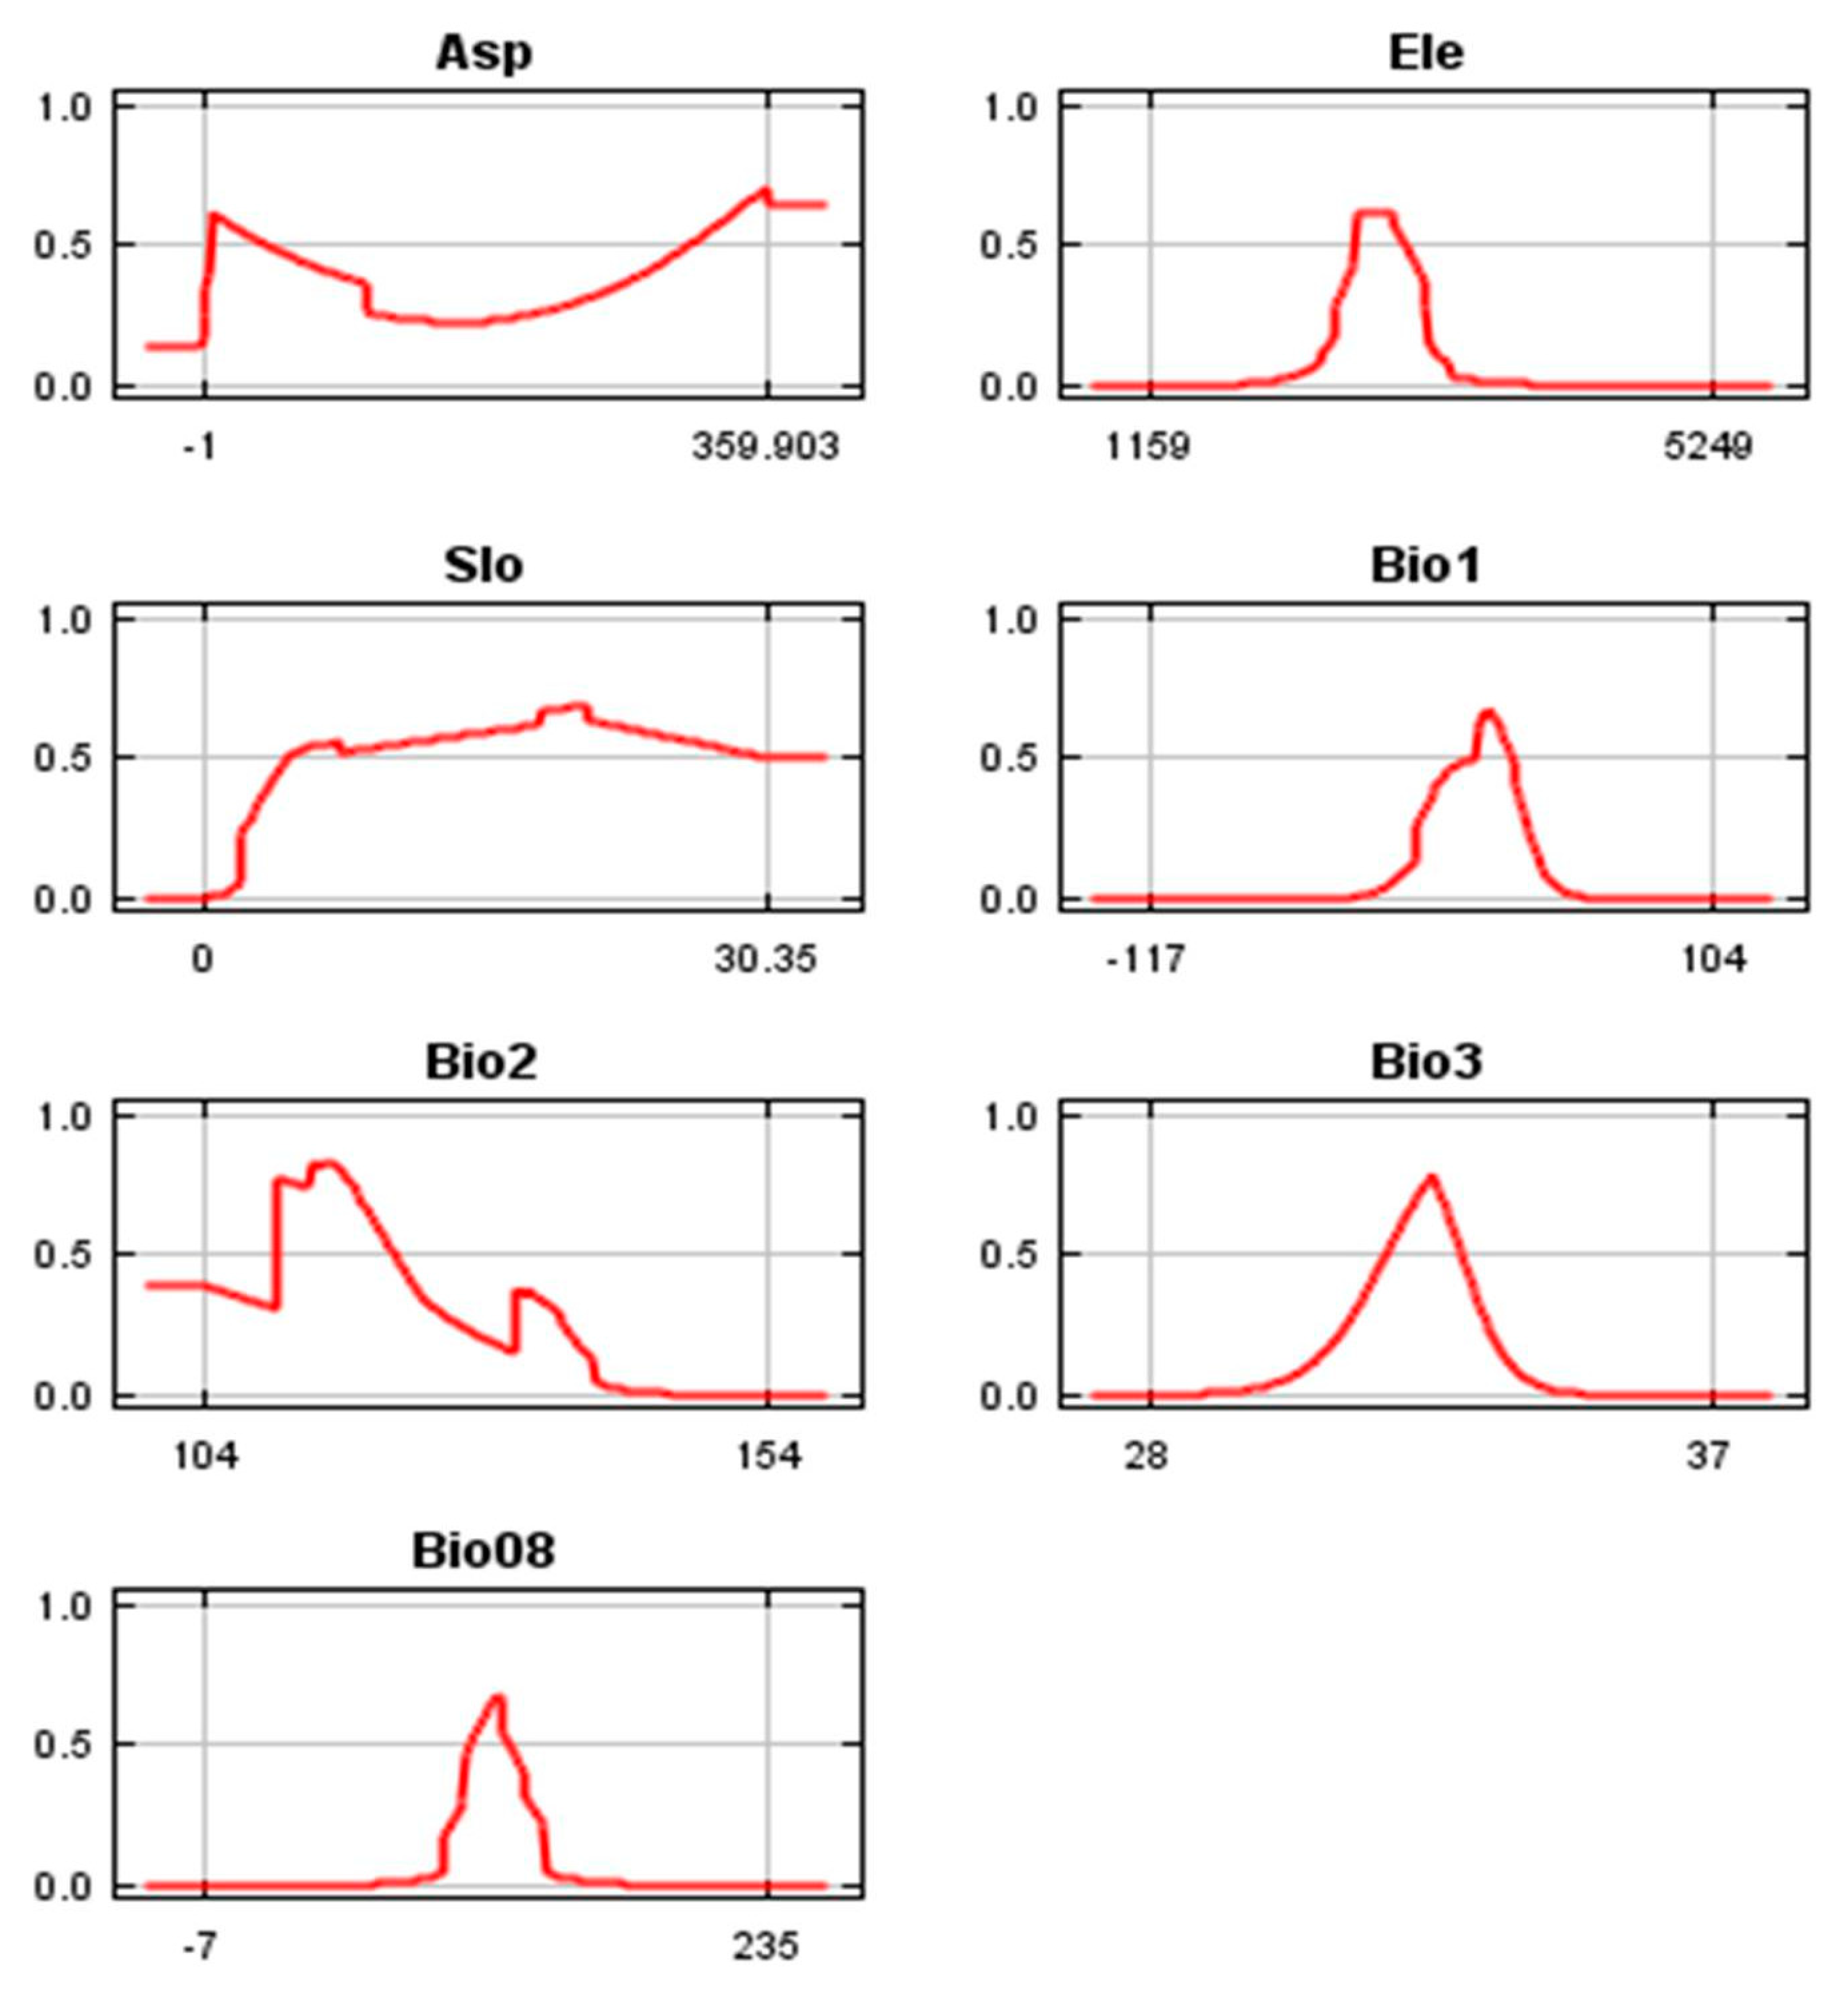
3.3. Variables’ Contribution and Variables’ Response to Suitability

After seven variables ran the Maxent model, the contribution rate of each variable by the jackknife test was obtained. Table 1 showed contribution rates were different in different scenarios. The potential distribution of Qinghai spruce under current were significantly affected by elevation (29.2%), Bio8 (24.4%), Bio1 (16.0%), slope (11.5%), Bio2 (10.4%). The potential distribution of Qinghai spruce under the RCP2.6 scenario was mainly contributed by elevation (30.1%), Bio8 (24.4%), Bio1 (15.5%), slope (14.1). The important variables under the RCP4.5 scenario were elevation (23.5%), Bio1 (22.3%), Bio8 (19.9%), slope (13.8), Bio2 (13.4%), Bio3 (5.0%), and aspect (2.1%). The potential distribution of Qinghai spruce under the RCP6.0 scenario was most constrained by elevation (23.7%), Bio1 (23.7%), Bio8 (17.9%), slope (14.7%), and Bio2 (13.5%). The potential distribution of the species under the RCP8.5 scenario were most strongly associated with Bio1 (27.0%), elevation (21.3%), Bio8 (17.5%), and slope (14.7%).
The jackknife test indicated that Elevation, Bio8, Bio1 and Bio2 provided very high gains when they were used independently (Figure 2). According to gains being more than 1, Figure 2A showed that potential distribution of Qinghai spruce under the current was significantly affected by Bio8 with gain 1.57, elevation with gain 1.53, and Bio1 with gain 1.43. The potential distribution of Qinghai spruce in the RCP2.6 scenario was mainly contributed by Bio8, elevation, Bio1, and Bio2, their gains were 1.66, 1.55, 1.43, and 1.04, respectively (Figure 2B). The important variables under the RCP4.5 scenario were Bio8 (gain, 1.68), elevation (gain, 1.55), Bio1 (gain, 1.44), and Bio2 (gain, 1.08) (Figure 2C). The variables most constraining the potential distribution of Qinghai spruce under the RCP6.0 scenario were the same as that under RCP4.5 with the same gains except for Bio8 (gain 1.65) (Figure 2D). The potential distribution of the species under the RCP8.5 scenario was most strongly associated with Bio8, elevation, Bio1, and Bio2, their gains were 1.67, 1.55, 1.42, and 1.01, respectively (Figure 2E). On the whole, Bio8, elevation, Bio1, and Bio2 were more important variables for predicting the distribution of Qinghai spruce.
Figure 3 showed that response curves of seven environmental variables to the potential distribution of Qinghai spruce. From Figure 3 we could see: the highest suitability for Qinghai spruce occurred in the areas where elevation was from 2650 to 3050 m, annual mean temperature (Bio1) was between 1.5 and 2.5 °C, mean temperature of wettest quarter (Bio8) between 11.0 and 12.5 °C, Mean diurnal range (Bio2) from 11.0 to 12.1 °C, Isothermality (Bio3) from 31.8 to 33.0, aspect from 310 to 40°, slope between 4.8 to 30°.

3.4. Potential Distribution of Qinghai Spruce under Different Climate Scenario

The suitability of Qinghai spruce was classified using four probability classes based on Khafaga [51] and Remya [52]. The MTP threshold, or the level at which no omission errors, was detected as 0.089. That is, areas with probability <0.089 were unsuitability areas. The range between 0.089 and 1 was divided into three classes, 0.089–0.3 named as low suitability, 0.3–0.6 as moderate suitability, >0.6 as high suitability. So, four classifications of suitability were obtained.
The potential distribution maps of Qinghai spruce under current climate and four scenarios were shown in Figure 4. The Qinghai spruce is distributed mainly over the middle and eastern parts of the study area. The simulated distribution area of Qinghai spruce under current climate and four scenarios are considerably larger than real distribution area (Figure 4).
As shown in Table 4, the distribution area with moderate suitability under current climate is 4250.7 km2, the area with low suitability is 2994.1 km2, and the area with high suitability is 1312.0 km2. The total suitable area occupied 34.3% of the study area. In four scenarios, the total suitable area gradually decreased with climate warming, being 8556.8, 8473.1, 8438.5, 8420.6, and 7604.2 km2 under current, RCP2.6, RCP4.5, RCP6.0 and RCP8.5, respectively (Table 4). The warmer the climate is, the less suitable the area is. The suitable distribution area occupied 34%, 33.9%, 33.8%, 30.5% of study area under four scenarios (i.e., RCP2.6, RCP4.5, RCP6.0 and RCP8.5), respectively.

3.5. The Transfer Matrix of Suitable Distribution Areas under the Current and Future Scenarios

The transfer matrix of suitable distribution classes under the current and future scenarios showed that the warmer the climate condition is, the more area with higher-level suitability is changed to that with lower-level suitability (Figure 5). For example, there were 443.5 km2 areas with low suitability, 58.8 km2 areas with moderate suitability and 3.9 km2 areas with high suitability area in current climate condition would be changed to unsuitable area in RCP2.6. There was 598.3 km2 of area with moderate suitability and 18.0 km2 of area with high suitability area in current climate condition that would be changed to area with low suitability in RCP2.6. There was 367.6 km2 of area with high suitability in current climate condition that would be changed to area with moderate suitability in RCP2.6. Totally, 1490.1 km2 of area with higher level suitability in current climate condition would be changed to area with lower level suitability in RCP2.6. There was 1108.4 km2 of area with low suitability, 684.8 km2 of area with moderate suitability and 149.6 km2 of area with high suitability area in current climate condition would be changed to unsuitable area in RCP8.5. There was 1192.1 km2 of area with moderate suitability and 191.1 km2 of area with high suitability in current climate condition would be changed to area with low suitability in RCP8.5. There was 538.0 km2 of area with high suitability in current climate condition would be changed to area with moderate suitability in RCP8.5. Totally, 3672.9 km2 of area with higher level suitability in current climate condition would be changed to area with lower level suitability in RCP8.5.

3.6. The Relationship Between Qinghai Spruce’ Actual Distribution and Potential Distribution Under Current and Four Scenarios

According to the actual distribution area (Figure 4), there was 1422.1 km2 of Qinghai spruce forests in the study area, mainly distributed in the middle and east parts of the reserve. Overlapping the real distribution with potential distributions of current and future scenarios, we found that the area of real distribution in unsuitable class increased from 60.7 km2 (4.3%) in the current climate to 185 km2 (13%) in RCP 8.5 (Table 5).

4. Discussion

It is necessary to understand the interrelationship between the size of species geographic range and species extinction risk under global climate change scenarios [53,54]. Which is crucial to set up management strategies for the habitat conservation and sustainability of species in the future [55,56]. For the purpose, we must identify the distribution of species under the current and climate change scenarios. SDM is one of the important tools for determining species distribution [57]. Many SDMs have been developed, among them the Maxent model performs well with its advantages mentioned in introduction to predict species’ distribution ranges at macro-scales [58,59]. In this study, we used the Maxent model to predict Qinghai spruce distribution ranges on the current and future scenarios and presented an assessment about habitat suitability of the species, an extremely important ecological and hydrological tree species in the Qilian Mountains.
Model accuracy assessment is an essential step to ensure that the species distribution models (SDMs) reflect species-habitat relationships [60]. Generally, AUC is selected as an assessment standard. Models with a value larger than 0.7 exhibit good performance [26,61]. In our study, AUC values were greater than 0.964 for Qinghai spruce under the current and four climatic change scenarios, indicating that the model has excellent performance for simulating the distribution of the species.
Our results showed that the variables related to air temperature (Bio1, Bio8) and elevation were dominant variables in determining the suitable habitat for Qinghai spruce. Previous studies demonstrated that distribution of the species was affected by temperature in July, annual precipitation and aspect [44]. Xu et al [39] indicated mean temperature of the warmest quarter, precipitation of the wettest quarter, annual solar radiation, and topographic wetness index were important variables. High suitability of Qinghai spruce was the optimal combination of average annual precipitation, average air temperature in July, and solar radiation, being 380 mm, 11.5 °C, and 2 × 10³ kWh/m2, respectively [62]. Therefore, the temperature factor was the dominant variable that determined the distribution of Qinghai spruce. Qinghai spruce was mainly distributed on the shady slope. Increased temperatures may lead to a decrease in the distribution of the species in low altitude and an increase in the growing season. Under different climate change scenarios, the increase of the temperature in the study area was much greater than that in precipitation, which may lead to drought in the study area. So, it is not conducive to the growth of spruce. It should be noted that Qilian Mountains regions are dominated by westerly jet, that is, so-called “silk-road” pattern [63]. Song et al. [64] and Song and Zhou [65] revealed the pattern influencing the air temperature. Therefore, the “silk-road” pattern should be further considered to study the effect of temperature on the distribution of Qinghai spruce.
Our research found that the suitable area would decrease under four climate change scenarios (RCP2.6, RCP4.5, RCP6.0 and RCP8.5). This is consistent with results of previous studies, which suggested that the global warming has negative effects on species distribution ranges [7,66]. The suitable area decreased under RCP8.5 is larger than the other three scenarios due to different changes of temperature under four scenarios. RCP2.6 is the lowest carbon emission scenario, RCP4.5 and RCP6.0 are medium carbon emission scenarios, whereas, RCP8.5 is an extreme carbon emission scenario. The increase in temperature was much greater under RCP8.5 than under the other three scenarios (Table 2). By contrast, Xu et al. [67] reported that the potential distribution area of Qinghai spruce increased under climate warming. The difference may be attributed to different selected climate models. Previous studies demonstrated that different models and different realizations in the same model may show quite different historical temperature evolution [68] There are 19 general circulation models (GCMs) in WorldClim, in these studies, we selected the CCSM4 model because it was widely adopted to simulate future climate change projection [69,70]. However, the comparative analysis of climate model performance in Qilian Mountains is needed in further research, which could provide the criterion for selecting models. In this way, we can use the average value of climatic variables obtained from GCMs to run Maxent model in the Qilian Mountains, and thus avoiding the uncertainty of future climate projections. In addition, input variables’ selection is also a key step. Different results about the effect of climate warming on Qinghai spruce distribution in the Qilian Mountains may be caused by input variables. The study of Xu et al. [67] had no screening variables, and the sampling points were mostly concentrated in the central and eastern regions. The multi-collinearity problem existed among variables and the autocorrelation problem of the sampling points was not considered. This may be the reason why our results are different from theirs.
Many variables have multi-collinearity that results in an overfitting simulation of species distribution [71]. Therefore, it is necessary for screening variables to run SDMs. There are various selection techniques such as expert knowledge method [27,62], pair-wise correlation analyses [72], X2 test [73], PCA analysis [74], and jackknife analyses [75,76,77,78]. In our study, we used jackknife test and Pearson’s correlation coefficient to select variables. Variables were selected with the higher contribution and least correlation (r < 0.8). Comparative study of variable selection methods will be conducted further for promoting the accuracy of SDM.
Our results showed that the predicted potential distribution under current and future scenarios was larger than realized distribution. This is possibly because the Maxent model predicted the species fundamental niche rather than realized niche [27,31]. In reality, a species might have failed to disperse due to geographic barriers, human disturbance or associated species’ competition [31,42,79,80]. In our study area, realized distribution of the species had suffered from intensive deforestation. It was reported that some area of Qinghai spruce forest has been converted into grasslands [44] in the middle part of the study area and has been transformed to farmland in the east [39]. The comparative analysis of potential species distribution under current climate and the realized species distribution could identify human activities and provide information about prior areas to restore the species.

5. Conclusions

In this study, we successfully modeled the potential distribution of Qinghai spruce for the current and future climate change scenarios. Our results verify the hypothesis that global warming will change distribution ranges of species, which is crucial for understanding spatiotemporal dynamics of Qinghai spruce under climate change scenarios. The current suitable areas predicted should have two measures to protect the distribution area of the species. One is conservation prioritization measure; the other is restoration measure. Conservation prioritization area is the predicted suitable area which has real distribution. The restoration area is the place where the predicted suitable area which has no real distribution, especially the high suitable area in the middle and eastern part of the Qilian Mountains. Our results could be used to provide reliable information on devising adaptive responses for the sustainable management of the species.

Supplementary Materials

The following are available online at https://www.mdpi.com/1999-4907/10/1/62/s1, Table S1: Multi-collinearity test by using cross-correlations (Pearson correlation coefficients, r) among environmental variables.

Author Contributions

Z.R. and C.Z. conceived and designed the experiments; Z.R., Y.G., J.L., F.Z., Z.G., Y.M. and L.W. collected the data; Z.R analyzed the data; Z.R. and C.Z. wrote the paper.

Funding

The research was financially supported by National Natural Science Foundation of China (91025015, 51178209), and Project of Arid Meteorological Science Research Foundation of China Meteorological Administration (IAM201608).

Acknowledgments

We are grateful to Haojie Xu and Wenbin Li, for help during experiments for their continuous support throughout this project.

Conflicts of Interest

The authors declare no conflict of interest.

References

  1. IPCC. Annex I: Atlas of Global and Regional Climate Projections. In Climate Change 2013: The Physical Science Basis. Contribution of Working Group I to the Fifth Assessment Report of the Intergovernmental Panel on Climate Change; Intergovernmental Panel on Climate Change: Cambridge, UK; New York, NY, USA, 2013; p. 1311. [Google Scholar]
  2. Alberto, F.J.; Aitken, S.N.; Alia, R.; Gonzalez-Martinez, S.C.; Hanninen, H.; Kremer, A.; Lefevre, F.; Lenormand, T.; Yeaman, S.; Whetten, R.; et al. Potential for evolutionary responses to climate change evidence from tree populations. Glob. Chang. Biol. 2013, 19, 1645–1661. [Google Scholar] [CrossRef] [PubMed]
  3. Bellard, C.; Bertelsmeier, C.; Paul, L.; Thuiller, W.; Courchamp, F. Impacts of climate change on the future of biodiversity. Ecol. Lett. 2012, 15, 365–377. [Google Scholar] [CrossRef] [PubMed] [Green Version]
  4. Beltramino, A.A.; Vogler, R.E.; Gregoric, D.E.G.; Rumi, A. Impact of climate change on the distribution of a giant land snail from South America: Predicting future trends for setting conservation priorities on native malacofauna. Clim. Chang. 2015, 131, 621–633. [Google Scholar] [CrossRef]
  5. Davies, N.; Gramotnev, G.; Seabrook, L.; McAlpine, C.; Baxter, G.; Lunney, D.; Bradley, A. Climate-driven changes in diet composition and physiological stress in an arboreal folivore at the semi-arid edge of its distribution. Biol. Conserv. 2014, 172, 80–88. [Google Scholar] [CrossRef] [Green Version]
  6. McKenny, W.D.; Pedlar, J.H.; Lawrence, K.; Campbell, K.; Hutchinson, M.F. Potential impacts of climate change on the distribution of north American trees. Bioscience 2007, 57, 939–948. [Google Scholar] [CrossRef]
  7. Thomas, C.D.; Cameron, A.; Green, R.E.; Bakkenes, M.; Beaumont, L.J.; Collingham, Y.C.; Willimas, S.E. Extinction risk from climate change. Nature 2004, 427, 145–148. [Google Scholar] [CrossRef] [PubMed] [Green Version]
  8. Thuiller, W. Climate change and the ecologist. Nature 2007, 448, 550–552. [Google Scholar] [CrossRef] [Green Version]
  9. Xu, H.J.; Wang, X.P.; Zhao, C.Y. Diverse responses of vegetation growth to meteorological drought across climate zones and land biomes in northern China from 1981 to 2014. Agric. For. Meteorol. 2018, 262, 1–13. [Google Scholar] [CrossRef]
  10. Adhikari, D.; Barik, S.K.; Upadhya, K. Habitat distribution modeling for reintroduction of Ilex khasiana Purk., a critically endangered tree species of northeastern India. Ecol. Eng. 2012, 40, 37–43. [Google Scholar] [CrossRef]
  11. Baldwin, R.A. Use of Maximum Entropy Modeling in Wildlife Research. Entropy 2009, 11, 854–866. [Google Scholar] [CrossRef] [Green Version]
  12. Kamilar, J.M.; Beaudrot, L. Understanding primate communities: Recent developments and future directions. Evol. Anthropol. 2013, 22, 174–185. [Google Scholar] [CrossRef] [PubMed]
  13. Bakkenes, M.; Alkemade, J.R.M.; Ihle, F.; Leemans, R.; Latour, J.B. Assessing effects of forecasted climate change on the diversity and distribution of European higher plants for 2050. Glob. Chang. Biol. 2002, 8, 390–407. [Google Scholar] [CrossRef]
  14. Caminade, C.; Medlock, J.M.; Ducheyne, E.; McIntyre, K.M.; Leach, S.; Baylis, M.; Morse, A.P. Suitability of European climate for the Asian tiger mosquito aedes albopictus: Recent trends and future scenarios. J. R. Soc. Interface 2013, 9, 2708–2717. [Google Scholar] [CrossRef] [PubMed]
  15. Guisan, A.; Thuiller, W. Predicting species distribution: Offering more than simple habitat models. Ecol. Lett. 2005, 8, 993–1009. [Google Scholar] [CrossRef]
  16. Guo, Y.; Li, X.; Zhao, Z.; Wei, H.; Gao, B.; Gu, W. Prediction of the potential geographic distribution of the ectomycorrhizal mushroom tricholoma matsutake under multiple climate change scenarios. Sci. Rep. 2017, 7, 46221. [Google Scholar] [CrossRef]
  17. Liu, X.; Guo, Z.; Ke, Z.; Wang, S.; Li, Y. Increasing potential risk of a global aquatic invader in Europe in contrast to other continents under future climate change. PLoS ONE 2011, 6, e18429. [Google Scholar] [CrossRef] [PubMed]
  18. Peterson, A.T. Ecologic niche modeling and spatial patterns of disease transmission. Emerg. Infect. Dis. 2006, 12, 1822–1826. [Google Scholar] [CrossRef] [PubMed]
  19. Zimmermann, N.E., Jr.; Edwards, T.C.; Graham, C.H.; Pearman, P.B.; Svenning, J.C. New trends in species distribution modelling. Ecography 2010, 33, 985–989. [Google Scholar] [CrossRef]
  20. Sánchez, F.E. GARP modeling of natural and human factors affecting the potential distribution of the invasives Schismus arabicus and Brassica tournefortii, in ‘El Pinacate y Gran Desierto de Altar’ Biosphere Reserve. Ecol. Model. 2007, 204, 457–474. [Google Scholar] [CrossRef]
  21. Stockwell, D.R.; Beach, J.H.; Stewart, A. The use of the GARP genetic algorithm and internet grid computing in the Lifemapper world atlas of species biodiversity. Ecol. Model. 2006, 195, 139–145. [Google Scholar] [CrossRef]
  22. Beaumont, L.J.; Hughes, L.; Poulsen, M. Predicting species distributions: Use of climatic parameters in BIOCLIM and its impact on predictions of species’ current and future distributions. Ecol. Model. 2005, 186, 251–270. [Google Scholar] [CrossRef]
  23. Carpentar, G.; Gillison, A.N.; Winter, J. DOMAIN: A flexible modelling procedure for mapping potential distributions of plants and animals. Biodivers. Conserv. 1993, 2, 667–680. [Google Scholar] [CrossRef]
  24. Hirzel, A.H.; Hausser, J.; Chessel, D.; Perrin, N. Ecological-niche factor analysis: How to compute habitat-suitability maps without absence data? Ecology 2002, 83, 2027–2036. [Google Scholar] [CrossRef]
  25. Phillips, S.J.; Anderson, R.P.; Schapire, R.E. Maximum entropy modeling of species geographic distributions. Ecol. Model. 2006, 190, 231–259. [Google Scholar] [CrossRef]
  26. Elith, J.; Graham, C.H.; Anderson, R.P.; Dudík, M.; Ferrier, S.; Guisan, A.; Hijmans, R.J.; Huettmann, F.; Leathwick, J.R.; Lehmann, A.; et al. Novel methods improve prediction of species’ distributions from occurrence data. Ecography 2006, 29, 129–151. [Google Scholar] [CrossRef] [Green Version]
  27. Kumar, S.; Stohlgren, T.J. Maxent modelling for predicting suitable habitat for threatened and endangered tree Canacomyrica monticola in New Caledonia. J. Ecol. Nat. Environ. 2009, 1, 94–98. [Google Scholar]
  28. Costa, G.C.; Nogueira, C.; Machado, R.B.; Colli, G.R. Sampling bias and the use of ecological niche modeling in conservation planning: A field evaluation in a biodiversity hotspot. Biodivers. Conserv. 2009, 19, 883–899. [Google Scholar] [CrossRef]
  29. Hernandez, P.A.; Graham, C.H.; Master, L.L.; Albert, D.L. The effect of sample size and species characteristics on performance of different species distribution modeling methods. Ecography 2006, 29, 773–785. [Google Scholar] [CrossRef] [Green Version]
  30. Papeş, M.; Gaubert, P. Modelling ecological niches from low numbers of occurrences: Assessment of the conservation status of poorly known viverrids (Mammalia, Carnivora) across two continents. Divers. Distrib. 2007, 13, 890–902. [Google Scholar] [CrossRef]
  31. Pearson, R.G.; Raxworthy, C.J.; Nakamura, M.; Peterson, A.T. Original article: Predicting species distributions from small numbers of occurrence records: A test case using cryptic geckos in madagascar. J. Biogeogr. 2007, 34, 16. [Google Scholar] [CrossRef]
  32. Shcheglovitova, M.; Anderson, R.P. Estimating optimal complexity for ecological niche models: A jackknife approach for species with small sample sizes. Ecol. Model. 2013, 269, 9–17. [Google Scholar] [CrossRef]
  33. Wisz, M.S.; Hijmans, R.J.; Li, J.; Peterson, A.T.; Graham, C.H.; Guisan, A. Effects of sample size on the performance ofspecies distribution models. Biodivers. Lett. 2008, 14, 763–773. [Google Scholar]
  34. Phillips, S.J.; Miroslav, D.; Schapire, R.E. Maxent Software for Species Distribution Modeling. 2004. Available online: http://cs.princeton.edu/∼schapire/Maxent/ (accessed on 11 December 2015).
  35. Scheldeman, X.; Zonneveld, M.V. Training Manual on Spatial Analysis of Plant Diversity and Distribution; Biodiversity International: Rome, Italy, 2010; pp. 139–158. [Google Scholar]
  36. Tognelli, M.F.; Roig-Juñent, S.A.; Marvaldi, A.E.; Flores, G.E.; Lobo, J.M. An evaluation for methods on modelling distribution of Patagonian insects. Rev. Chil. Hist. Nat. 2009, 82, 347–360. [Google Scholar] [CrossRef]
  37. Fuller, D.O.; Ahumada, M.L.; Quiñones, M.L.; Herrera, S.; Beier, J.C. Near-present and future distribution of Anopheles albimanus in Mesoamerica and the Caribbean Basin modeled with climate and topographic data. Int. J. Health Geogr. 2012, 11, 13. [Google Scholar] [CrossRef] [PubMed] [Green Version]
  38. Reiss, H.; Cunze, S.; König, K.; Neumann, H.; Kröncke, I. Species distribution modelling of marine benthos: A North Sea case study. Mar. Ecol. Prog. Ser. 2011, 442, 71–86. [Google Scholar] [CrossRef]
  39. Xu, Z.; Zhao, C.; Feng, Z. Species distribution models to estimate the deforested area of picea crassifolia in arid region recently protected: Qilian Mts. National natural reserve (China). Pol. J. Ecol. 2012, 60, 515–524. [Google Scholar]
  40. Zhao, C.; Jia, Y.; Cheng, G.; Li, S.B. Estimation of leaf area index of Qinghai spruce (Picea crassifolia) forest using remote sensing in Qilian Mountains, Northwest China. In Proceedings of the 2007 IEEE International Geoscience and Remote Sensing Symposium, Barcelona, Spain, 23–27 July 2007; pp. 23–28. [Google Scholar]
  41. Irena, F.; Creed, I.F.; Noordwijk, M.V. Forest and Water on a Changing Planet: Vulnerability, Adaptation and Governance Opportunities; A Global Assessment Report; IUFRO World Series: Vienna, Austria, 2018; p. 192. [Google Scholar]
  42. Moritz, C.; Patton, J.L.; Conroy, C.J. Impact of a century of climate change on small-mammal communities in Yosemite National Park, USA. Science 2008, 322, 261–264. [Google Scholar] [CrossRef]
  43. Xu, Z.; Zhao, C.; Feng, Z.; Zhang, F.; Sher, H.; Wang, C.; Peng, H.; Wang, Y.; Zhao, Y.; Wang, Y. Estimating realized and potential carbon storage benefits from reforestation and afforestation under climate change: A case study of the Qinghai spruce forests in the Qilian Mountains northwestern China. Mitig. Adapt. Strateg. Glob. Chang. 2012, 18, 1257–1268. [Google Scholar] [CrossRef]
  44. Zhao, C.; Bie, Q.; Peng, H. Analysis of the Niche Space of Picea crassifolia on the Northern Slope of Qilian Mountains. Acta Ecol. Sin. 2010, 65, 113–121. [Google Scholar] [CrossRef]
  45. Weyant, J.; Azar, C.; Kainuma, M.; Kejun, J.; Nakicenovic, N.; Shukla, P.; Rovere, E.L.; Yohe, G. Report of 2.6Versus 2.9 Watts/m2 RCP Evaluation Panel; IPCC Secretariat: Geneva, Switzerland, 2009. [Google Scholar]
  46. Yang, X.Q.; Kushwaha, S.P.; Saran, S.; Xu, J.; Roy, P.S. MaxEnt modeling for predicting the potential distribution of medicinal plant Justicia adhatoda L. in Lesser Himalayan foothills. Ecol. Eng. 2013, 51, 83–87. [Google Scholar] [CrossRef]
  47. Fielding, A.H.; Bell, J.F. A review of methods for the assessment of prediction errors in conservation presence/absence models. Environ. Conserv. 2002, 24, 38–49. [Google Scholar] [CrossRef]
  48. Liu, C.; Berry, P.M.; Dawson, T.P.; Pearson, R.G. Selecting thresholds of occurrence in the prediction of species distributions. Ecography 2005, 28, 385–393. [Google Scholar] [CrossRef] [Green Version]
  49. Hijmans, R.J.; Cameron, S.E.; Parra, J.L.; Jones, P.G.; Jarvis, A. Very high resolution interpolated climate surfaces for global land areas. Int. J. Climatol. 2005, 25, 1965–1978. [Google Scholar] [CrossRef] [Green Version]
  50. Hijmans, R.J.; Graham, C.H. The ability of climate envelope models to predict the effect of climate change on species distributions. Glob. Chang. Biol. 2006, 12, 2272–2281. [Google Scholar] [CrossRef]
  51. Khafaga, O.; Hatab, E.E.; Omar, K. Predicting the potential geographical distribution of Nepeta septemcrenata in Saint Katherine Protectorate, South Sinai, Egypt using Maxent. Acad. Arena 2011, 3, 45–50. [Google Scholar]
  52. Remya, K.; Ramachandran, A.; Jayakumar, S. Predicting the current and future suitable habitat distribution of myristica dactyloides, gaertn. using maxent model in the eastern ghats, india. Ecol. Eng. 2015, 82, 184–188. [Google Scholar] [CrossRef]
  53. Cardillo, M.; Mace, G.M.; Gittleman, J.L.; Jones, K.E.; Bielby, J.; Purvis, A. The predictability of extinction: Biological and external correlates of decline in mammals. Proc. Biol. Sci. 2008, 275, 1441–1448. [Google Scholar] [CrossRef] [PubMed]
  54. Purvis, A.; Gittleman, J.L.; Cowlishaw, G.; Mace, G.M. Predicting extinction risk in declining species. Proc. Biol. Sci. 2000, 267, 1947–1952. [Google Scholar] [CrossRef] [Green Version]
  55. Profirio, L.L.; Harris, R.M.; Lefroy, E.C.; Hugh, S.; Gould, S.F.; Lee, G. Improving the use of species distribution models in conservation planning and management under climate change. PLoS ONE 2014, 9, e113749. [Google Scholar] [CrossRef]
  56. Sinclair, S.J.; White, M.D.; Newell, G.R. How useful are species distribution models for managing biodiversity under future climates? Ecol. Soc. 2010, 15, 8. [Google Scholar] [CrossRef]
  57. Lozier, J.D.; Aniello, P.; Hickerson, M.J. Predicting the distribution of Sasquatch in western North America: Anything goes with ecological niche modelling. J. Biogeogr. 2009, 36, 1623–1627. [Google Scholar] [CrossRef]
  58. Elith, J.; Phillips, S.J.; Hastie, T.; Dudík, M.; Chee, Y.E.; Yates, C.J. A statistical explanation of Maxent for ecologists. Divers. Distrib. 2011, 17, 43–57. [Google Scholar] [CrossRef]
  59. Ranjitkar, S.; Xu, J.; Shrestha, K.K.; Kindt, R. Ensemble forecast of climate suitability for the Trans-Himalayan Nyctaginaceae species. Ecol. Modell. 2014, 282, 18–24. [Google Scholar] [CrossRef]
  60. Hirzel, A.H.; Le, L.G. Habitat suitability modelling and niche theory. J. Appl Ecol. 2008, 45, 1372–1381. [Google Scholar] [CrossRef] [Green Version]
  61. Guisan, A.; Graham, C.H.; Elith, J.; Huettmann, F. Sensitivity of predictive species distribution models to change in grain size. Divers Distrib. 2007, 13, 332–340. [Google Scholar] [CrossRef]
  62. Peng, S.; Zhao, C.; Xu, Z.; Ashiq, M.W. Restoration and conservation potential of destroyed Qinghai spruce (Picea crassifolia) forests in the Qilian Mountains of northwest China. Mitig. Adapt. Strateg. Glob. Chang. 2014, 21, 153–165. [Google Scholar] [CrossRef]
  63. Kosaka, Y.; Nakamura, H.; Watanabe, M.; Kimoto, M. Analysis on the dynamics of a wave-like tele- connection pattern along the summertime Asian jet based on a reanalysis dataset and climate model simulations. J. Meteor. Soc. Jpn. 2009, 87, 561–580. [Google Scholar] [CrossRef]
  64. Song, F.; Zhou, T.; Wang, L. Two modes of the Silk Road pattern and their interannual variability simulated by LASG/IAP AGCM SAMIL2.0. Adv. Atmos. Sci. 2013, 30, 908–921. [Google Scholar] [CrossRef]
  65. Song, F.; Zhou, T. FGOALS-s2 simulation of upper-level jet streams over East Asia: Mean state bias and synoptic-scale transient eddy activity. Adv. Atmos. Sci. 2013, 30, 739–753. [Google Scholar] [CrossRef]
  66. Monteith, K.L.; Klaver, R.W.; Hersey, K.R.; Holland, A.A.; Thomas, T.P.; Kauffman, M.J. Effects of climate and plant phenology on recruitment of moose at the southern extent of their range. Oecologia 2015, 178, 1137–1148. [Google Scholar] [CrossRef] [PubMed]
  67. Xu, Z.; Zhao, C.; Feng, Z. A study of the impact of climate change on the potential distribution of Qinghai spruce (Picea crassifolia) in Qilian Mountains. Acta Ecol. Sin. 2009, 29, 278–285. [Google Scholar] [CrossRef]
  68. Zhou, T.; Song, F.; Chen, X. Historical evolution of global and regional surface air temperature simulated by FGOALS-s2 and FGOALS-g2: How reliable are the model results? Adv. Atmos. Sci. 2013, 30, 638–657. [Google Scholar] [CrossRef]
  69. Al-Qaddi, N.; Vessella, F.; Stephan, J.; Al-Eisawi, D.; Schirone, B. Current and future suitability areas of kermes oak (Quercuscoccifera L.) in the Levant under climate change. Reg. Environ. Chang. 2016, 17, 143–156. [Google Scholar] [CrossRef]
  70. Gong, M.; Guan, T.; Hou, M.; Liu, G.; Zhou, T. Hopes and challenges for giant panda conservation under climate change in the Qinling Mountains of China. Ecol. Evol. 2016, 7, 596–605. [Google Scholar] [CrossRef] [Green Version]
  71. Graham, M.H. Confronting multicollinearity in ecological multiple regression. Ecol. Lett. 2003, 84, 2809–2815. [Google Scholar] [CrossRef]
  72. Qin, Z.; Zhang, J.E.; Ditommaso, A.; Wang, R.L.; Liang, K.M. Predicting the potential distribution of lantana camara l. under rcp scenarios using ISI-MIP models. Clim. Chang. 2016, 134, 193–208. [Google Scholar] [CrossRef]
  73. Cruz-Cárdenas, G.; López-Mata, L.; Silva, J.T.; Bernal-Santana, N.; Estrada-Godoy, F.; López-Sandoval, J.A. Potential distribution model of Pinaceae species under climate change scenarios in Michoacán. Revista Chapingo Serie Ciencias Forestales y del Ambiente 2016, 22, 135–148. [Google Scholar] [CrossRef]
  74. Zhang, Q.; Wen, J.; Chang, Z.Q.; Xie, C.X.; Song, J.Y. Evaluation and prediction of ecological suitability of medicinal plant American ginseng (panax quinquefolius). Chin. Herb. Med. 2018, 10, 80–85. [Google Scholar] [CrossRef]
  75. Hu, J.; Jiang, Z. Predicting the potential distribution of the endangered Przewalski’s gazelle. J. Zool. 2010, 282, 54–63. [Google Scholar] [CrossRef]
  76. Hu, J.; Jiang, Z. Climate Change Hastens the Conservation Urgency of an Endangered Ungulate. PLoS ONE 2011, 6, e22873. [Google Scholar] [CrossRef]
  77. Ren, Z.; Wang, D.; Ma, A.; Hwang, J.; Bennett, A.; Sturrock, H.J.W.; Fan, J.; Zhang, W.; Yang, D.; Feng, X.; et al. Predicting malaria vector distribution under climate change scenarios in China: Challenges for malaria elimination. Sci. Rep. 2016, 6, 20604. [Google Scholar] [CrossRef] [Green Version]
  78. Tuanmu, M.N.; Viña, A.; Winkler, J.A.; Li, Y.; Xu, W.; Ouyang, Z.; Liu, J. Climate-change impacts on understorey bamboo species and giant pandas in China’s Qinling Mountains. Nat. Clim. Chang. 2012, 3, 249–253. [Google Scholar] [CrossRef]
  79. Araújo, M.B.; Luoto, M. The importance of biotic interactions for modelling species distributions under climate change. Glob. Ecol. Biogeogr. 2007, 16, 743–753. [Google Scholar] [CrossRef]
  80. Boulangeat, I.; Gravel, D.; Thuiller, W. Accounting for dispersal and biotic interactions to disentangle the drivers of species distributions and their abundances. Ecol. Lett. 2012, 15, 584–593. [Google Scholar] [CrossRef] [Green Version]
Figure 1. Location of the study area in Gansu Province, China, and its digital elevation model (DEM).
Forests 10 00062 g001
Figure 2. (A) The results of the jackknife test of variables’ contribution in modeling Qinghai spruce’s habitat distribution under current climate condition; (B) The results of the jackknife test of variables’ contribution in modeling Qinghai spruce’s habitat distribution under climate change scenarios RCP2.6; (C) The results of the jackknife test of variables’ contribution in modeling Qinghai spruce’s habitat distribution under climate change scenarios RCP4.5; (D) The results of the jackknife test of variables’ contribution in modeling Qinghai spruce’s habitat distribution under climate change scenarios RCP6.0; (E) The results of the jackknife test of variables’ contribution in modeling Qinghai spruce’s habitat distribution under climate change scenarios RCP8.5.(The regularized training gain describes how much better the Maxent distribution fits the presence data compared to a uniform distribution. The dark blue bars indicate the gain from using each variable in isolation, the light blue bars indicate the gain lost by removing the single variable from the full model, and the red bar indicates the gain using all of the variables)., 34% in, 33.9% in RCP4.5, 33.8% in RCP6.0, and 30.5% in RCP8.5.
Forests 10 00062 g002
Figure 3. Response curves of seven environmental variables in Qinghai spruce’s habitat distribution model. Bio1: Annual Mean Temperature (°C *10); Bio2: Mean Diurnal Temperature Range (Mean of monthly (max temp minus min temp)) (°C *10); Bio3: Isothermality (P2/P7) (*100), Bio8: Mean temperature of wettest quarter (°C *10); Ele: elevation (m); Asp: aspect (°); Slo: slope (°).
Forests 10 00062 g003
Figure 4. The actual distribution and potential of Qinghai spruce under current climate and four scenarios.
Forests 10 00062 g004
Figure 5. The transfer matrix of Qinghai spruce’ potential distribution area between current and four future climatic scenarios(A1: UA to UA, A2: UA to LA, A3: UA to MA, A4: UA to HA, B1: LA to UA, B2: LA to LA, B3: LA to MA, B4: LA to HA, C1: MA to UA, C2: MA to LA, C3: MA to MA, C4: MA to HA, D1: HA to UA, D2: HA to LA, D3: HA to MA, D4:HA to HA. UA: Unsuitable area; LA: Low suitability area; MA: Moderate suitability area; 4, HA: High suitability area).
Forests 10 00062 g005
Table 1. 22 Environmental variables downloaded and variables contribution rate (%) to the species distribution under each scenario.
CodeEnvironmental VariablesUnitCurrentRCP2.6RCP4.5RCP6.0RCP8.5
Bio1Annual mean temperature°C16.015.522.323.727.0
Bio2Mean diurnal range (mean of monthly (max temp-min temp))°C10.48.013.413.58.7
Bio3Isothermality (Bio2/Bio7) (*100) 6.06.15.04.38.5
Bio4Temperature seasonality (standard deviation×100)C of V
Bio5Maximum temperature of warmest month°C
Bio6Minimum temperature of coldest month°C
Bio7Temperature annual range (Bio5–Bio6)°C
Bio8Mean temperature of wettest quarter°C24.424.019.917.917.5
Bio9Mean temperature of driest season°C
Bio10Mean temperature of warmest season°C
Bio11Mean temperature of coldest season°C
Bio12Annual precipitationmm
Bio13Precipitation of wettest periodmm
Bio14Precipitation of driest periodmm
Bio15Precipitation seasonality C of V
Bio16Precipitation of wettest seasonmm
Bio17Precipitation of driest seasonmm
Bio18Precipitation of warmest seasonmm
Bio19Precipitation of coldest seasonmm
EleElevationm29.230.123.523.721.3
SloSlopeº11.514.113.814.714.7
AspAspectº2.52.32.12.22.4
The variables in bold were key variables selected by their contribution rates and multi-collinearity test. RCP: (Representative Concentration Pathway).
Table 2. Climatic variables selected in this study and their percent contribution to each scenario.
VariablesCurrentRCP2.6RCP4.5RCP6.0RCP8.5
meanmeanChange rate (%)meanChange rate (%)meanChange rate (%)meanChange rate (%)
Bio1−16.203.00−118.5210.50−164.8111.50−170.9924.8−253.09
Bio2126.51126.650.11126.25−0.21125.77−0.58125.11−1.11
Bio332.3032.02−0.8731.74−1.7331.56−2.2931.25−3.25
Bio894.59112.1318.54122.2029.19123.1630.20137.4045.26
Note: change rate is the ratio of mean under different scenarios minus mean under current to mean under current, Bio1: Annual Mean Temperature (°C *10); Bio2: Mean Diurnal Temperature Range (Mean of monthly (max temp minus min temp)) (°C*10); Bio3: Isothermally (P2/P7) (*100), Bio8: Mean temperature of wettest quarter (°C *10).
Table 3. Results of receiver operating characteristic (ROC) analysis under current climate and four future scenarios.
AUCCurrentRCP2.6RCP4.5RCP6.0RCP8.5
AUC (Training data)0.9800.9810.9820.9810.981
AUC (Test data)0.9680.9680.9690.9680.964
Table 4. Habitat suitability classes area of Qinghai spruce.
CurrentRCP2.6RCP4.5RCP6.0RCP8.0
Unsuitable area (km2)16,362.616,446.416,481.016,498.917,315.2
Low suitability area (km2)2994.13191.03189.83117.83191.4
Moderate suitability area (km2)4250.74126.54040.83952.931913.6
High suitability area (km2)1312.01155.61207.91349.91221.3
Total suitability area (km2)8556.88473.18438.58420.67604.2
Change area (km2) −83.8−118.4−136.3−857.6
Percent (%)34.334.033.933.830.5
Table 5. The statistic area of Qinghai spruce’ actual distribution in four classes under current and four scenarios.
ClassesCurrentRCP2.6RCP4.5RCP6.0RCP8.5
Area (km2)Percent (%)Area (km2)Percent (%)Area (km2)Percent (%)Area (km2)Percent (%)Area (km2)Percent (%)
Unsuitable60.74.3138.29.7137.79.7138.89.8185.013.0
Moderate suitability323.522.7251.617.7262.518.5259.018.2199.414.4
High suitability654.246.0679.547.8647.445.5633.544.5644.345.3
Total suitability area383.727.0352.824.8374.526.3390.727.5388.727.3

