Article

Improving CLOPE’s Profit Value and Stability with an Optimized Agglomerative Approach

1
School of Information Science and Technology, Donghua University, Shanghai 201620, China
2
School of Computer Science and Technology, Donghua University, Shanghai 201620, China
*
Author to whom correspondence should be addressed.
Algorithms 2015, 8(3), 380-394; https://doi.org/10.3390/a8030380
Submission received: 4 May 2015 / Revised: 12 June 2015 / Accepted: 12 June 2015 / Published: 26 June 2015
(This article belongs to the Special Issue Clustering Algorithms)

Abstract

:
CLOPE (Clustering with sLOPE) is a simple and fast histogram-based clustering algorithm for categorical data. However, given the same data set with the same input parameter, the clustering results by this algorithm would possibly be different if the transactions are input in a different sequence. In this paper, a hierarchical clustering framework is proposed as an extension of CLOPE to generate stable and satisfactory clustering results based on an optimized agglomerative merge process. The new clustering profit is defined as the merge criteria and the cluster graph structure is proposed to optimize the merge iteration process. The experiments conducted on two datasets both demonstrate that the agglomerative approach achieves stable clustering results with a better profit value, but costs much more time due to the worse complexity.

1. Introduction

Clustering is an important data mining technology that groups data into certain sets with maximizing the intra-cluster similarity and minimizing the inter-cluster similarity [1]. Most clustering algorithms focus on numerical data. Distances between two data points are calculated as the clustering criterion. However, a lot of databases handle transactions with categorical attributes whose clustering process seems to be different and more complicated than those of numerical ones. With the repaid growth of categorical data volume, the research of clustering methods for categorical data becomes increasingly important.
Among previous research works on clustering categorical data [2,3,4,5,6,7], CLOPE [6] is the representative one, which achieves relatively better clustering results with high efficiency based on cluster histogram calculation. Moreover, it has the following advantages. Firstly, the algorithm is simple and requires only one input parameter, which is easy to extend. In the second place, neither fuzzy theory nor probability calculation is used, thus the clustering result is accurate and direct. Finally, the algorithm automatically stops until no further iteration could be done, and the output number of clusters is absolutely determined by the input data and the only parameter instead of being specified by user such as k-means and ROCK [3]. Some improved methods have been proposed based on CLOPE algorithm. For example, Ong proposed SCLOPE [8] and σ-SCLOPE [9] algorithm for clustering categorical data streams [10] based on a FP-Growth tree structure [11]. Li proposed fuzzy-CLOPE algorithm [12]. However, there is one crucial problem which has been ignored among CLOPE and its extensions. That is the clustering results are unstable and greatly influenced by the transaction order in the dataset. Given the exactly same dataset and input parameter, if each transaction is read in another order, the clustering result would seem to be different, thus the profit value might not be optimal.
We deeply analyze the clustering process of CLOPE algorithm and find that since CLOPE algorithm only moves one transaction at a time during each round of iteration, it is difficult to find the best combinations of transactions to form an “optimal” clustering result and achieve stable satisfactory clustering results. To deal with this problem, an optimized agglomerative approach is proposed for categorical data. In the proposed method, each transaction in the dataset is treated as a single cluster in initial. Then the new clustering profit is defined as the criteria to merge the initial clusters as an extension from CLOPE. Such process is iterated until no clusters are merged and then the clustering process is automatically stopped that also meets the feature of CLOPE. Finally, the optimized method based on the cluster graph is proposed to reduce the merge iteration process. On this basis, this approach can effectively handle the unstable problem from CLOPE. The experiments conducted on the mushroom dataset and the splice-junction gene sequences dataset both demonstrate that the agglomerative approach achieves stable clustering results with a better profit value, but costs much more time due to the worse complexity.

2. The CLOPE Algorithm
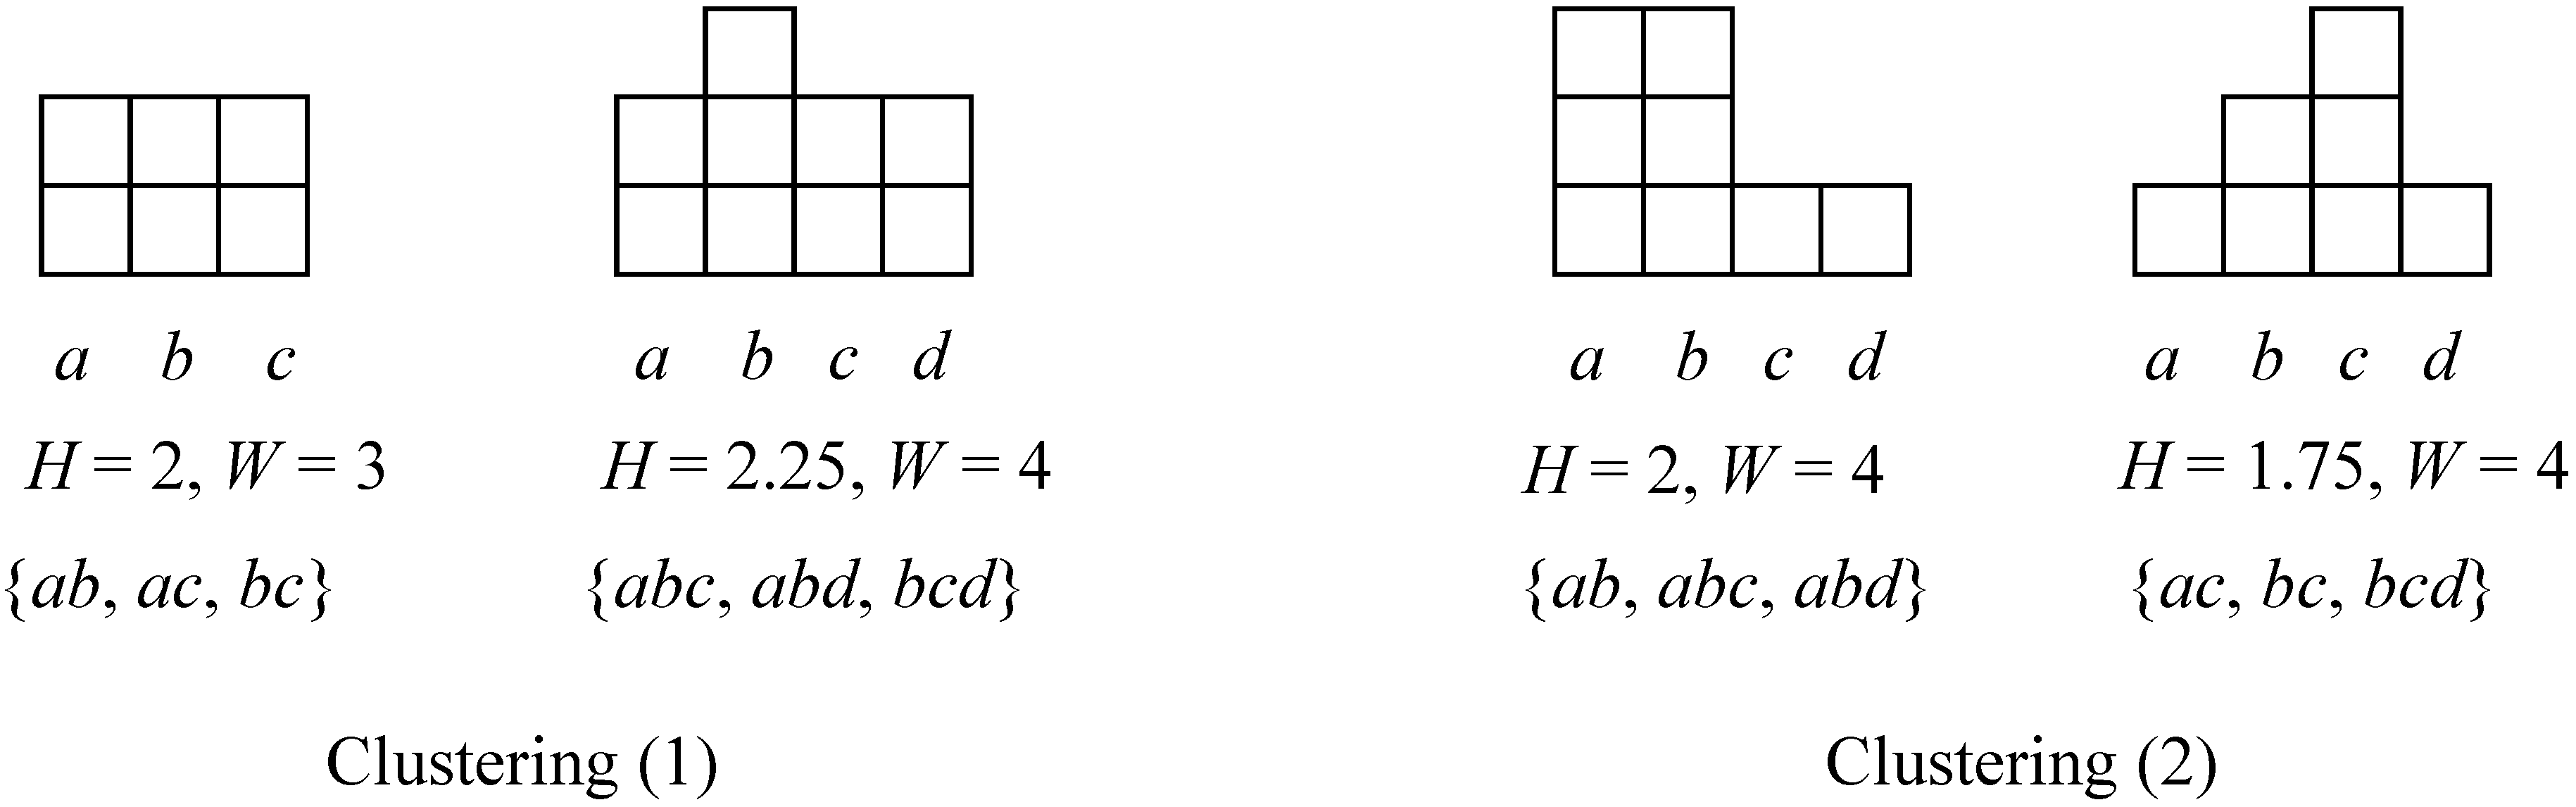
CLOPE is a histogram-based clustering algorithm for categorical data. It uses the conception of “profit” as criterion function that tries to increase the intra-cluster overlapping categorical attributes according to a height-to-width ratio of each cluster. If the sum of all the height-to-weight ratio values is maximum, the clustering result is considered to be optimal. The following example describes a simple case of categorical transactions using CLOPE.
Suppose there is a small database containing six transactions: {ab, ac, bc, abc, abd, bcd}. For this database, we want to compare the following two clustering (1) {{ab, ac, bc}, {abc, abd, bcd}} and (2) {{ab, abc, abd}, {ac, bc, bcd}}. By calculating the occurrence of each attribute, we can obtain the height (H) and width (W) of each cluster. For instance, cluster {ab, abc, abd} has occurrence of a:3, b:3, c:1 and d:1, then W = 4 and H = (3 + 3 + 1 + 1)/4 = 2. Figure 1 shows the histogram of the two clustering. According to the comparison of sum values of height-to-width ratio, 2/3 + 2.25/4 is greater than 2/4 + 1.75/4, reflecting that clustering (1) has better intra-cluster similarity compared to clustering (2). The detailed terminologies of CLOPE algorithm are defined in Section 2.1.
Figure 1. Histograms of the two clustering.
Algorithms 08 00380 g001

2.1. Terminologies

Let D = { t 1 , t 2 , , t n } denotes as a database containing n transactions, and I = { i 1 , i 2 , i m } to be all the attributes in D. On this basis, we have the following definitions.
Definition 1 (Transaction). A transaction t in D is a tuple < key , A > , where key is the title of the transaction and A = { i a , i b , } I is the attribute set in this transaction.
Definition 2 (Cluster). A cluster c is a tuple < T ¯ , H ¯ > where T ¯ = { t a , t b , } D is a set of transactions and H ¯ is the histogram of cluster c.
Definition 3 (Histogram). If occ(i, c) represents the occurrence of attribute i in cluster c, then the histogram of cluster c could be symbolized as c . H ¯ = { ( i , occ ( i , c ) ) | occ ( i ,c)>0,iI} = { ( i , occ ( i , c ) ) | occ ( i ,c)>0,iI}={(i,occ(i,c))|occ(i,c)>0,iI} .
In addition, we have the following properties for histogram H ¯ :
(1)
The size is the total number of attributes in cluster c, defined as:
S ( c ) = k = 1 N occ ( i k , c )
(2)
The width is the total number of different attributes in cluster c, defined as:
W ( c ) = | { occ ( i , c ) > 0 | i I } | W ( c ) = | { occ ( i , c ) > 0 | i I } |
(3)
The height is the ratio between the size and the width, defined as:
H ( c ) = S ( c ) / W ( c )
(4)
The number of transactions in cluster c, defined as | c | .
Definition 4 (Clustering). A clustering C is a set of all the clusters, i.e., C = { c1 , c2 , cp} .
Definition 5 (Profit of Clustering). Suppose a clustering C contains p clusters, the profit value is defined as:
Profit r ( C ) = k = 1 p S ( c k ) W ( c k ) r × | c k | k = 1 p | c k | |
According to the CLOPE paper, the theoretical purpose of CLOPE algorithm is to find a clustering C that maximizes Profit(C) to produce the best histogram, given a database D and the repulsion factor r. In addition, the author pointed out that the profit value of clustering C is only affected by the distribution of transactions in each clusters, which is the numerator part of Equation (4).
The CLOPE algorithm contains two phases. In the initialization phase, each transaction is sequentially read and placed into the best cluster that would maximize the profit value of current clustering. The iteration phase includes a loop that reads transactions from head to tail and tries to move each of them into the best cluster that maximizes the profit value of clustering. The loop does not end until no transactions are moved into a new cluster. Unfortunately, the proposed CLOPE algorithm is unable to find a clustering C that maximizes Profit(C) as it claimed. Details of this core problem are discussed in the next subsection.

2.2. Problem Discovery

The hidden problem of CLOPE can be exposed by a simple example.
Example 1. Given r = 2.0 and a small database with two different input sequence of transactions: ① {ab, ac, bc, abd, acd, bcd}, ② {bcd, acd, abd, bc, ac, ab}, CLOPE produces different clustering results as C1:{{ab, abd}, {ac, acd}, {bc, bcd}} and C2:{bcd, acd, abd, bc, ac, ab} respectively.
This example reveals two major deficiencies of CLOPE. For the first, it is intuitive that CLOPE is unstable, as different input sequence might produce different clustering results. In the second place, as Profit ( C 1 ) = 5 3 2 × 2 + 5 3 2 × 2 + 5 3 2 × 2 6 0.556 and Profit(C2)=1542×66=0.9375 , CLOPE algorithm might not find a proper clustering that has the best histogram in most time.
It is sure that no more movements of a single transaction would occur in C1:{{ab, abd}, {bc, bcd}, {ac,acd}}, but merging cluster {ab, abd} with either {bc, bcd} or {ac, acd} could both further enhance the profit value. As a result, a merge operation is required on all the proper clusters not only to eliminate the effect by input sequence but also to achieve a much better profit value at the end of each round of iteration.

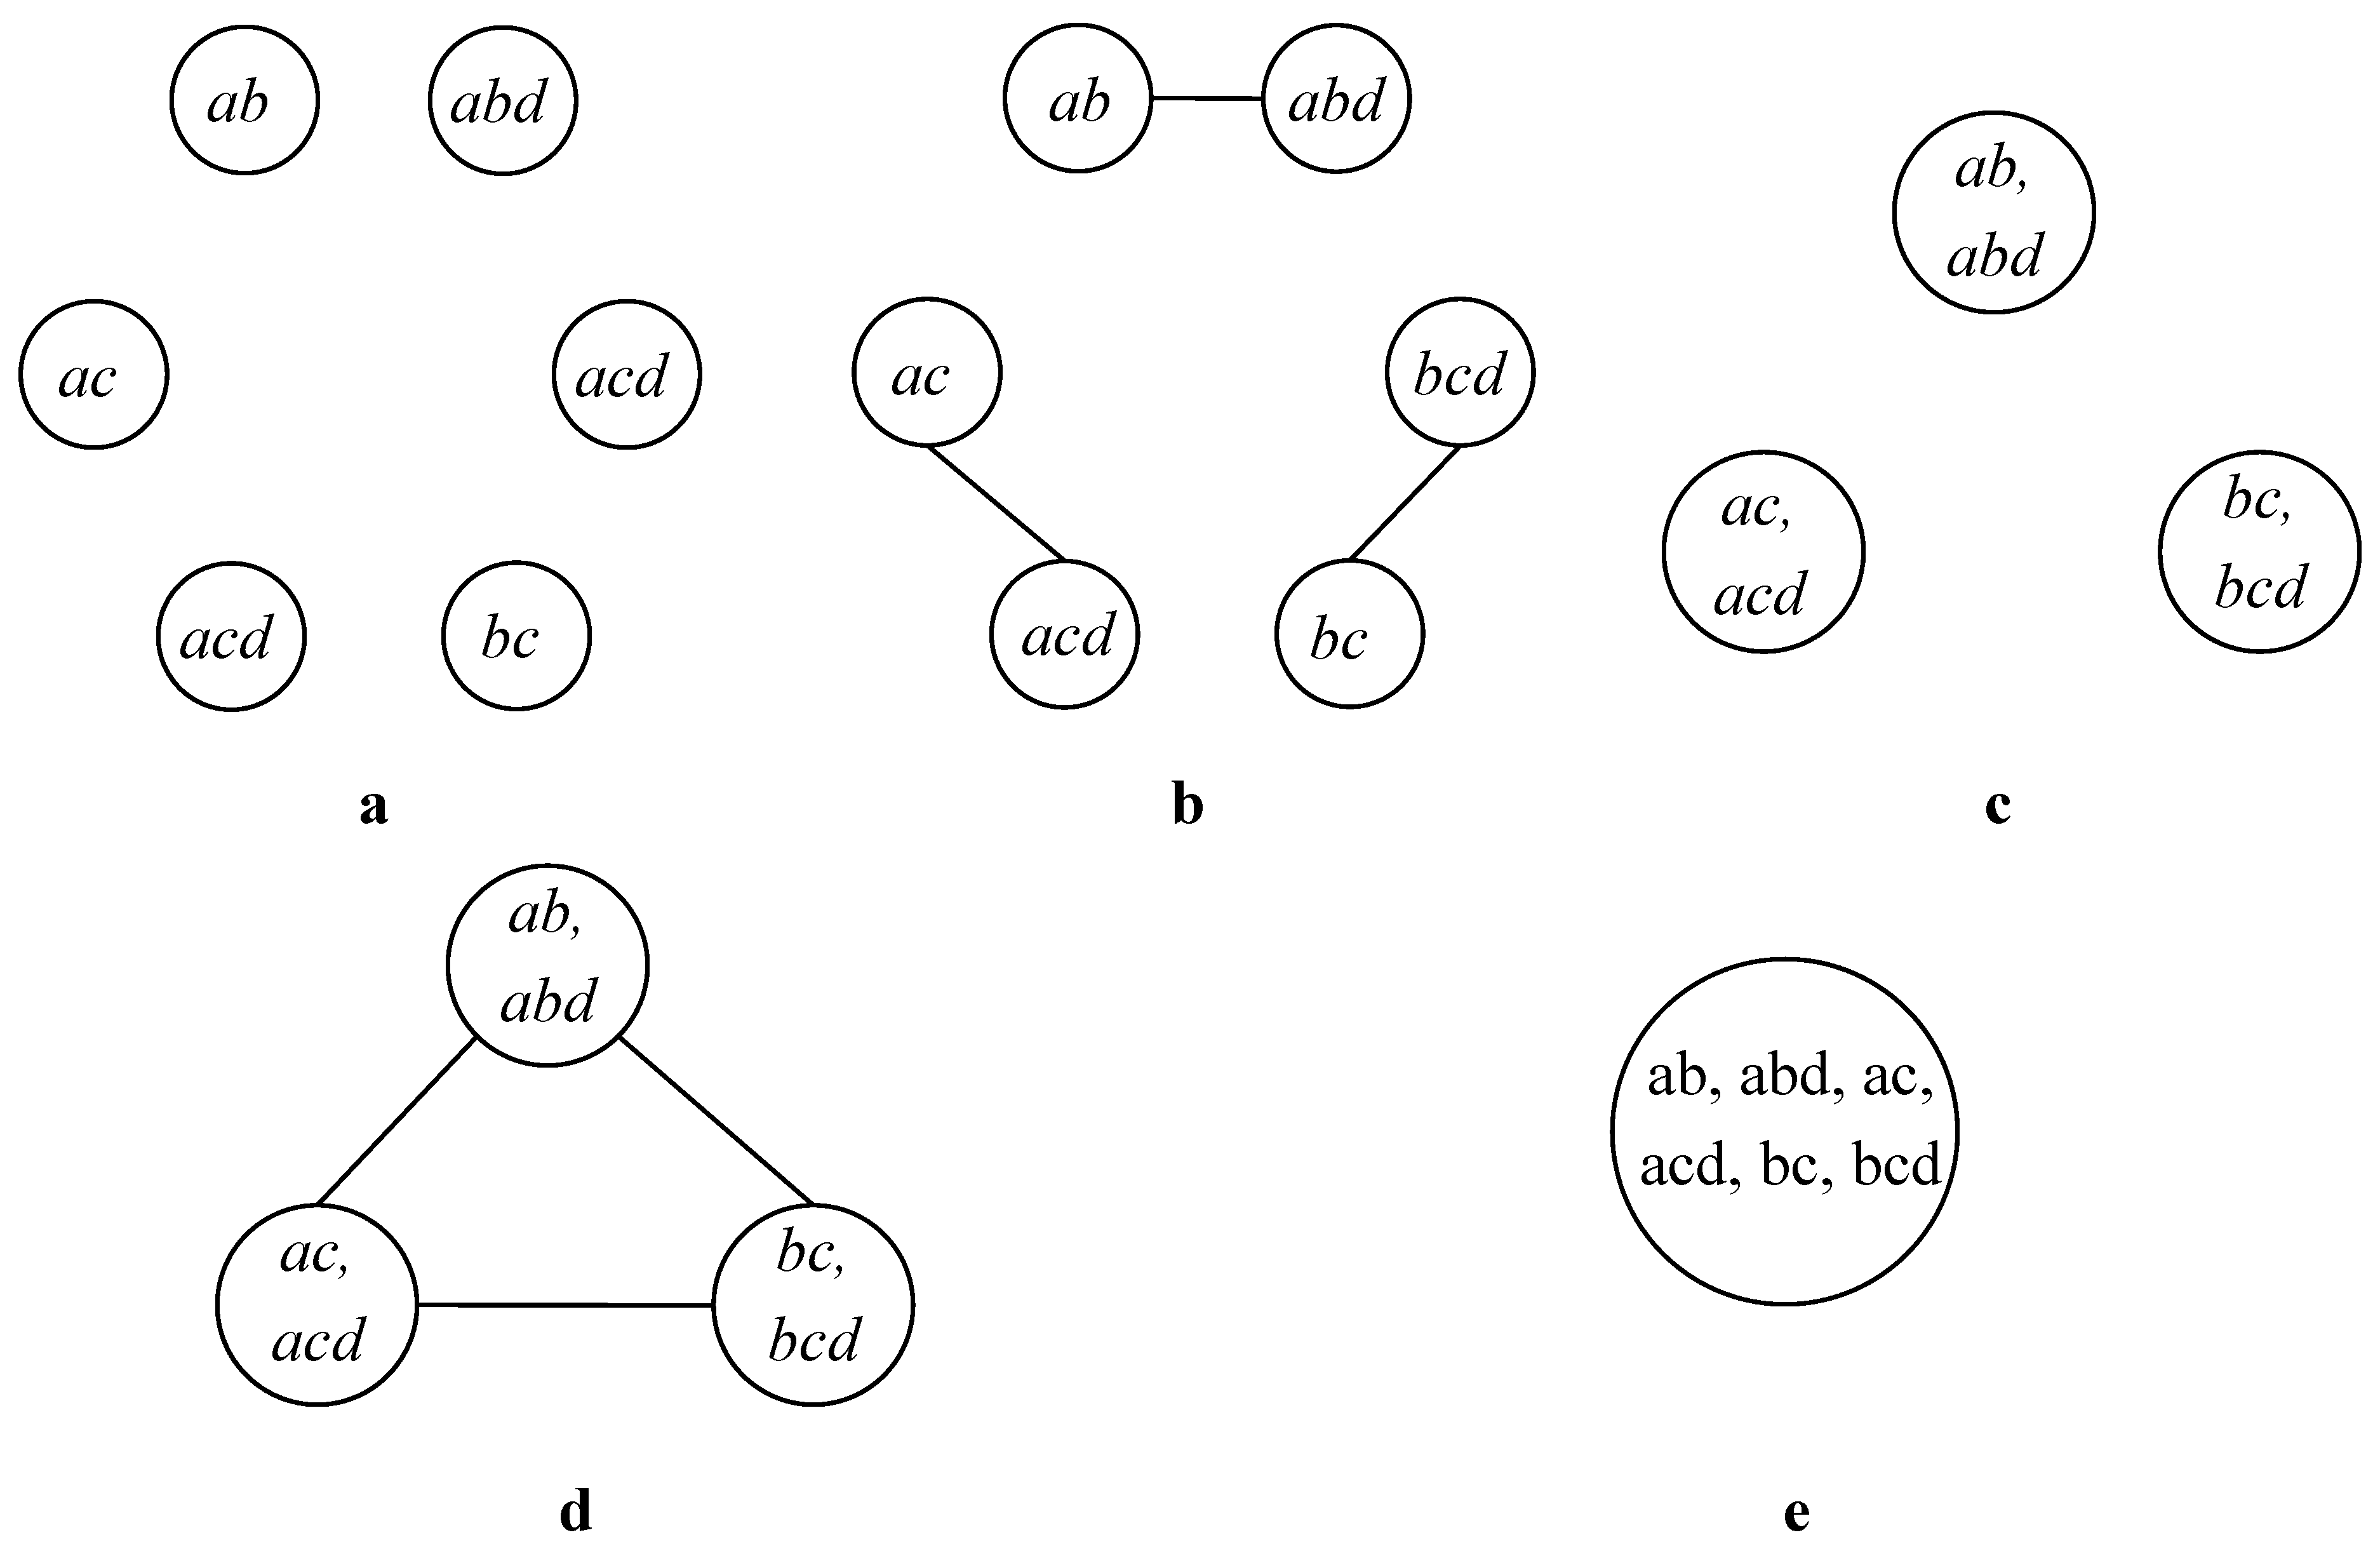
3. The Optimized Agglomerative Approach

We propose an optimized agglomerative clustering algorithm, Agg-CLOPE, to deal with the problem caused by movement of only one transaction illustrated in the previous section. Firstly, the terminologies from original CLOPE algorithm are extended to support cluster merge operation. Then a cluster graph structure is applied to optimize the traditional bottom-to-up clustering approach to achieve a stable clustering result with much better profit value.

3.1. Extension from CLOPE

As the CLOPE algorithm moves only one transaction from one cluster to another, it is required to extend the definitions and the corresponding data structures to support cluster merge operation.
Definition 6 (Extension of Cluster). A cluster c is a quadruple < i d , T ¯ , H ¯ , L ¯ > where id is the unique identification of c, L ¯ is a list of ids from other clusters related to c, and the rest are the same as those in Definition 1.
Definition 7 (Extension of Profit). The profit value of a cluster c is defined as follows:
Profit r ( c ) = S ( c ) W ( c ) r × | c |
Then the profit of a clustering C would be:
Profit r ( C ) = k = 1 p Profit r ( c k ) k = 1 p | c k |
Definition 8 (Delta): Suppose there are two clusters ci and cj, and ci/j is the merge of these two clusters. Then the Delta value of ci and cj is defined as follows:
Delta ( c i , c j ) = Profit ( c i / j ) ( Profit ( c i ) + Profit ( c j ) )
We use symbol Di,j short for Delta(ci,cj). Obviously the Delta function is symmetric that we have Di,j = Dj,i. We also define Di,i = 0 for the relationship of the same cluster. To maximize the profit value in each merge operation, the Delta value for a certain cluster should be maximal. Suppose there are totally p clusters, the maximum Delta value for cluster i is denoted as:
M ( c i ) = max ( { D i , k | k [ 1 , , p ] } )
If cj could maximize the Delta value of ci, then cj is the merge candidate of ci denoted as c i c j . A cluster might have more than one merge candidates, and all the unique ids of those merge candidates are stored in L ¯ according to Definition 6 for further process.

3.2. Optimization on Traditional Agglomerative Approach

Traditional agglomerative approach starts with each transaction staying in its own cluster, and then merges pairs of clusters to move up the hierarchy [13]. However, the cluster merge operation could not be undone, namely transactions could not be taken away from one cluster. It is required to perform merge operations on as optimal clusters as possible. For a single cluster, the best candidates should be picked out to be merged with. The following example expresses a situation of unsuitable candidates.
Example 2. Suppose there are three initial clusters {i:{abc}, j:{abd}, h:{bd}}, we have c i c j , c j c h and M ( c i ) < M ( c j ) .
In Example 2, cj is the merge candidate of ci, and ch is the merge candidate of cj. Although ci and cj comes before ch, cj should be merged with ch rather than ci, as the former would produce larger profit value for the current clustering. In other case, if M(ci) and M(cj) are both maximum among all the delta values, it is obvious that ci, cj and ch could be merge together to achieve optimal profit value. To deal with this phenomenon, we define a Global Maximum (GM) Delta value for all the Delta values.
G M = max { M ( c k ) | k [ 1 , , p ] }
If M ( c i ) = M ( c j ) = G M , it is sure that merging ci with cj is best, denoting as “ ci c j ”, as well as merging cj with ch. On this basis, we could make improvement on the traditional agglomerative approach.
Traditional agglomerative approach could only perform merge operation on two clusters at a time, which would not stop until all the transactions are in one cluster or the number of result clusters is specified. However, in this optimized approach, all the clusters linked with the GM value are able to merge at once, which saves a lot of time. Agg-CLOPE would automatically terminate until all Delta values are no more than zero and no further merge operations could be performed. We define the cluster graph to support this feature.
Definition 9 (Cluster Graph): A cluster graph is an undirected graph G = ( V , E ) where V is a set of vertices each of which representing a cluster and E contains edges that connect two vertices (clusters) with Delta value equals to GM.
Figure 2. (a) Initial state of G with each transaction in a cluster; (b) clusters meeting with Global Maximum (GM) value are linked; (c) Linked clusters are merged; (d) The remaining clusters are linked; (e) The final result contains only one cluster.
Algorithms 08 00380 g002
Figure 2 illustrates the clustering process on the transactions {ab, ac, bc, abd, acd, bcd} using Agg-CLOPE with r = 2.0. At the very beginning, each transaction is a cluster symbolized as a vertex in graph G (see Figure 2a). By calculating the Delta values of each two clusters, those meeting with the GM value are linked and to be merged (see Figure 2b). So at the end of the first round and the beginning of the second round, there are three new clusters remaining (see Figure 2c). The second round actually does the same as those in the first round. As all Delta values equal to GM, the clusters are linked with each other for the further merge operation (see Figure 2d). After that, there are no more clusters to be merged, and the algorithm ends with a final cluster including all the transactions (see Figure 2e).
Algorithm 1 Agg-CLOPE
			  /*Phase 1 - Initialization*/
			  1:  while not end of the database file
			  2:     read the next transaction t;
			  3:     cit; Vci;
			  4:  end while
			  /*Phase 2 - Iteration*/
			  5:  do
			  6:     merged=false; GM=0;
			  7:     for i=0 to V.size
			  8:        for j=i+1 to V.size
			  9:          if(Di,j>GM)
			  10:            GM=Di,j; clear(E); E.add(i, j);
			  11:            clear(ci.L ); ci.L.add(j);
			  12:            clear(cj.L ); cj.L.add(i);
			  13:          else if(Di,j==GM)
			  14:            E.add(i, j);.ci.L.add(j);cj.L.add(i);
			  15:          end if
			  16:        end for
			  17:      end for
			  18:      if (E.size>0)
			  19:        for each distinct c in E
			  20:          LinkMerge(c);
			  21:        End For
			  22:        clear(E); clear(M); merged=true;
			  23:     end if
			  24:   while(merged)
			  
The implementation of Agg-CLOPE is listed in Algorithm 1. Similar to CLOPE, this algorithm also contains two phases. In the initialization phase, each transaction is read and placed into its own cluster to form vertices in G (Lines 1–4). In the iteration phase, the delta values are calculated between each two clusters. Each calculation performs a comparison to the current GM value (Line 9 and Line 13). The content in E and current cluster’s L ¯ is cleared and renewed as the GM value is assigned to the current maximum delta value (Lines 10–12), otherwise the current edge is appended in E and the current vertices are added to the opponent’s L¯ (Line 14). If E is not empty, all the connective sub-graphs of G would be merged (Lines 18–23). Note that the main part of merge operation is done by LinkMerge, a recursive function shown in Algorithm 2. Agg-CLOPE would automatically terminate until no clusters to be merge, i.e., E is empty.
Suppose the total number of transactions is N, the current number of clusters is K and the average length of a transactions is A. Obviously the initialization phase takes O(N) time. In the iteration phase, the calculation of delta values requires O( K × K × A 2 ) time, and the recursive function is O(K) that is the same as depth first search on graph G. As K = N in the first round, it requires at least O( N 2 × A 2 ) + 2O(N), then the K value gradually shrinks in the next few rounds. The worst case would take N − 1 rounds, in each of which only two clusters are merged, resulting in O( N 3 × A 3 ) approximately. The best case takes only two rounds, where all the clusters are merged in the first round and no further operations are performed in the second round. However, compared with the time complexity of CLOPE-O( N × K × A), Agg-CLOPE is generally much slower to be its only and fatal defect.
Algorithm 2 LinkMerge
			  Parameter: c is a cluster(vertex) in cluster graph G
			  1:  If(c is not merged)
			  2:    for each k in c.L
			  3:      LinkMerge(ck);
			  4:    End For
			  5:  End If
			  

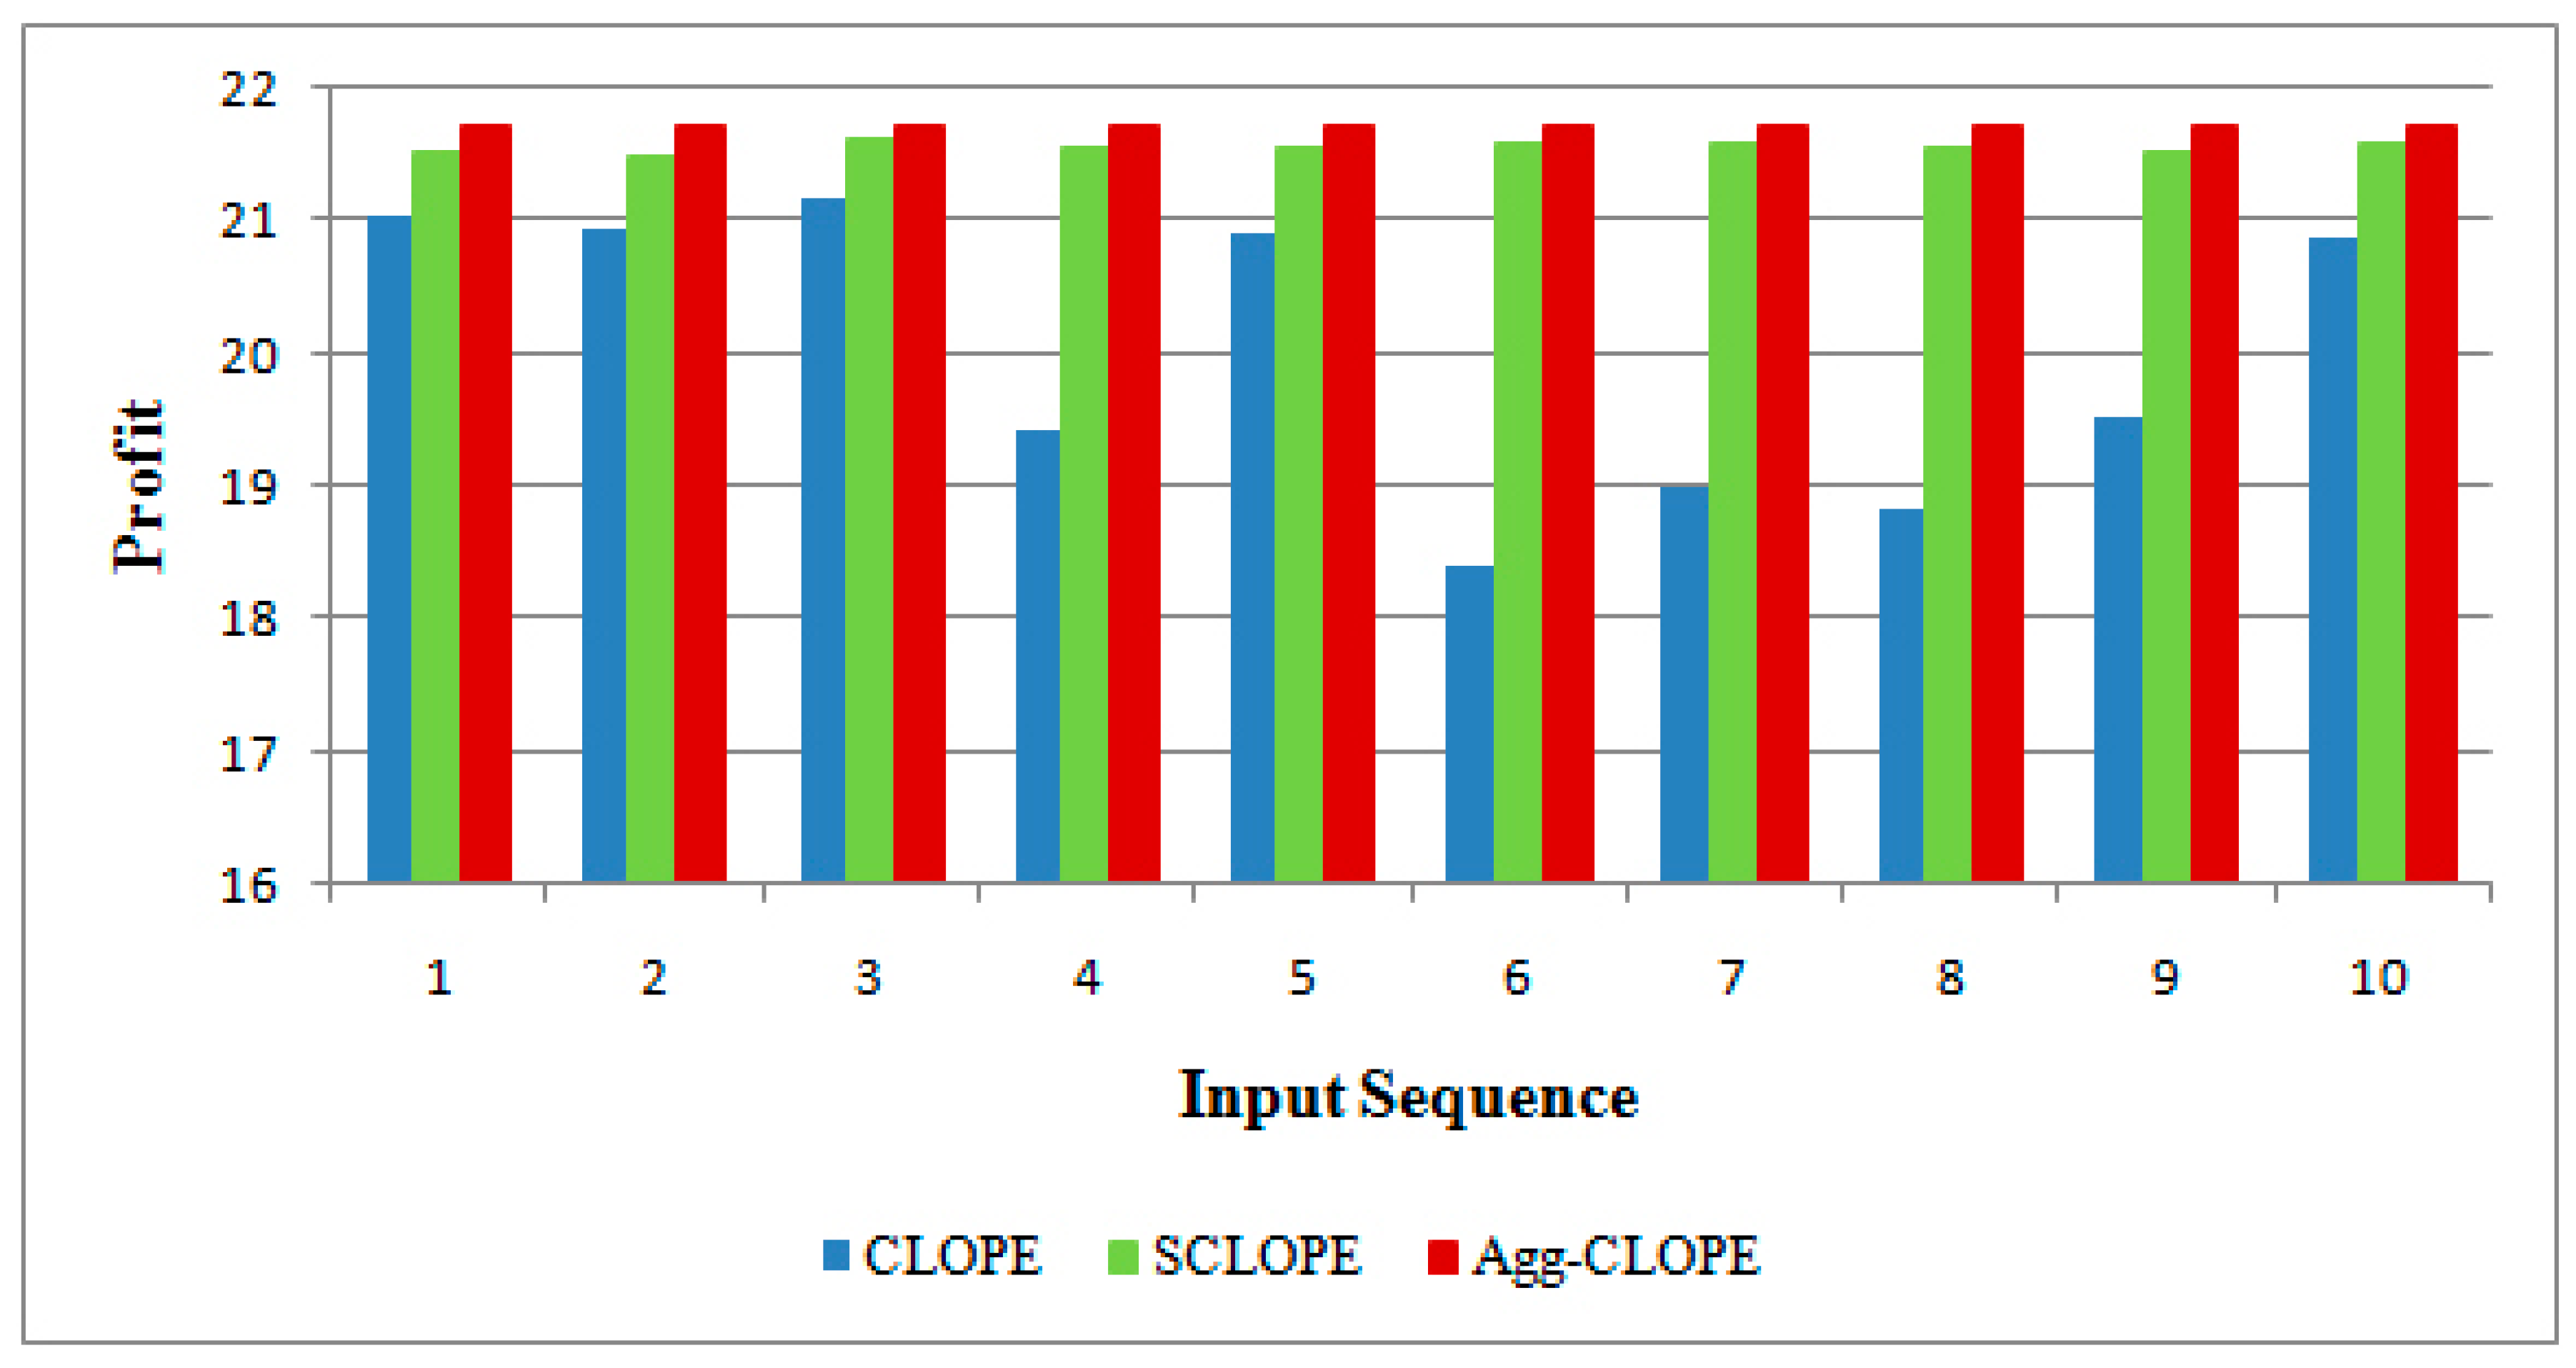
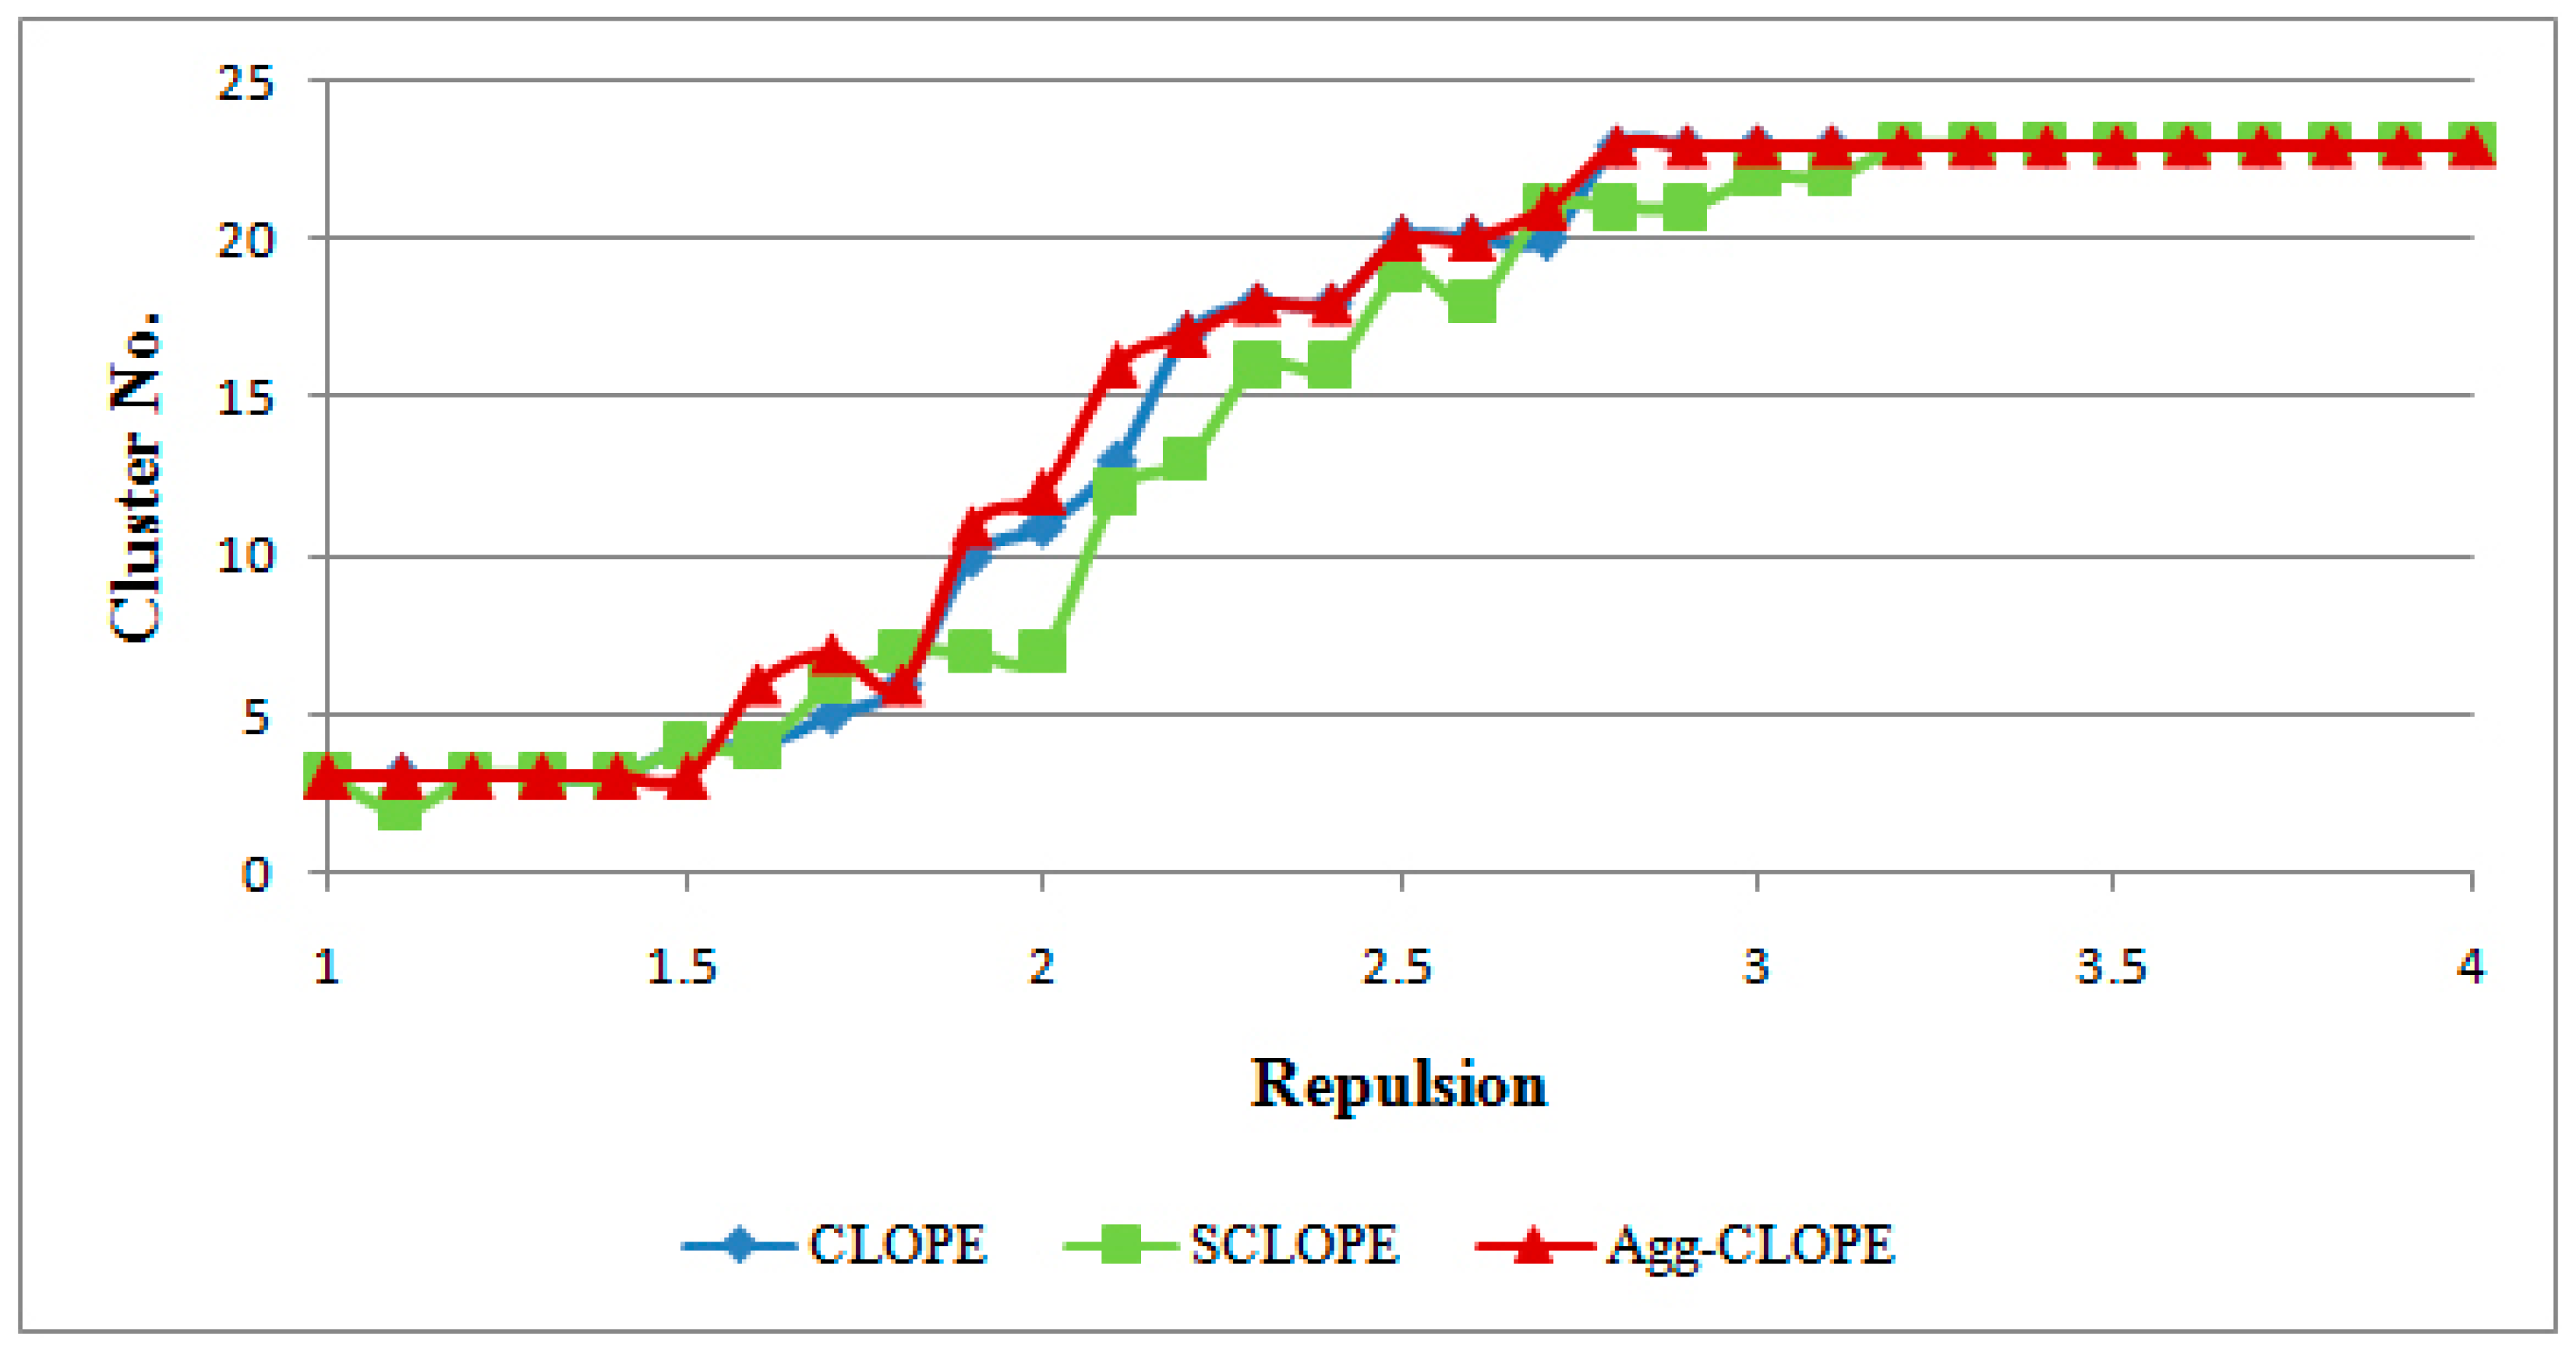
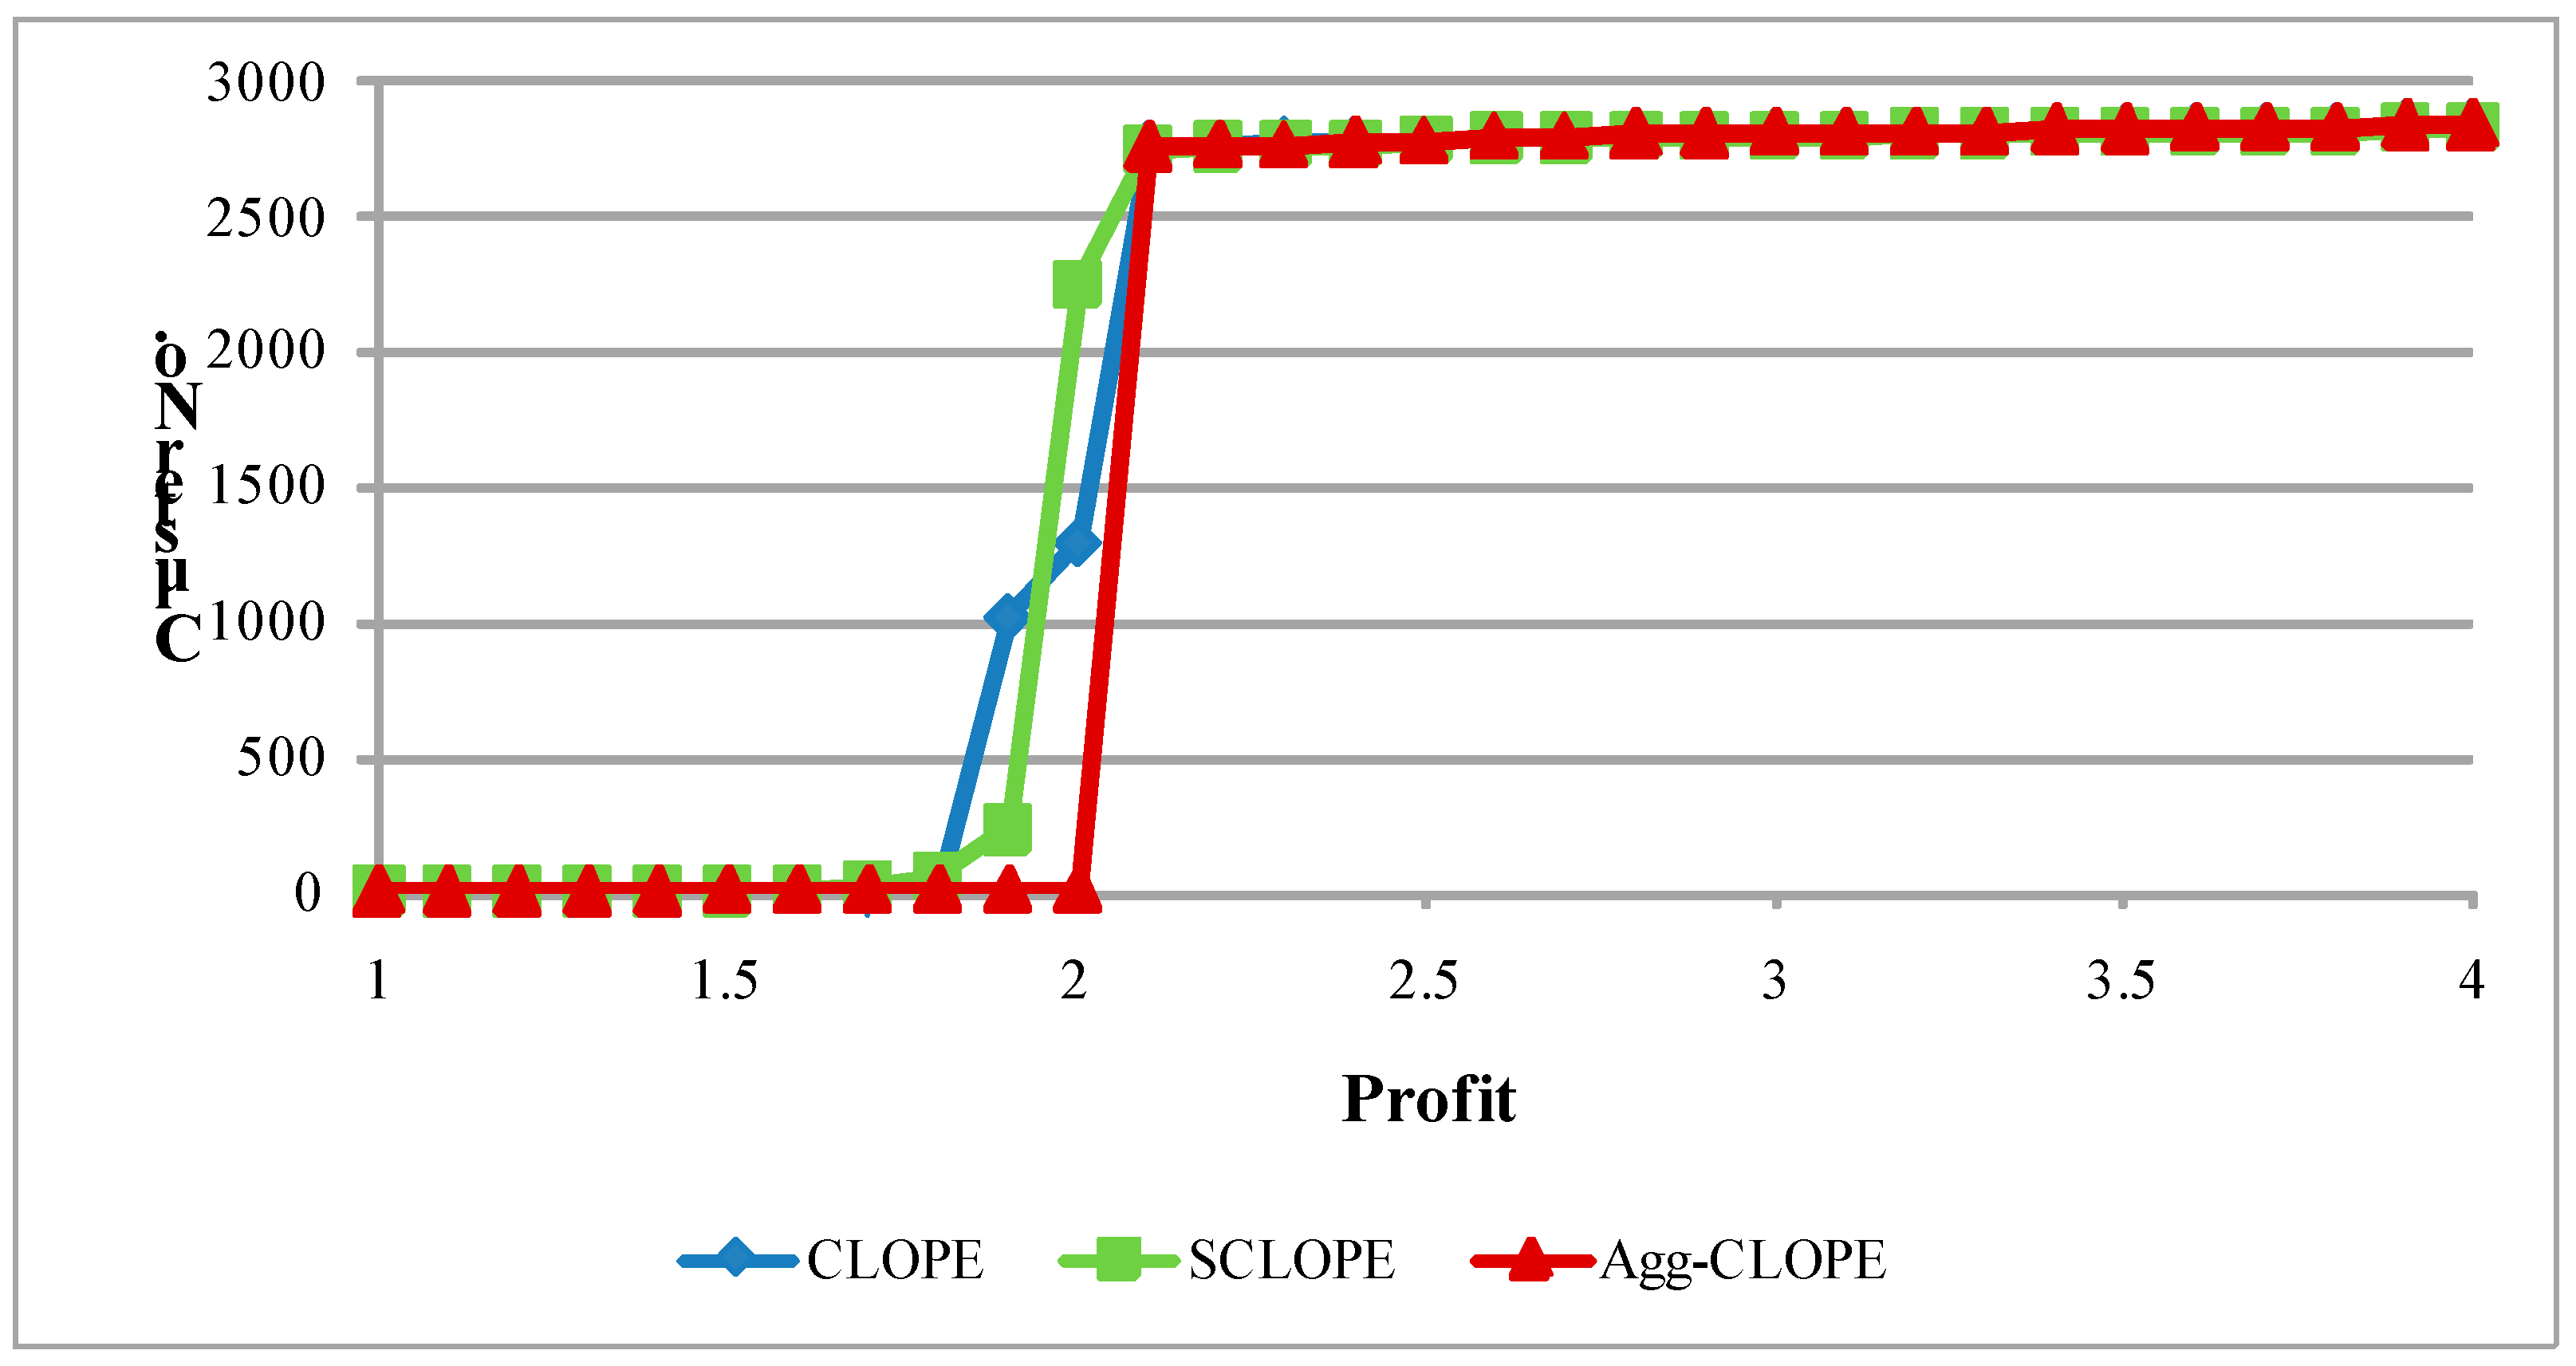
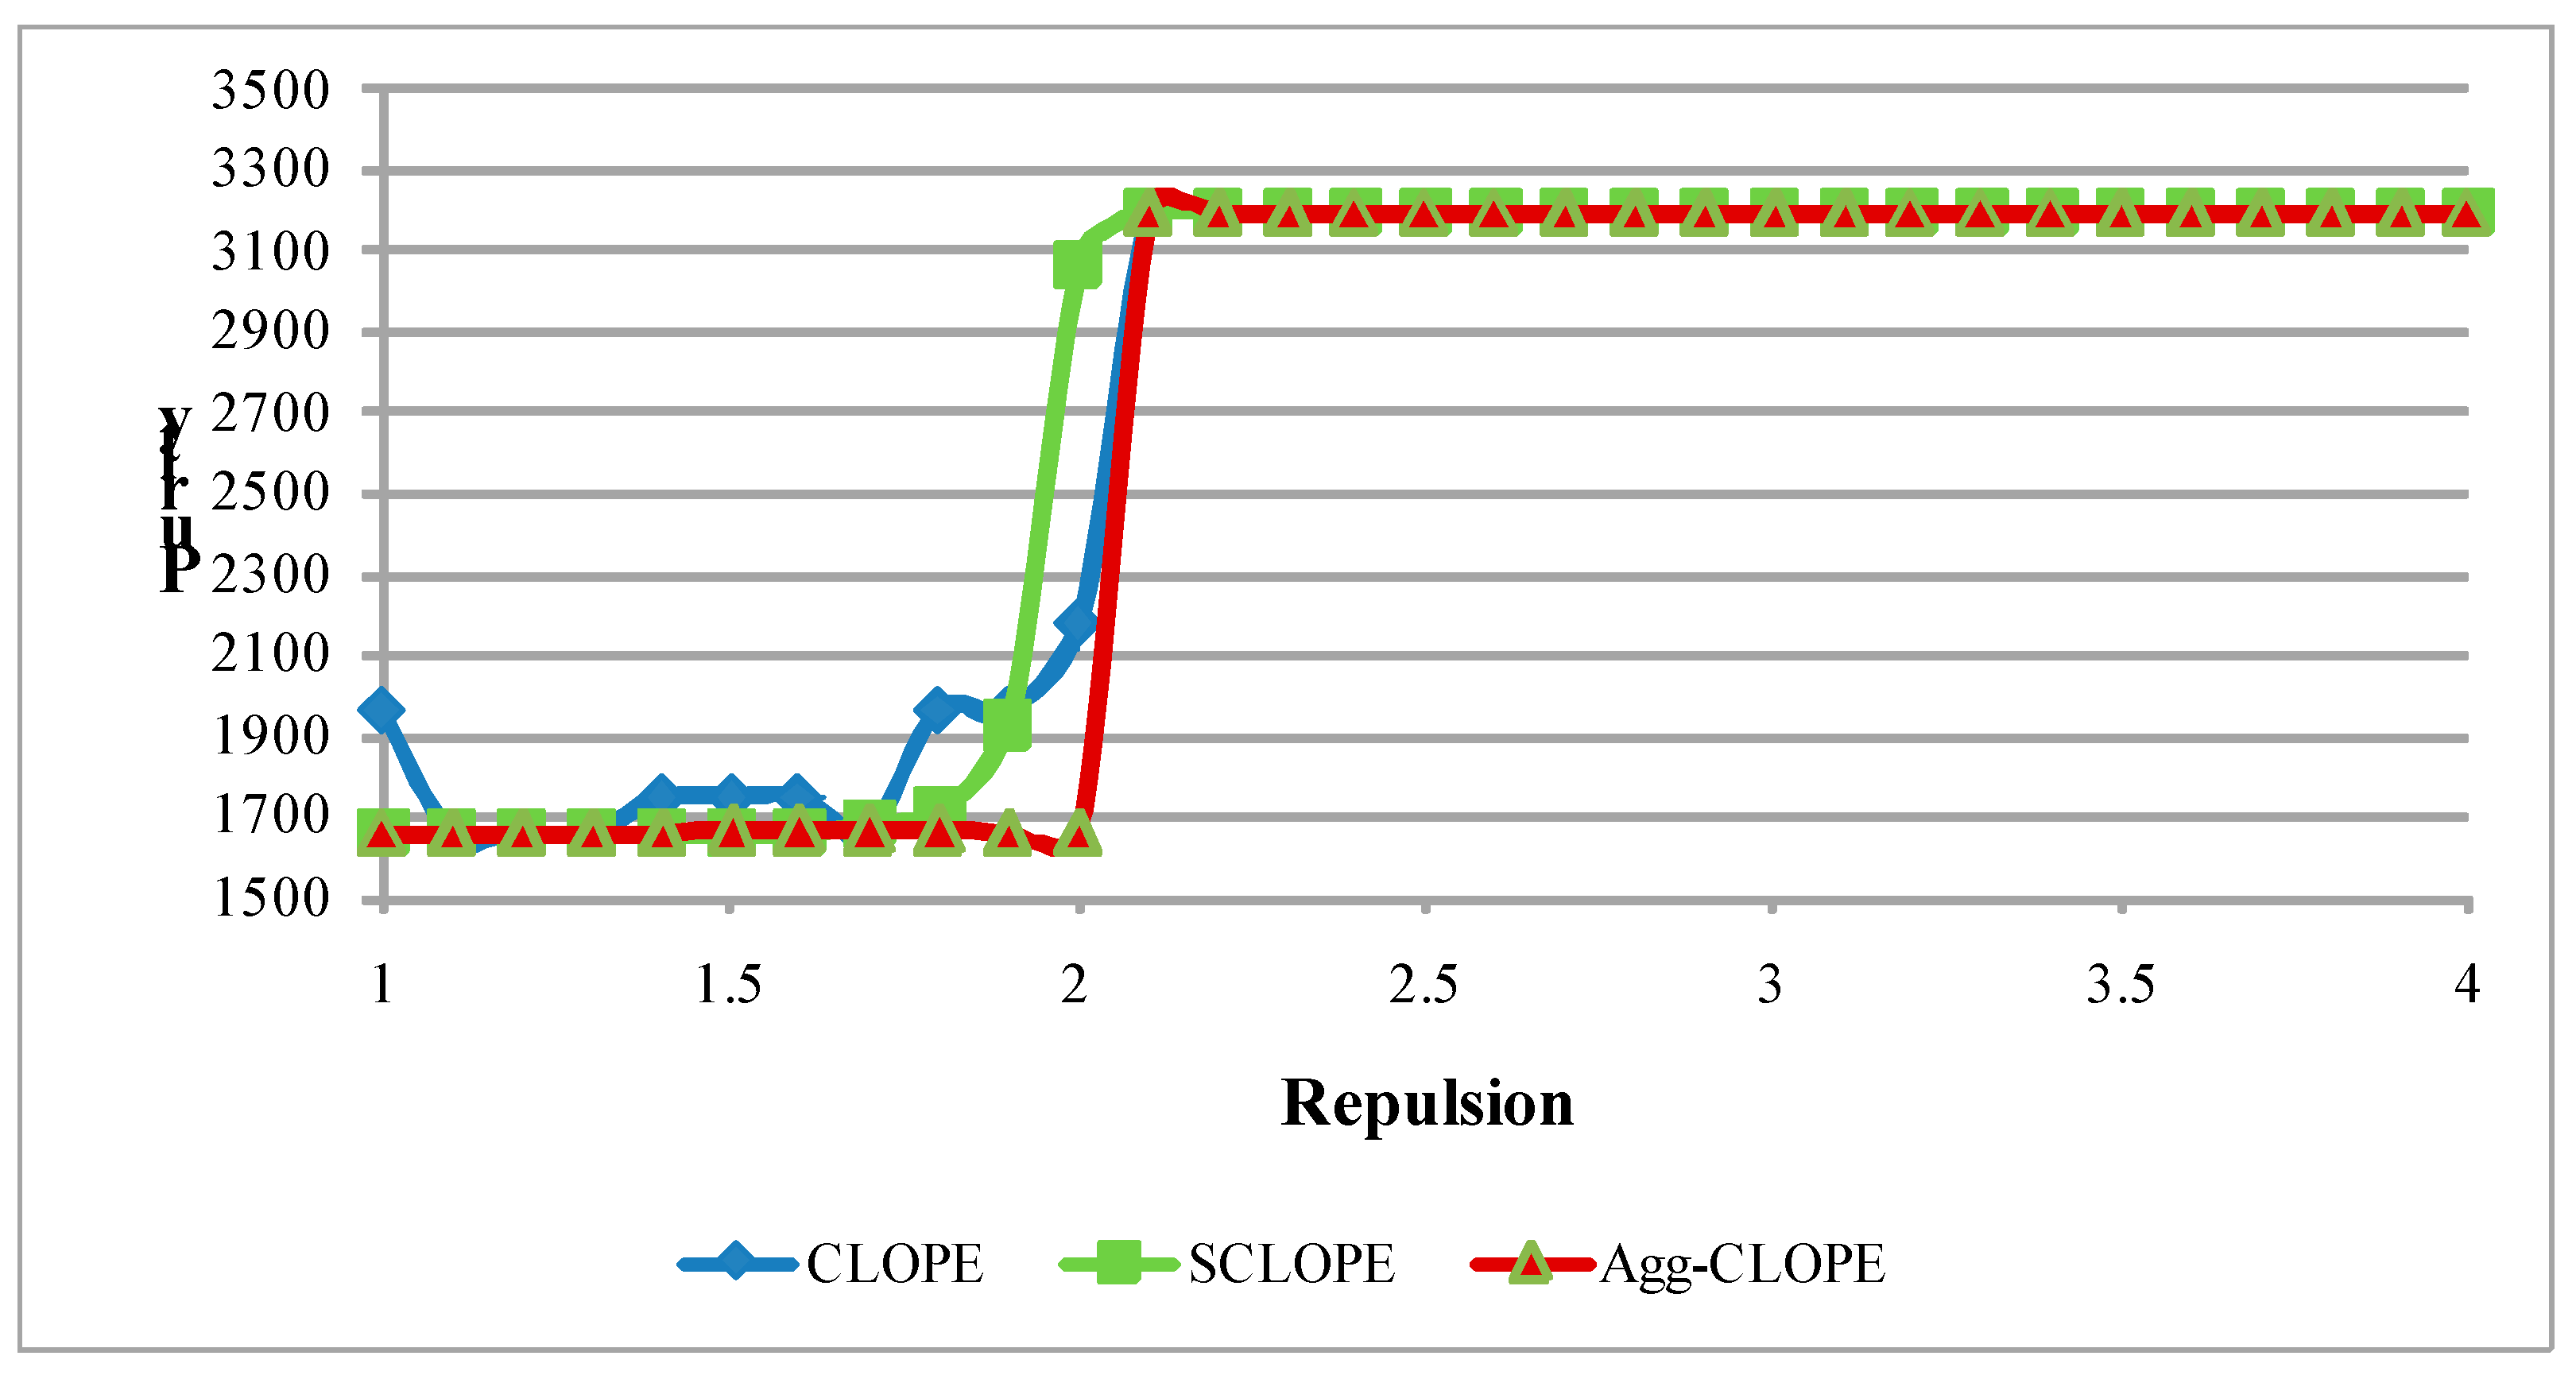
4. Experimental Results

In this section, we evaluate the experimental results from two datasets. We apply three algorithms-CLOPE, SCLOPE and Agg-CLOPE on both datasets and make comparison on five metrics of the clustering results by each algorithm. The experiments are executed on a single Lenovo machine (Lenovo, Shanghai, China) with Intel QuadCore CPU, 8GB RAM, and CentOS 6.4.

4.1. The Mushroom Dataset

The mushroom dataset is retrieved from the UCI machine learning repository (http://archive.ics.uci.edu/ml/datasets/Mushroom, accessed on 24 March 2015), which has been applied by various research works. It contains 8124 transactions with two classes, 4208 edible mushrooms and 3916 poisonous mushrooms. Each transaction has 22 categorical attributes with 116 different values in total.
Table 1. Comparison of clustering profit values with different repulsion produced by three algorithms on the mushroom dataset.
rCLOPESCLOPEAgg-CLOPErCLOPESCLOPEAgg-CLOPE
1.0745.64731698.00841791.99662.62.26972.48342.5242
1.2343.3131649.052731.03812.80.96361.24271.2429
1.4149.1631270.5546300.64433.00.47840.61340.6141
1.668.7164108.0098123.71433.20.23750.30340.3034
1.841.950148.512950.95823.40.10650.14990.1499
2.020.614020.063421.70693.60.05290.0740.0741
2.29.43869.668310.42273.80.02620.03660.0366
2.45.10014.47395.12794.00.01410.01810.0181
Firstly, we compare the profit values of clustering produced by the three algorithms from r = 1.0 to r = 4.0, as shown in Table 1. According to Equation (4), the profit value becomes smaller as r grows up. With the same repulsion, the clustering profit value produced by Agg-CLOPE comes to be the best, and CLOPE the worst in most cases. It is proved that the methodology of Agg-CLOPE for grouping transactions into clusters is capable of finding a more proper clustering with much better profit value.
For the next, we scramble the mushrooms in ten random sequences, and fix r = 2 to run the three algorithms. The result shown in Figure 3 proves that the profit values produced by Agg-CLOPE are just the same regardless of the input sequence, while the clustering result of CLOPE and SCLOPE are both unstable.
Then we make comparison on the executing time of the three algorithms from r = 1.0 to r = 4.0. The result in Figure 4 shows that CLOPE is fastest with no more than 5 s, while Agg-CLOPE and SCLOPE takes much longer time to produce the clustering results. SCLOPE is the worst as the attributes in each transaction should be sorted during the creation of its FP-Tree structure [8]. The reason that Agg-CLOPE is slow is the time complexity analyzed in Section 3.2.
Figure 3. Comparison of stability with different input sequence produced by three algorithms on the mushroom dataset.
Algorithms 08 00380 g003
Figure 4. Comparison of execution time with different repulsion produced by three algorithms on the mushroom dataset.
Algorithms 08 00380 g004
Finally, we evaluate the quality of clustering results from r = 1.0 to r = 4.0. It includes two metrics-purity and cluster number [6]. The purity metric is calculated by summing up the larger one of the number of edible mushrooms and number of poisonous mushrooms. It has a maximum of 8124, the total number of transactions. The number of clusters should be as many as possible, as a clustering with each cluster contains only one transaction would surely achieve the maximum purity.
As shown in Figure 5 and Figure 6, both CLOPE and Agg-CLOPE reaches the maximum purity of 8124 and maximum cluster number of 23 at r = 2.8, while SCLOPE achieves this goal at r = 3.1. Besides, Agg-CLOPE is slightly better than CLOPE on both of the two metrics, while SCLOPE appears to be worse.
Figure 5. Comparison of purity with different repulsion produced by three algorithms on the mushroom dataset.
Algorithms 08 00380 g005
Figure 6. Comparison of cluster number with different repulsion produced by three algorithms on the mushroom dataset.
Algorithms 08 00380 g006

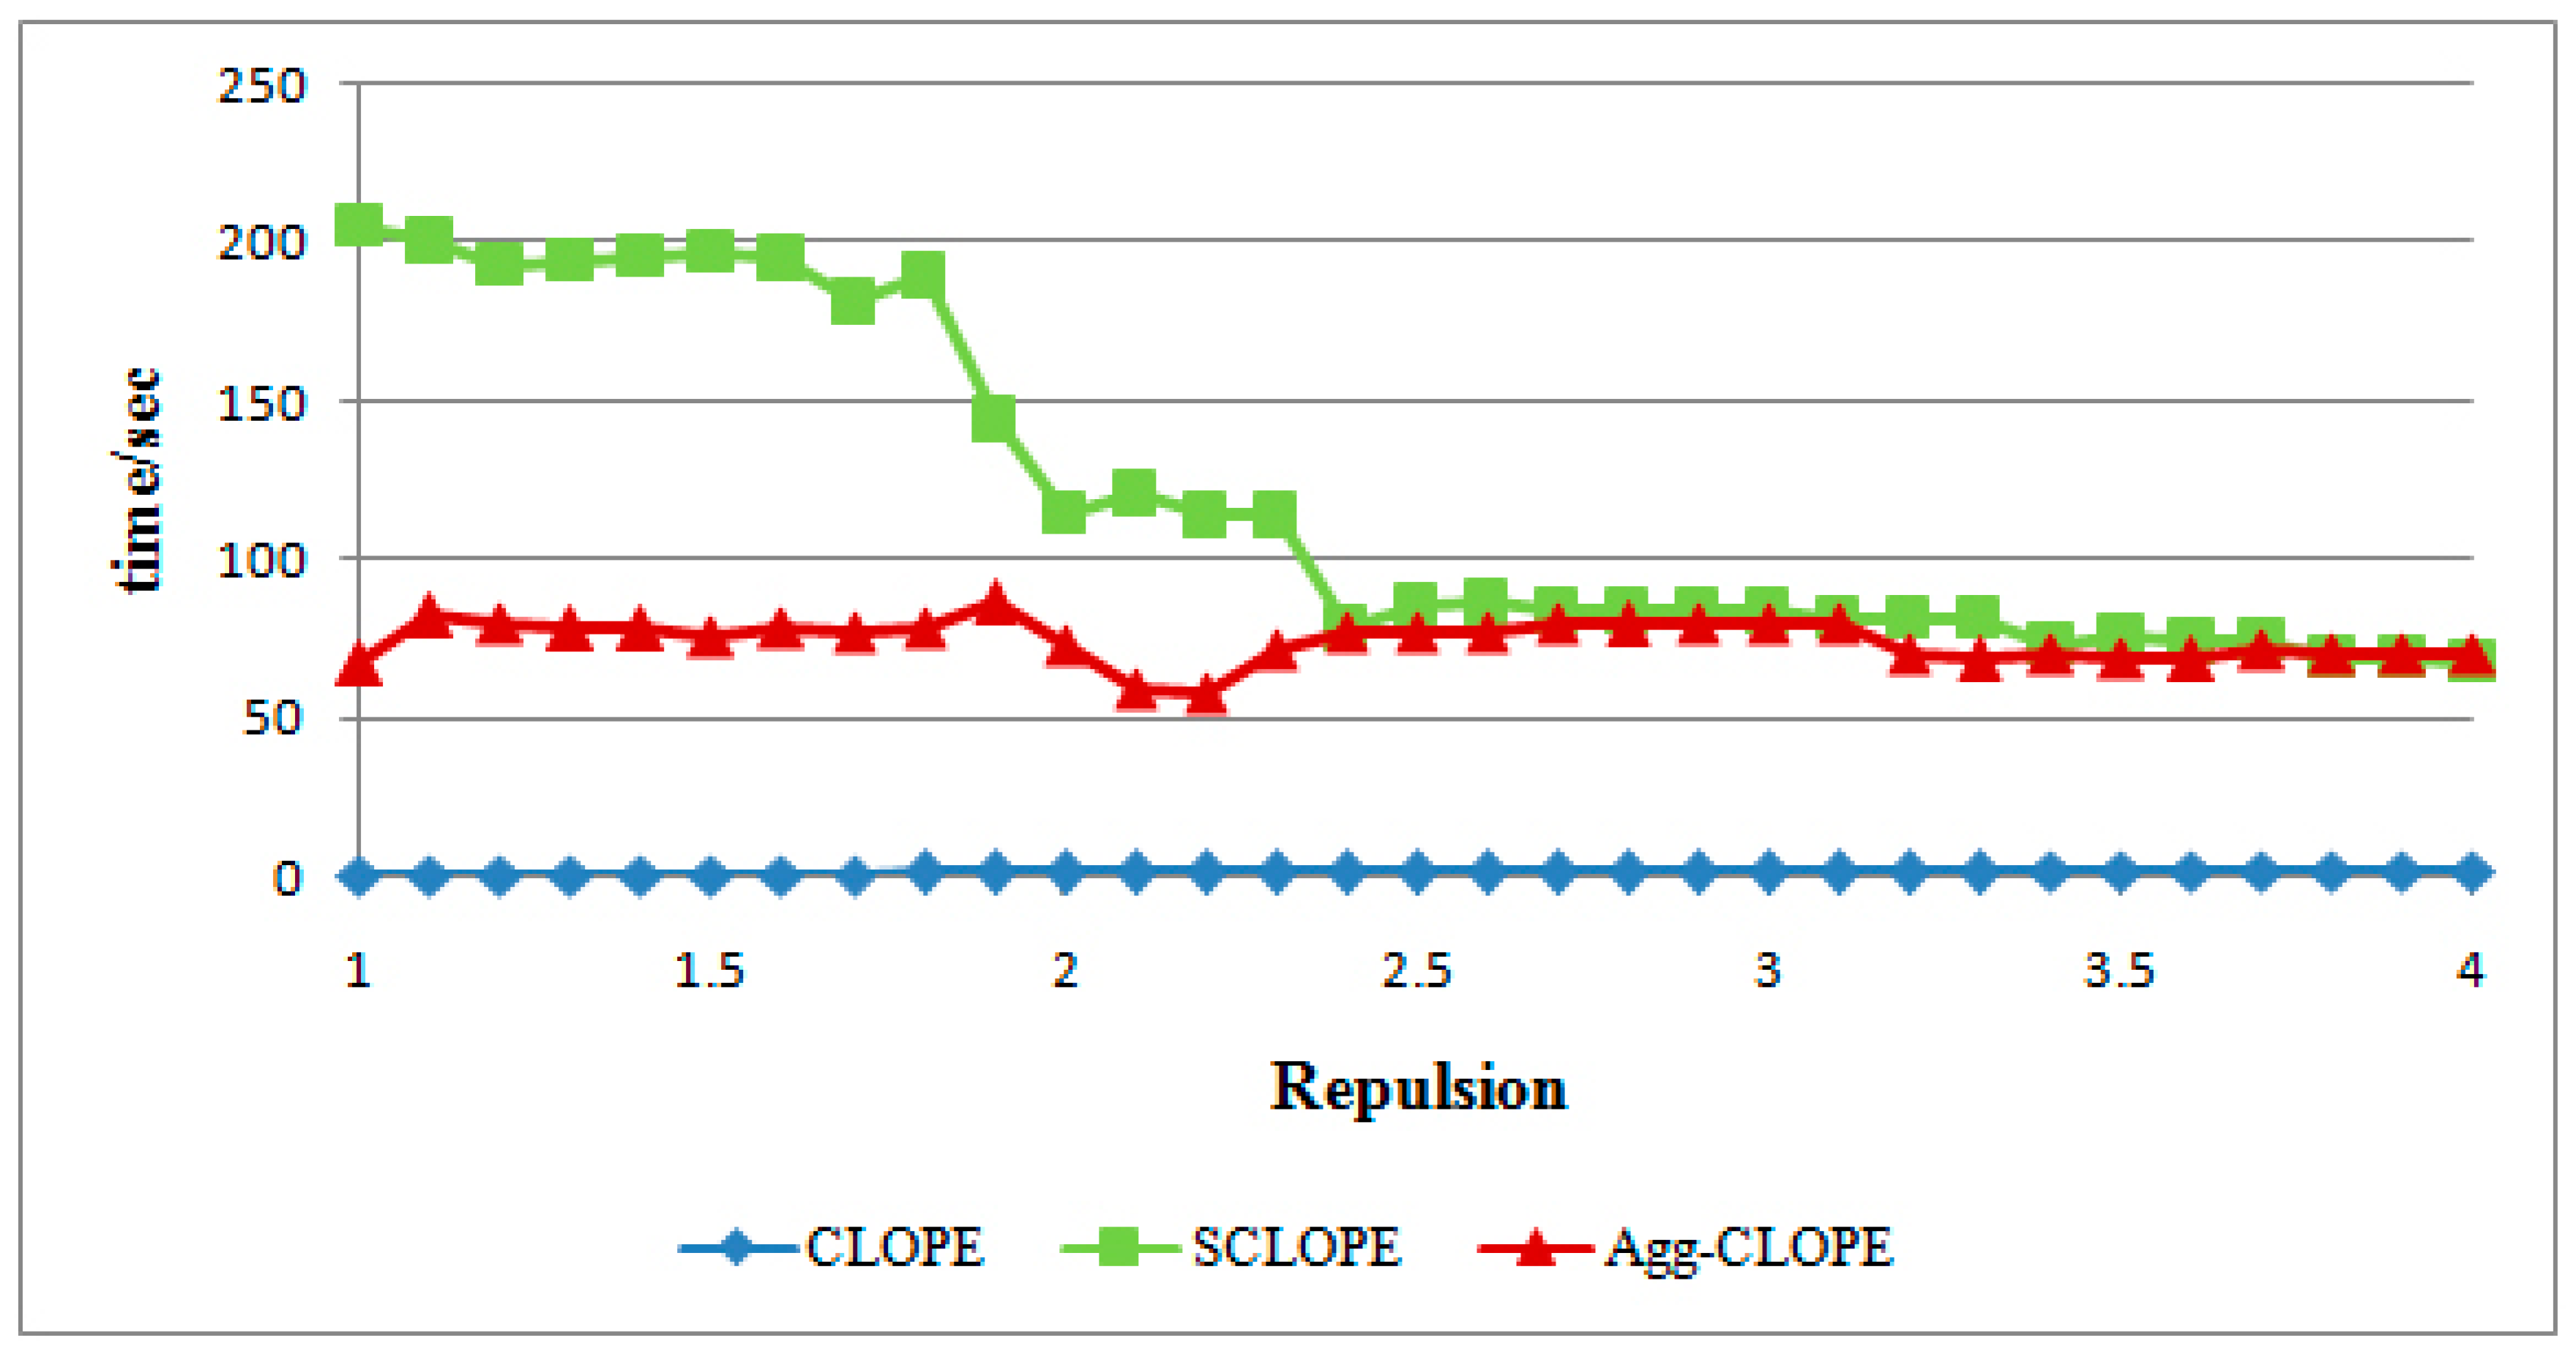
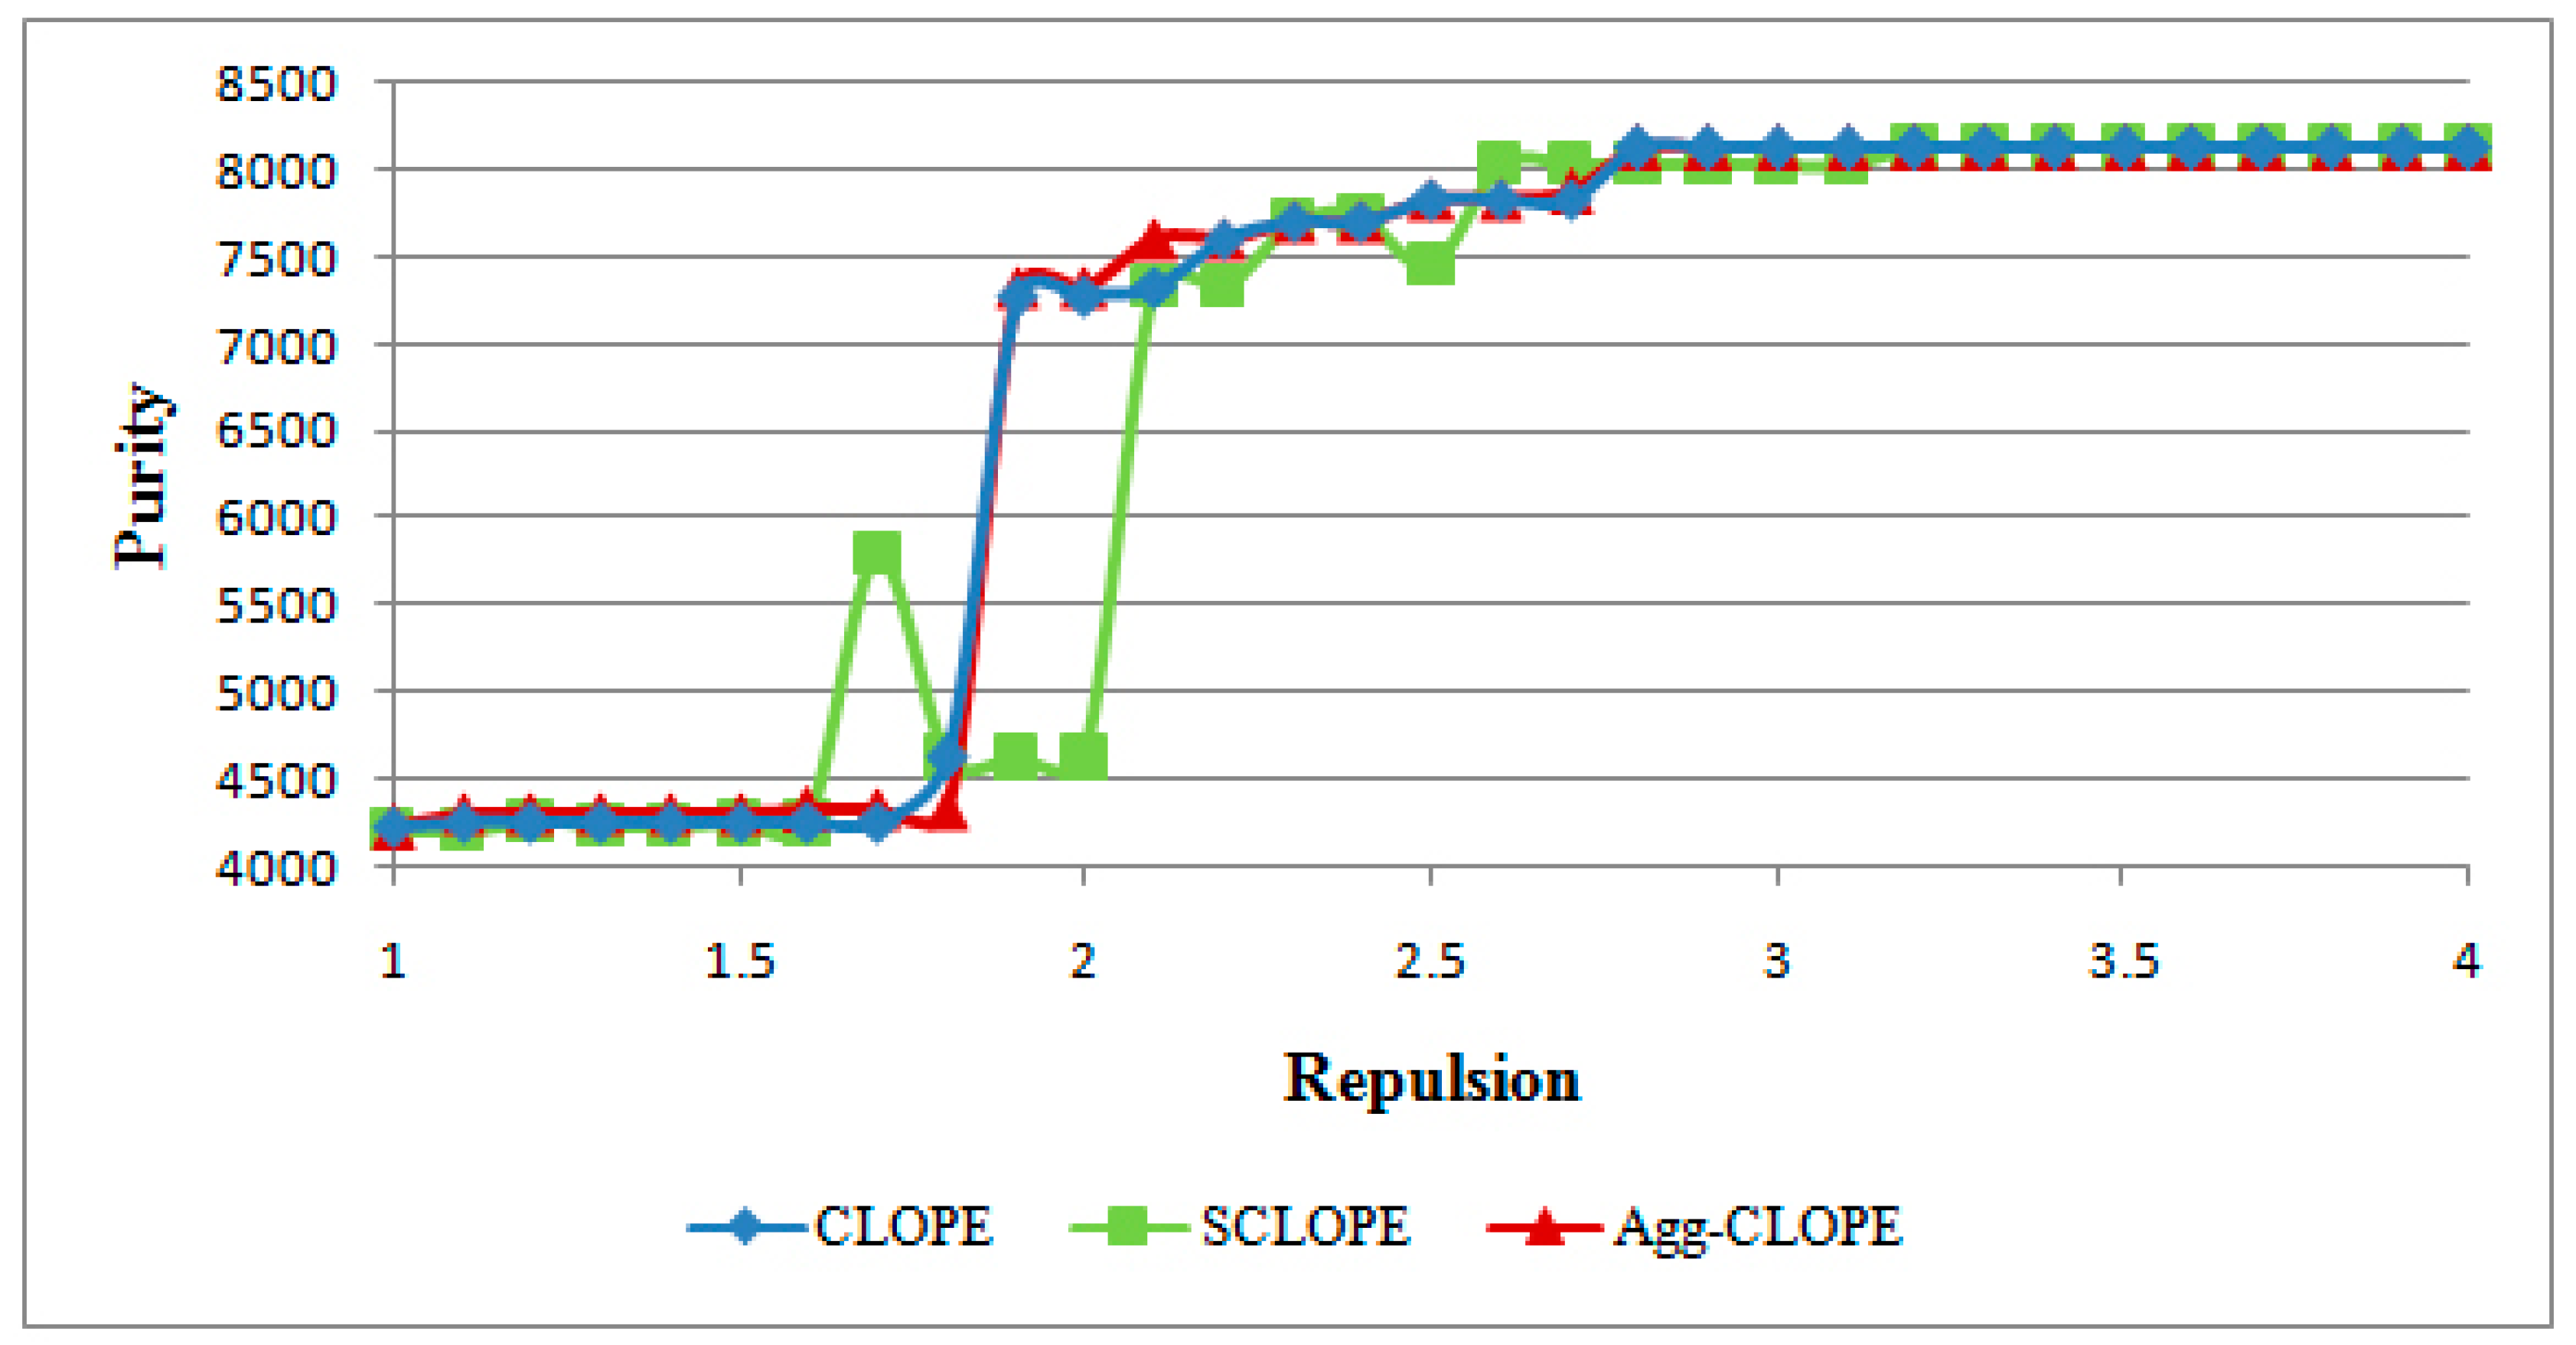
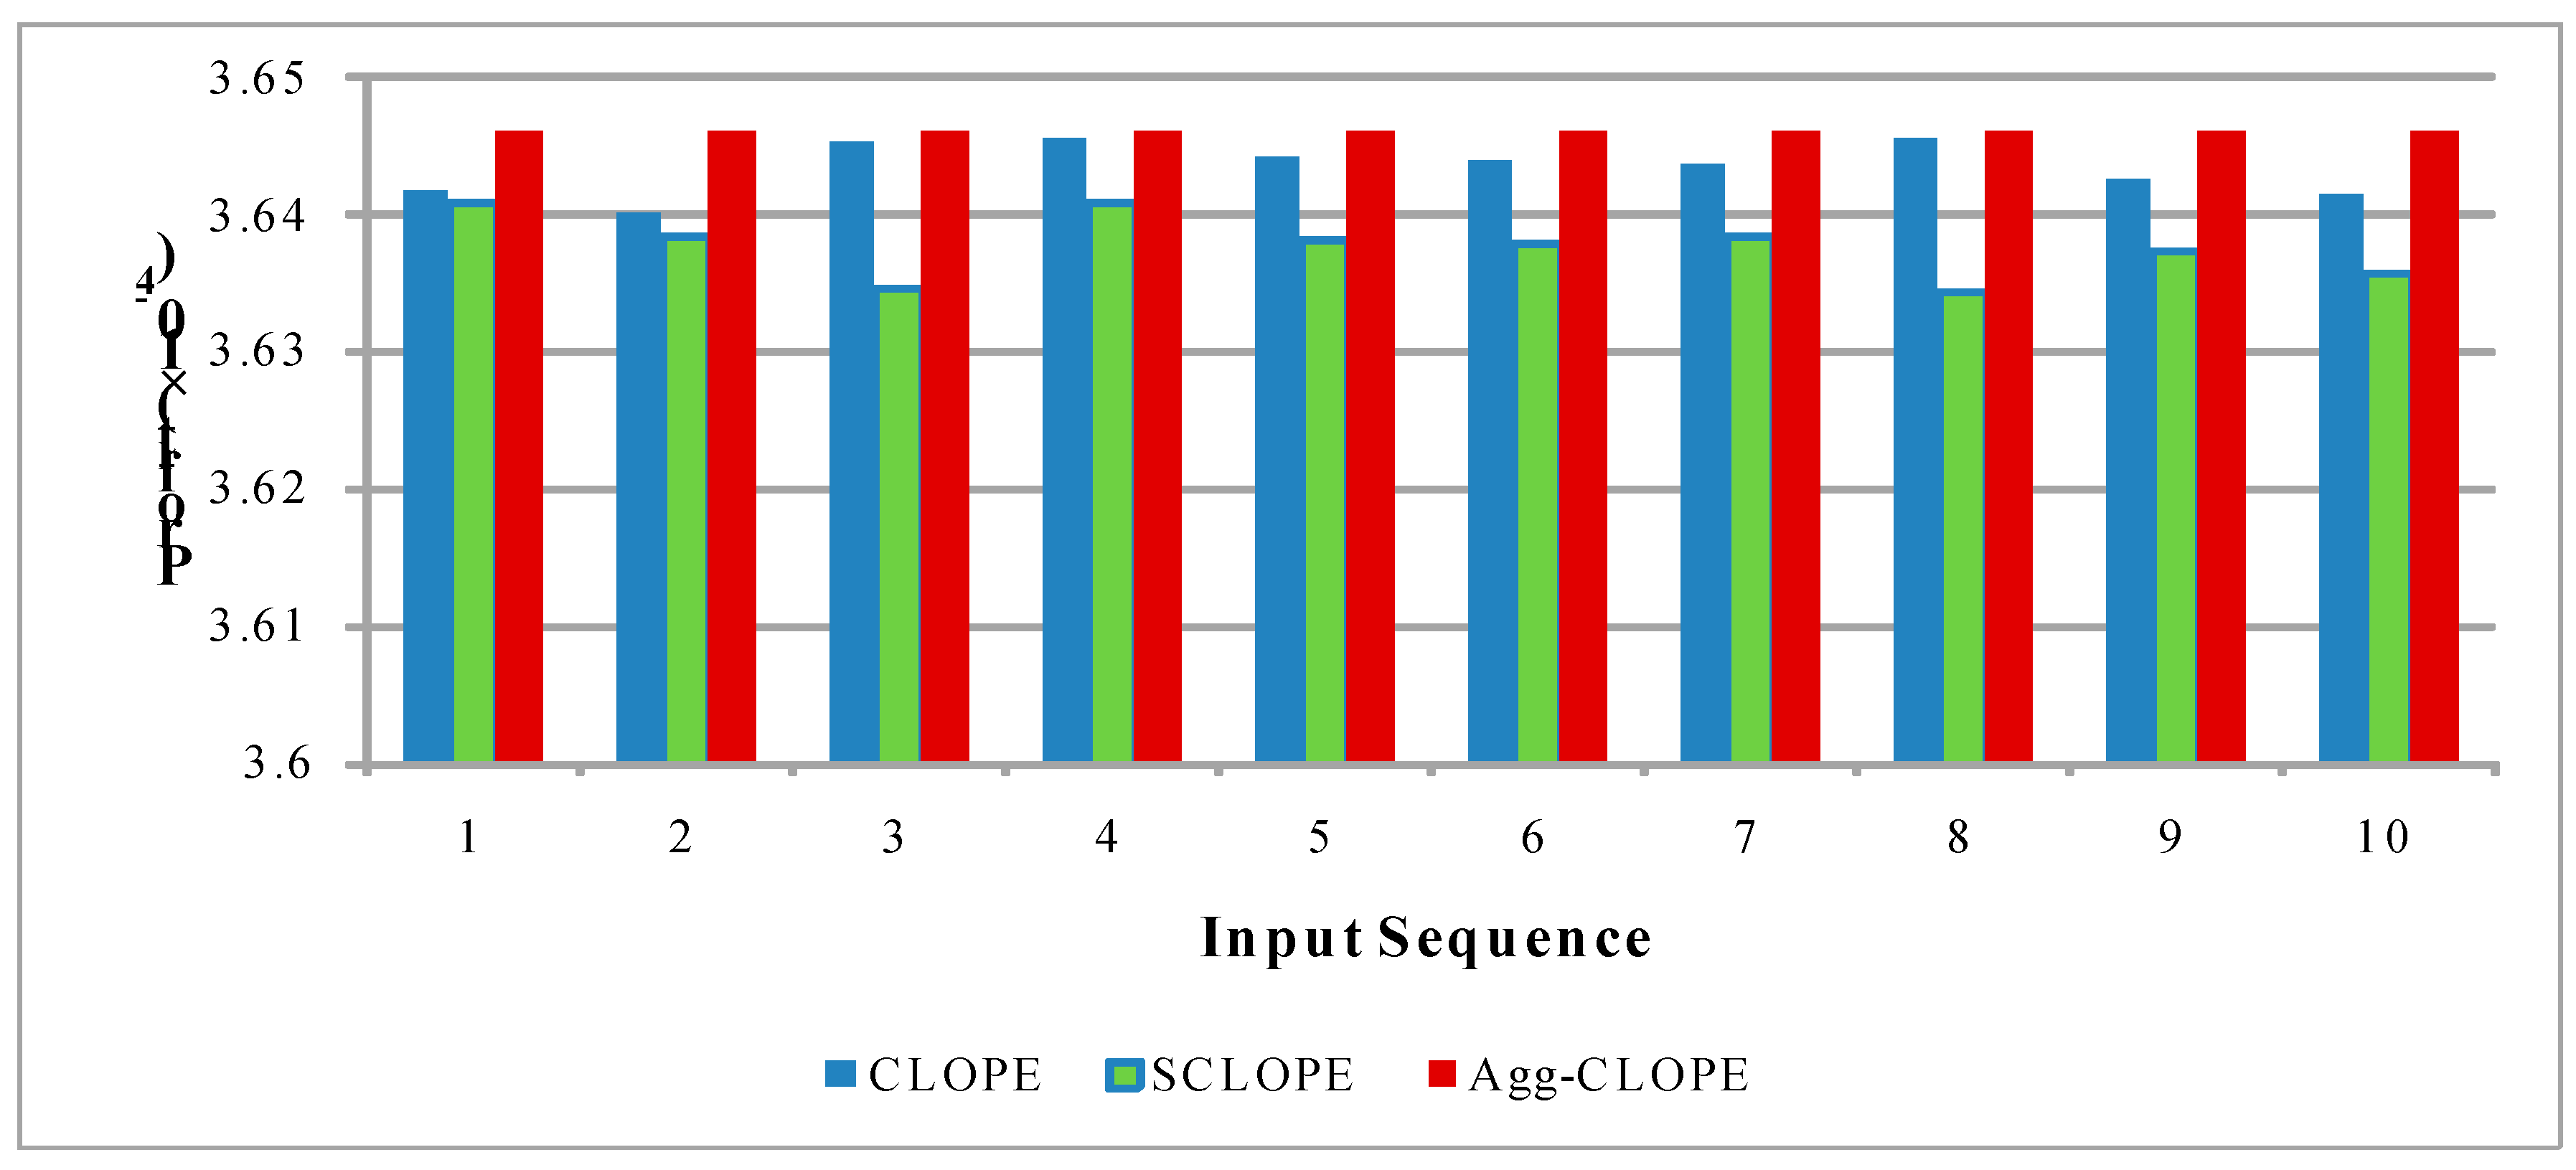
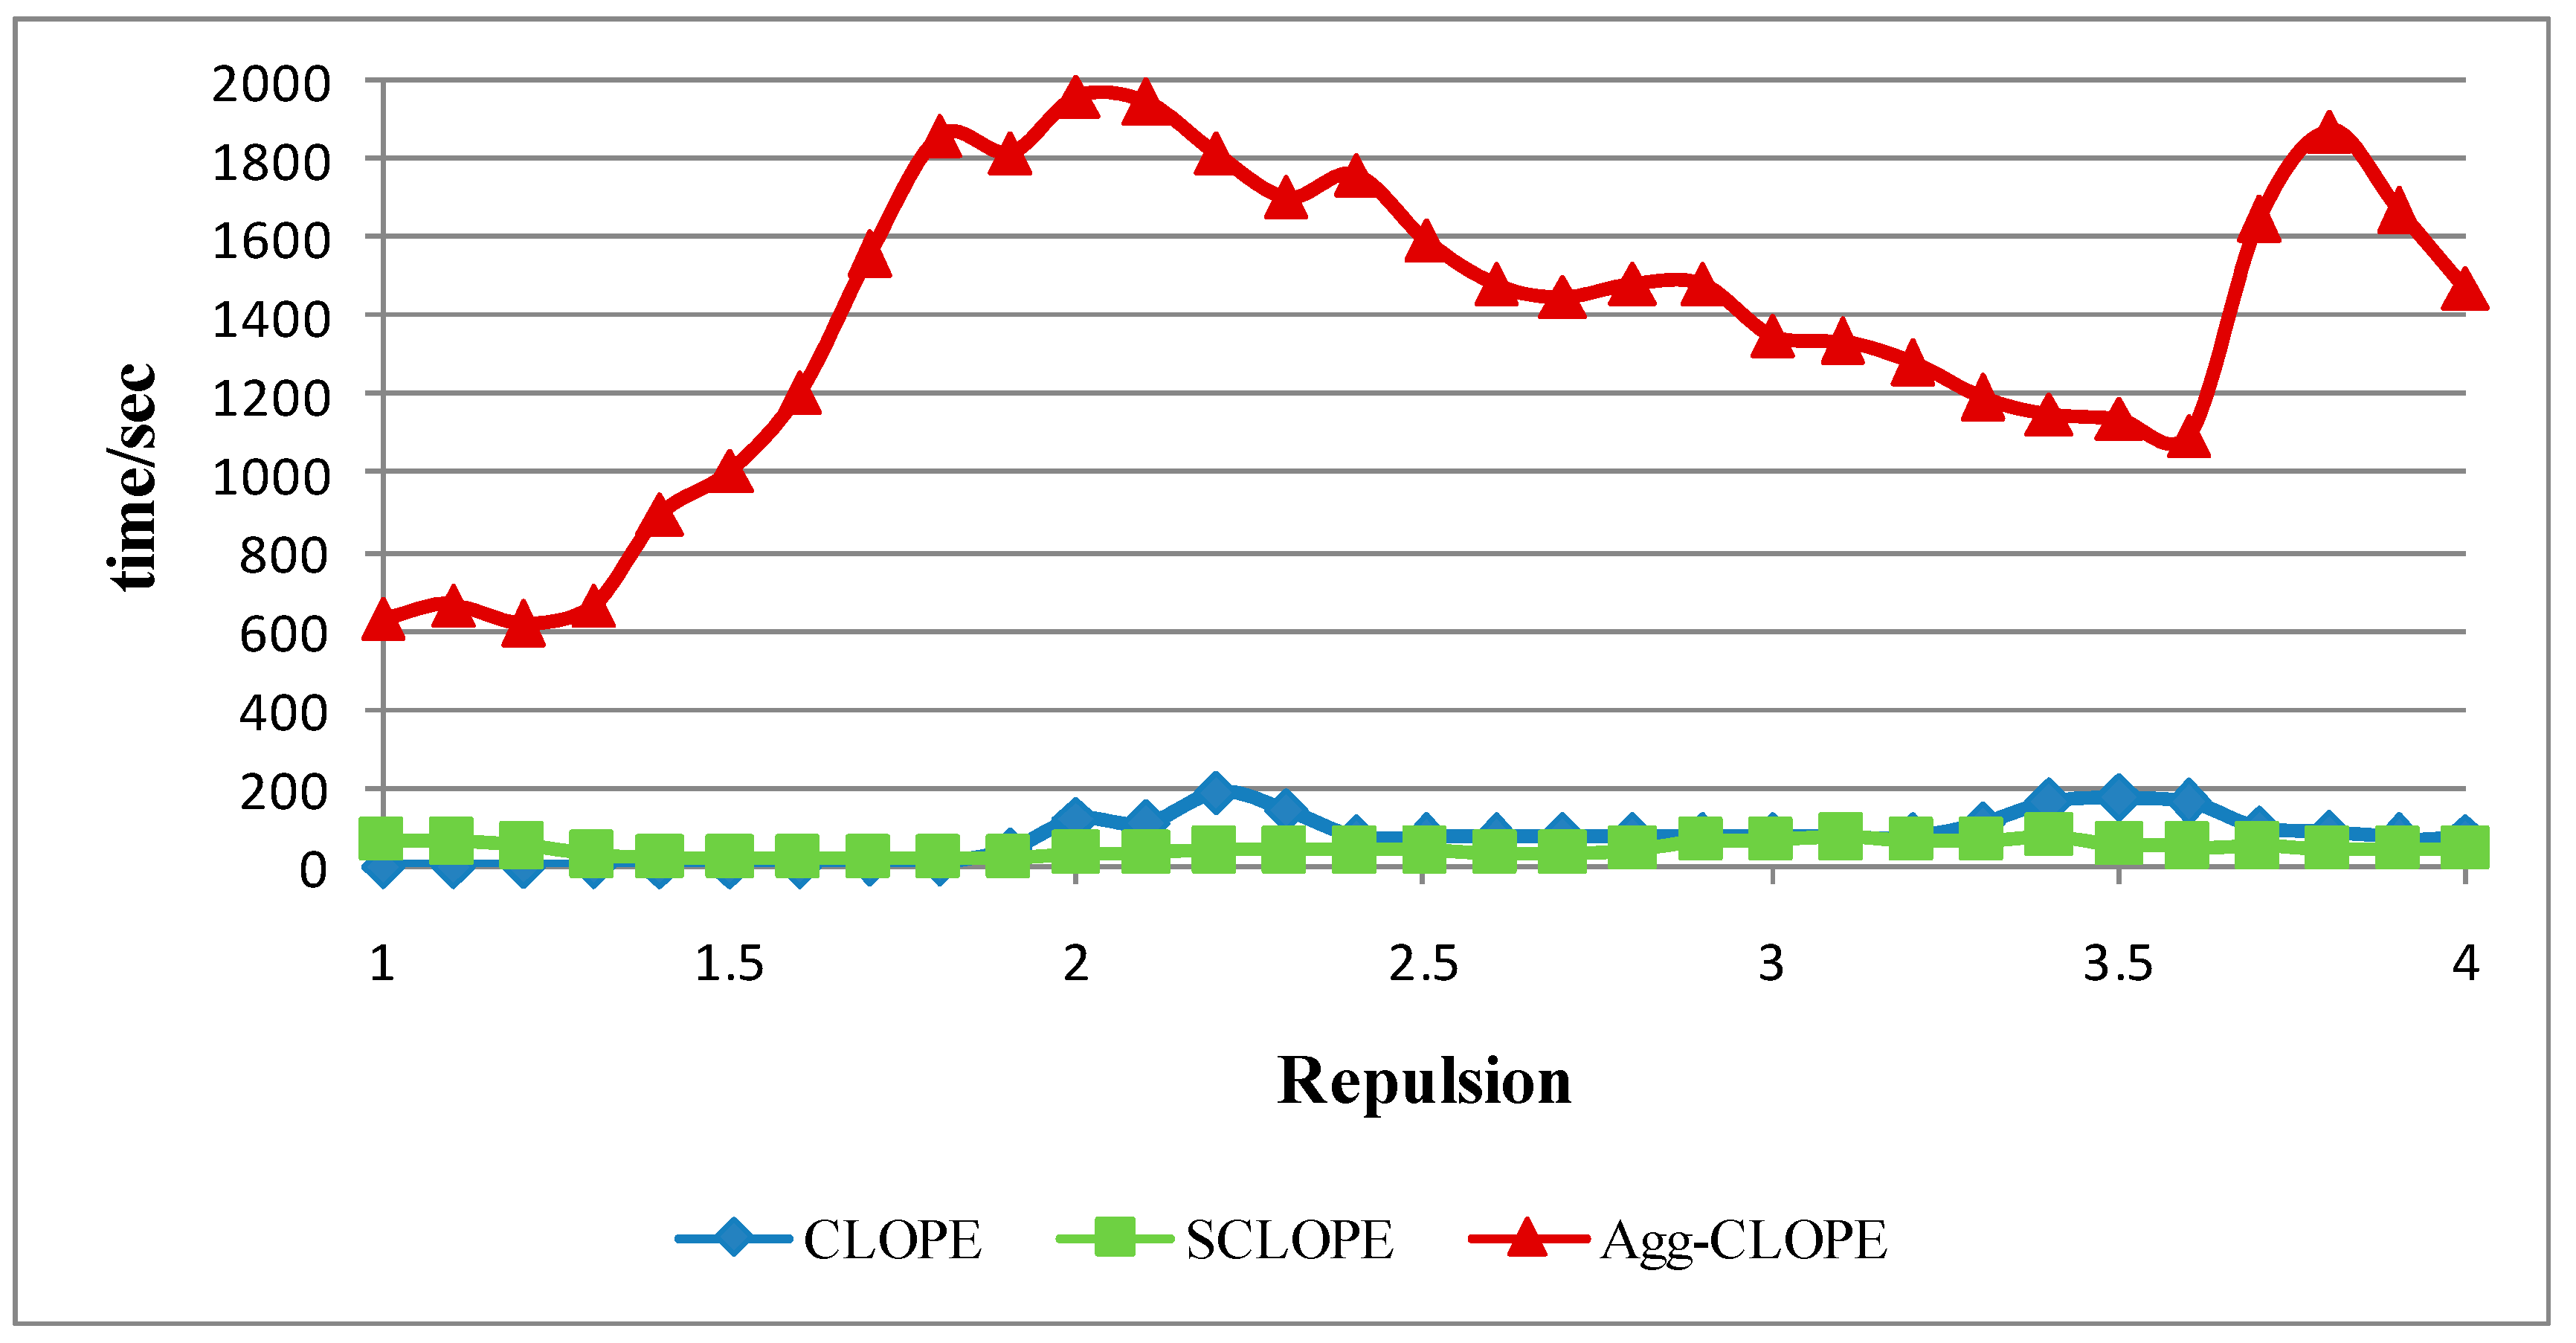
4.2. The Splice-junction Gene Sequences Dataset

We pick up one of the splice-junction gene sequences datasets from the GenBank website (http://www.ncbi.nlm.nih.gov/genbank/, accessed on 04 April 2015). The selected dataset contains 3190 DNA transactions with three classes of boundaries: exon/intron (abbreviated as EI), intron/exon (abbreviated as IE) and neither (abbreviated as N). Each transaction has a sequence with 60 fields filled by one of {A, G, T, C} for each mostly. Combined with the position information, there are totally 287 different categorical attributes.
Table 2. Comparison of clustering profit values with different repulsion produced by three algorithms on the splice-junction gene sequence dataset.
rCLOPESCLOPEAgg-CLOPErCLOPESCLOPEAgg-CLOPE
1.0398.0057671.4143790.03272.61.9059 × 1031.9066 × 1031.9086 × 103
1.2201.1890256.7411263.99932.88.3294 × 1048.3264 × 1048.3408 × 104
1.447.958981.754888.21863.03.6453 × 1043.6395 × 1043.6459 × 104
1.616.053228.583829.47923.21.5947 × 1041.5921 × 1041.5960 × 104
1.84.98769.39039.85083.46.9867 × 1056.9718 × 1056.9912 × 105
2.01.05390.17443.26663.63.0626 × 1053.0527 × 1053.0643 × 105
2.20.01009.9808 × 1030.01003.81.3428 × 1051.3379 × 1051.3443 × 105
2.44.3660 × 1034.3463 × 1034.3731 × 1034.05.8913 × 1065.8686 × 1065.8998 × 106
The experiments on this dataset are similar to those in the previous subsection. Table 2 shows that Agg-CLOPE has the best profit value and Figure 7 proves Agg-CLOPE to be stable compared to CLOPE and SCLOPE by fixing r = 3.0.
Figure 7. Comparison of stability with different input sequence produced by three algorithms on the splice-junction gene sequence dataset.
Algorithms 08 00380 g007
However, although the number of transactions in this dataset is smaller than that of mushroom, Agg-CLOPE takes much more time while SCLOPE becomes fastest when r ≥ 2.0, as illustrated in Figure 8. The reason can be explained in Figure 9, with more than 2700 clusters produced under bigger repulsion values by all three algorithms. Observing the calculation of time complexity in the last paragraph of Section 3.2, the number of clusters K in each iterative round is a key factor. Let Σ symbolizes the final number of clusters by the corresponding algorithm, and then K is close to Σ in CLOPE and is always bigger than Σ in Agg-CLOPE. On the other hand, the creation time of FP-Tree in SCLOPE is only affected by N and A, resulting in faster than CLOPE, Agg-CLOPE and that on the mushroom dataset. Moreover, there are no obvious differences on the purity metric among the three algorithms. As shown in Figure 10, the maximum value of 3190 can be easily achieved on condition of r > 2.0, thus the quality of clustering results is almost the same on this dataset.
Figure 8. Comparison of execution time with different repulsion produced by three algorithms on the splice-junction gene sequence dataset.
Algorithms 08 00380 g008
Figure 9. Comparison of cluster number with different repulsion produced by three algorithms on the splice-juction gene sequence dataset.
Algorithms 08 00380 g009
Figure 10. Comparison of purity with different repulsion produced by three algorithms on the splice-juction gene sequence dataset.
Algorithms 08 00380 g010

5. Conclusion

In this paper, we propose the Agg-CLOPE algorithm as an extension of the original CLOPE algorithm using an optimized agglomerative approach. It uses cluster merge operations instead of moving a single transaction in each iterative round to find the optimal combination of transactions. Experiments on two datasets both demonstrate that Agg-CLOPE can achieve better profit value and stable clustering results compared with CLOPE and SCLOPE. However, the slowness of execution speed becomes an obstacle for larger and more complicated datasets. To deal with this problem, we would make tradeoff among the time, profit and stability to reduce the running time with the following approaches in the future:
(1)
We might specify an additional parameter to limit the number of iterative rounds so that the algorithm would terminate earlier.
(2)
We might specify the upper or lower bound to limit the number of clusters produced by the algorithm, which might also stop the iteration ahead of time.
(3)
We might apply this algorithm on a distributed environment such as MapReduce framework so that the input dataset can be divided into smaller parts and executed on multiple machines in parallel.

Acknowledgements

This research was supported by the Fundamental Research Funds for the Central Universities, DHU Distinguished Young Professor Program (B201312).

Author Contributions

This research was carried out in collaboration among all the three authors. Jiajin Le discovered the problem and defined the research theme. Yefeng Li designed and implemented the Agg-CLOPE algorithm. Mei Wang designed the structure of this paper, and made corrections on the contents.

Conflicts of Interest

The authors declare no conflict of interest.

References

  1. He, Z.Y.; Xu, X.F.; Deng, S.C. A cluster ensemble method for clustering categorical data. Inf. Fusion 2005, 6, 143–151. [Google Scholar] [CrossRef]
  2. Gibson, D.; Kleiberg, J.; Raghavan, P. Clustering categorical data: An approach based on dynamic systems. In Proceedings of the VLDB’98, New York, NY, USA, 24–27 August 1998.
  3. Guha, S.; Rastogi, R.; Shim, K. A robust clustering algorithm for categorical attributes. In Proceedings of the ICDE’99, Sydney, Australia, 23–26 March 1999.
  4. Wang, K.; Xu, C.; Liu, B. Clustering transactions using large items. In Proceedings of the CIKM’99, Kansas City, MI, USA, 2–6 November 1999.
  5. He, Z.; Xu, X.; Deng, S. Squeezer: An efficient algorithm for clustering categorical data. J. Comp. Sci. Tech. 2002, 17, 611–624. [Google Scholar] [CrossRef]
  6. Yang, Y.; Guan, S.; You, J. CLOPE: A fast and effective clustering algorithm for transactional data. In Proceedings of the KDD’02, Edmonton, AB, Canada, 23–23 July 2002.
  7. Barbará, D.; Li, Y.; Couto, J. COOLCAT: An entropy-based algorithm for categorical clustering. In Proceedings of the CIKM’02, McLean, VA, USA, 4–9 November 2002.
  8. Ong, K.L.; Li, W.Y.; Ng, W.K. SCLOPE: An algorithm for clustering data streams of categorical attributes. In LCNS 3181: Knowledge-Based Intelligent Information and Engineering Systems; Springer: Berlin/Heidelberg, Germany, 2004; Volume 3181, pp. 209–218. [Google Scholar]
  9. Yap, P.H.; Ong, K.L. σ-SCLOPE: Clustering categorical streams using attribute selection. In LCNS 3682: Knowledge-Based Intelligent Information and Engineering Systems; Springer: Berlin/Heidelberg, Germany, 2005; Volume 3682, pp. 929–935. [Google Scholar]
  10. Aggarwal, C.C.; Han, J.W.; Wang, J.Y.; Yu, P.S. A framework for clustering evolving data streams. In Proceedings of the VLDB’03, Berlin, Germany, 9–12 September 2003.
  11. Han, J.W.; Pei, J.; Yin, Y.W. Mining frequent patterns without candidate generation. ACM Sigmod Rec. 2000, 29, 1–12. [Google Scholar] [CrossRef]
  12. Li, J.; Gao, X.B.; Jiao, L.C. A fuzzy CLOPE algorithm and its optimal parameter choice. J. Electr. 2006, 23, 384–388. [Google Scholar] [CrossRef]
  13. Hastie, T.; Tibshirani, R.; Friedman, J. The elements of statistical learning: Data mining, inference, and prediction, 2nd ed.; Springer Verlag: New York, NY, USA, 2009; Volume 2, pp. 520–528. [Google Scholar]

