The Lobe Fissure Tracking by the Modified Ant Colony Optimization Framework in CT Images

Abstract
:1. Introduction

2. Related Works
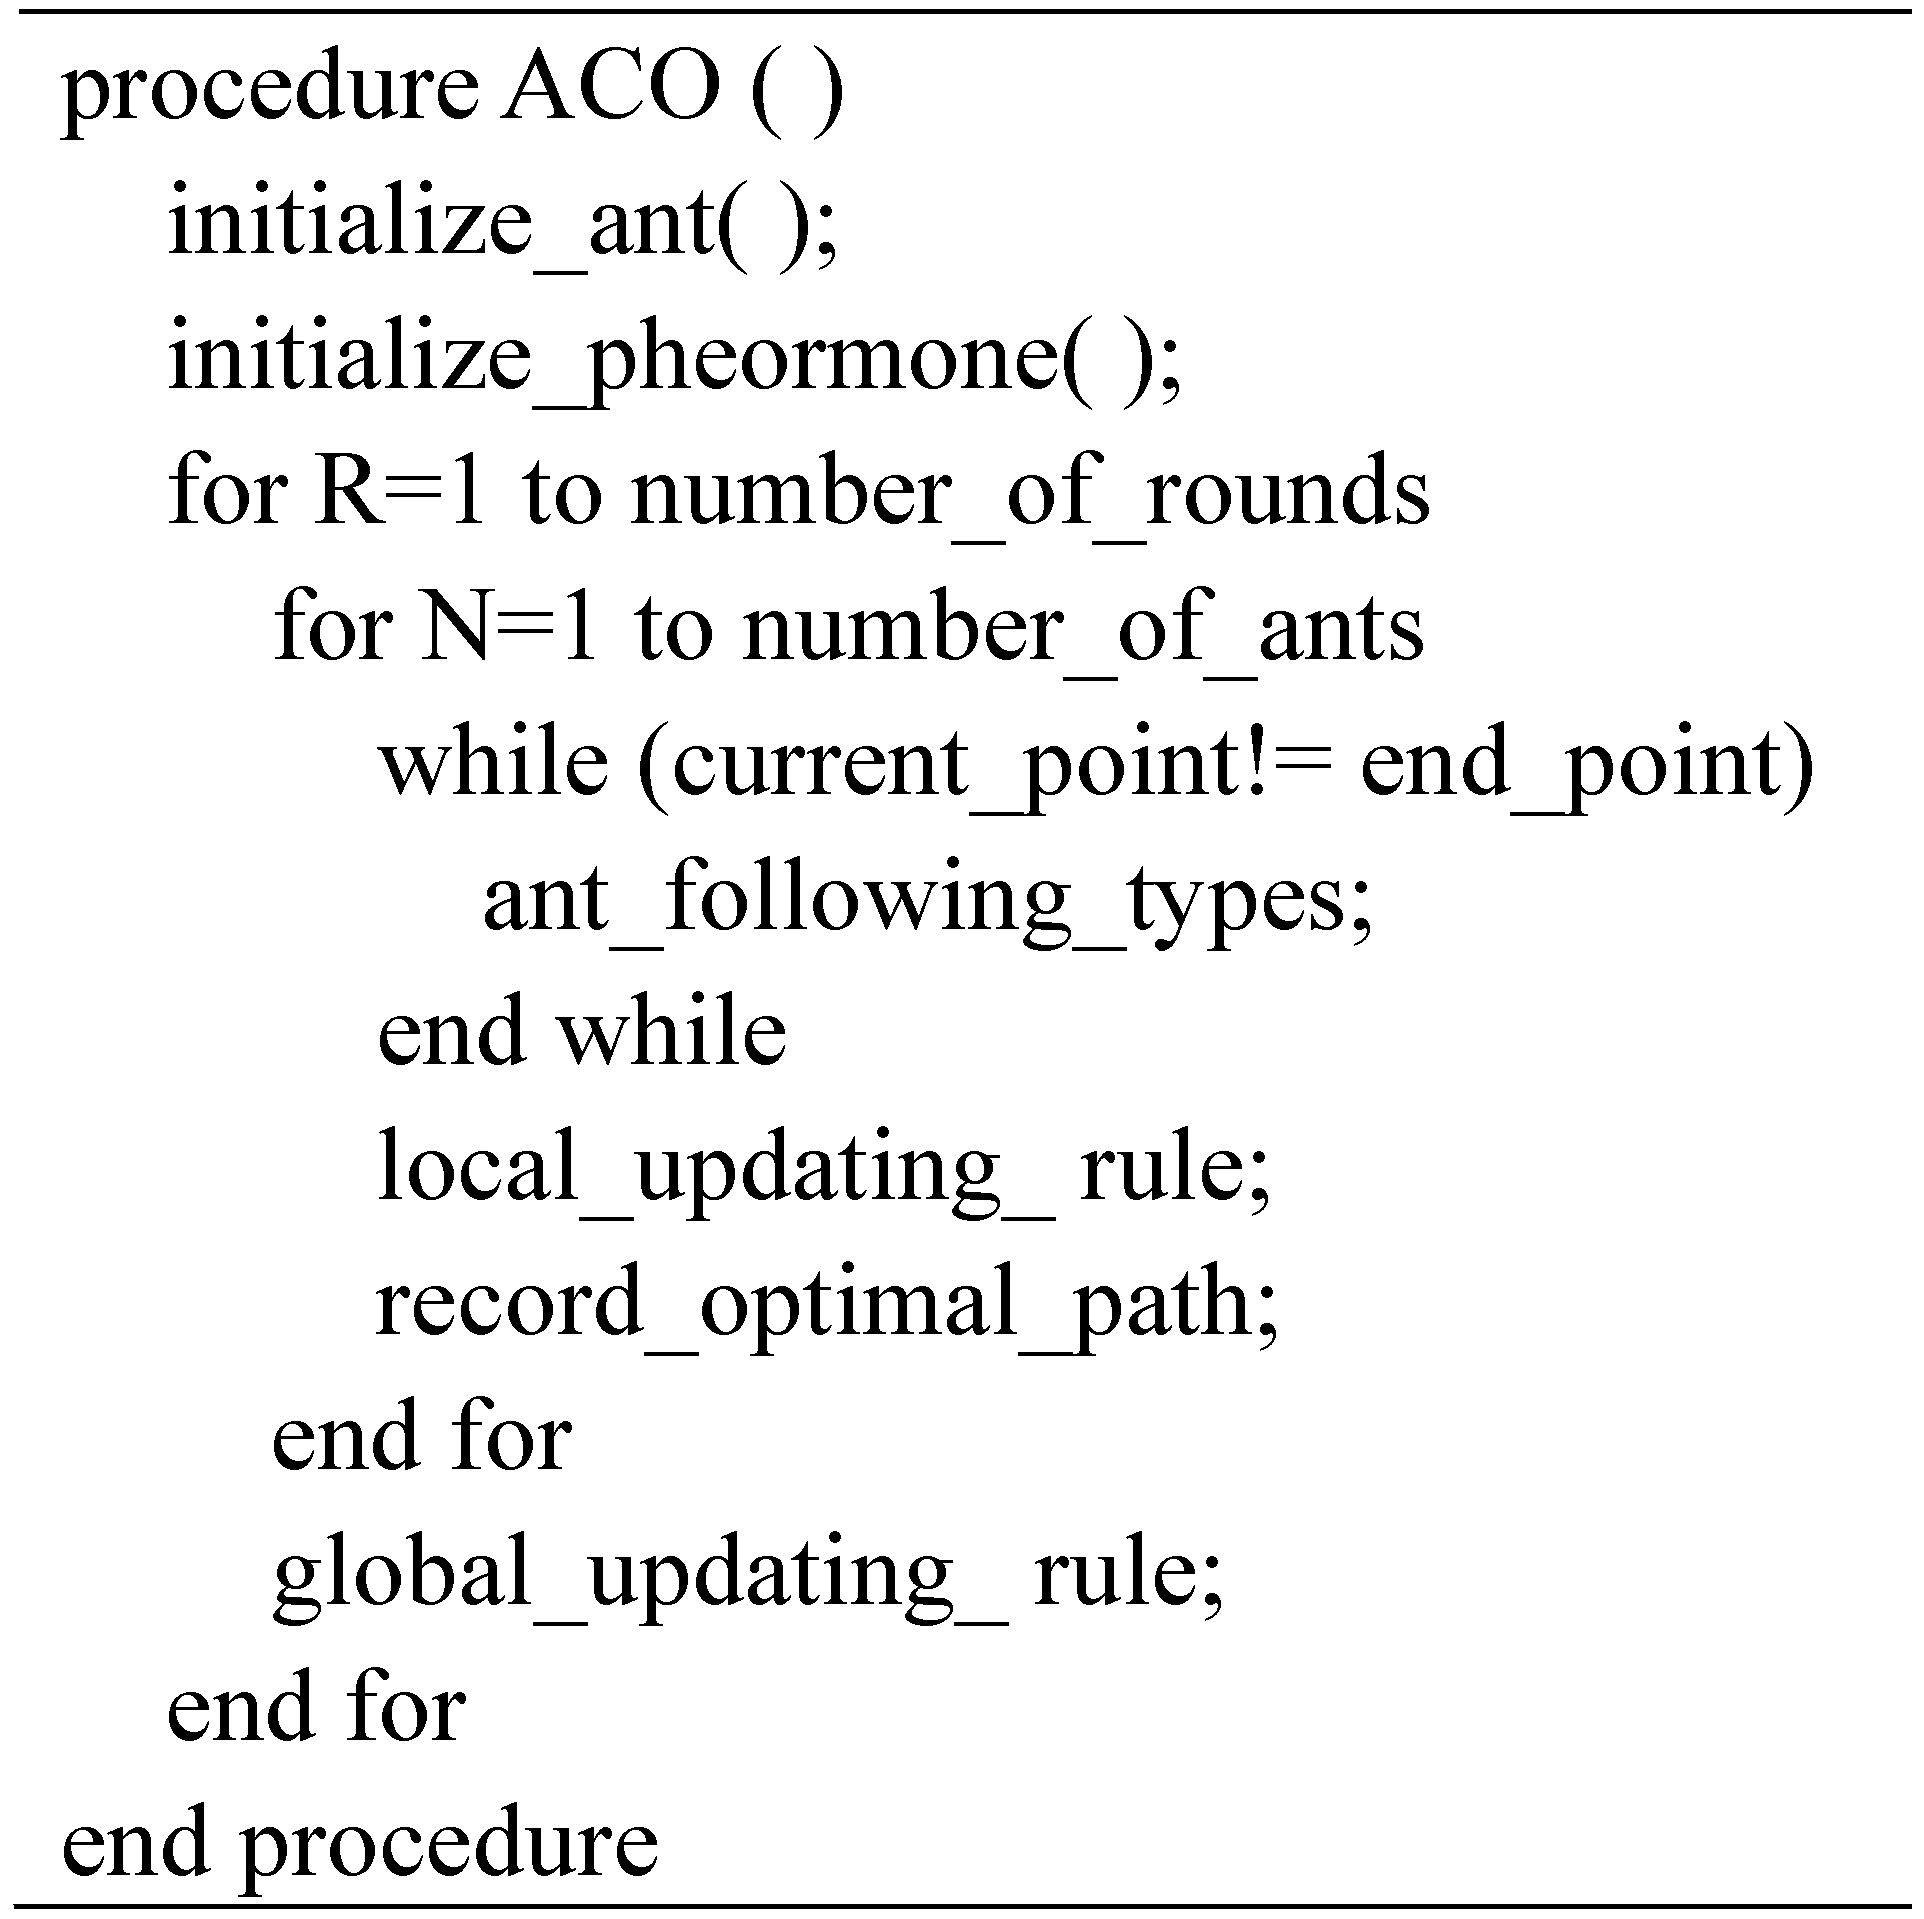
2.1. Ant Colony Algorithm
- (1)
- The ant will choose the path with higher pheromone levels.
- (2)
- For the shorter path, the accumulation rate of pheromone is faster than other paths.
- (3)
- The ants can communicate with each other with pheromones.
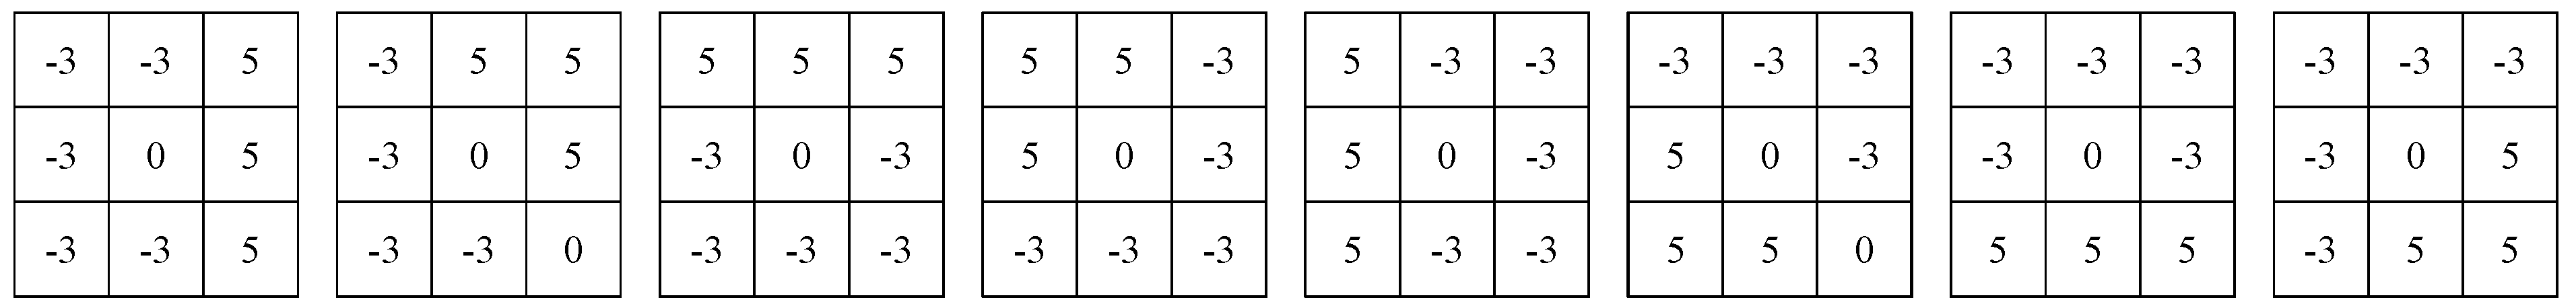
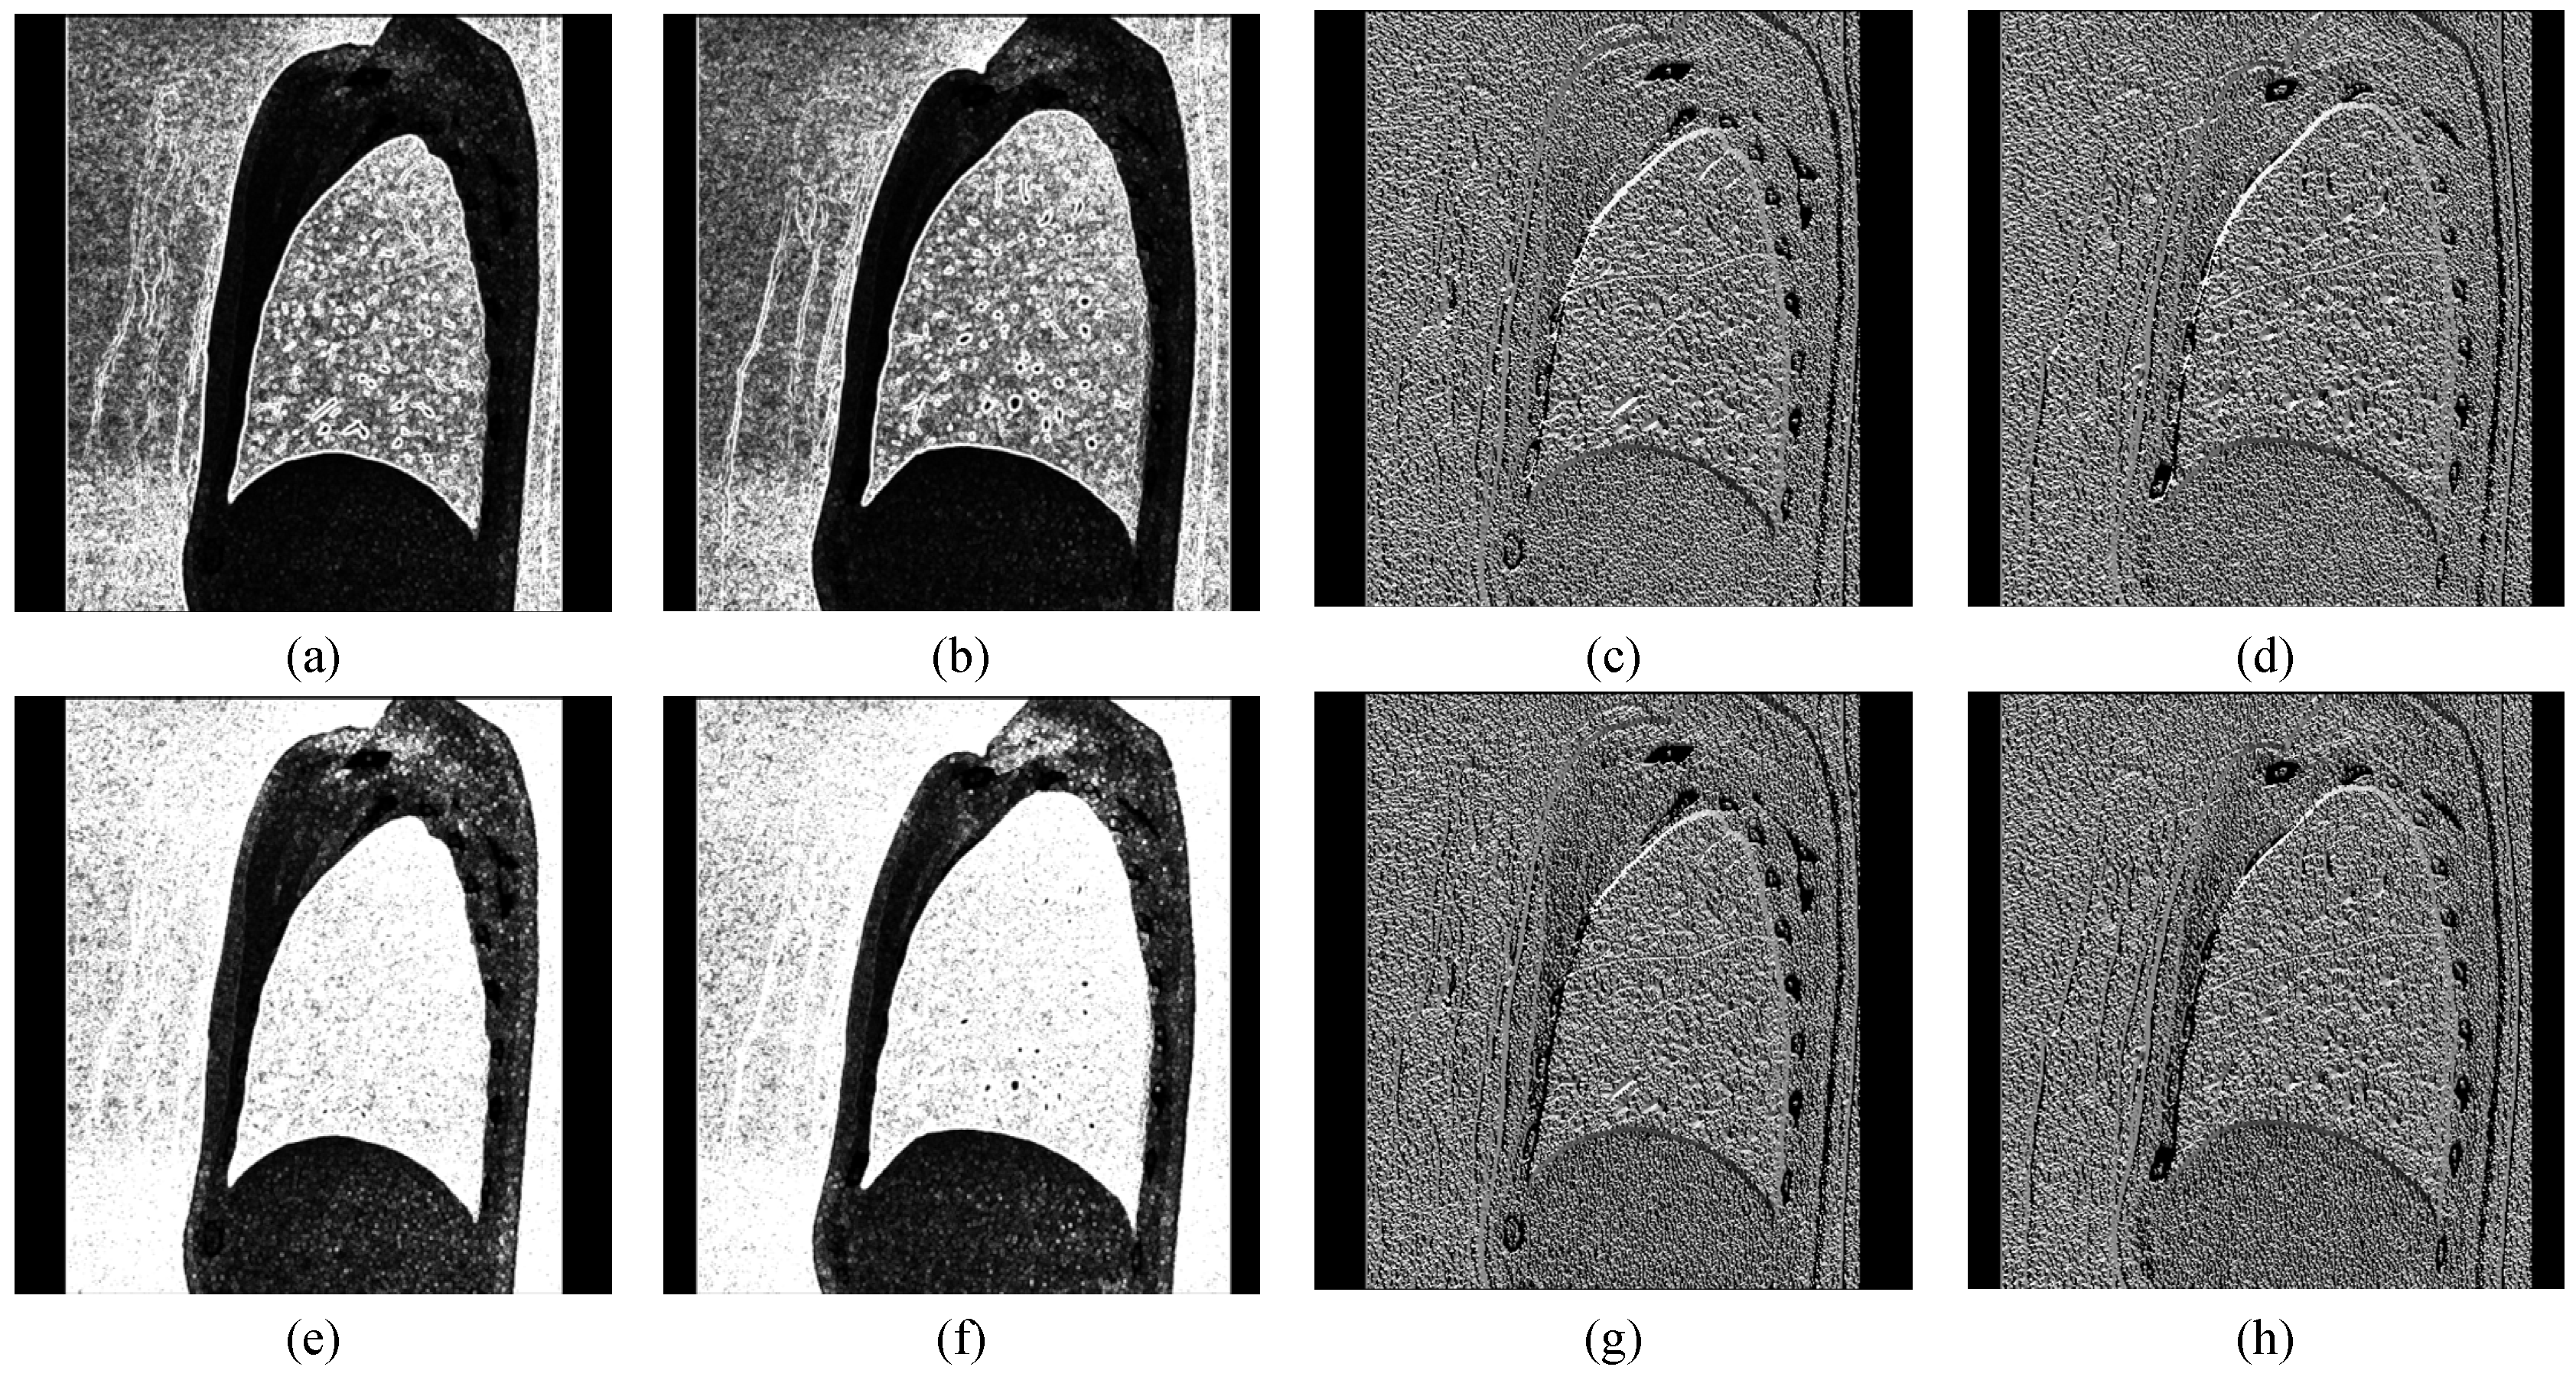
2.2. Robinson Filter and Kirsch Filter


3. Tracking Framework for Lobe Fissure Based on Modified ACO Algorithm
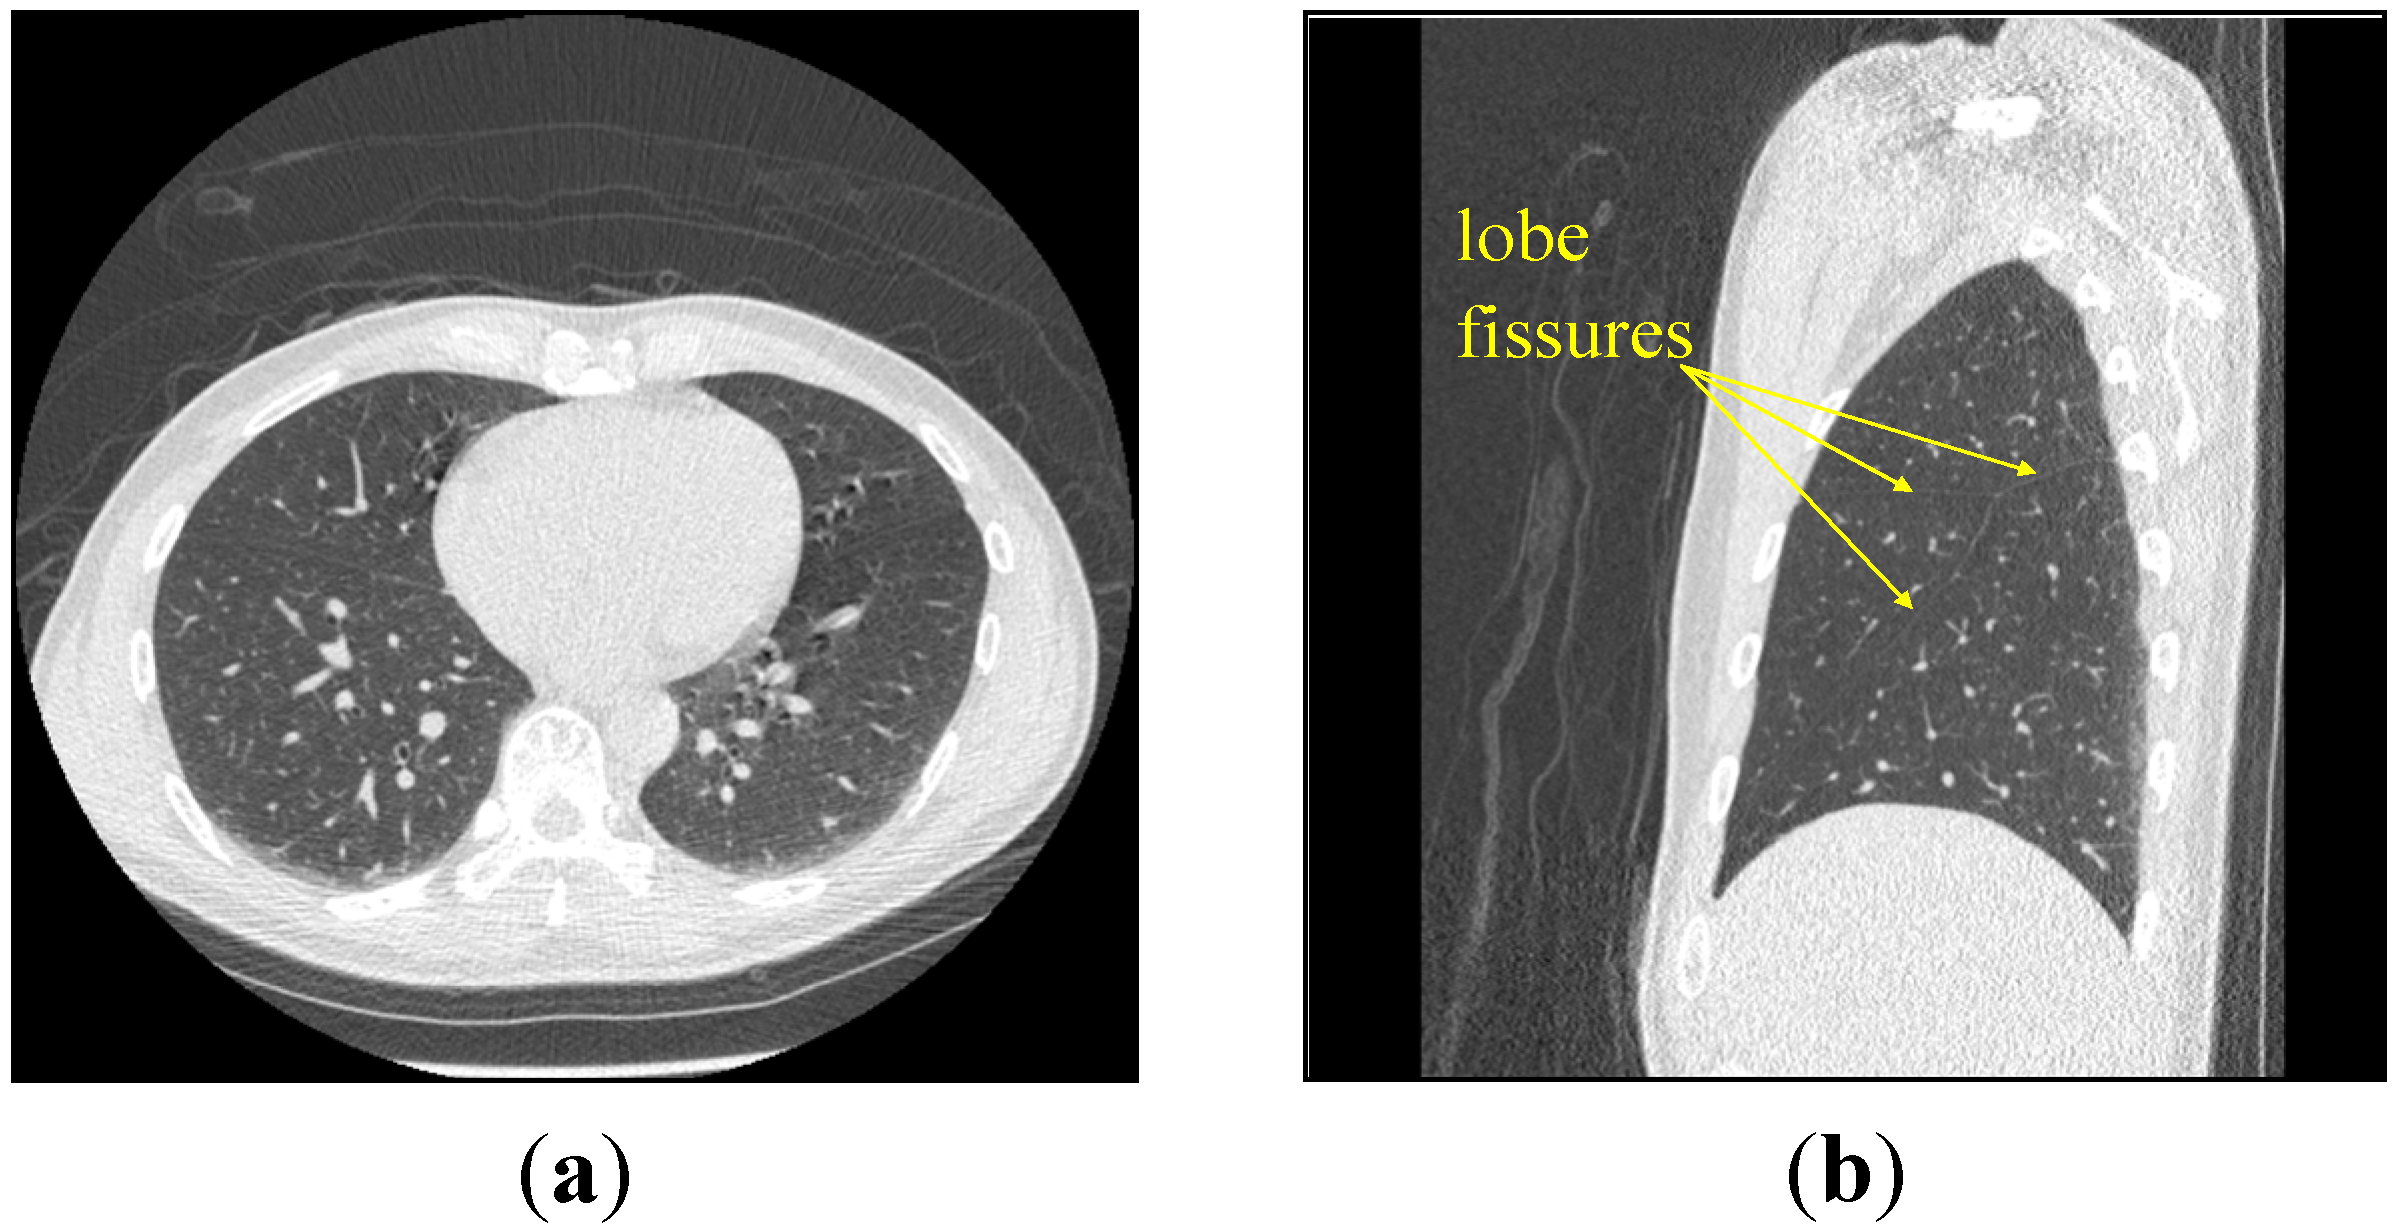
3.1. Data Acquisition
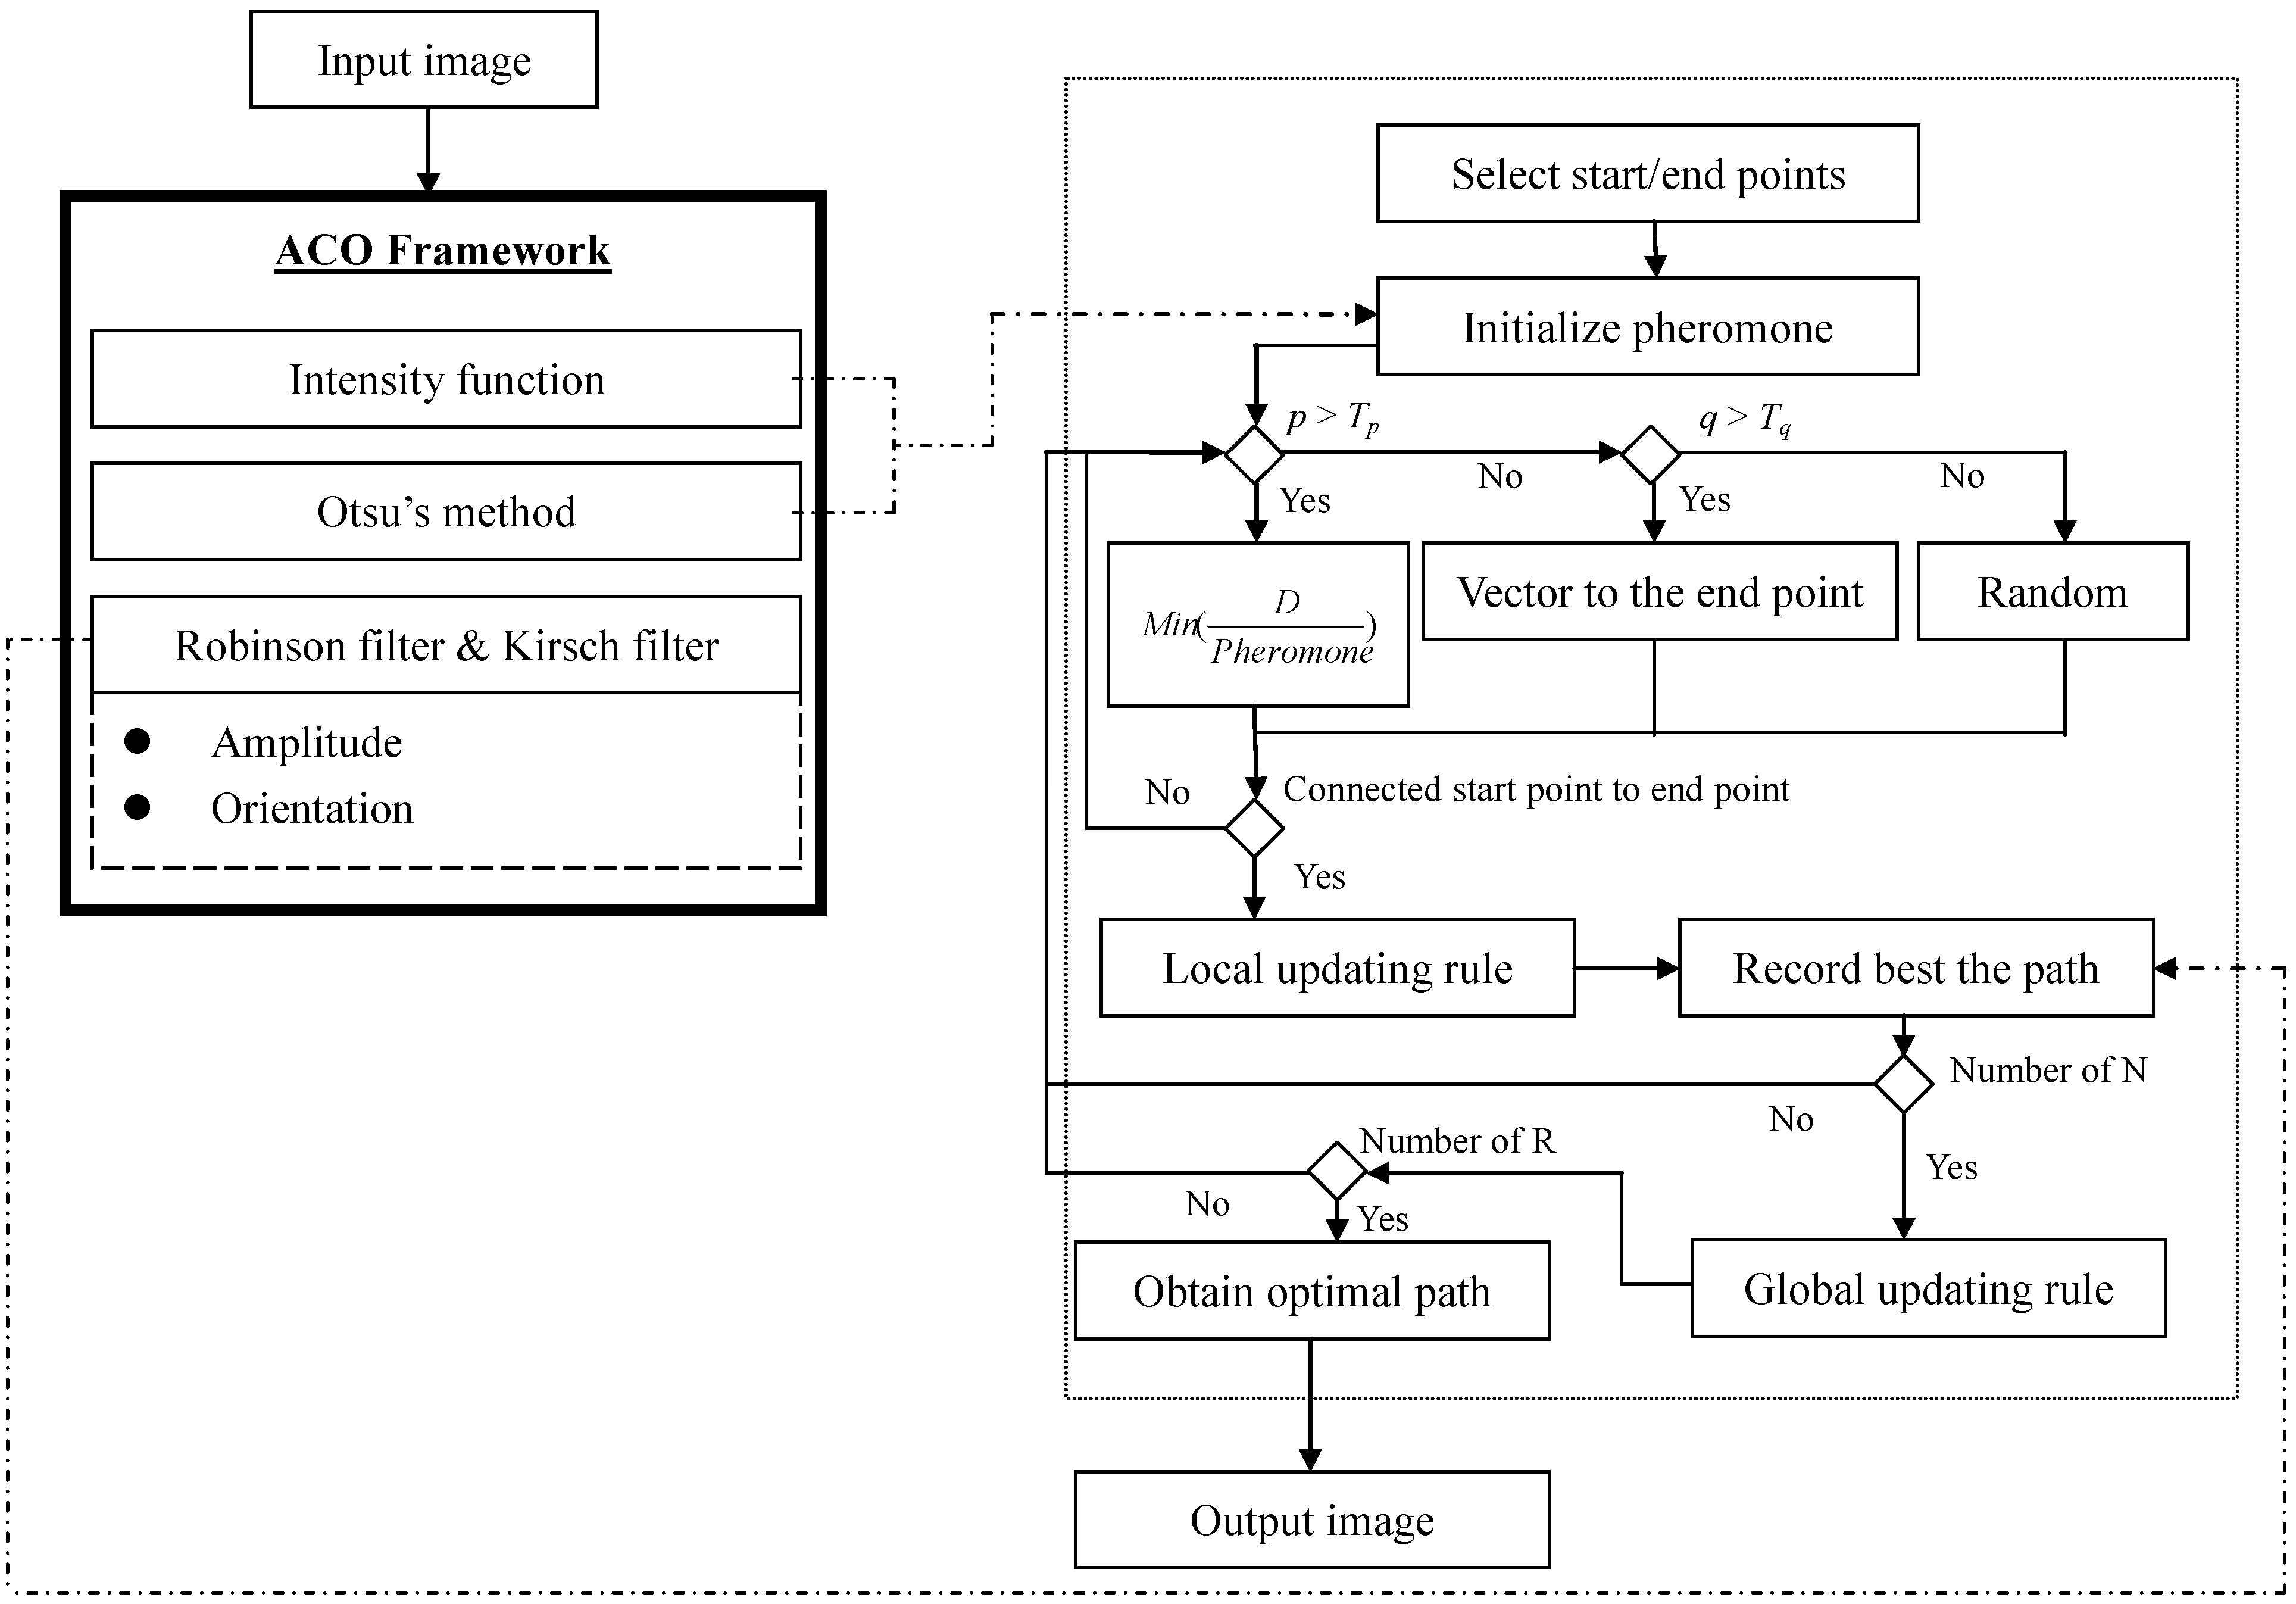
3.2. Design of the Modified ACO Method

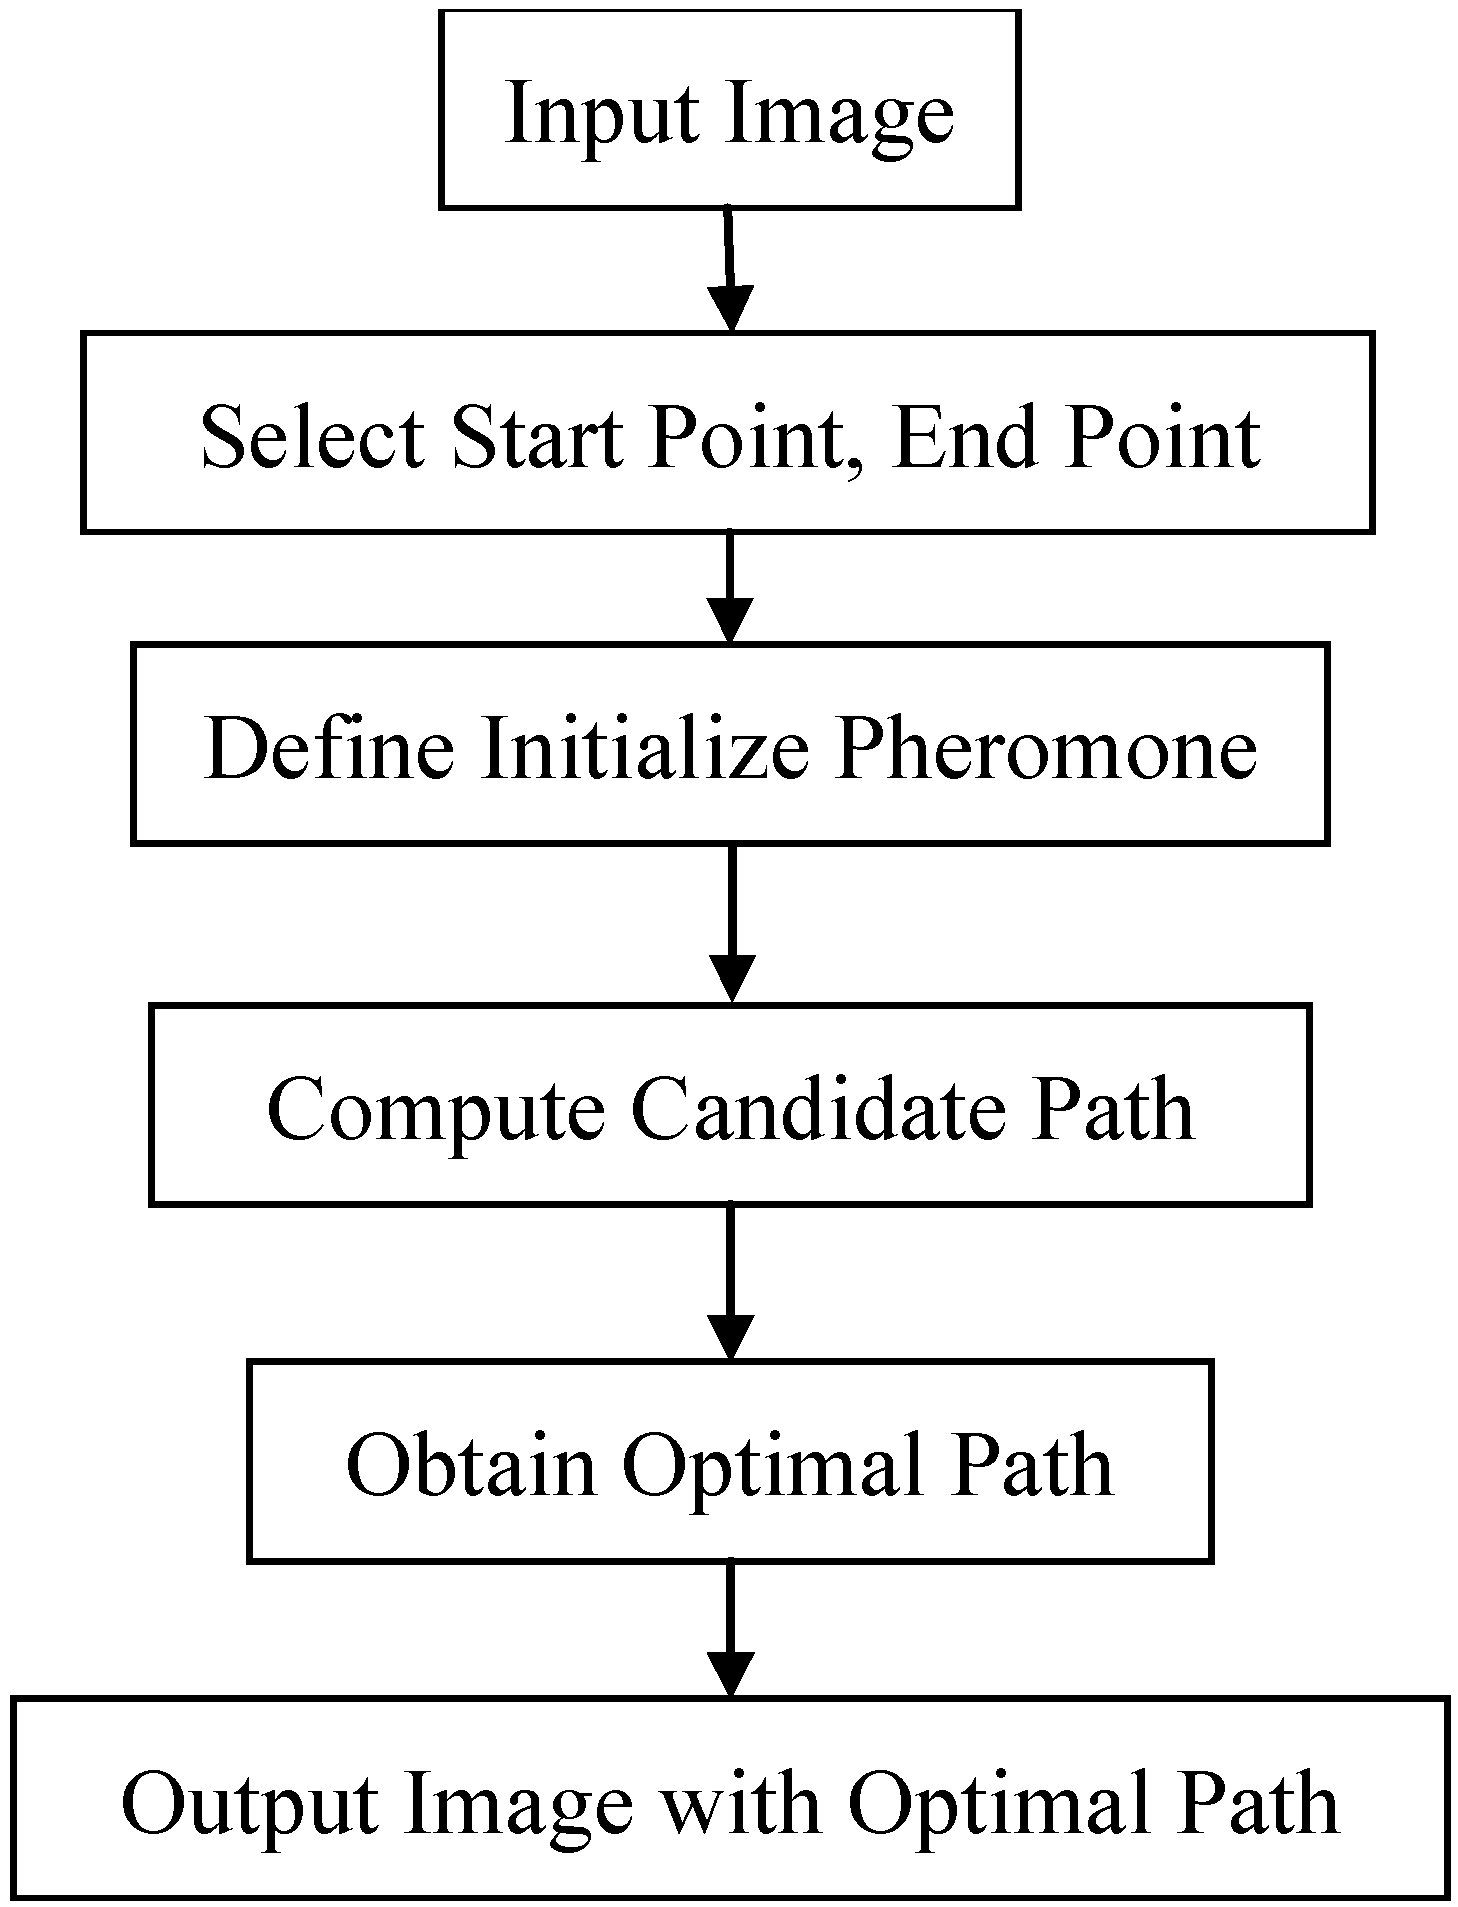
3.3. Define the Initial Pheromone
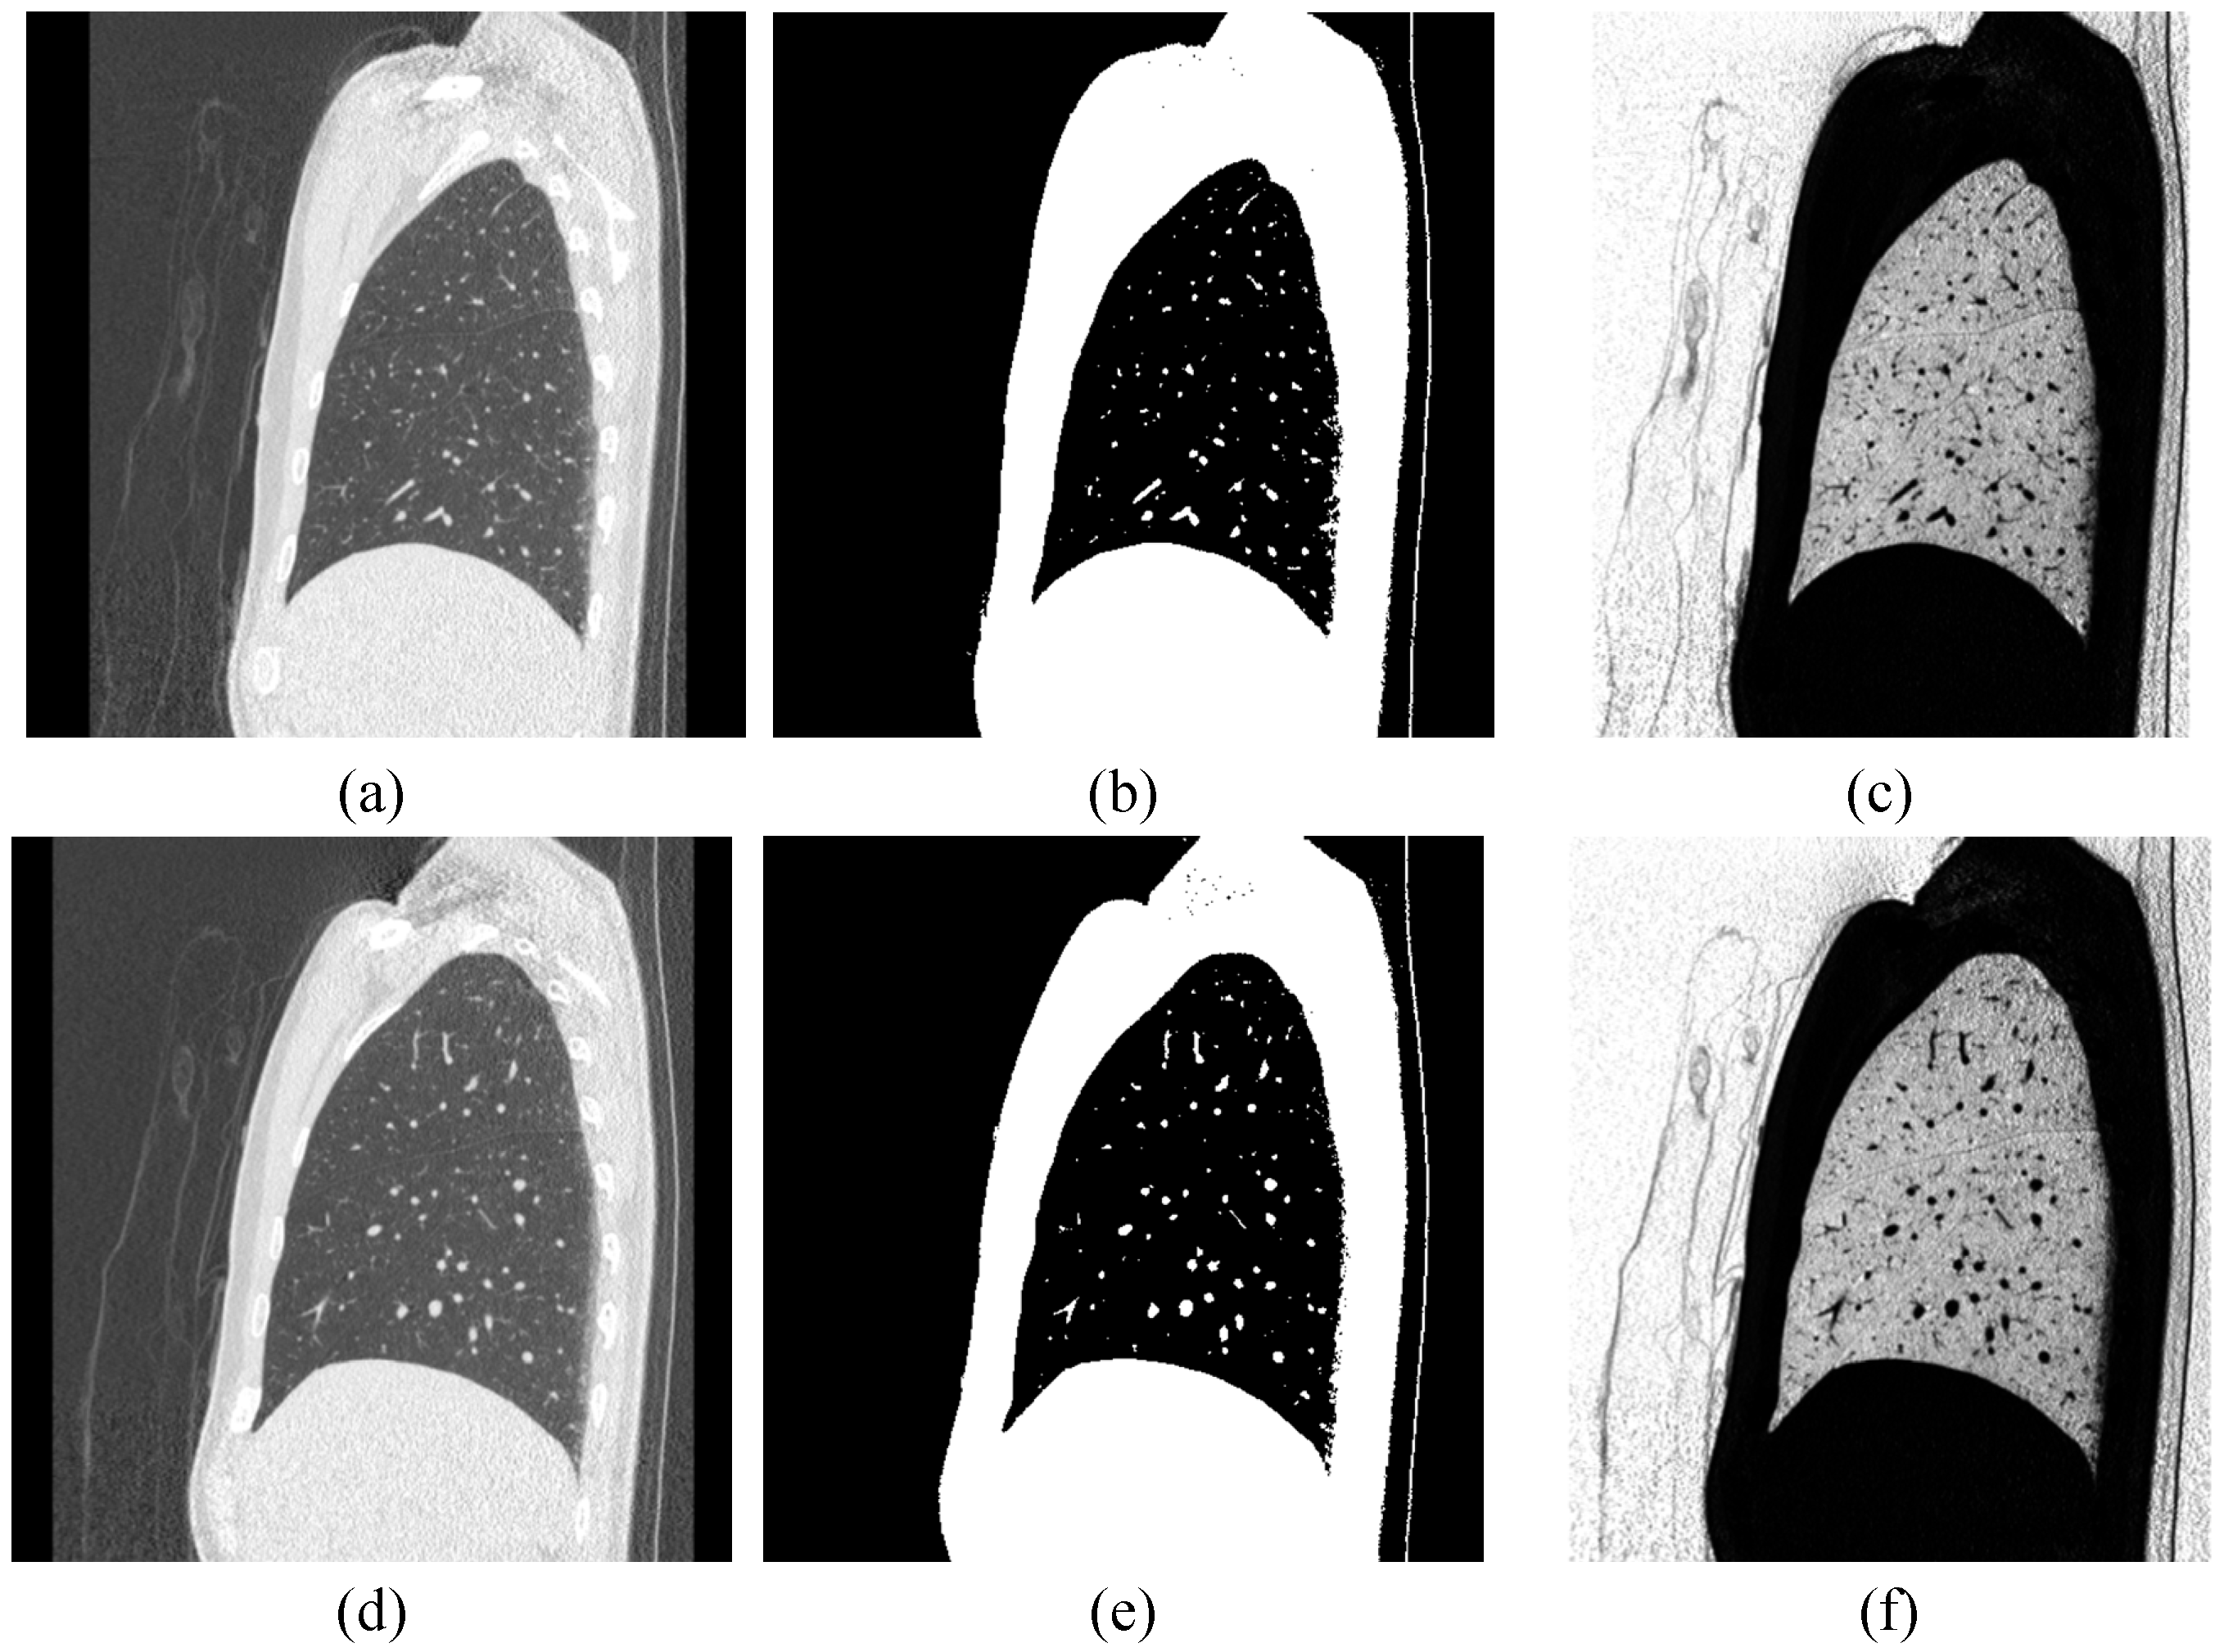
3.4. Edge Enhancement

3.5. The Updating Rule of Pheromone
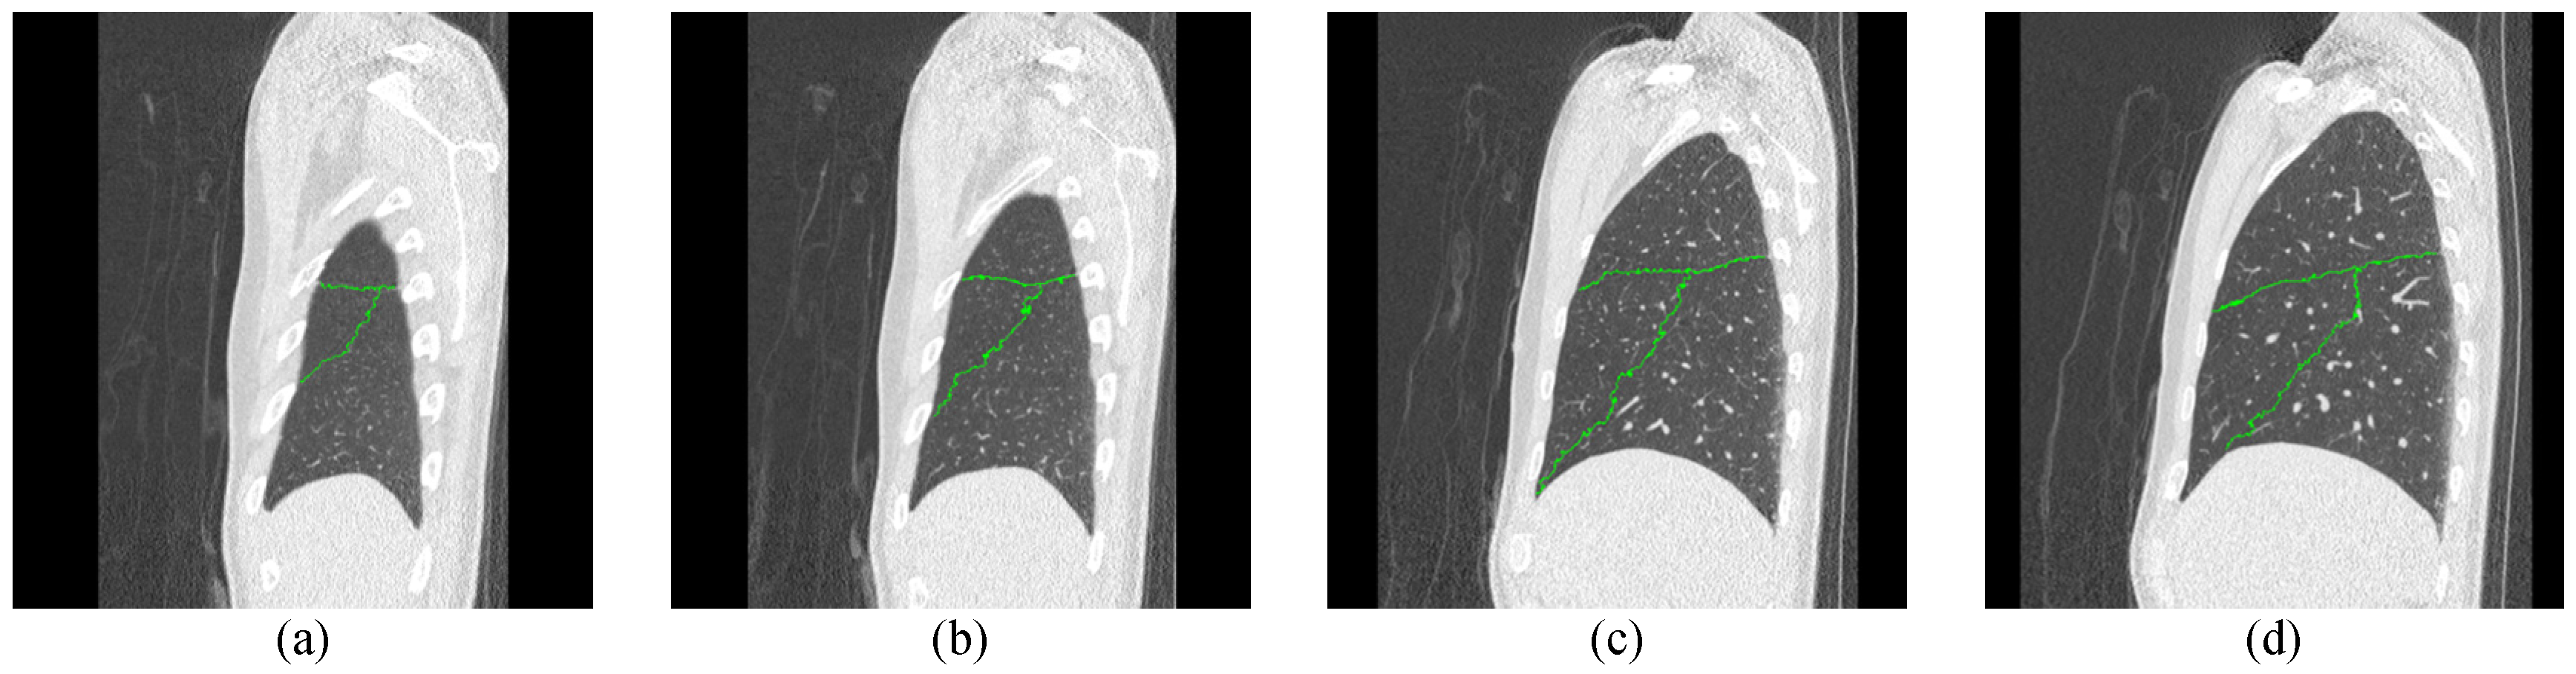
3.6. Optimal Path Detection


4. Experimental Results

| ACO | Intensity Function | Updating Rules |
|---|---|---|
| R = 5 | α = 605 | α = 0.8 |
| N = 10 | k = 4 | ρ = 0.6 |
| Tp = 0.5 | - | - |
| Tq = 0.8 | - | - |


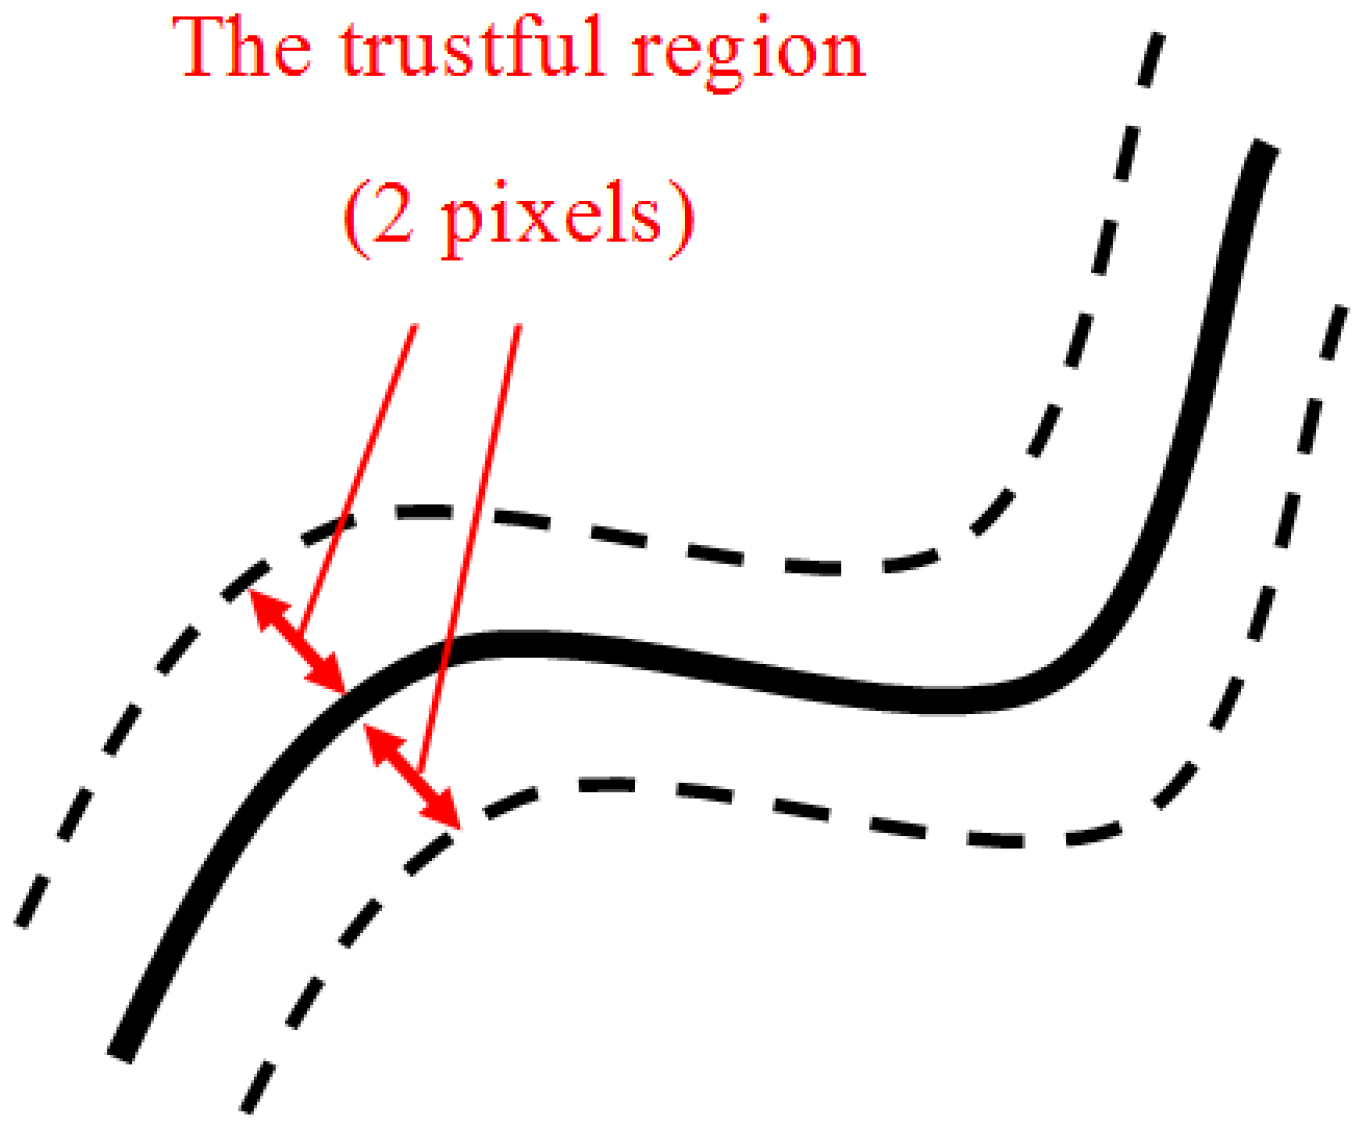
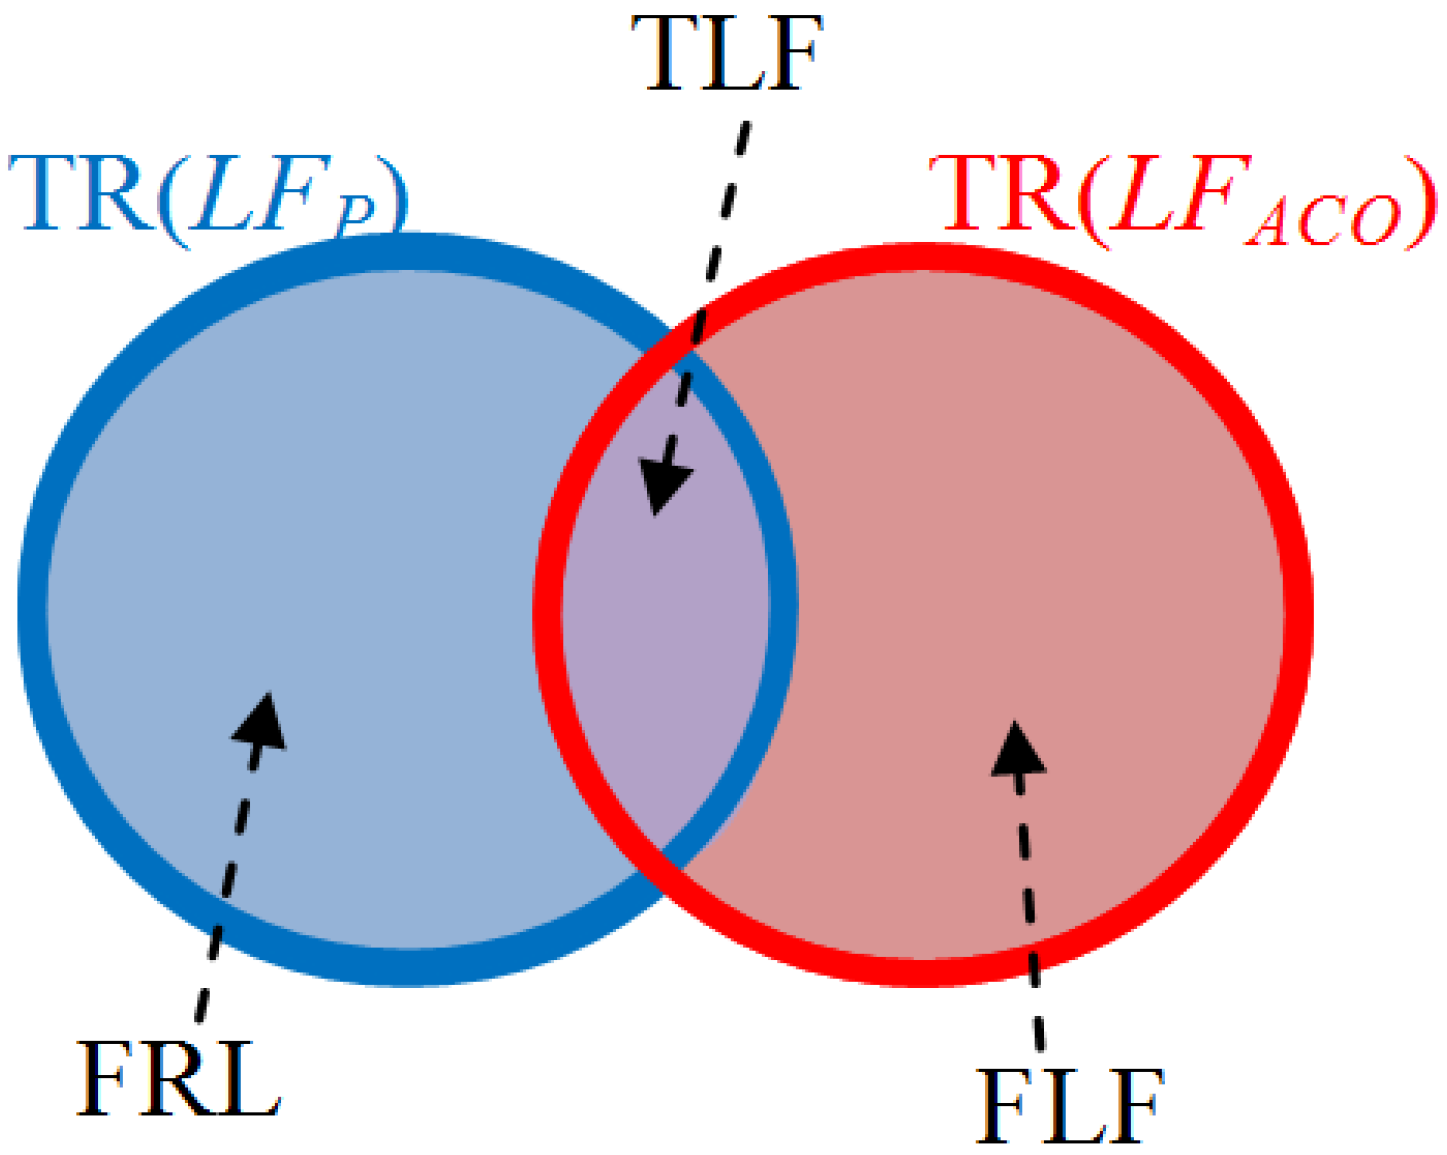
- The value of false lobe fissure (FLF): the TR(LFACO) is not overlapped on the trustful region of TR(LFP);
- The value of true lobe fissure (TLF): the TR(LFACO) is overlapped on the trustful region of TR(LFP);
- The value of false real lobe fissure (FRLF): the TR(LFP) is not overlapped on the trustful region of TR(LFACO);
| Case | Lung | Mean (%) | ||
|---|---|---|---|---|
| Precision | Recall | F-measure | ||
| 1 | Left | 88.7 | 81.79 | 85.1 |
| 2 | Left | 70.39 | 76.52 | 73.33 |
| 3 | Left | 78.65 | 84.95 | 81.68 |
| 4 | Left | 79.94 | 79.99 | 79.96 |
| 5 | Left | 83.77 | 87.51 | 85.6 |
| 6 | Left | 75.66 | 85.84 | 80.43 |
| 7 | Left | 82.21 | 89.4 | 85.65 |
| 8 | Left | 74.4 | 81.7 | 77.88 |
| 9 | Left | 76.09 | 84.36 | 80.01 |
| 10 | Left | 76.83 | 88.58 | 82.29 |
| 11 | Left | 72.13 | 81.62 | 76.58 |
| 12 | Left | 86.65 | 84.15 | 85.38 |
| 13 | Left | 71.38 | 79.37 | 75.16 |
| 14 | Left | 79.4 | 84.05 | 81.66 |
| 15 | Left | 77.72 | 88.5 | 82.76 |
| Average | 78.26 | 83.89 | 80.9 | |
| Case | Lung | Mean (%) | ||
|---|---|---|---|---|
| Precision | Recall | F-measure | ||
| 1 | Right | 80.32 | 85.73 | 82.94 |
| 2 | Right | 75.75 | 87.11 | 81.03 |
| 3 | Right | 78.46 | 83.97 | 81.12 |
| 4 | Right | 74.95 | 76.9 | 75.91 |
| 5 | Right | 77.06 | 85.45 | 81.04 |
| 6 | Right | 76.04 | 87.2 | 81.24 |
| 7 | Right | 86.06 | 86.01 | 86.03 |
| 8 | Right | 78.19 | 87.41 | 82.54 |
| 9 | Right | 85.56 | 86.06 | 85.81 |
| 10 | Right | 83.85 | 89.95 | 86.79 |
| 11 | Right | 79.24 | 88.27 | 83.51 |
| 12 | Right | 86.26 | 90.03 | 88.1 |
| 13 | Right | 75.81 | 86.63 | 80.86 |
| 14 | Right | 80.56 | 88.91 | 84.53 |
| 15 | Right | 77.15 | 85.49 | 81.11 |
| Average | 79.68 | 86.34 | 82.84 | |
5. Discussion
6. Conclusions
Acknowledgments
Author Contributions
Conflicts of Interest
References
- Awai, K.; Murao, K.; Ozawa, A.; Nakayama, Y.; Nakaura, T.; Liu, D.; Kawanaka, K.; Funama, Y.; Morishita, S.; Yamashita, Y.; et al. Pulmonary nodules: Estimation of malignancy at thin-section helical CT—Effect of computer-aided diagnosis on performance of radiologists. Radiology 2006, 4, 276–284. [Google Scholar] [CrossRef] [PubMed]
- Iwano, S.; Nakamura, T.; Kamioka, Y.; Ikeda, M.; Ishigaki, T. Computer-aided differentiation of malignant from benign solitary pulmonary nodules imaged by high-resolution CT. Comput. Med. Imaging Graph. 2008, 7, 416–422. [Google Scholar] [CrossRef] [PubMed]
- Kuhnigk, J.M.; Hahn, H.K.; Hindennach, M.; Dicken, V.; Krass, S.; Peitgen, H.O. Lung lobe segmentation by anatomy-guided 3D watershed transform. In Proceedings of the SPIE Medical Imaging 2003, San Diego, CA, USA, 15 February 2003; pp. 1482–1490.
- Wang, J.; Betke, M.; Ko, J.P. Pulmonary fissure segmentation on CT. Med. Image Anal. 2006, 8, 530–547. [Google Scholar] [CrossRef] [PubMed]
- Lassen, B.; Kuhnigk, J.M.; Friman, O.; Krass, S.; Peitgen, H.O. Automatic Segmentation of Lung Lobes in CT Images Based on Fissures, Vessels, and Bronchi. In Proceedings of the 2010 IEEE International Conference on Biomedical Imaging, Rotterdam, The Netherlands, 14–17 April 2010; pp. 560–563.
- Anitha, S.; Sridhar, S. Segmentation of Lung Lobes and Nodules in CT Images. Signal Image Process. 2010, 1, 1–12. [Google Scholar] [CrossRef]
- Benatcha, K.; Koudil, M.; Benkhelat, N.; Boukir, Y. ISA An algorithm for image segmentation using ants. In Proceedings of the IEEE International Symposium on Industrial Electronics (ISIE 2008), Cambridge, UK, 30 June–2 July 2008; pp. 2503–2507.
- Dorigo, M.; Birattari, M.; Stutzle, T. Ant colony optimization. IEEE Comput. Intell. Mag. 2006, 1, 28–39. [Google Scholar] [CrossRef]
- Dorigo, M.; Maniezzo, V.; Colorni, A. Ant system: Optimization by a colony of cooperating agents. IEEE Trans. Syst. Man Cybern. B Cybern. 1996, 26, 29–41. [Google Scholar] [CrossRef] [PubMed]
- Dorigo, M.; Gambardella, L.M. Ant colonies for the travelling salesman problem. Biosystems 1997, 43, 73–81. [Google Scholar] [CrossRef]
- Lee, J.W.; Kim, J.J.; Lee, J.J. Improved Ant Colony Optimization algorithm by path crossover for optimal path planning. In Proceedings of the IEEE International Symposium on Industrial Electronics (ISIE2009), Seoul, South Korea, 5–8 July 2009; pp. 1996–2000.
- Lee, M.E.; Kim, S.H.; Cho, W.H.; Park, W.; Lim, J.S. Segmentation of Brain MR Images Using an Ant Colony Optimization Algorithm. In Proceedings of the Ninth IEEE International Conference on Bioinformatics and Bioengineering (BIBE 2009), Taichung, Taiwan, 22–24 June 2009; pp. 366–369.
- Zhao, X.; Lee, M.E.; Kim, S.H. Improved Image Thresholding Using Ant Colony Optimization Algorithm. In Proceedings of the International Conference on Advanced Language Processing and Web Information Technology (ALPIT 2008), Dalian, China, 23–25 July 2008; pp. 210–215.
- Zhao, Y.; Chang, J. Analysis of Image Edge Checking Algorithms for the Estimation of Pear Size. In Proceedings of the 2010 International Conference on Intelligent Computation Technology and Automation, Changsha, China, 11–12 May 2010; pp. 663–666.
- Otsu, N. A Threshold Selection Method from Gray-Level Histograms. IEEE Trans. Syst. Man Cybern. 1979, 1, 62–66. [Google Scholar]
- Appia, V.; Patil, U.; Das, B. Lung fissure detection in CT images using global minimal paths. In Proceedings of the SPIE Medical Imaging 2010, San Diego, CA, USA, 13 February 2010. [CrossRef]
- Powers, D.W.M. Evaluation: From precision, recall and F-measure to ROC, informedness, markedness and correlation. Int. J. Mach. Learn. Technol. 2011, 2, 37–63. [Google Scholar]
- Ren, X. Multi-scale Improves Boundary Detection in Natural Images. In Proceedings of the 10th European Conference on Computer Vision, Marseille, France, 12–18 October 2008; pp. 533–545.
- Kokkinos, I. Boundary Detection Using F-Measure-, Filter- and Feature-(F3) Boost. In Proceedings of the 11th European Conference on Computer Vision, Heraklion, Greece, 5–11 September 2010; pp. 650–663.
- Galun, M.; Basri, R.; Brandt, A. Multiscale Edge Detection and Fiber Enhancement Using Differences of Oriented Means. In Proceedings of the IEEE 11th International Conference on Computer Vision (ICCV 2007), Rio de Janeiro, Brasil, 14–21 October 2007; pp. 1–8.
© 2014 by the authors; licensee MDPI, Basel, Switzerland. This article is an open access article distributed under the terms and conditions of the Creative Commons Attribution license (http://creativecommons.org/licenses/by/4.0/).
Share and Cite
Chen, C.-J.; Wang, Y.-W.; Shen, W.-C.; Chen, C.-Y.; Fang, W.-P. The Lobe Fissure Tracking by the Modified Ant Colony Optimization Framework in CT Images. Algorithms 2014, 7, 635-649. https://doi.org/10.3390/a7040635
Chen C-J, Wang Y-W, Shen W-C, Chen C-Y, Fang W-P. The Lobe Fissure Tracking by the Modified Ant Colony Optimization Framework in CT Images. Algorithms. 2014; 7(4):635-649. https://doi.org/10.3390/a7040635
Chicago/Turabian StyleChen, Chii-Jen, You-Wei Wang, Wei-Chih Shen, Chih-Yi Chen, and Wen-Pinn Fang. 2014. "The Lobe Fissure Tracking by the Modified Ant Colony Optimization Framework in CT Images" Algorithms 7, no. 4: 635-649. https://doi.org/10.3390/a7040635
APA StyleChen, C.-J., Wang, Y.-W., Shen, W.-C., Chen, C.-Y., & Fang, W.-P. (2014). The Lobe Fissure Tracking by the Modified Ant Colony Optimization Framework in CT Images. Algorithms, 7(4), 635-649. https://doi.org/10.3390/a7040635