Article

InfoVis Interaction Techniques in Animation of Recursive Programs

by
J. Ángel Velázquez-Iturbide
* and
Antonio Pérez-Carrasco
Departamento de Lenguajes y Sistemas Informáticos I, Universidad Rey Juan Carlos, 28933 Madrid, Spain
*
Author to whom correspondence should be addressed.
Algorithms 2010, 3(1), 76-91; https://doi.org/10.3390/a3010076
Submission received: 8 December 2009 / Revised: 18 January 2010 / Accepted: 25 January 2010 / Published: 10 February 2010

Abstract

:
Algorithm animations typically assist in educational tasks aimed simply at achieving understanding. Potentially, animations could assist in higher levels of cognition, such as the analysis level, but they usually fail in providing this support because they are not flexible or comprehensive enough. In particular, animations of recursion provided by educational systems hardly support the analysis of recursive algorithms. Here we show how to provide full support to the analysis of recursive algorithms. From a technical point of view, animations are enriched with interaction techniques inspired by the information visualization (InfoVis) field. Interaction tasks are presented in seven categories, and deal with both static visualizations and dynamic animations. All of these features are implemented in the SRec system, and visualizations generated by SRec are used to illustrate the article.

Graphical Abstract

1. Introduction

Recursion is a fundamental concept in Computer Science education, especially in programming courses. Its role varies from course to course. It is one of the concepts learnt in introductory courses to programming, but it is a programming construct applied in algorithm courses. For example, dynamic programming algorithms are usually stated recursively in a first phase and transformed into a tabulated, iterative version in a second phase. As a consequence, an animation system of recursion may be a valuable tool for any course where recursion plays an important role, in particular in algorithm courses.
Teaching and learning algorithms are often assisted by animations. Animations typically assist in understanding algorithms, but they could also assist in their analysis. We are not using the word “analysis” in any restricting sense (e.g., “complexity analysis”), but in the more general sense used by Bloom et al. [1]:
“The student is able to distinguish, classify and relate hypothesis and evidences of the information given, as well as decomposing a problem into its parts.”
We are interested in using animations to assist in analyzing interactively the behavior of recursive algorithms: in other words, we seek a kind of “software oscilloscope” [2] for recursion. Support for the analysis of algorithms is typically provided by debuggers, which are very flexible, complex systems. Therefore, animations for the analysis of recursive algorithms must exhibit as powerful visualization features as debuggers do. We show that such analysis power can be feasibly achieved by using interaction techniques inspired by the information visualization (InfoVis) field.
In this article, we discuss and illustrate interaction techniques aimed at giving flexible, comprehensive support to recursion analysis in animation systems. Section 2 shows common, effective visualizations of recursion, in general and also as supported by different systems, especially by the SRec system [3]. Section 3 shows interaction techniques tailored to the interactive analysis of recursive algorithms. These techniques are classified into seven categories, and they deal with both static visualizations and dynamic animations. Finally, we summarize our conclusions in Section 4.

2. Visualization of Recursion

In this section, we first present different visualizations of recursion. We then present the visualizations supported by the SRec system. Finally, we survey different visualization systems of recursion, and show the very limited facilities they provide to the user to interact with visualizations. In order to keep the discussion short, we restrict our survey to the imperative paradigm.

2.1. Visualizations of Recursion

There is no single visualization of recursion. A small number of visualizations can be found in the literature, for instance, traces, the control stack and recursion trees (e.g., [4]). Another visualization, used in visualization systems, is called “multiple copies” (e.g., [5]) and shows a different copy of either code or data for each recursive call.
We also find additional visualizations or variants of the visualizations cited above for specific cases of recursion. For instance, Stern and Naish [6] propose three visualizations for different recursive operations; their main feature is that they combine control and data. The most important class of recursive algorithms is divide-and-conquer. Variants of either traces or recursion trees have also been used to better illustrate divide-and-conquer algorithms [7 (p.158),8]; at each step, they focus on a part of the main data structure. It has also been noticed that some visualizations are effective both to show the inductive definition and the run-time behavior of divide-and-conquer algorithms, for instance, a sequence of visualizations of the main data structure [8].
No matter the quality of visualization, it will have merits and drawbacks and will be more useful for some aims. For instance, traces are good for novices, as they can easily follow the sequential flow of execution. Therefore, a system will probably be more useful if it provides multiple views, so that the user is able to choose the most adequate for the task she wants to perform.

2.2. Visualizations of Recursion in SRec

In this article, we focus on the visualizations generated by the SRec animation system. SRec supports visualization and animation of recursion in any Java algorithm, with the only restriction of using primitive data types. Versions 1.0 and 1.1 of SRec provided three general views (namely, traces, the control stack, and recursion trees) [3]. Version 1.1 enhanced substantially its interaction facilities, as shown here. Finally, version 1.2 of SRec supports three additional visualizations, specific to divide-and-conquer algorithms [8]; the system is currently capable of simultaneously showing two views. This evolution is partially due to the results of usability evaluations it has been subject to.
SRec is a program animation system that generates animations (semi)automatically. The user may load any file containing Java source code, and it is preprocessed. If the file contains any divide-and-conquer algorithms, the user must identify them in a dialog. Then, the user may launch any method invocation, and during its execution a trail of relevant events is generated. After completion, the user may freely interact with its visualization and animation, which is automatically generated from the trail. The user has available five visualizations for divide-and-conquer algorithms and three visualizations for general recursive algorithms. We do not describe here implementation details, as they can be found elsewhere [9].
In the rest of the article, we use the well-known function fib for the Fibonacci series to illustrate recursive algorithms in general, and mergesort for divide-and-conquer algorithms.
The three general visualizations are briefly described:
  • Recursion tree. This visualization allows display of the complete history of a recursive process as a tree. The root corresponds to the initial invocation. The children of a node are the recursive calls that it has invoked, from left to right in chronological order. Leaves represent calls corresponding to base cases. Every node is displayed with two areas, where the top area contains input values of parameters and the bottom one the result of the invocation (if the method does not return any value, the output state of parameters can be displayed). For example, Figure 1(a) displays the computation state for fib (5) where most recursive calls finished their execution, but the active call fib (1) and pending calls fib (3) and fib (5). In SRec, two states are displayed for every invocation: immediately after the invocation entry, and immediately before the invocation exit. The node framed in black in Figure 1(a) is the active node, so its computation is close to exit. Nodes framed in red correspond to pending invocations. In the figure, input values have a blue background and output values have a green background.
  • The control stack. The control stack is an internal data structure of the virtual machine that makes possible the execution of programs with subroutines. In SRec, records of the control stack only contain input and output values, so they have the same structure as the nodes of recursion trees. The control stack initially contains the first invocation. On entry of a method invocation, a new record is pushed at the top of the stack, becoming the active record. This new record contains input values, but the output area is empty. On exit of a method invocation, the output area of the record at the top is filled with the call results and it is later popped. Figure 1(b) displays the control stack at the same instant as Figure 1(a). Visualizations of the control stack can be quite complex [10]. Notice however that the control stack, as displayed by SRec, is isomorphic to the rightmost branch of its associated recursion tree.
  • Trace. A trace is a textual description of the sequence of events that take place during the execution of an algorithm, here entry or exit of every method invocation. Each entry (or exit) is represented as a text line that contains an indication that it is an entry (or exit), the method name and its actual parameters (or results). Using a color convention allows differentiating entry and exit invocations. In addition, indentation is commonly used to represent the level of nesting of invocations. Figure 1(c) contains a trace of the same computation of fib (5). Notice that the trace is isomorphic to a traversal of the recursion tree, where input values are printed inorder and ouput values are printed postorder.
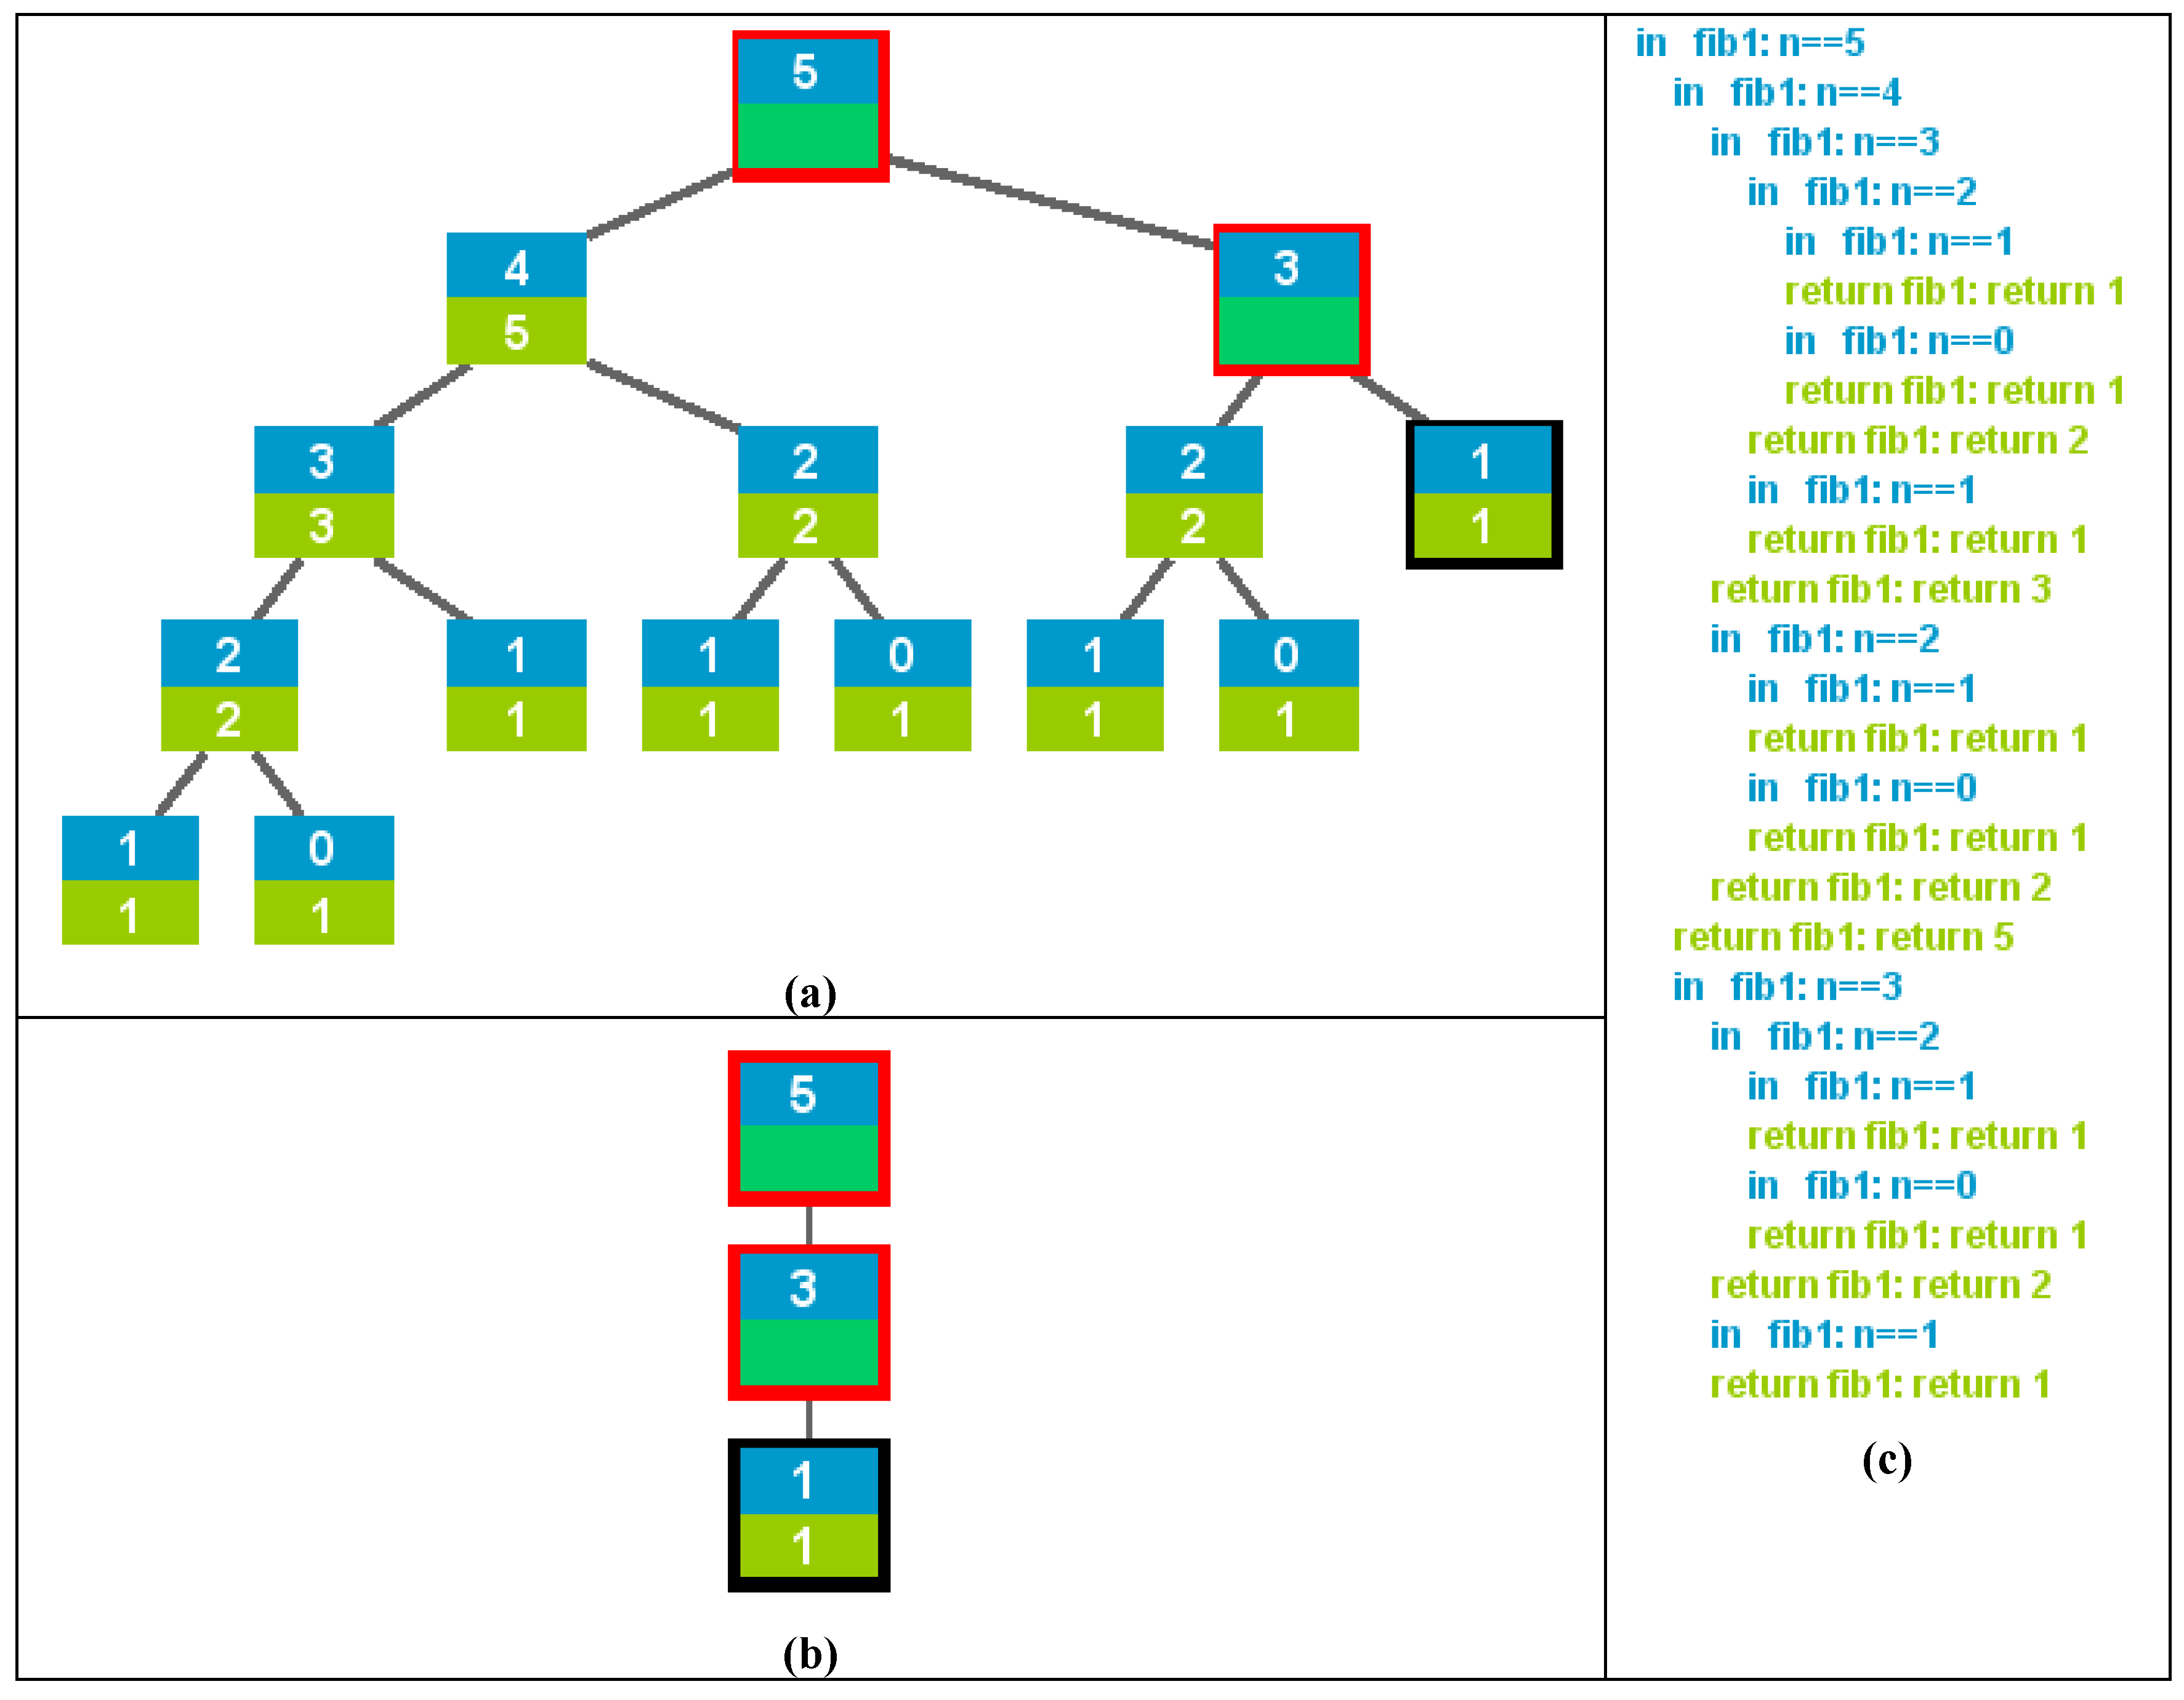
Figure 1. Three visualizations of fib (5): (a) recursion tree, (b) control stack, and (c) trace.
Algorithms 03 00076 g001
Three additional representations, specific for divide-and-conquer algorithms, are supported by SRec. We briefly explain them below:
  • Divide-and-conquer recursion tree. Divide-and-conquer algorithms typically manipulate a large data structure, but in most recursive calls, the focus of interest is limited to a part of it (i.e. a substructure). An effective variant of recursion trees for divide-and-conquer algorithms consists of displaying the whole structure with the relevant substructure highlighted. SRec supports this additional display for vectors and matrices. Figure 2(a) shows this representation when mergesorting the array {0,4,9,6,8,3}.
  • Sequence of visualizations of the data structure. This representation consists of a sequence of visualizations of the state of the data structure, displayed top-down. It can be considered a variant of the trace visualization, which differs in the layout and in the amount of information displayed. Every time a recursive call is invoked, the array state is displayed. In order to better illustrate the algorithm behavior, each line only shows the subarray delimited in the recursive call. Every time a recursive call exits, the output state of its associated subarray is displayed adjacent to its input state. Again, the relative placement and the use of colors allow differentiating input and output states of subarrays. Figure 2(b) shows this view at the same state as Figure 2(a).
  • Colored data structure. This is a mixed view that displays both the state of the data structure to manipulate and hints about the recursive process. In particular, if the data structure is a vector, a set of bars is displayed below the vector. The bars mirror the recursive process by underlining the subarray delimited in each recursive call. A coloring scheme that distinguishes input and output is also applied here. For each underlying bar, the coloring scheme indicates whether the corresponding recursive call is pending or finished. For each subarray, the scheme indicates whether the last update of its state by a recursive invocation was made with input or output values. Tones are also used to represent the distance in the activation tree to the active call. Figure 2(c) shows this representation at the same instant as Figure 2(a).

2.3. Systems for Recursion Animation

Programming environments fully support the analysis of execution, but they hardly support specific analysis of recursion. These are the most promising systems to analyze recursion, as they have available all the information on program execution, which should be rendered and interacted with adequate user interfaces. We point out ETV [11], a tool that allows visualizing the execution of a C++ program from the trace generated in execution time.
Some systems were specifically designed to learn recursion. Most of them are based on the “copies model” of recursion, that is, they show a different copy of either code or data for each recursive call. We may cite Recursion Animator [5], SimRECUR [12], Function Visualizer [13] and EROSI [14]. Flopex 2 [15] is an Excel extension for visual programming. EROSI, Recursion Animator and SimRECUR have been successfully evaluated.
We have compared SRec to these systems with respect to several issues: generality, effort to construct animations, visualization and animation features, and interaction features. We used two features to characterize system generality, namely methods to visualize, and range of types and input data supported. With respect to the methods visualized, Function Visualizer and Recursion Animator only visualize the first written method, while ETV and SRec are more flexible as they allow selecting any method. Only SRec allows changing interactively the set of visualizable methods. With respect to the range of types and input data supported, the literature reports that EROSI and SimRECUR are (again) very restrictive, SRec supports primitive data types, and the rest of the systems “seem” to allow any Java data type.
Figure 2. Three visualizations of mergesort ({0,4,9,6,8,3}): (a) divide-and-conquer recursion tree, (b) sequence of visualizations of a data structure, and (c) colored data structure.
Algorithms 03 00076 g002
The second feature we compared was the effort required for constructing animations. EROSI and SimRECUR only visualize predefined examples, Flopex 2 requires user construction of the recursion visualization, and the other four systems (including SRec) are automatic, which is the most comfortable method to construct animations.
The comparison with respect to visualization and animation features can be found in Table 1. Notice that SRec is the system that offers more views and has the most complete set of animation controls.
Finally, we found very few interaction facilities in most systems (with the exception of SRec). According to the system descriptions available in the literature, these systems do not have interaction facilities except for animation. The exception is ETV, which allows expanding/contracting nodes in the recursion tree, and transferring control to the entry of a function call.
Table 1. Comparison of visualization and animation features in several animation systems of recursion.
SystemVisualizationsAnimation controls
EROSICopies model (variables)Step forwards
Automatic play
Exit
ETVCopies model (code)
Traces
Recursion tree
Step/complete
Forwards/backwards
Manual
Restart/finish
Exit
Flopex 2Control stack
Recursion tree
Step forwards
Automatic play
Restart
Function VisualizerCopies model (code and variables)Step forwards
Automatic play
Exit
Recursion AnimatorCopies model (variables)Step by step
Forwards/backwards
Manual/automatic
Exit
SimRECURCopies model (code)
Control stack
Recursion tree
Step forwards
Manual/automatic
Exit
SRecTraces
Control stack
Recursion tree (general and divide-and-conquer)
Colored data structure
Sequence of visualizations of the data structure
Step/step over/complete
Forwards/backwards
Manual/automatic
Restart/finish
Exit

3. Interacting with Visualizations and Animations of Recursion

Effective algorithm analysis demands more than static visualizations, but advanced interaction to give the user the capability to enquire flexibly. As there are many ways of interacting with visualizations, we need a framework to analyze interaction support. Consequently, we adopt a comprehensive framework [16] from information visualization, a very demanding field in this regard. The authors classify different kinds of interaction into seven categories, namely encode, connect, filter, abstract/elaborate, explore, reconfigure, and select.
However, we must bring attention to an important issue. Program visualization can be considered a subfield of information visualization, but it also has some specific features. In particular, programs may be visualized statically “in space” (i.e., their declaration or their state), but also dynamically “in time” (i.e., evolution of its state during execution). This feature is called program animation, and the most common interaction techniques are animation controls. As we are dealing with program visualizations, we take this duality space-time into account.
In the following, we show how the categories can be effectively used to interact with recursion. Each category is first introduced by quoting a sentence from [16] that summarizes its meaning. Then, we present techniques of that category that allow interacting with recursion visualizations, both static and dynamic.

3.1. Encode

“Encode interaction techniques enable users to alter the fundamental visual representation of the data including visual appearance (e.g., color, size, and shape) [16].”
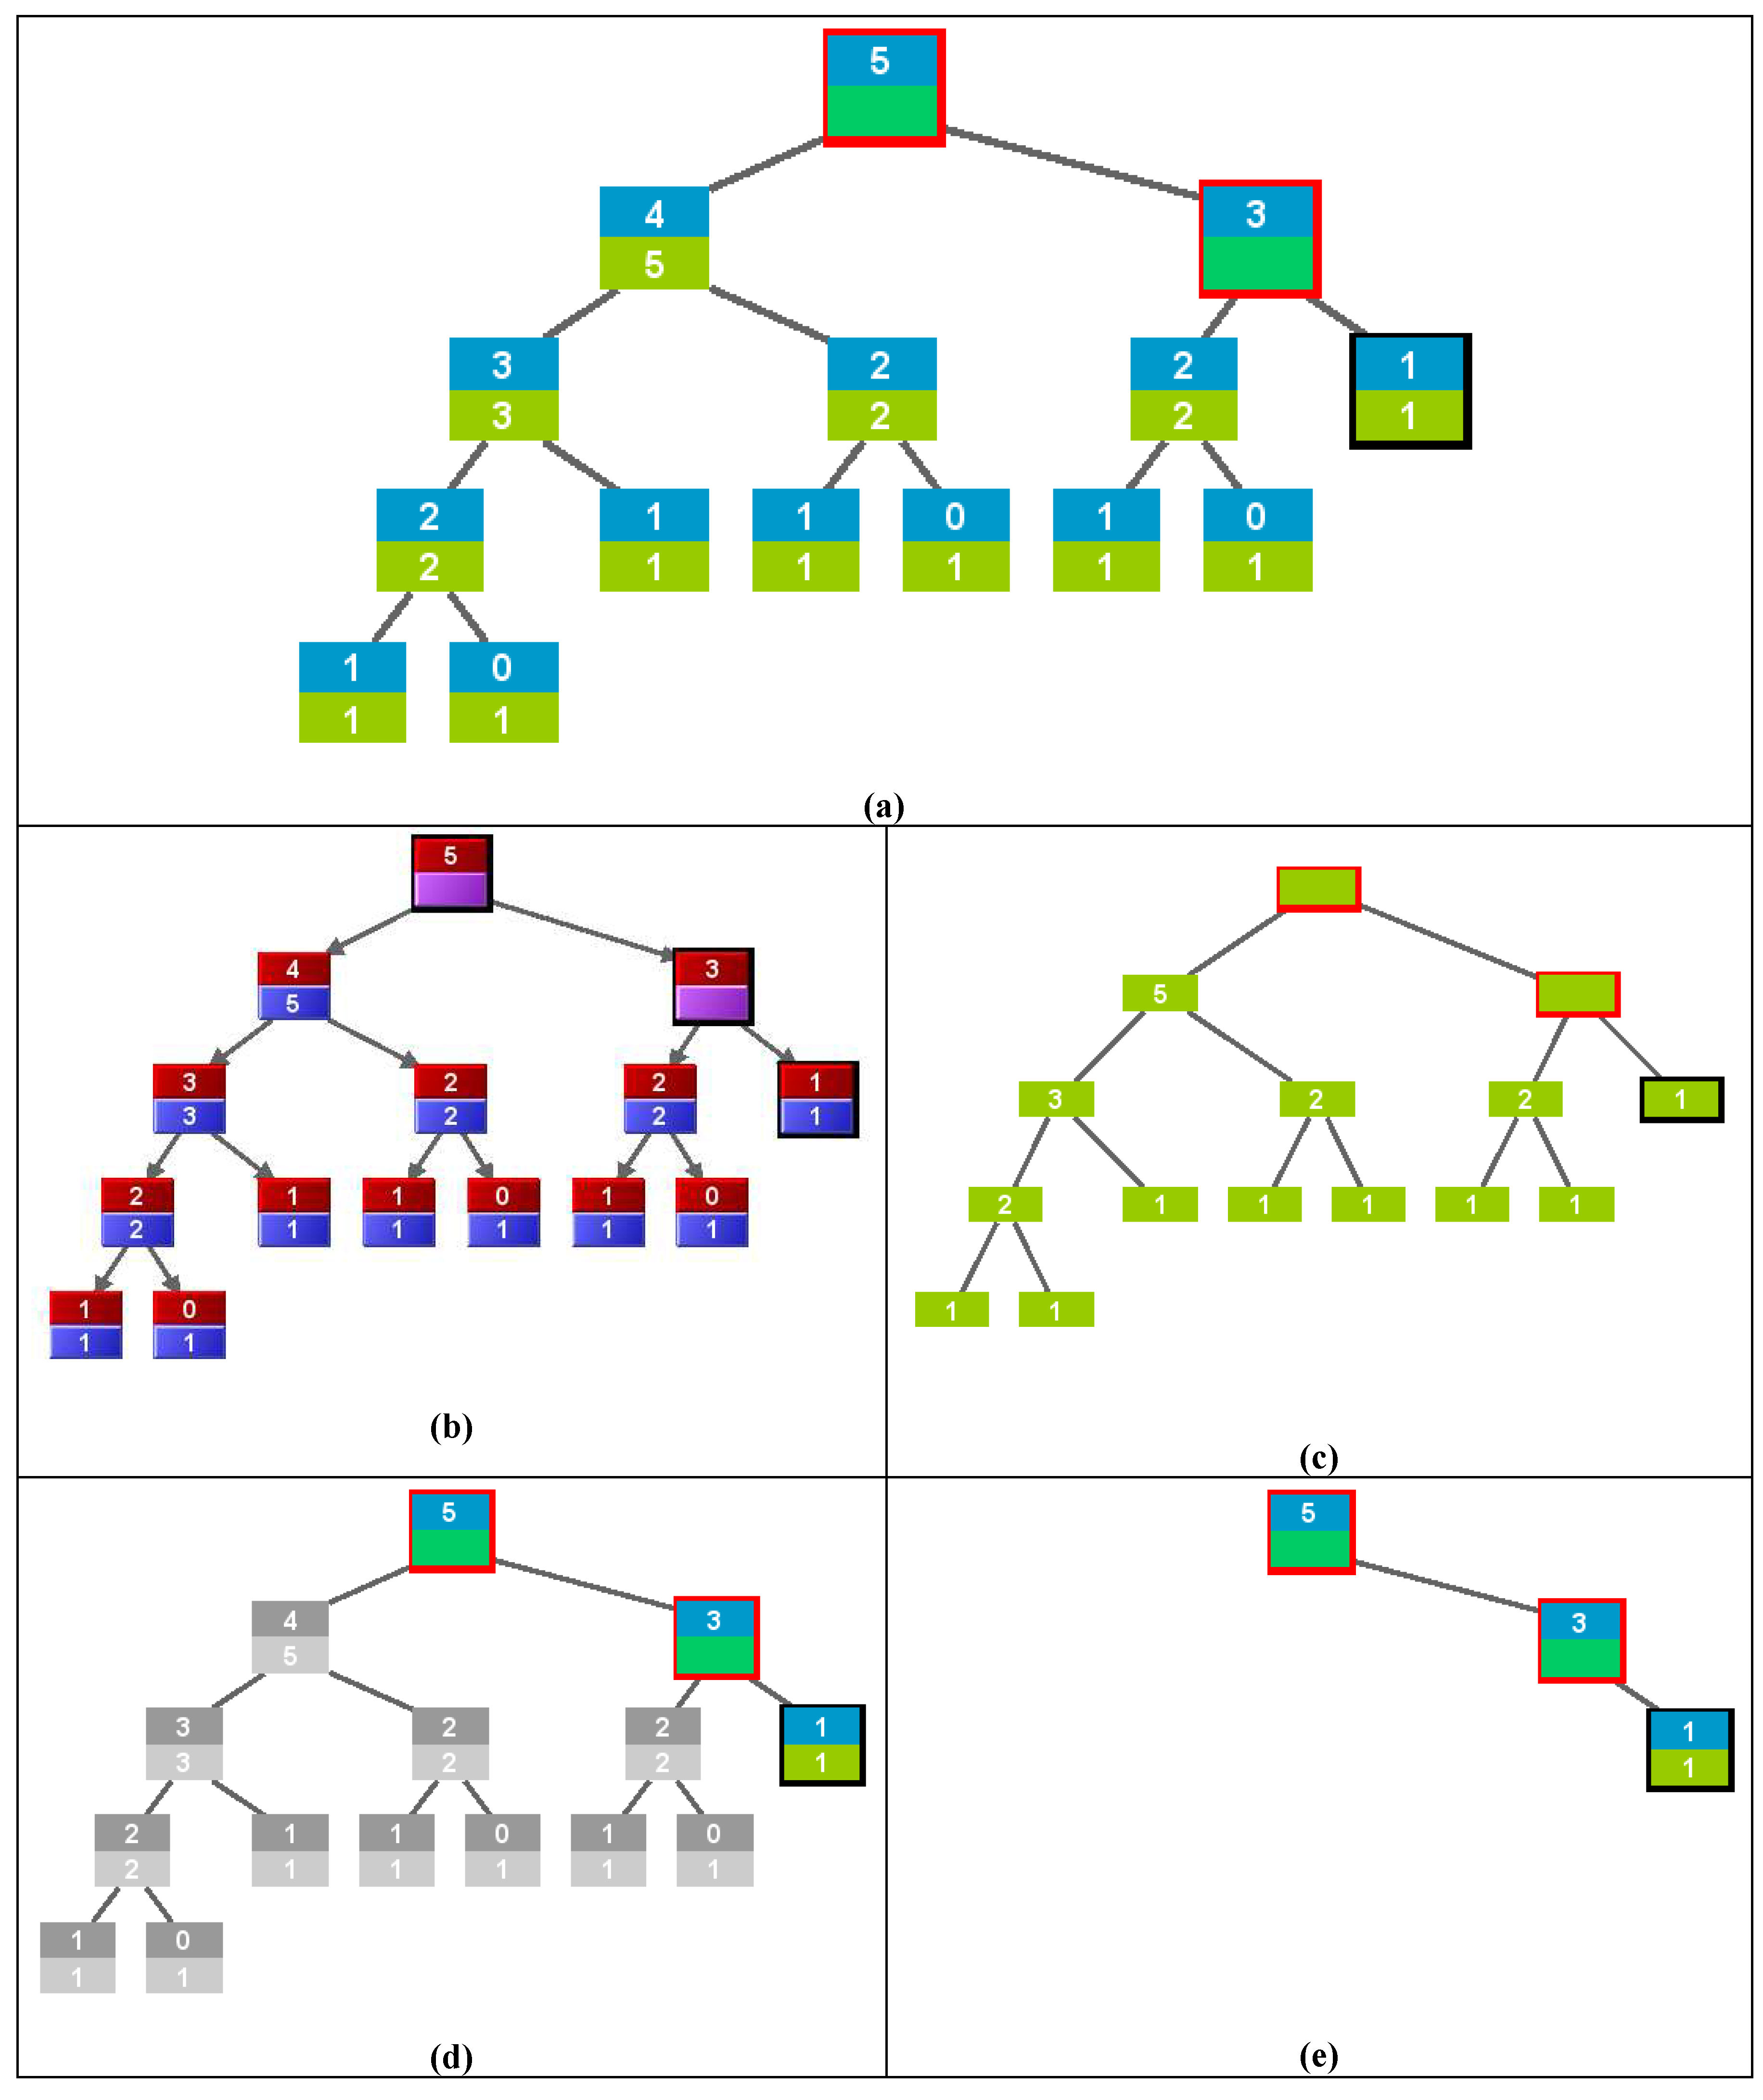
According to this definition, the most straightforward alteration consists of changing visual appearance. For example, Figure 3(a) displays the same computation state as Figure 1(a), close to execution termination. Changing colors and line and border styles leads to Figure 3(b).
More drastic variations lead to different graphical representations of the same information, i.e., multiple views. We identified alternative views of recursion in Section 2.1 and Section 2.2. Figure 4 shows two views, as displayed by the SRec system, of a computation state of fib (11). The views are contained in the central and right panels; corresponding to a recursion tree and control stack, respectively. The left panel contains the algorithm source code.

3.2. Connect

“Connect refers to interaction techniques that are used to (1) highlight associations and relationships between data items that are already represented, and (2) show hidden data items that are relevant to a specified item [16].”
The most important relationship in recursion connects caller and called invocations. No special interaction must be provided to the user since this relationship is explicitly shown in the different views (see Figure 1). The control stack and recursion trees encode it with arcs or arrows. Traces suggest it with typographic means, especially indentation.
Another relationship connects input and output values of a given invocation. Again, this connection is explicitly shown. The control stack and recursion trees encode it as the two halves of a given node. Traces represent it with typographic means, especially indentation.
Multiples views are not independent of each other, but they are coordinated. Coordination may be shown in two ways. Firstly, by synchronizing the information displayed in the views during an animation. Secondly, by having the views sharing visual conventions in the different representations used for the same objects. The two views in Figure 4 represent the same state of computation. They share color conventions and spatial orientation.
Finally, relevant events in an animation are usually connected by means of the animation controls. For instance, entry and exit of an invocation can be animated adjacent in time by means of a “step over” control.
Figure 3. Recursion tree for fib (5): (a) basic visualization (b–e) variants.
Algorithms 03 00076 g003
Figure 4. The user interface of SRec, with the source code and two views of recursion for fib (11).
Algorithms 03 00076 g004

3.3. Filter

“Filter interaction techniques enable users to change the set of data items being presented based on some specific conditions [16].”
Filtering can be applied to recursion trees in several ways. Firstly, we may omit input or output values. By displaying input, we give information about the recursive structure of the algorithm, while also showing output gives the computation results. Leaving visible only the output can be useful for prediction exercises. For instance, Figure 3(c) is obtained from Figure 3(a) by omitting input. Notice that the two pending calls, squared in red, have no value inside.
Secondly, past recursive calls that have finished execution can be filtered. Showing all the nodes in the recursion tree displays the complete history of the algorithm. Alternatively, showing only pending nodes and the active one produces a display of the current state of execution. An intermediate display consists of blurring finished nodes. Figure 3(d) and Figure 3(e) show the two latter possibilities.
A related kind of filter can be applied to recursive invocations produced by a particular invocation. In the recursion tree, they generate a subtree with the particular invocation as the root. An animation control to “step over” can either display or omit the resulting subtree; in any of these cases, its result is displayed.
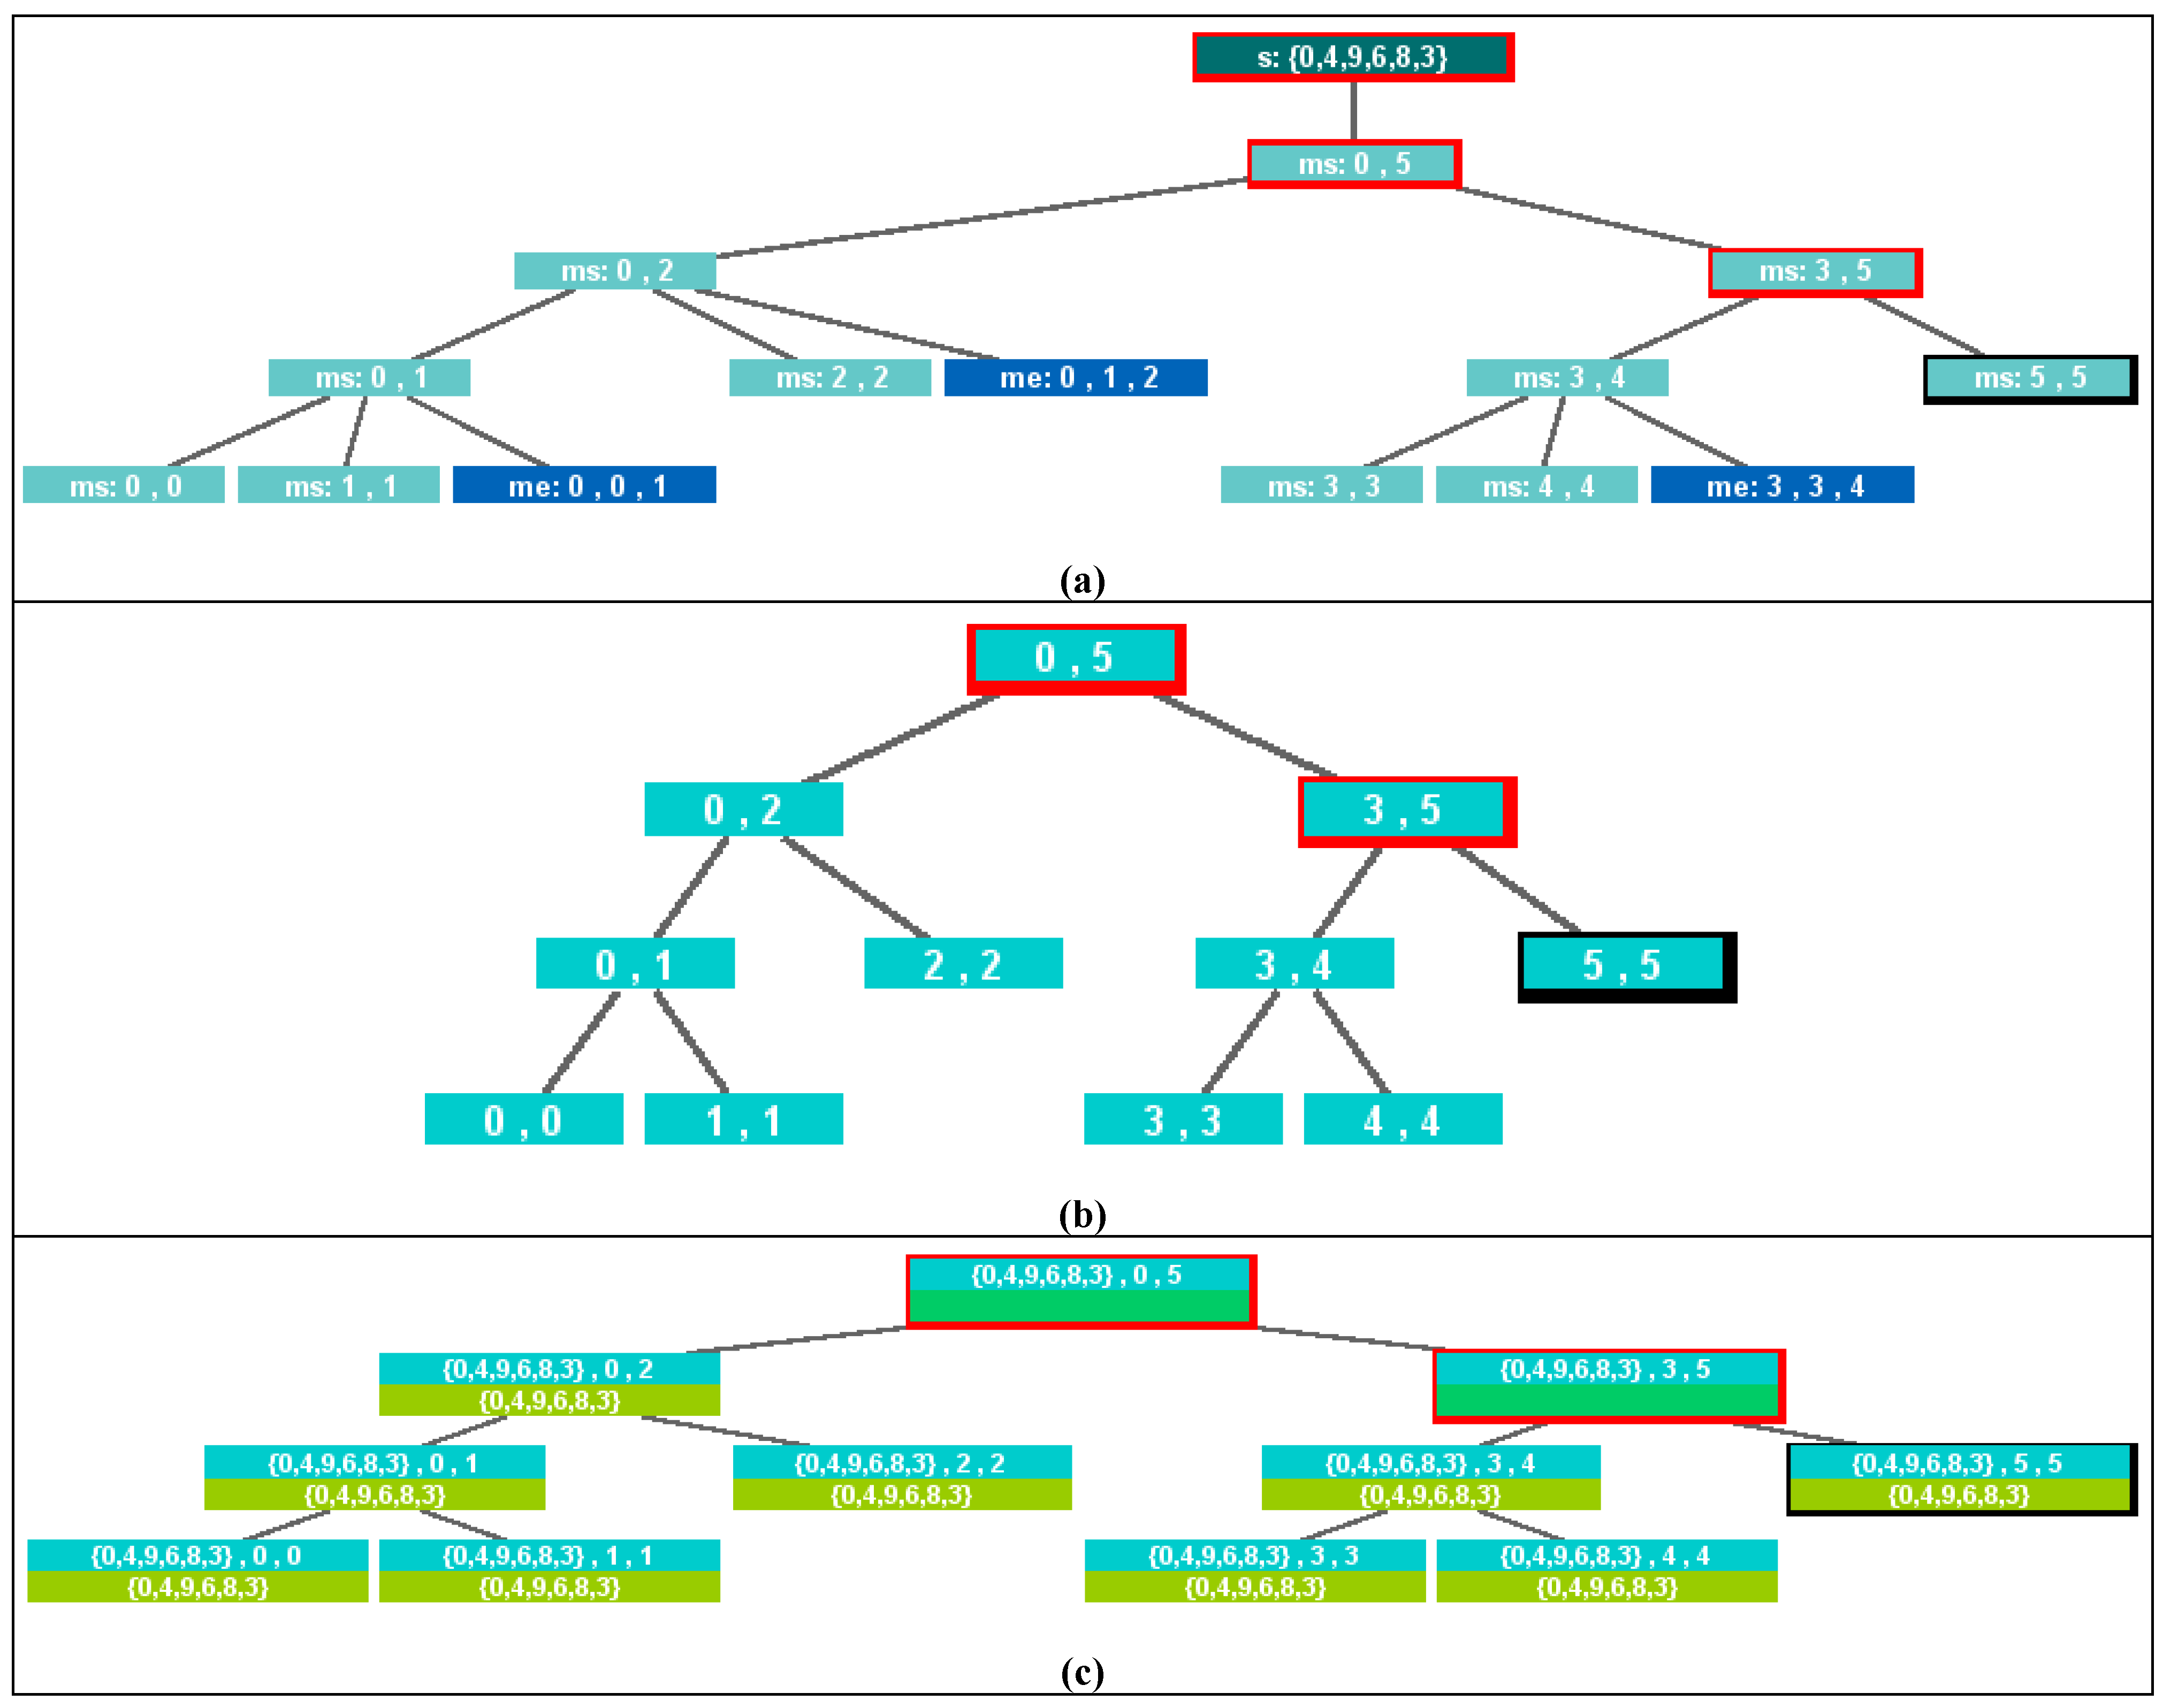
Finally, filtering can be applied to the parameters, return values and methods to visualize. For instance, the three recursion trees shown in Figure 5 were generated on mergesorting the array {0,4,9,6,8,3}.
Figure 5(a) is a comprehensive picture of the computation actually performed. It displays an initial call to the main method (in the figure, s for sort) and calls to a recursive method (ms for msort) and to an auxiliary method (me for merge). In order to keep the visualization manageable, only some input values are displayed, namely the original array in the main method and the indices that bound the subarray in each call in the other two methods.
Figure 5. Recursion tree variants for mergesort({0,4,9,6,8,3}).
Algorithms 03 00076 g005
Figure 5(b) is similar, but focuses on the recursive structure of msort by filtering the other two methods. As the resulting recursion tree is smaller, we may display more input values and also output values. Thus, Figure 5(c) shows the resulting recursion tree, where each node contains two occurrences of the array to sort: its input state and its output state.
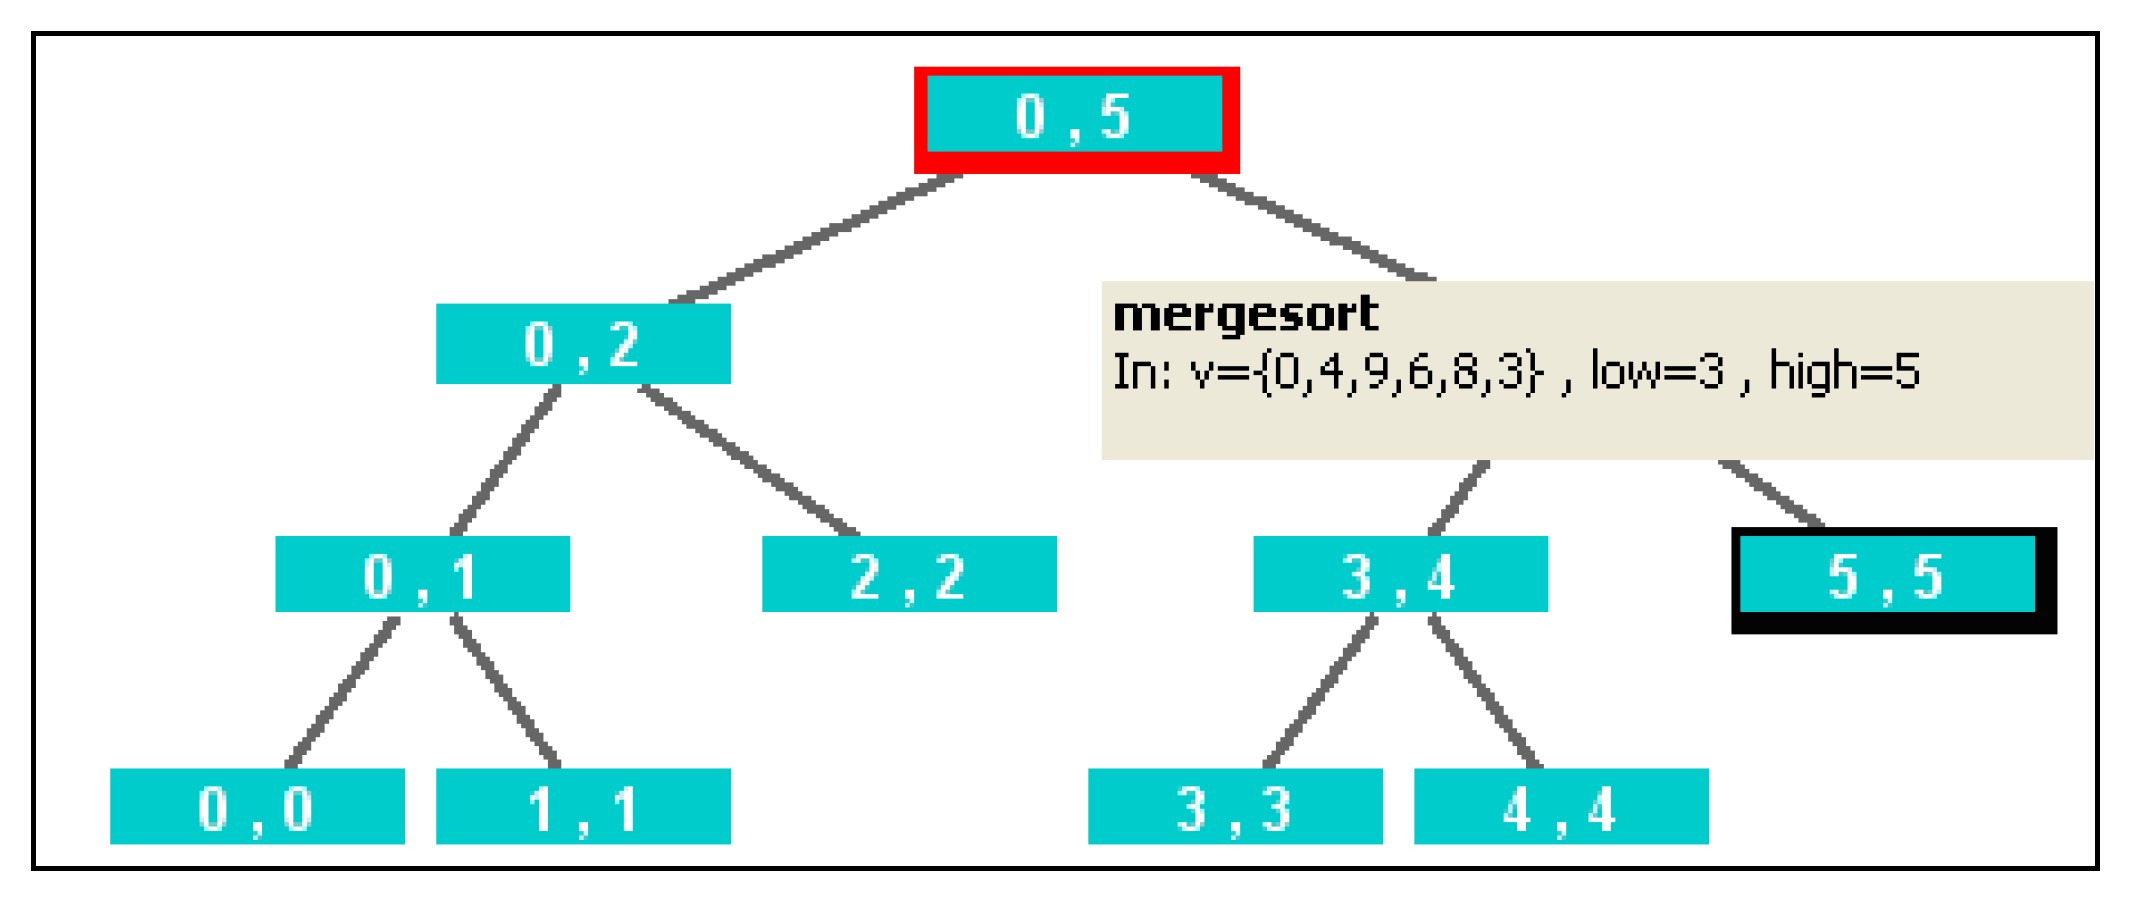
A facility complementary to filtering is semantic zoom, which can be applied to obtain full information of a given node. Positioning the mouse over the node and pressing the left button results in popping-up a small window that contains the values of all its parameter and result values. Figure 6 illustrates the effect of semantically zooming a given node of the recursion tree displayed in Figure 5(b).
Figure 6. Semantic zoom on a node of the recursion tree for mergesort({0,4,9,6,8,3}).
Algorithms 03 00076 g006

3.4. Abstract/Elaborate

“Abstract/elaborate interaction techniques provide users with the ability to change the level of abstraction of a data representation [16].”
The level of abstraction is always kept equal in visualizations of recursion. However, we may achieve a higher level of abstraction by displaying on demand global information about the number of several kinds of nodes in an animation (e.g., visible nodes, past nodes, highlighted nodes, etc.). Semantic zooming can also be used to give global information about a given node (e.g., its relative number of invocation or the number of descendant nodes that descend from it).

3.5. Explore

“Explore interaction techniques enable users to examine a different subset of data cases [16].”
This category is especially important to handle large visualizations. SRec supports two ways of selecting a subset of information in a visualization of recursion:
  • Panning+scrolling. Panning is another name for geometric zooming, which allows changing the scale of the visualization and therefore the amount of information that fits the screen. When a visualization does not fit its enclosing panel, a scroll bar may be provided to allow the user to select the part that she wishes to focus on.
  • Overview+detail. Panning+scrolling allows navigating, but if the visualization is much larger than the part visible in a panel, the user may get lost. An overview+detail interface provides two complementary views: the “detail” view makes readable a part of the visualization and the “overview” gives a sketch of the global view of the visualization, identifying the position of the “detail” view.
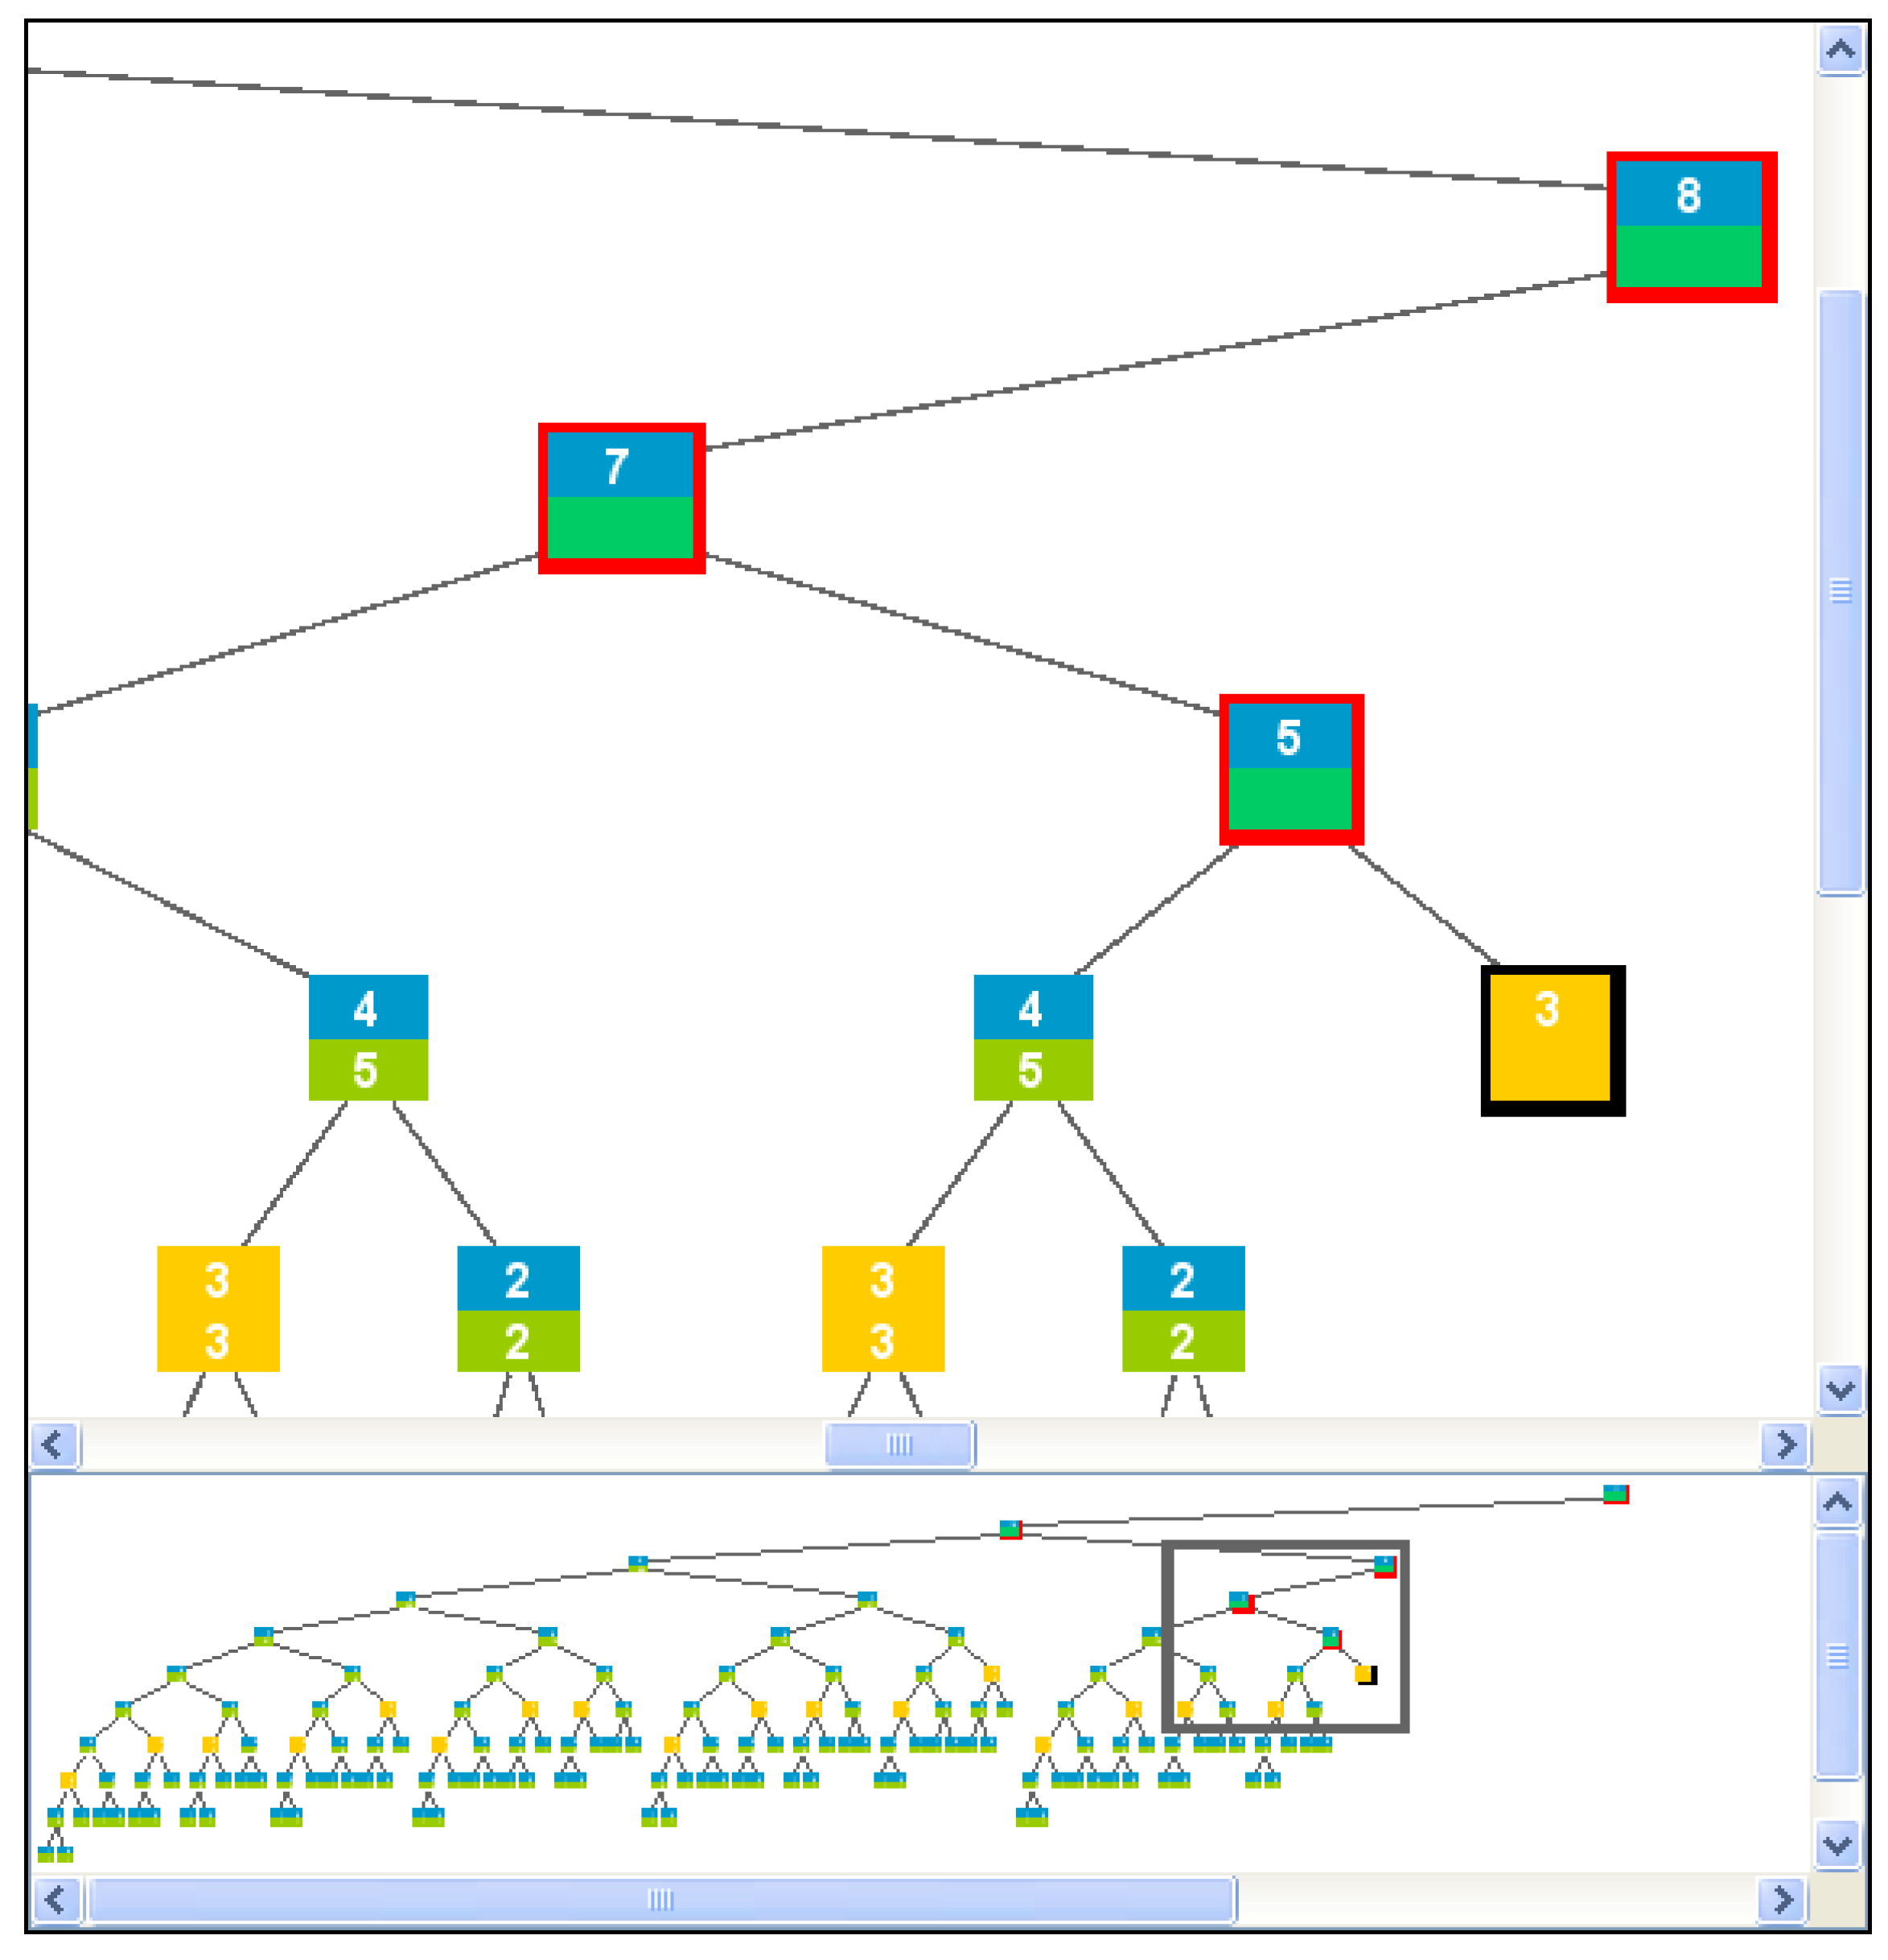
Figure 4 contains visual cues of the first two of these interaction techniques. Several icons for zooming (that display a lens) can be identified at the right of the icon bar. The panels for traces and for recursion trees have their scrolling bars activated to navigate. Finally, the recursion tree panel is split into two parts, jointly providing an overview+detail interface.
Interaction techniques to explore time are typically provided as animation controls. Figure 4 shows a computation state close to its end. Program animation is controlled with the animation bar available at the top right corner. As the animation advances, new recursion nodes are generated. Nodes corresponding to finished calls may be kept or disappear from the visualization, depending on the particular view or user settings.

3.6. Reconfigure

“Reconfigure interaction techniques provide users with different perspectives onto the data set by changing the spatial arrangement of representations [16].”
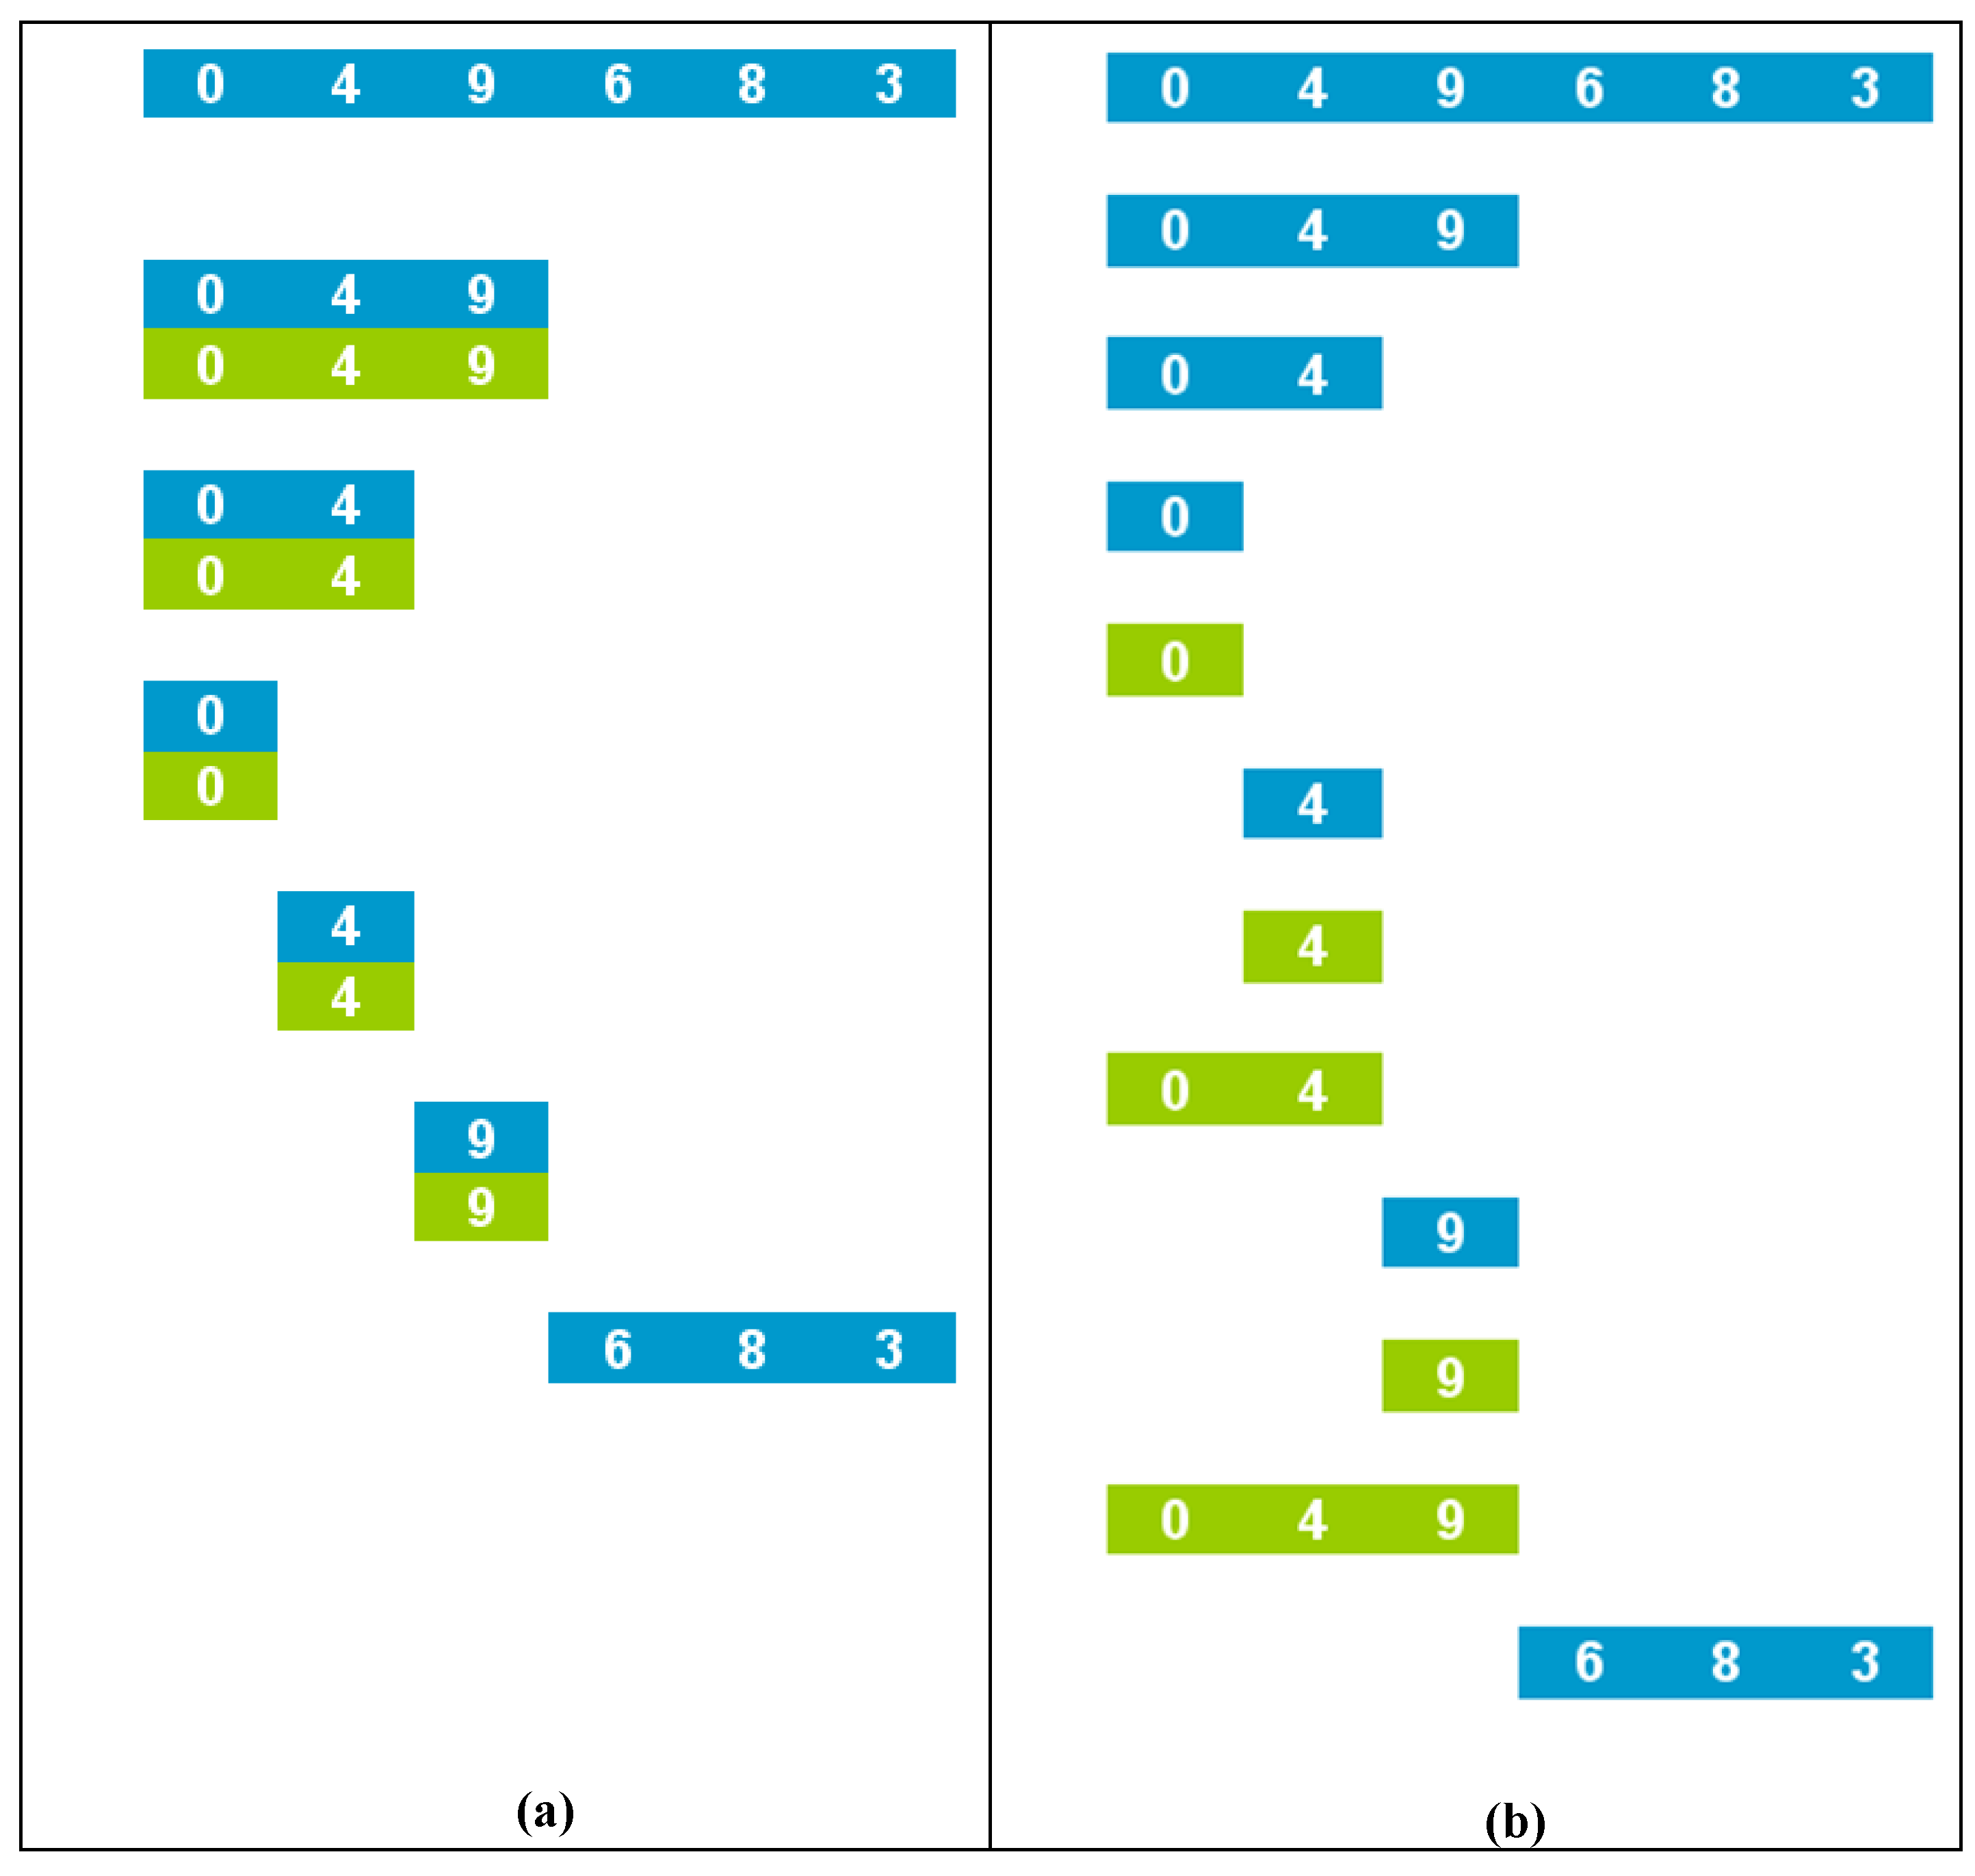
The visualizations can be slightly reconfigured with certain customization options, e.g., distances between sibling nodes in a recursion tree. However, reconfiguring can be produced by other criteria, for example, where to place subarrays in the sequence of visualizations of the data structure. Figure 7 shows two chronological sequences of subarrays of {0,4,9,6,8,3} on call entry and exit. Figure 7(a) keeps entry and exit states of subarrays joint for each call, while in Figure 7(b) they are separated and strict chronological order is used to display subarrays.
Reconfiguration also makes sense in relation to multiple views. The screen usually only provides space for displaying a few views in an understandable way. The user should be allowed to choose the views to display and their relative position. In Figure 4, the user selected two views and to display them vertically. This layout allows optimizing the space necessary to display the control stack, thus leaving more space for the recursion tree.
Figure 7. Two rearrangements of a sequence of array states for mergesort({0,4,9,6,8,3}).
Algorithms 03 00076 g007

3.7. Select

“Select interaction techniques provide users with the ability to mark a data item of interest to keep track of it [16].”
A user of a program visualization system may be interested in selecting information either in space or in time. A case of selection in space consists of identifying multiple occurrences of a given node in a redundant algorithm, such as fibonacci. A dialog is enough to enter the input or output values that identify the target nodes. Figure 8 shows the recursion tree included in Figure 4, corresponding to fib (11), after selecting nodes corresponding to fib (3). The selected nodes are highlighted in orange.
With respect to time, the user may be interested in moving to a particular instant of the animation. The interaction may consist in positioning the mouse over a node of the recursion tree and pressing the right bottom to make it the active node in the animation.
Figure 8. Recursion tree for fib (11) with the nodes corresponding to fib (3) highlighted.
Algorithms 03 00076 g008

4. Conclusions

This article demonstrates techniques to support flexible analysis of recursive algorithms by means of enhanced interaction features. All of these features are implemented in the SRec system and were illustrated in the paper. We have also shown that interaction facilities in other animation systems of recursion are very limited. The SRec system and related information and documentation (including user manual and the results of usability evaluations) are freely available at the following URL: http://lite.etsii.urjc.es/srec.
Much effort has been devoted in the two last decades to educational uses of algorithm animations. Their main drawbacks for general adoption have been identified elsewhere [17]:
  • Lack of evidence of their educational efficiency.
  • Heavy workload posed on animation constructors (typically, the instructors).
Our current study dealt with both these problems. With respect to the issue of educational effectiveness, notice that educational effectiveness of animations requires student engagement [17,18]. Our proposal for enhanced interactivity provides attractive visual tools to engage students in analysis tasks.
The issue of construction effort is also addressed by our contribution. In effect, automation and interaction are two of the four issues identified in a previous proposal [19] to identify “effortless” systems. The issue of improving interaction is clearly addressed in our study. With respect to automation, our approach to deliver program visualizations more easily supports flexible interaction by using processing language techniques. Program processing generates an annotated, intermediate representation of the program that allows gathering relevant information in run-time. Execution information can be displayed by the animation system to the user by means of its interaction facilities. User effort is then reduced to interacting with the system.
Further studying how to enhance visualization and interaction in animation systems to assist different user tasks is promising for programming education. We also plan to extend this work in several directions. Firstly, the comparison between SRec and other systems included one general program animation system (namely ETV), but the comparison should be extended to other general systems. Secondly, SRec can benefit from some additional interaction facilities; the work of Yi et al. [16] provides a good framework to identify such improvements. Finally, it would be very valuable for instructors to design a more structured mapping between interaction techniques and learning tasks.

Acknowledgments

This work was supported by project TIN2008-04103 of the Spanish Ministry of Science and Innovation.

References

  1. Bloom, B.; Furst, E.; Hill, W.; Krathwohl, D.R. Taxonomy of Educational Objectives: Handbook I, The Cognitive Domain; Longmans: New York, NY, USA, 1959. [Google Scholar]
  2. Böcker, H.D.; Fisher, G.; Nieper, H. The enhancement of understanding through visual representations. In Proceedings of the ACM SIGCHI Conference on Human Factors in Computing, Boston, MA, USA, April 1986; pp. 44–50.
  3. Velázquez-Iturbide, J.Á.; Pérez-Carrasco, A.; Urquiza-Fuentes, J. SRec: An animation system of recursion for algorithm courses. In Proceedings of the 13th Annual Conference Innovation and Technology in Computer Science Education, Madrid, Spain, June 2008; pp. 225–229.
  4. Haynes, S.M. Explaining recursion to the unsophisticated. ACM SIGCSE Bulletin 1995, 27, 3–6 and 14. [Google Scholar]
  5. Wilcocks, D.; Sanders, I. Animating recursion as an aid to instruction. Comput. Educ. 1994, 23, 221–226. [Google Scholar]
  6. Stern, L.; Naish, L. Visual representations for recursive algorithms. In Proceedings of the 33rd SIGCSE technical symposium on Computer science education, Cincinnati, KY, USA, February 2002; pp. 196–200.
  7. Software Visualization, Stasko, J.T.; Domingue, J.; Brown, M.H.; Price, B.A. (Eds.) MIT Press: Cambridge, MA, USA, 1997.
  8. Velázquez-Iturbide, J.Á.; Pérez-Carrasco, A.; Urquiza-Fuentes, J. A design of automatic visualizations for divide-and-conquer algorithms. Electr. N. Theor. Comput. Sci. 2009, 224, 113–120. [Google Scholar]
  9. Fernández-Muñoz, L.; Pérez-Carrasco, A.; Velázquez-Iturbide, J.Á.; Urquiza-Fuentes, J. A framework for the automatic generation of algorithm animations based on design techniques. In Proceedings of the Second European Conference on Technology Enhanced Learning, Crete, Greece, September 2007; pp. 475–480.
  10. Velázquez-Iturbide, J.Á. Formalization of the control stack. ACM SIGPLAN Notices 1989, 24, 46–54. [Google Scholar]
  11. Terada, M. ETV: A program trace player for students. In Proceedings of the 10th Annual Conference Innovation and Technology in Computer Science Education, Monte da Caparica, Portugal, June 2005; pp. 118–122.
  12. Wu, C.C.; Lin, J.M.C.; Hsu, I.Y.W. Closed laboratories using SimLIST and SimRECUR. Comput. Educat. 1997, 28, 55–64. [Google Scholar] [CrossRef]
  13. Dershem, H.L.; Parker, D.E.; Weinhold, R. A Java function visualizer. J. Comput. Small Coll. 1999, 15, 220–230. [Google Scholar]
  14. George, C.E. EROSIIVisualizing recursion and discovering new errors. In Proceedings of the SIGCSE’00, Austin, TX, USA, March 2000; pp. 305–309.
  15. Eskola, J.; Tarhio, J. On visualization of recursion with Excel. In Proceedings of the Second Program Visualization Workshop, HornstrupCentret, Denmark, June 2002; pp. 45–51.
  16. Yi, J.S.; Kang, Y.; Stasko, J.; Jacko, J.A. Toward a deeper understanding of the role of interaction in information visualization. IEEE Trans. Visualiz. Comput. Graph. 2007, 13, 1224–1231. [Google Scholar]
  17. Naps, T.; Roessling, G.; Almstrum, V.; Dann, W.; Fleischer, R.; Hundhausen, C.; Korhonen, A.; Malmi, L.; McNally, M.; Rodger, S.; Velázquez-Iturbide, J.Á. Exploring the role of visualization and engagement in computer science education. ACM SIGCSE Bulletin 2003, 35, 131–152. [Google Scholar] [CrossRef]
  18. Hundhausen, C.; Douglas, S.; Stasko, J. A meta-study of algorithm visualization effectiveness. J. Vis. Lang. Comput. 2002, 13, 259–290. [Google Scholar] [CrossRef]
  19. Ihantola, P.; Karavirta, V.; Korhonen, A.; Nikander, J. Taxonomy of effortless creation of algorithm visualization. In Proceedings of the International Workshop on Computing Education Research, Seattle, WA, USA, October 2005; pp. 123–133.