1. Introduction
Measurements over the oceans have been used extensively for weather forecasting, ship safety and global-scale studies of climate and sea conditions. The marine coastal environment is characterized by the interaction of a complex set of upper ocean and atmospheric boundary layer processes having spatial and temporal scales ranging from meters to hundred of kilometers and from seconds to several days. Mesoscale processes such as upwellings, eddies, thermal fronts or jet currents are very energetic and their knowledge is very important, not only to study the oceanic circulation, but also in other applications that include acoustic propagation anomalies, fisheries management and exploitation, coastal monitoring and offshore or ocean oil detection and exploitation. Infrared (IR) and visible (VIS) images soon came to play a major contribution in oceanographic observation, in particular, to study the ocean dynamics. However, all those studies involve analyzing large data sets of IR and VIS imagery. So, it is desirable to replace the labor-intensive time-consuming manual interpretation with automated analysis tools.
So, in many remote sensing applications using satellite images and specifically in those related to oceanographic studies, it is necessary to compare multiple images of the same scene acquired by different sensors, or images taken by the same sensor but at different time instants. Typical applications include multi-temporal classification, recognition and tracking of specific patterns, multisensorial data fusion, change detection, integrating information into geographic information systems (GIS) and environment monitoring. Such a comparison of multiple images requires either their georeferencing or their spatial registration. Several techniques for the georeferencing of images from the same area have been proposed [
1,
2]. However, in the framework of oceanographic studies, the comparison of multi-temporal and multisensorial images is performed by the spatial registration.
Image registration is the process that determines the best spatial fit between two or mores images (reference and sensed images) that overlap the same physical region of the scene being imaged, acquired at the same or at difference date, by identical or difference sensors. In general, its applications can be divided into three main groups according to the manner of the image acquisition [
3,
4,
5]:
•
Different times (multitemporal analysis). Images of the same scene are acquired at different times, often on regular basis, and possibly under different conditions. The aim is to find and evaluate changes in the scene which appeared between the consecutive images acquisitions,
i.e., tracking of specific oceanographic structures [
6].
•
Different sensors (multimodal analysis). Images of the same scene are acquired by different sensors or by the same sensor at different resolutions. The aim is to integrate the information obtained from different source streams to gain more complex and detailed scene representation as described by [
7,
8] (
i.e., fusion of information from sensors with different characteristics like panchromatic images, offering better spatial resolution, color/multispectral images with better spectral resolution, or radar images independent of cloud cover and solar illumination).
• Scene to model registration. Images of a scene and a model of the scene are registered. The model can be a computer representation of the scene, for instance, maps or digital elevation models in GIS. The aim is to localize the acquired image in the scene/model and/or to compare them. (i.e., registration of satellite data into maps or other GIS layers).
Due to the diversity of images to be registered and due to various types of degradations, it is impossible to design a universal method applicable to all registration tasks. To solve image registration problem for various types of data, over the years, several methods and techniques have been proposed in the scientific literature [
5,
9]. As analyzed by different authors, there is a critical need to develop automated techniques requiring little or no operator intervention to register multi-temporal and/or multisensorial images when higher accuracy is desired. Towards this goal, based on the nature of features used, automated registration techniques can be broadly grouped into area-based and feature-based methods.
In area-based methods, sometimes called correlation-like or template matching methods, images are registered by selecting a number of windows with high-variance areas in the reference image, locating the corresponding windows in the sensed images by cross correlation, using the windows centers as control points to determine the registration parameters [
10,
11]. The limitations of the area-based methods originate in their basic idea. Firstly, the rectangular window, which is most often used, suits the registration of images which locally differ only by a translation. If images are deformed by more complex transformations, this type of window is not able to cover the same parts of the scene in the reference and sensed images. Another disadvantage of the area-based methods refers to the image intensities of the window content. There is high probability that a window containing a smooth area without any prominent details will be matched incorrectly with other smooth areas in the images.
Feature-based methods, usually rely on establishing feature correspondence between two images. They attempt to identify region boundaries, coastline, or other features that are common to the images. The number of common elements of the detected sets of features should be sufficiently high, regardless of the change of image geometry, radiometric conditions and of changes in the scanned scenes. Nevertheless, the majority of the feature-based registration methods consist of the following four steps [
12,
13,
14]:
• Feature detection: salient and distinctive objects (closed-boundary regions, capes, contours, etc.) are manually or automatically detected. For further processing, these features can be represented by their point representatives (centers of gravity, line endings, distinctive points), which are called control points (CPs) in the literature. The detected feature sets in the reference and sensed images must have enough common elements, even in situations when the images do not cover exactly the same scene or when there are object occlusions or other unexpected changes.
• Feature matching. In this step, the correspondence between the features detected in the sensed image and those detected in the reference image is established. Various feature descriptors and similarity measures along with spatial relationships among the features are used for that purpose.
• Transform model estimation. The type and parameters of the so-called mapping functions, aligning the sensed image with the reference image, are estimated. The parameters of the mapping functions are computed by means of the established feature correspondence.
• Image resampling and transformation. The sensed image is transformed by means of the mapping functions. Image values in non-integer coordinates are computed by the appropriate interpolation technique.
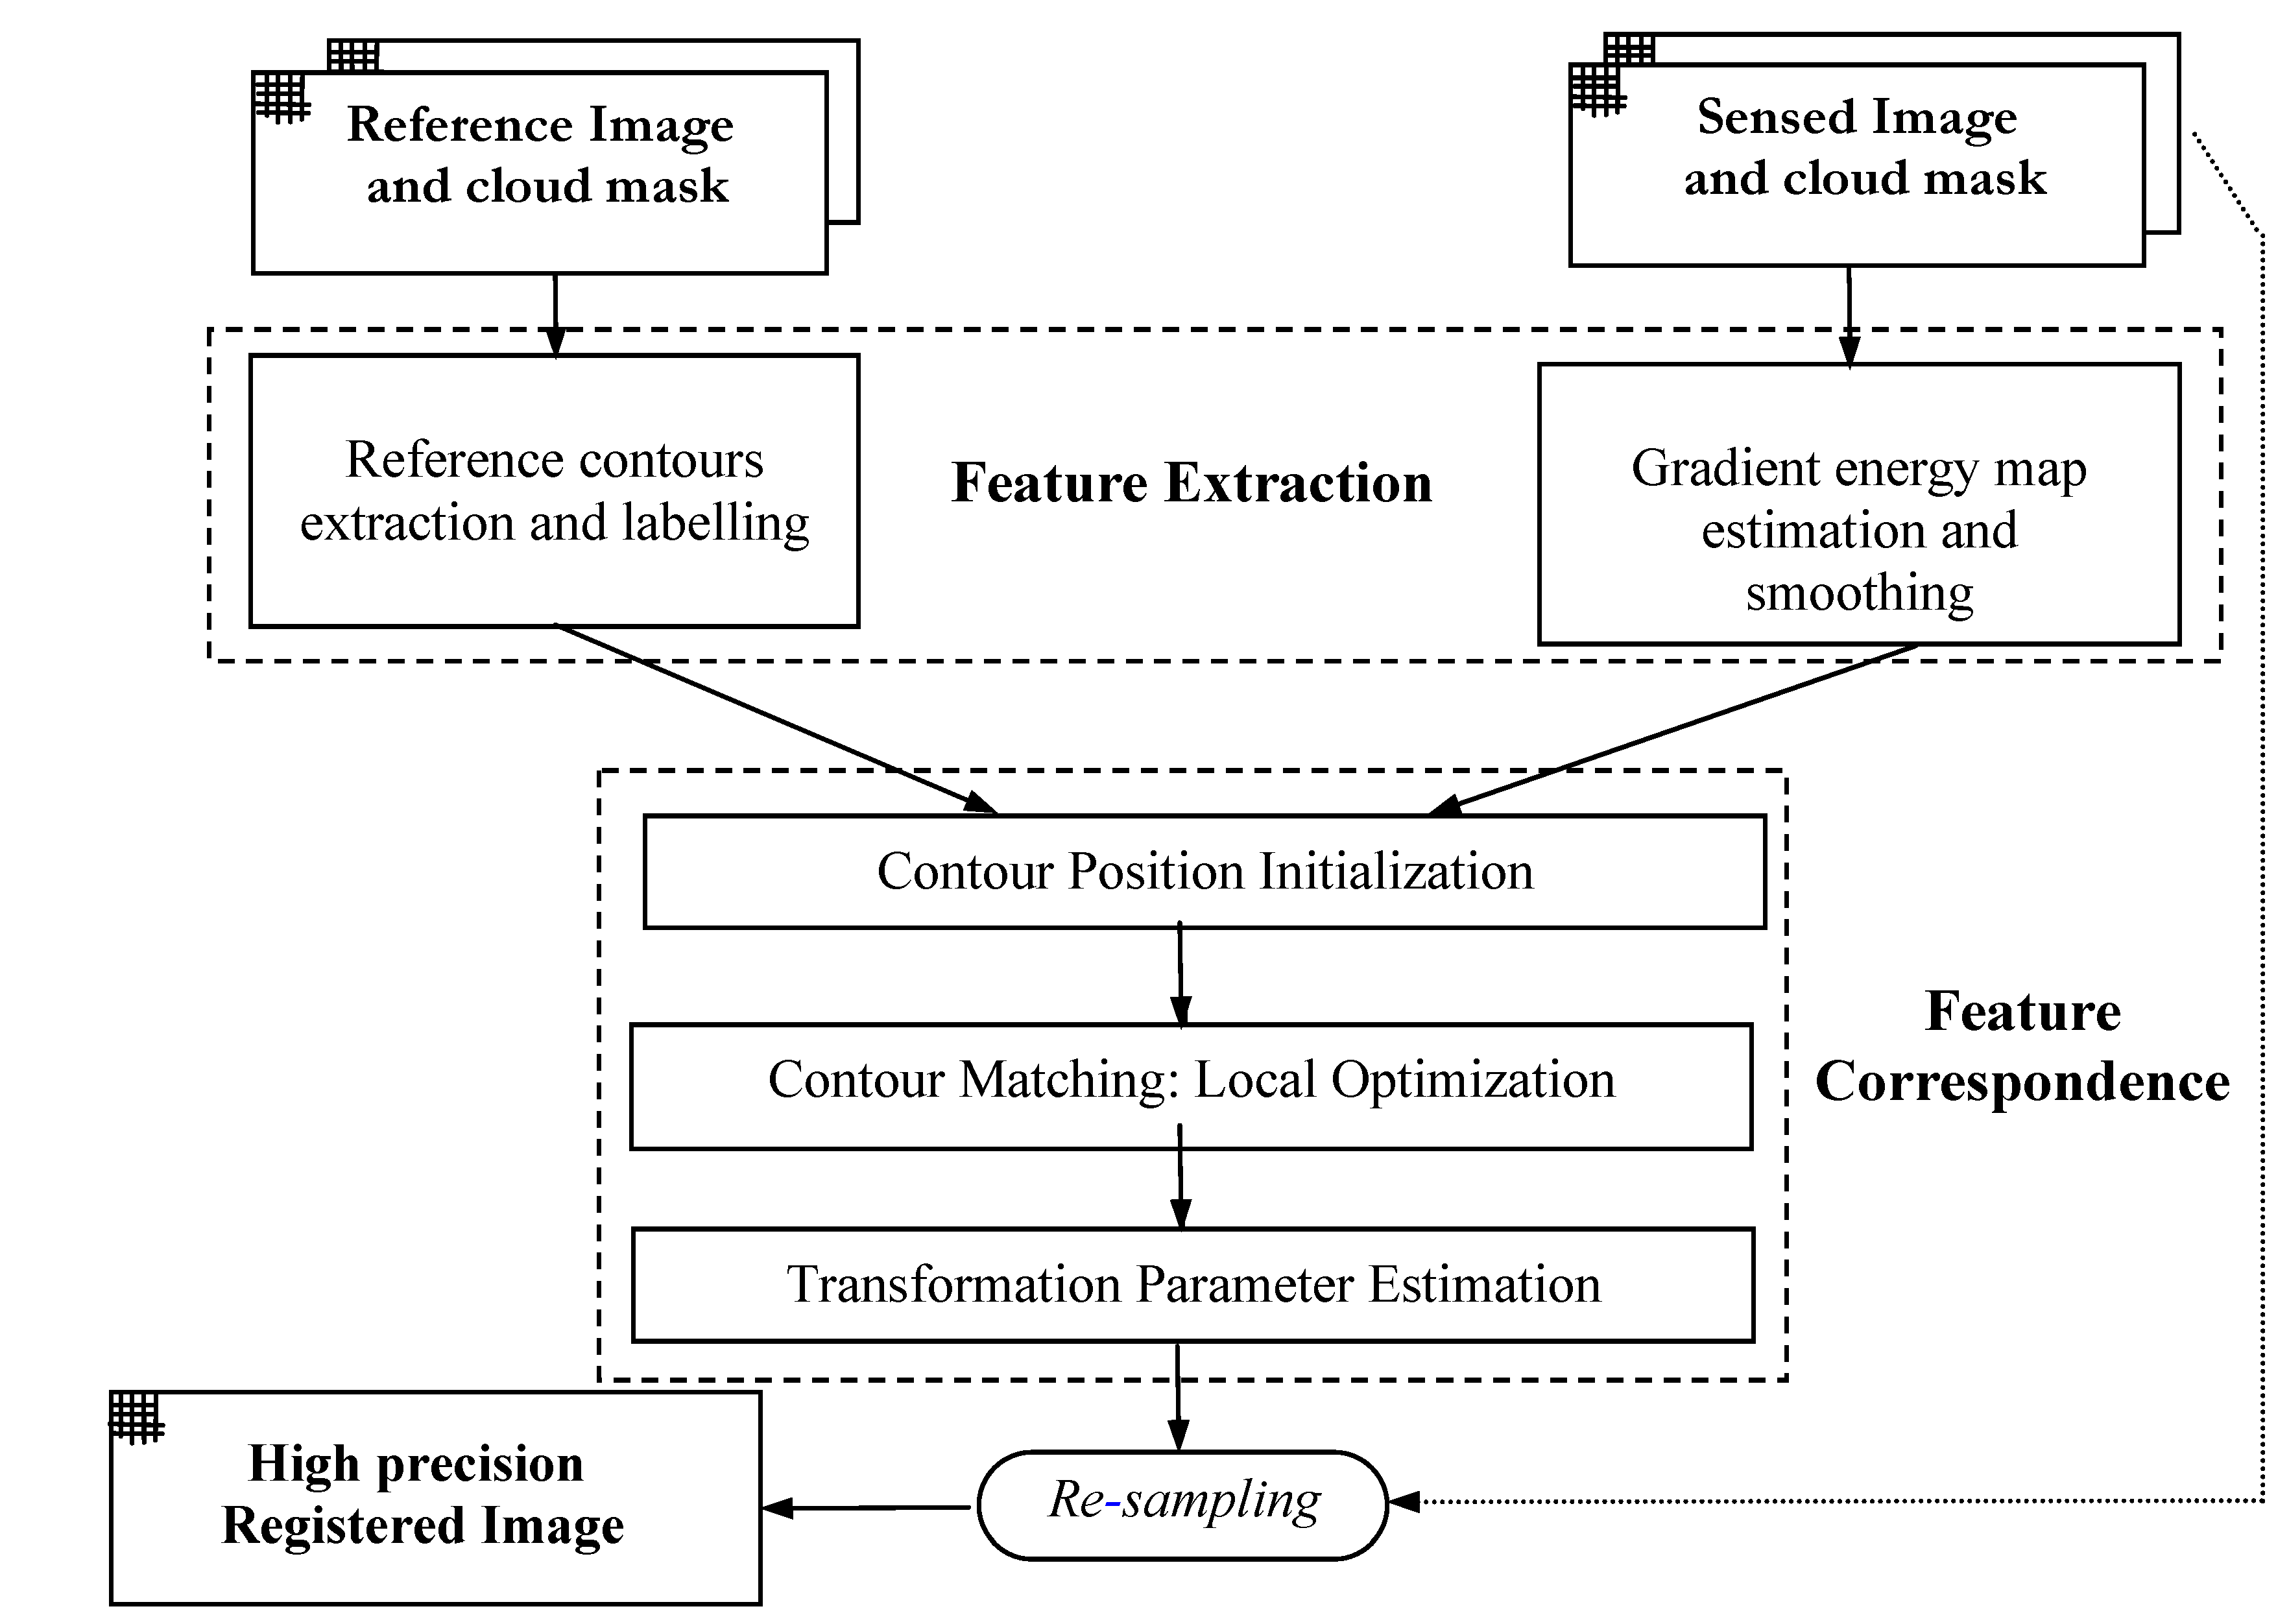
Aim at robust and reliable registration with high accuracy, in this paper we propose a new feature-based approach to automatic registration of remotely sensed images, according with the typical image registration procedure. Previously, to automatic satellite imagery registration, the reference and sensed images are geometrically corrected. For this task, a simple Kepplerian orbital model is considered as a reference model, and mean orbital elements are given as input to the model from ephemeris data.
As shown in
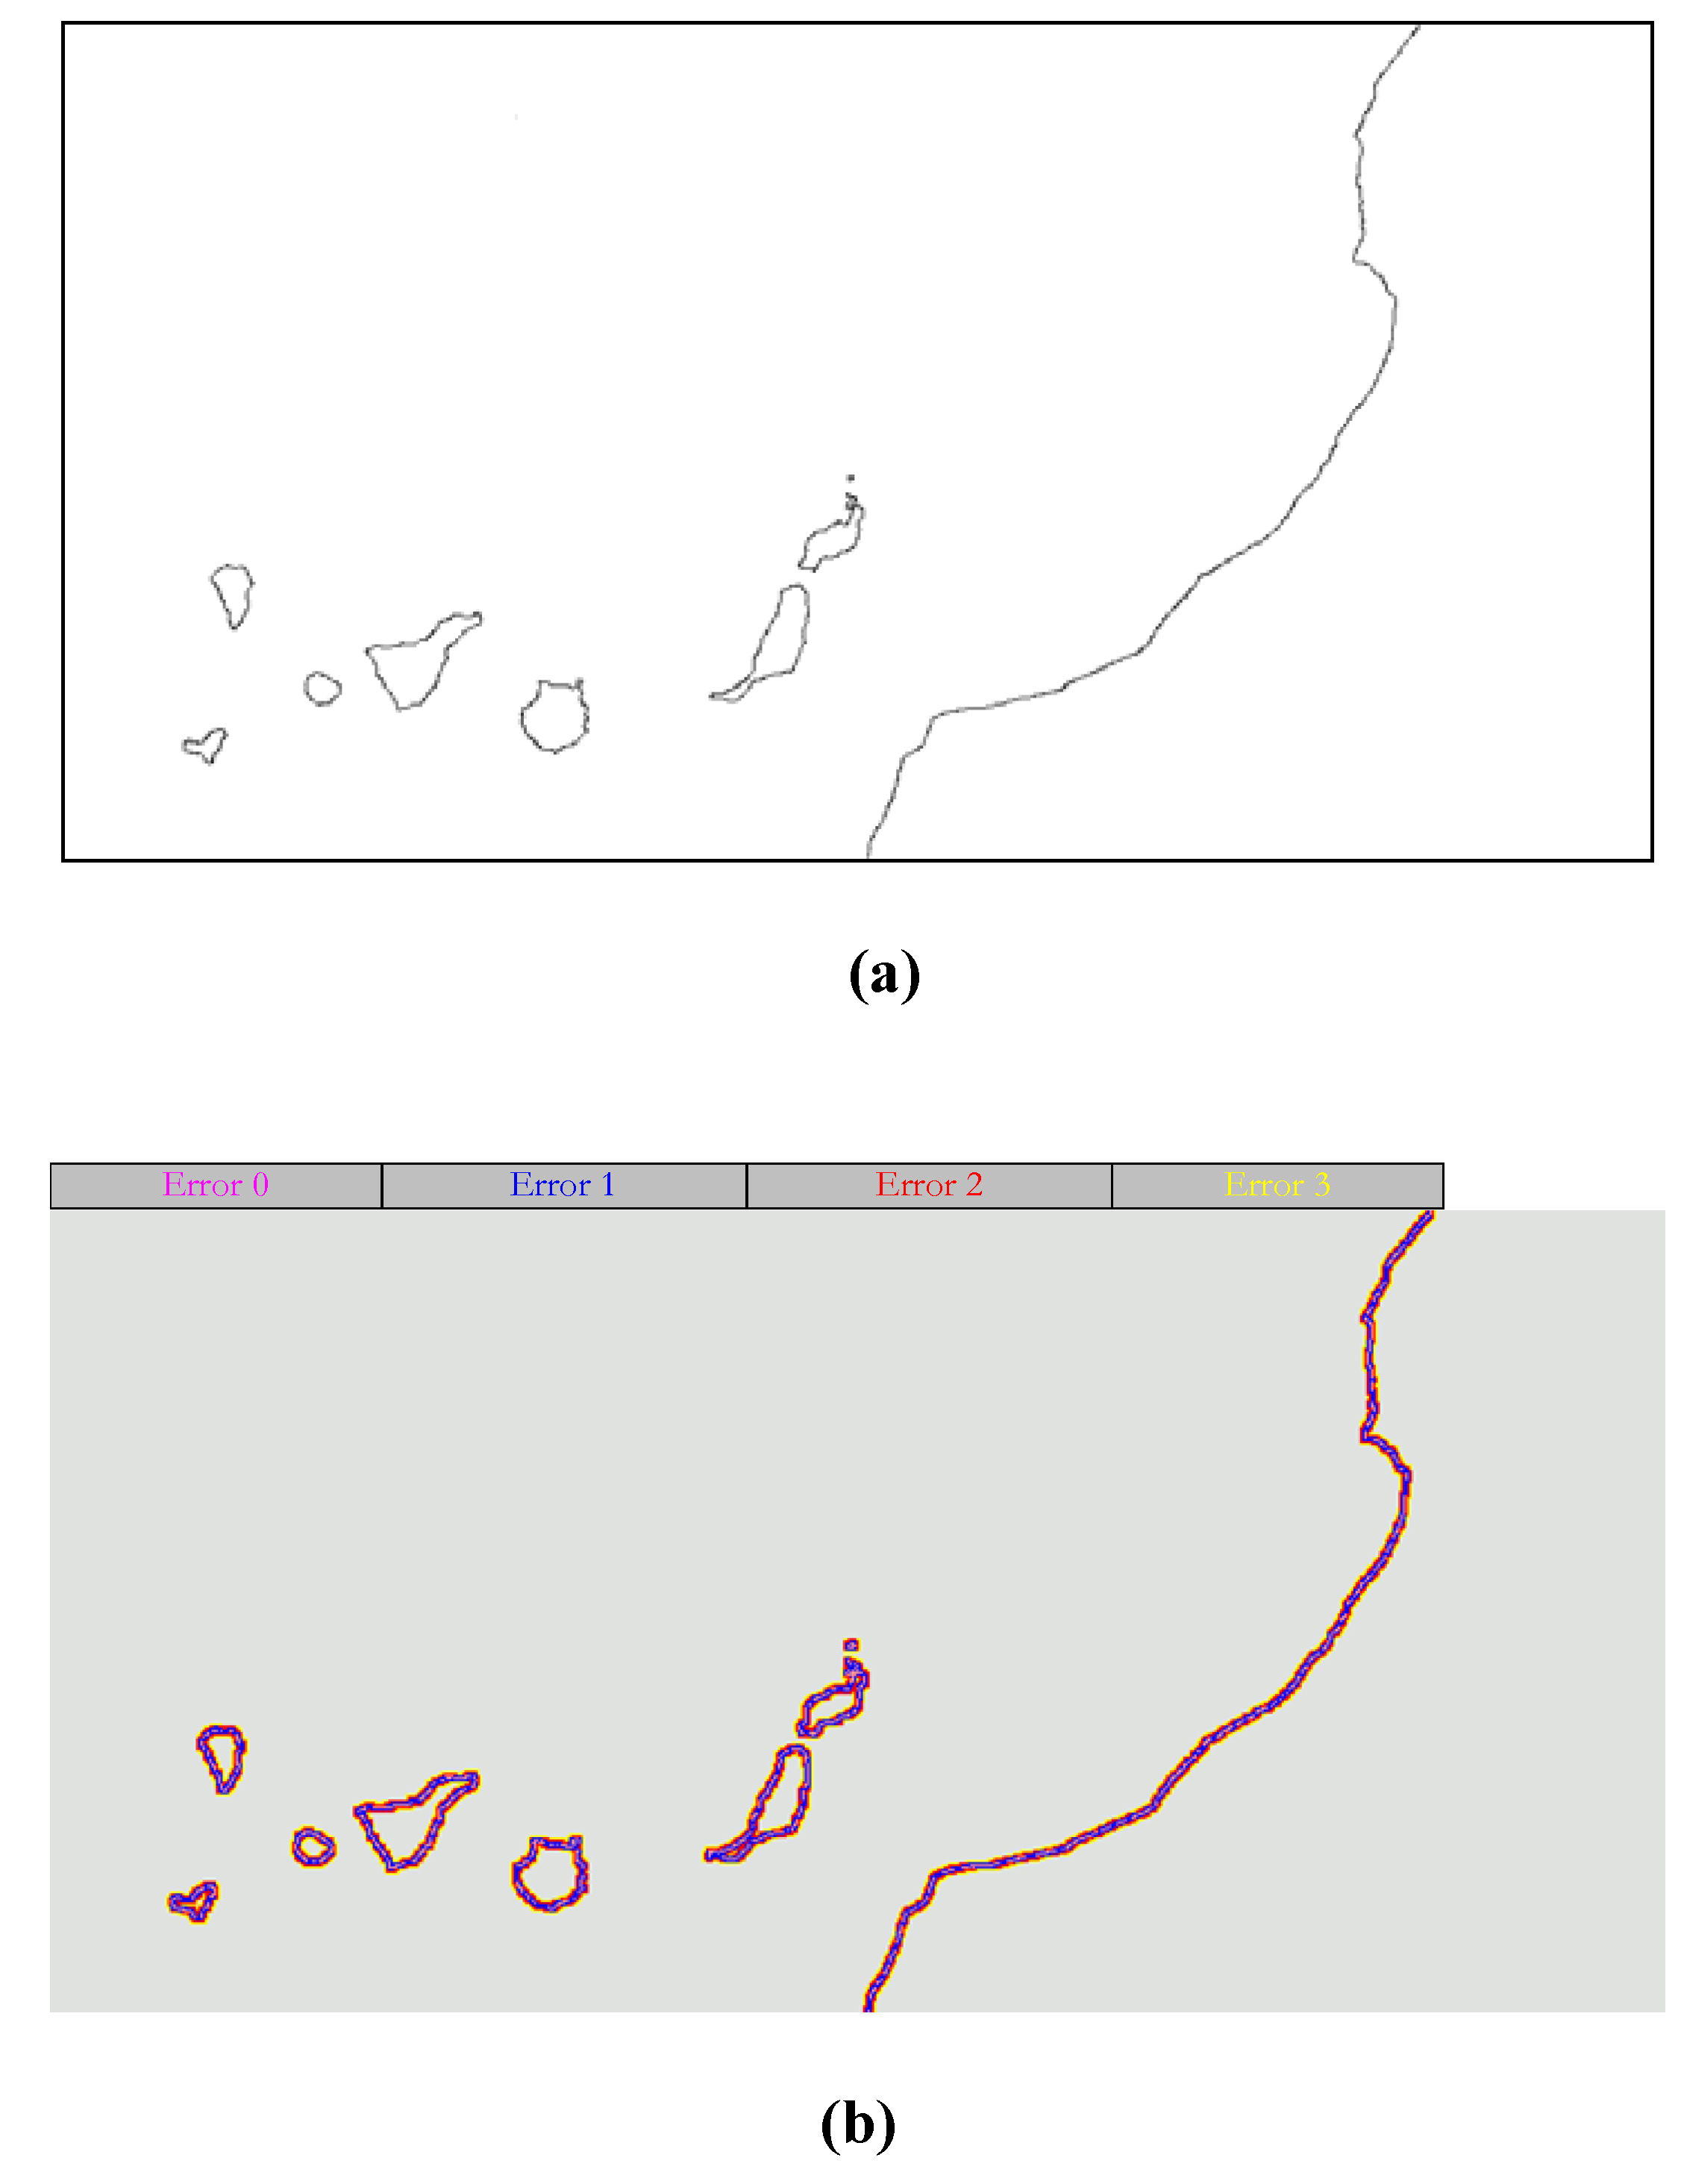
Figure 1, the task of the proposed image registration approach can be divided into three major components: reference image coastline extraction, sensed image gradient energy map estimation and feature correspondence by optimization of the reference image contours on the sensed image. Finally, the sensed image is resampled by the coefficients of the mapping functions. The paper outlines the approach and reports on results from applying it to multitemporal imagery (AVHRR/3) and multisensorial imagery (AVHRR/3, SeaWiFS, MODIS, ATSR).
The paper is organized as follows.
Section 2 discusses aspects related with the systematic procedure to obtain the satellite sensor data and describes the hierarchy data processing steps for AVHRR/3, SeaWiFS, MODIS and ATSR. The feature-based approach for automatic satellite image registration is analysed in
Section 3. In
Section 4 some experimental results are presented and analyzed. Finally, the conclusions are included in
Section 5.
Figure 1.
Schematic procedure of the proposed automatic satellite imagery registration.
Figure 1.
Schematic procedure of the proposed automatic satellite imagery registration.
2. Satellite Sensor Data
Several aspects have required the establishment of a hierarchy of processes that allow the generation of operational products (users level) and the development of processing algorithms characterised by its precision, autonomy and efficiency, namely: i) the different levels of processing involved to obtain the geophysics parameters; ii) the interest in multi-temporal and multi-sensorial studies; iii) the growing request of accuracy and temporal resolution in the satellite measurements and, iv) the technical complexity of the present remote sensing systems, some having a significant off-nadir viewing capability (i.e. NOAA-AVHRR and SeaStar-SeaWiFS).
Specifically, oceanographic satellites images are subjected to different geometric distortions due to the Earth’s curvature and rotation, the spacecraft’s speed, altitude and attitude, and the scan skew. These distortions, if not properly accounted for, will prevent meaningful comparison among images. In this work, a Kepplerian correction model, based on the satellites trajectories, have been previously used to compensate the systematic errors. The accuracy obtained from the application of these models is variable. Failures in the satellite’s internal clock, inaccuracies in Kepplerian orbital elements and lack of knowledge concerning the attitude angles, lead to that even the most complex models do not offer the desired accuracy of errors of less than one pixel [
15].
Table 1 shows the main characteristics of sensors used in this work (altitude, orbit inclination, nadir resolution and viewing swath width).
Table 1.
Main parameters of the satellites/sensors used with the registration algorithm.
Table 1.
Main parameters of the satellites/sensors used with the registration algorithm.
| Parameter | NOAA AVHRR/3 | SEASTAR SEAWIFS | AQUA MODIS | ERS ATSR |
|---|
| Altitude (km) | 833 | 705 | 705 | 785 |
| Orbit Inclination (º) | 98.7 | 99.2 | 98.2 | 98.5 |
| Nadir Resolution (km) | 1.1 | 1.1 | 1.0 | 1.0 |
| Viewing Swath Width (km) | 2399 | 2800 | 2330 | 512 |
The following sections briefly describe the data processing steps to generate Sea Surface Temperature (SST) and Ocean Colour imagery, using AVHRR/3, SeaWiFS, MODIS and ATSR data, which are conveniently used in various fields, such as oceanography, meteorology or fishery.
2.1. NOAA-AVHRR/3 and SeaStar-SeaWiFS
The HRPT Data Acquisition System (Remote Sensing Center, University of Las Palmas of Gran Canaria) automatically tracks the NOAA and SeaStar satellites and archives and pre-processes the raw data to Level-1B [
15].
For AVHRR, the subsequent processing steps (radiometric, atmospheric and geometric corrections) are carried out automatically, obtaining sea surface temperature maps that are optimized for the science applications following the requirements recognized in the World Climate Research Program.
On the other hand, the reception and processing of SeaWiFS images is carried out within the framework of the
SeaWiFS Project, managed at a world wide scale by NASA for the scientific utilization of the data. Unlike the NOAA-AVHRR image processing, for which the corresponding
ad-hoc algorithms have been developed, the different processing levels applied to the SeaWiFS data are included in the
SeaDAS (SeaWiFS Data Analysis System) software package, developed under the NASA ocean biochemistry program [
16]. The processing up to higher levels (1A and 2) is done automatically and the resulting level 2 files are processed to eliminate unnecessary data. Atmospheric correction algorithms use external data such as ozone concentrations and surface pressure fields.
In summary, for AVHRR and SeaWiFS data, all the daily acquisition and processing activities are performed in an unmanned way.
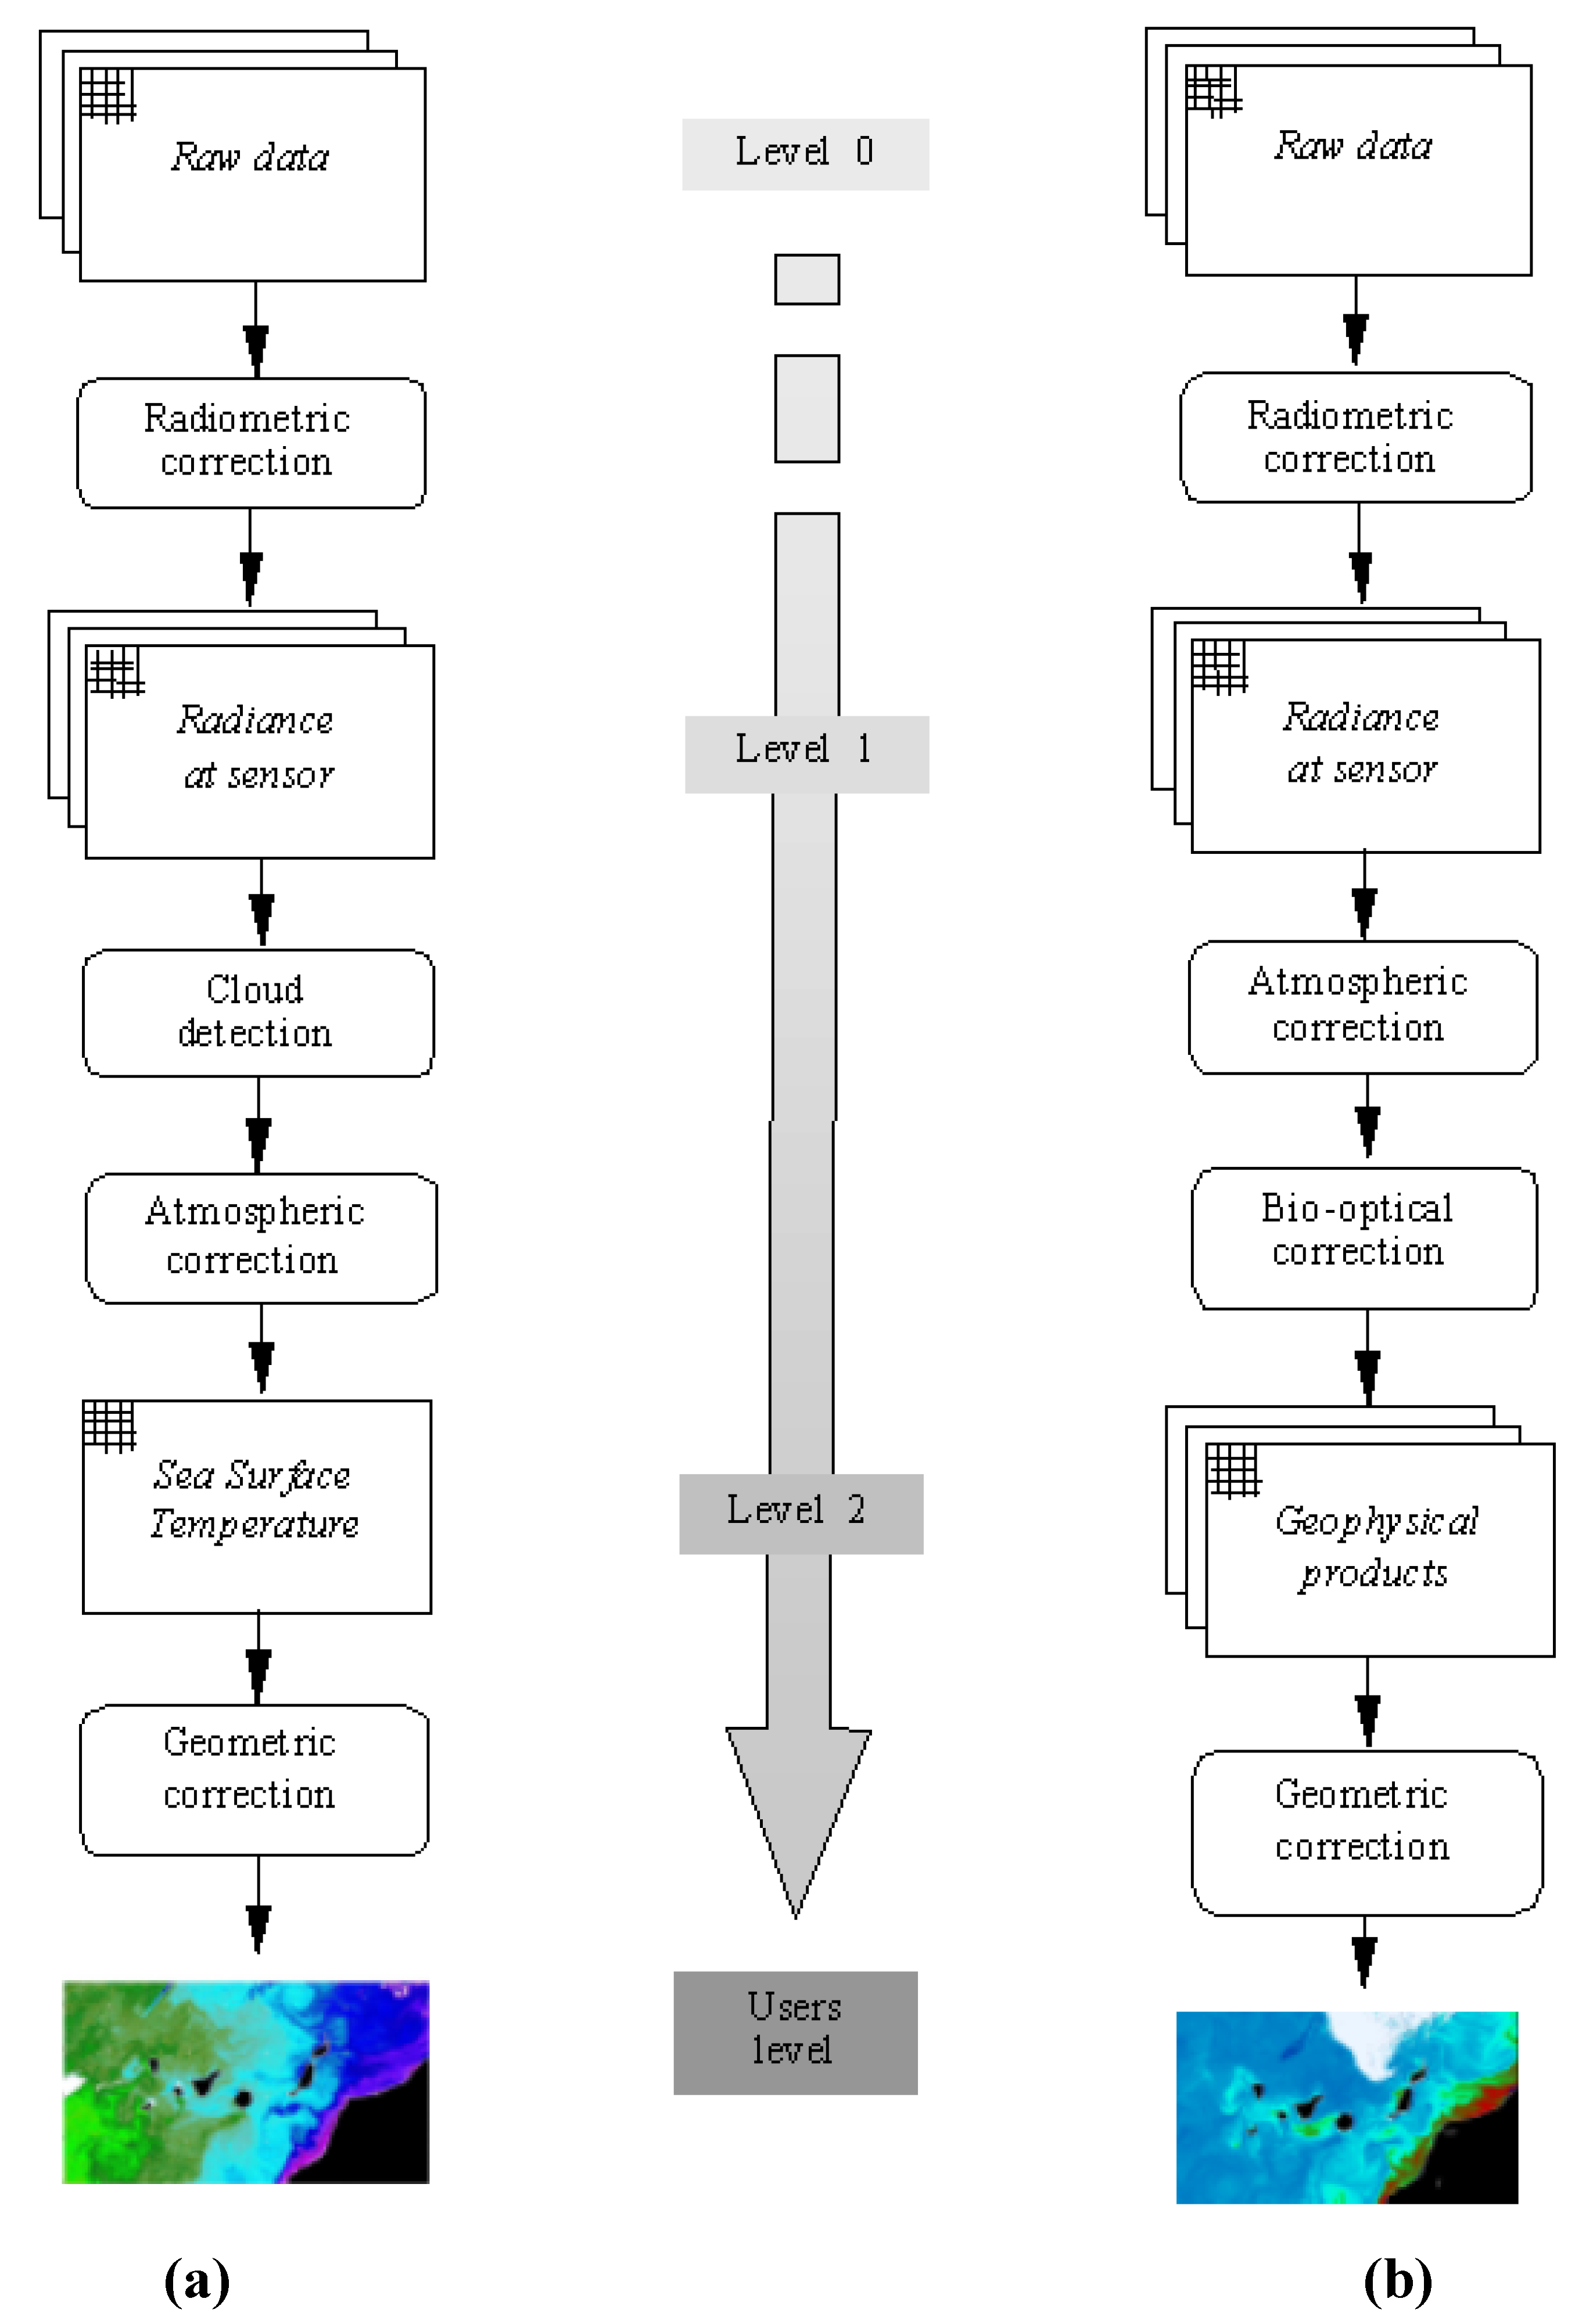
Figure 2 (a) and
Figure 2 (b) show the flowchart of the processing hierarchy levels applied to NOAA/AVHRR-3 and SeaStar-SeaWiFS data.
Figure 2.
Processing levels hierarchy. (a) NOAA-AVHRR data and, (b) SeaStar-SeaWiFS data.
Figure 2.
Processing levels hierarchy. (a) NOAA-AVHRR data and, (b) SeaStar-SeaWiFS data.
2.2. TERRA/AQUA-MODIS
The Moderate Resolution Imaging Spectrometer (MODIS) is a satellite based visible/infrared radiometer for the sensing of terrestrial and oceanic phenomena. It is operating on both the Terra and Aqua spacecraft with a viewing swath width of 2330 km. Its detectors measure 36 spectral bands between 0.405 and 14.385 µm, and it acquires data at three spatial resolutions (250 m, 500 m, and 1000 m).
MODIS bands 20, 22 and 23 in mid-infrared (3.7–4.1 μm) and bands 31 and 32 in thermal-infrared (11.0–12.0 μm) were placed to optimize their use for SST determination [
17]. The mid-infrared bands, whilst situated where the influence of column water vapour is minimal, suffer from a decrease in the availability of the Earth radiance and solar radiance reflection during daylight. The thermal-infrared bands are near the maximum of the Earth's emission and have larger bandwidth, but they are more affected by atmospheric water vapour absorption.
Through the Distributed Active Archive Center run by the Earth Sciences Department of NASA's Goddard Space Flight Center (GSFC), sea surface temperature products are available at 1-km resolution (Level 2) and at 4.6 km, 36 km, and 1° resolutions (Level 3). In our work we have used the Level 2 SST product which is produced daily using two different algorithms, from the thermal or the mid-infrared bands. The corresponding coefficients of the non-linear algorithms are tuned on a monthly basis to avoid a seasonal bias [
18].
Finally, to properly select the reliable areas in our registration algorithm we have used the MODIS Cloud Mask product and the Quality-Assessment parameter included for each SST pixel.
2.3. ERS/ENVISAT-ATSR
The Along-Track Scanning Radiometer, flying on-board ESA's ERS and ENVISAT satellites, is an advanced imaging radiometer, operating in the thermal and reflected infrared wavelengths (3.7, 11, 12 and 1.6 μm). The instrument views the Earth's surface over a swath-width of about 500 km and with a spatial resolution of 1 km. It has been designed for exceptional sensitivity and stability of calibration to enable the accurate measurement of sea surface temperature using a dual view (nadir and 56 degrees off to nadir) design to estimate and correct for atmospheric effects.
The sea-surface temperature products have been implemented at the Rutherford Appleton Laboratory (UK) and they are computed for regional and global studies which require the highest levels of accuracy. To check our registration methodology we used the gridded sea-surface temperature product (GSST) containing 512x512 pixels and where nadir and forward-view pixels are collocated, and have been mapped onto a 1 km grid. The GSST product, as described by [
19], provides temperature images using both nadir-only and dual view retrieval algorithms and, optionally, includes pixel latitude/longitude positions, X/Y offsets (sub-pixel across-track/along-track) co-ordinates, and the results of cloud-clearing/land flagging. Particularly, to identify the clear pixels in any given ATSR image, a cloud screening process [
20] is applied to all the channels and it is mainly based on the brightness tests originally developed by [
21] but optimised for use over the ocean.
4. Results
In this section, we present illustrative results of the operation of the registration algorithm with several types of remotely sensing data. Specifically, we provide experimental results for multitemporal and multisensorial image registration. So, the proposed algorithms have been tested in a large set of satellite images. Here we present a subset that illustrates some of their relevant features. The images have been obtained in the Canary Islands-Azores-Gibraltar area (39º15´N-19º15´W; 26º15´N-6º15´W), known as CANIGO area [
19].
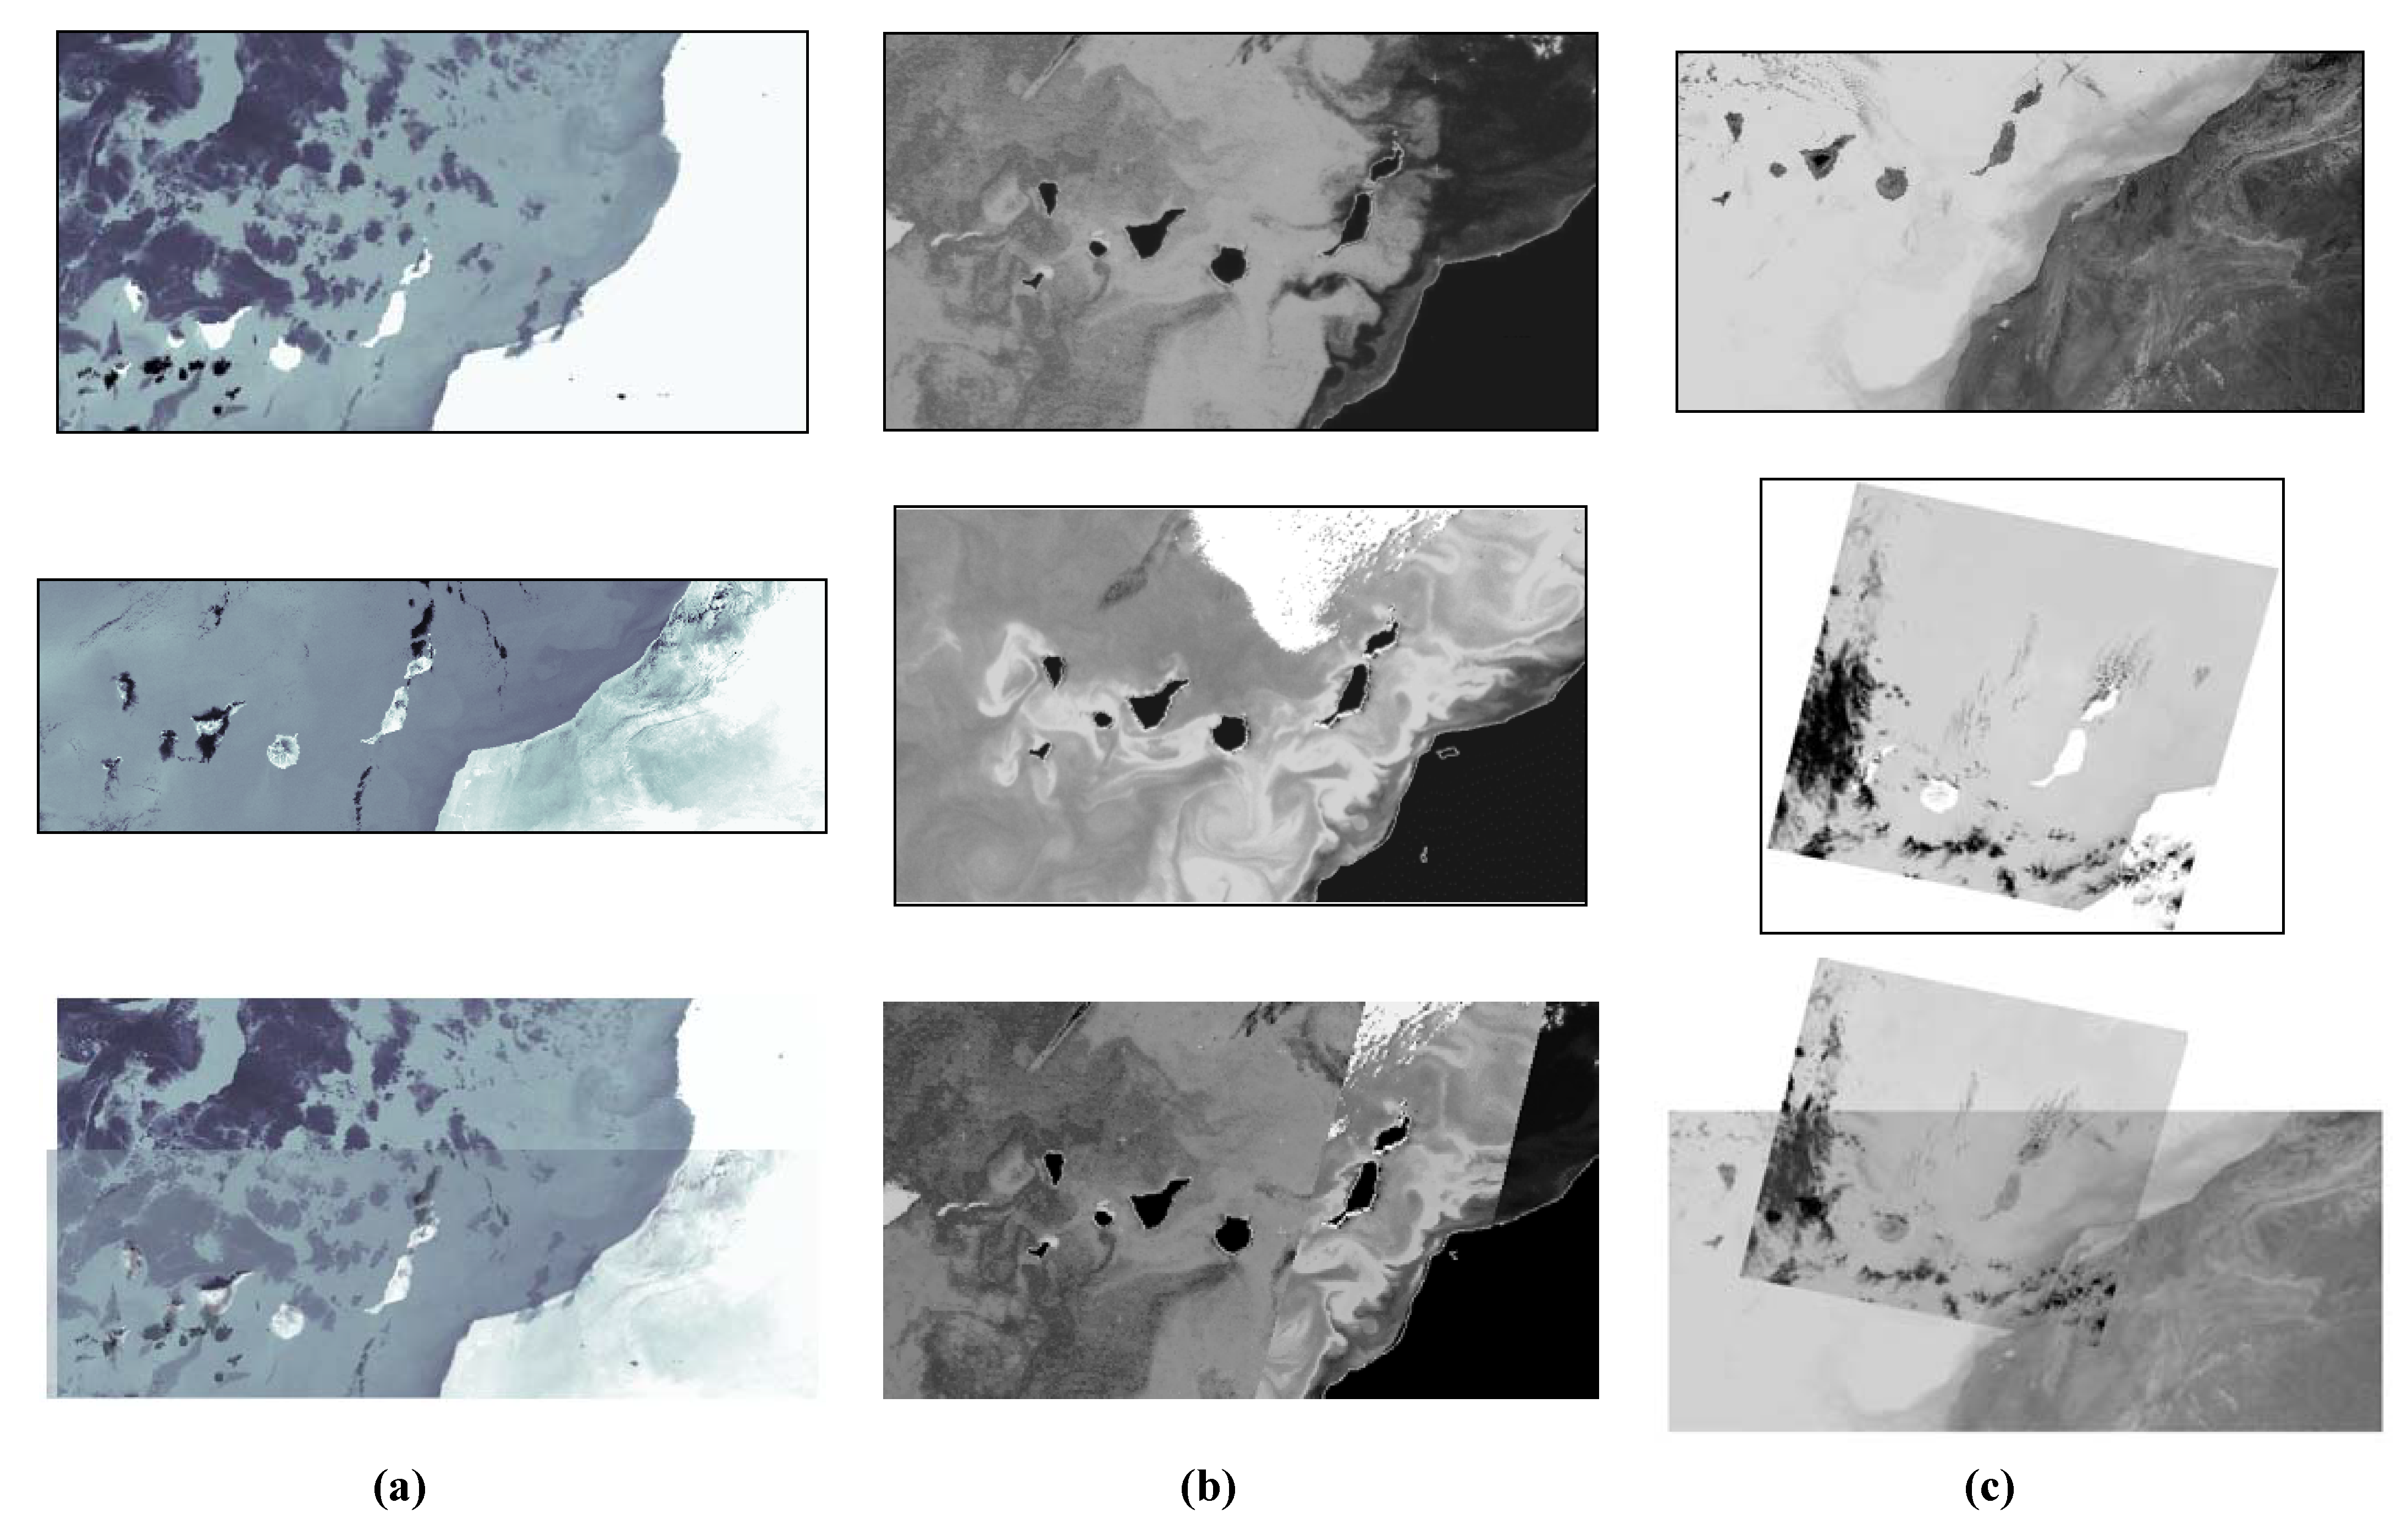
Figure 6(a) shows the results obtained for the multitemporal NOAA-AVHRR images of
Figure 3(a) and
Figure 3(b), corresponding to sea surface temperature data. Qualitatively, the correspondence between the reference and sensed images obtained by the proposed algorithms is accurate to within a pixel error in average.
Figure 6(b) presents the results of the proposed method in multisensorial images, corresponding to sea surface temperature and ocean colour data, acquired by the AVHRR and SeaWiFS sensors, respectively. Finally,
Figure 6 (c) presents the results of the proposed method in multisensorial SST images, corresponding to AQUA-MODIS and ERS/2-ATSR images of the Canary Island area, respectively. The correspondence between the reference and input images shows that the registration obtained by the proposed algorithm is accurate to within a pixel error in average.
Figure 6.
Results of contour-based approach applied to multitemporal/multisensorial image registration: (a) Multitemporal SST images from NOAA-AVHRR sensor, (b) multisensorial SST and ocean color images from AVHRR and SeaWiFS sensors, and (c) multisensorial SST images from AQUA-MODIS and ERS/2-ATSR sensors.
Table 2 shows the results obtained in a subset of multitemporal and multisensorial images. In it, the captured data and the initial/final energy obtained in the minimization process are presented for the proposed algorithm. From the perspective of the analysis and extraction of conclusions, a particular case is presented which gives an idea of the limits of the proposed technique. It corresponds to the comparison between the proposed optimization techniques with the area-based approaches, as implemented in [
11]. Results are presented in
Table 3 detailing the number of points used in the transformation parameters estimation (n) and the total RMS error in the horizontal (x) and vertical (y) directions. The proposed algorithm outperforms area-based techniques by over half a pixel on the average, even when a large number of control points are available. In consequence, this algorithm is adequate for automatic satellite imagery registration, even when they have partial or total occlusions and, thus, it is difficult to obtain a large number of well-distributed CPs.
Table 2.
Results of satellite image registration for three test cases.
Table 2.
Results of satellite image registration for three test cases.
| Images Satellite | Initial Energy | Final Energy | R.M.S. |
|---|
Reference: 18 January 1998
Satellite: NOAA/AVHRR-3 (517×993) | -0.0155 | -0.0537 | 0.987 |
Sensed: 3 July 1998
Satellite: NOAA/AVHRR-3 (237×629) |
Reference: 24 April 1999
Satellite: SeaStar/SeaWiFs (535×950) | - 0.0466 | -0.0793 | 1.015 |
Sensed: 24 April 1999
Satellite: NOAA/AVHRR-3 (535×950) |
Reference: 15 August 2001
Satellite: AQUA/MODIS (500×1100) | -0.0542 | -0.0869 | 1.184 |
Sensed: 15 August 2001
Satellite: ERS/2-ATSR (500×500) |
Table 3.
Comparison between an area-based technique and the optimization technique.
Table 3.
Comparison between an area-based technique and the optimization technique.
| Images | Area-based technique | Optimization technique |
|---|
Multitemporal
NOAA/AVHRR-3 | n | 10 | n | 1150 |
| x | 1.835 | x | 1.093 |
| y | 2.442 | y | 0.975 |
Multisensorial
AVHRR-3/SeaWiFS | n | 15 | n | 1398 |
| x | 1.675 | x | 0.662 |
| y | 1.487 | y | 0.398 |
Multitemporal Structures Tracking
NOAA/AVHRR-3 | n | 8 | n | 1010 |
| x | 1.375 | x | 0.853 |
| y | 1.653 | y | 0.595 |
5. Conclusions
This paper has dealt with automatic registration of remotely sensed imagery. This procedure appears often in the processing of multi-temporal and/or multisensorial image analysis, such as multisource data fusion, multitemporal change detection, structure recognition and tracking, etc.
In this work, we have explored the critical elements for an automated image registration system using NOAA-AVHRR/3, SeaStar-SeaWiFS, AQUA-MODIS and ERS/2-ATSR imagery. These elements include reference image coastline extraction, sensed image gradient energy map estimation and feature correspondence.
For this last process, we have developed a feature correspondence technique by optimization of the reference image contours on the sensed image contour matching techniques, based on a general affine transformation, which models directly the corrections in the image domain without an explicit identification of the distortion sources. Experimental results using optical and infrared images from different dates and sensors have verified the robustness and accuracy of the proposed algorithm, regardless the initial orbital prediction model, demonstrating that is capable of registering satellite images within one pixel. Furthermore, a new technique has been proposed to assess the accuracy of georeferencing approaches, which makes use of all reliable information in the image.
In summary, the technique of automated image registration developed in this work is potentially powerful in terms of its registration accuracy, the degree of automation, and its significant value in an operational context. The approach is also robust, since it overcomes the difficulties of control-point correspondence caused by the problem of feature inconsistency and, consequently, improves the analysis and data interpretation accuracy and facilitates its update to future remote sensing sensors or other applications. We have, as well, demonstrated the excellent performance of our methodology when compared with area-based techniques, improving the registration accuracy by half a pixel.
Especially, the favourable results from this study have spawned a follow-up project that consists in the tracking of mesoscale structures using multitemporal and multisensorial data [
6,
25]. This project estimates the motion of coastal upwelling in image sequences with different region matching and differential algorithms. The accuracy of the motion field has been computed using synthetic and real sequences, as well as in-situ measurements. To that respect it is important to emphasize the need of a precise registration methodology to achieve satisfactory results. In particular, this automated registration procedure has been used with great success in our work.
Figure 7(a) shows the segmented upwelling for a multitemporal sequence while
Figure 7(b) includes the contours for a multisensorial sequence along with the recovered motion field.
Figure 7.
Results of satellite imagery registration technique applied to automatic structures tracking: (a) upwelling contours for AVHRR images of 15 (blue, 425x525), 16 (red, 350x450) and 17 (yellow, 400x600) August 2001. (b) Motion estimation for a pair of images of Cape Ghir of 9 (yellow) and 10 (red) November 2002 (300x350).
