Abstract
The proposed Autonomous Stress Indicator (ASI) is a device that monitors the contents of the protection relays on a suspect weak power system bus and generates a performance level related to the degree of system performance degradation or instability. This gives the system operators some time (minutes) to take corrective action. In a given operating area there would not likely be a need for an ASI on every bus. Note that the ASI does not trip any breakers; it is an INFORMATION ONLY device. An important feature is that the system operator can subsequently interrogate the ASI to determine the factor(s) that led to the performance level that has been initially annunciated, thereby leading to a course of action. This paper traces the development of the ASI which is an ongoing project. The ASI could be also described as a stress-alert device whose function is to alert the System Operator of a stressful condition at its location. The characteristics (or essential qualities) of this device are autonomy, selectivity, accuracy and intelligence. These will fulfill the requirements of the recommendation of the Canada –US Task Force in the August 2003 system collapse. Preliminary tests on the IEEE 39-bus model indicate that the concept has merit and development work is in progress. While the ASI can be applied to all power system operating conditions, its principal application is to the degraded state of the system where the System Operator must act to restore the system to the secure state before it migrates to a stage of collapse. The work of ASI actually begins with the Areas of Vulnerability and ends with the Predictive Module as described in detail in this paper. An application example of a degraded system using the IEEE 39-bus system is included.
Preface
The proposed Autonomous Stress Indicator (ASI) is a power blackout prediction device. It would be located in a substation remote from the Central Office, and it analyses electrical information peculiar to that location which predicts the near future of its Performance Levels (stress) which can, in turn, impact the viability of the entire system. The information analyzed is of a class that is not economically possible to be transmitted to the Central Office for processing by the central computers. The ASI analysis output takes the form of four letters delivered to the desk of the Central Operator.
The purpose of this paper is to highlight the concept and show an application example of a degraded system using the IEEE 39-bus system. See Section 8. This is an active project and is at the stage where models having more than 39 busses are to be analyzed.
1. Introduction
The ASI begins with the North American power system collapse of 14 August 2003 which emphasized the fact that there was great pressure to operate power systems at elevated stress levels sometimes with inadequate understanding of the consequences. The resulting analysis carried out by the Canada-US task force classified four groups of issues mainly related to reliability and prepared the 46 recommendations to avoid such blackouts in the future [1].
Among these, recommendation 22 states that real-time tools be adopted and recommendation 30 states that criteria for identification of operationally critical facilities be clarified and improved.
It is in this context that the ASI is proposed as a response to these recommendations.
The ASI is a device that acts as an early warning system to alert the System Operator of possible system violations that may lead to system collapse. The idea behind the ASI is that if sufficient warning time has been given to the System Operator, remedial actions can be initiated to avert the possibility of a system collapse. Everything depends, therefore, on the detection of system stresses and the prediction of their degree of severity as seen from the ASI location.
Thus the ASI acts as a local intelligent system predictor that records the on-line system parameters at its location, detects system stresses and predicts their severity. All these operations are carried out in a selected location termed an Area of Vulnerability. Deployment of several ASIs in identified areas of vulnerability forms a system of autonomous distributed predictors to alert the System Operator of possible system stresses and their severity so that required remedial actions can be taken. Thus the ASI is in fact a stress-alert device.
The proposed ASI is a device that monitors the contents of the protection relays on a suspect weak bus and generates a performance level related to the degree of system performance degradation. This gives the system operators some time (minutes) to take corrective action. In a given operating area there would not likely be a need for an ASI on every bus. Note that the ASI does not trip any breakers; it is an INFORMATION ONLY device. An important feature is that the system operator can subsequently interrogate the ASI to determine the factor(s) that led to the performance level that has been initially annunciated, thereby leading to a course of action.
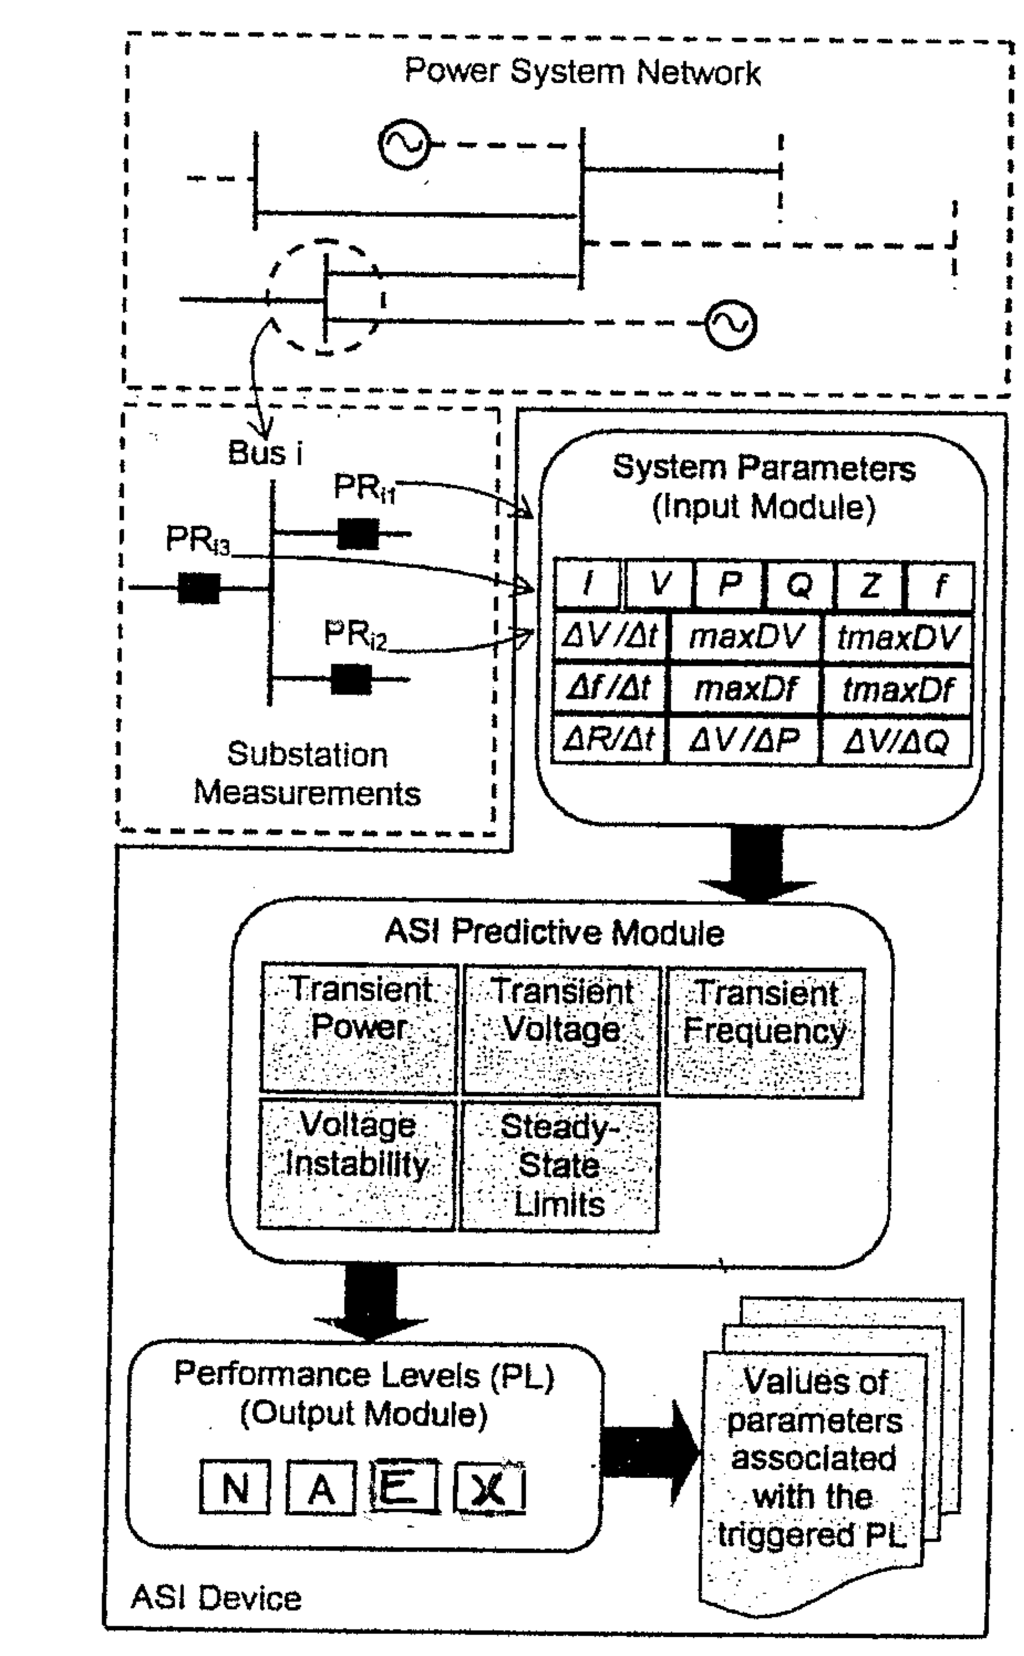
Figure 1.
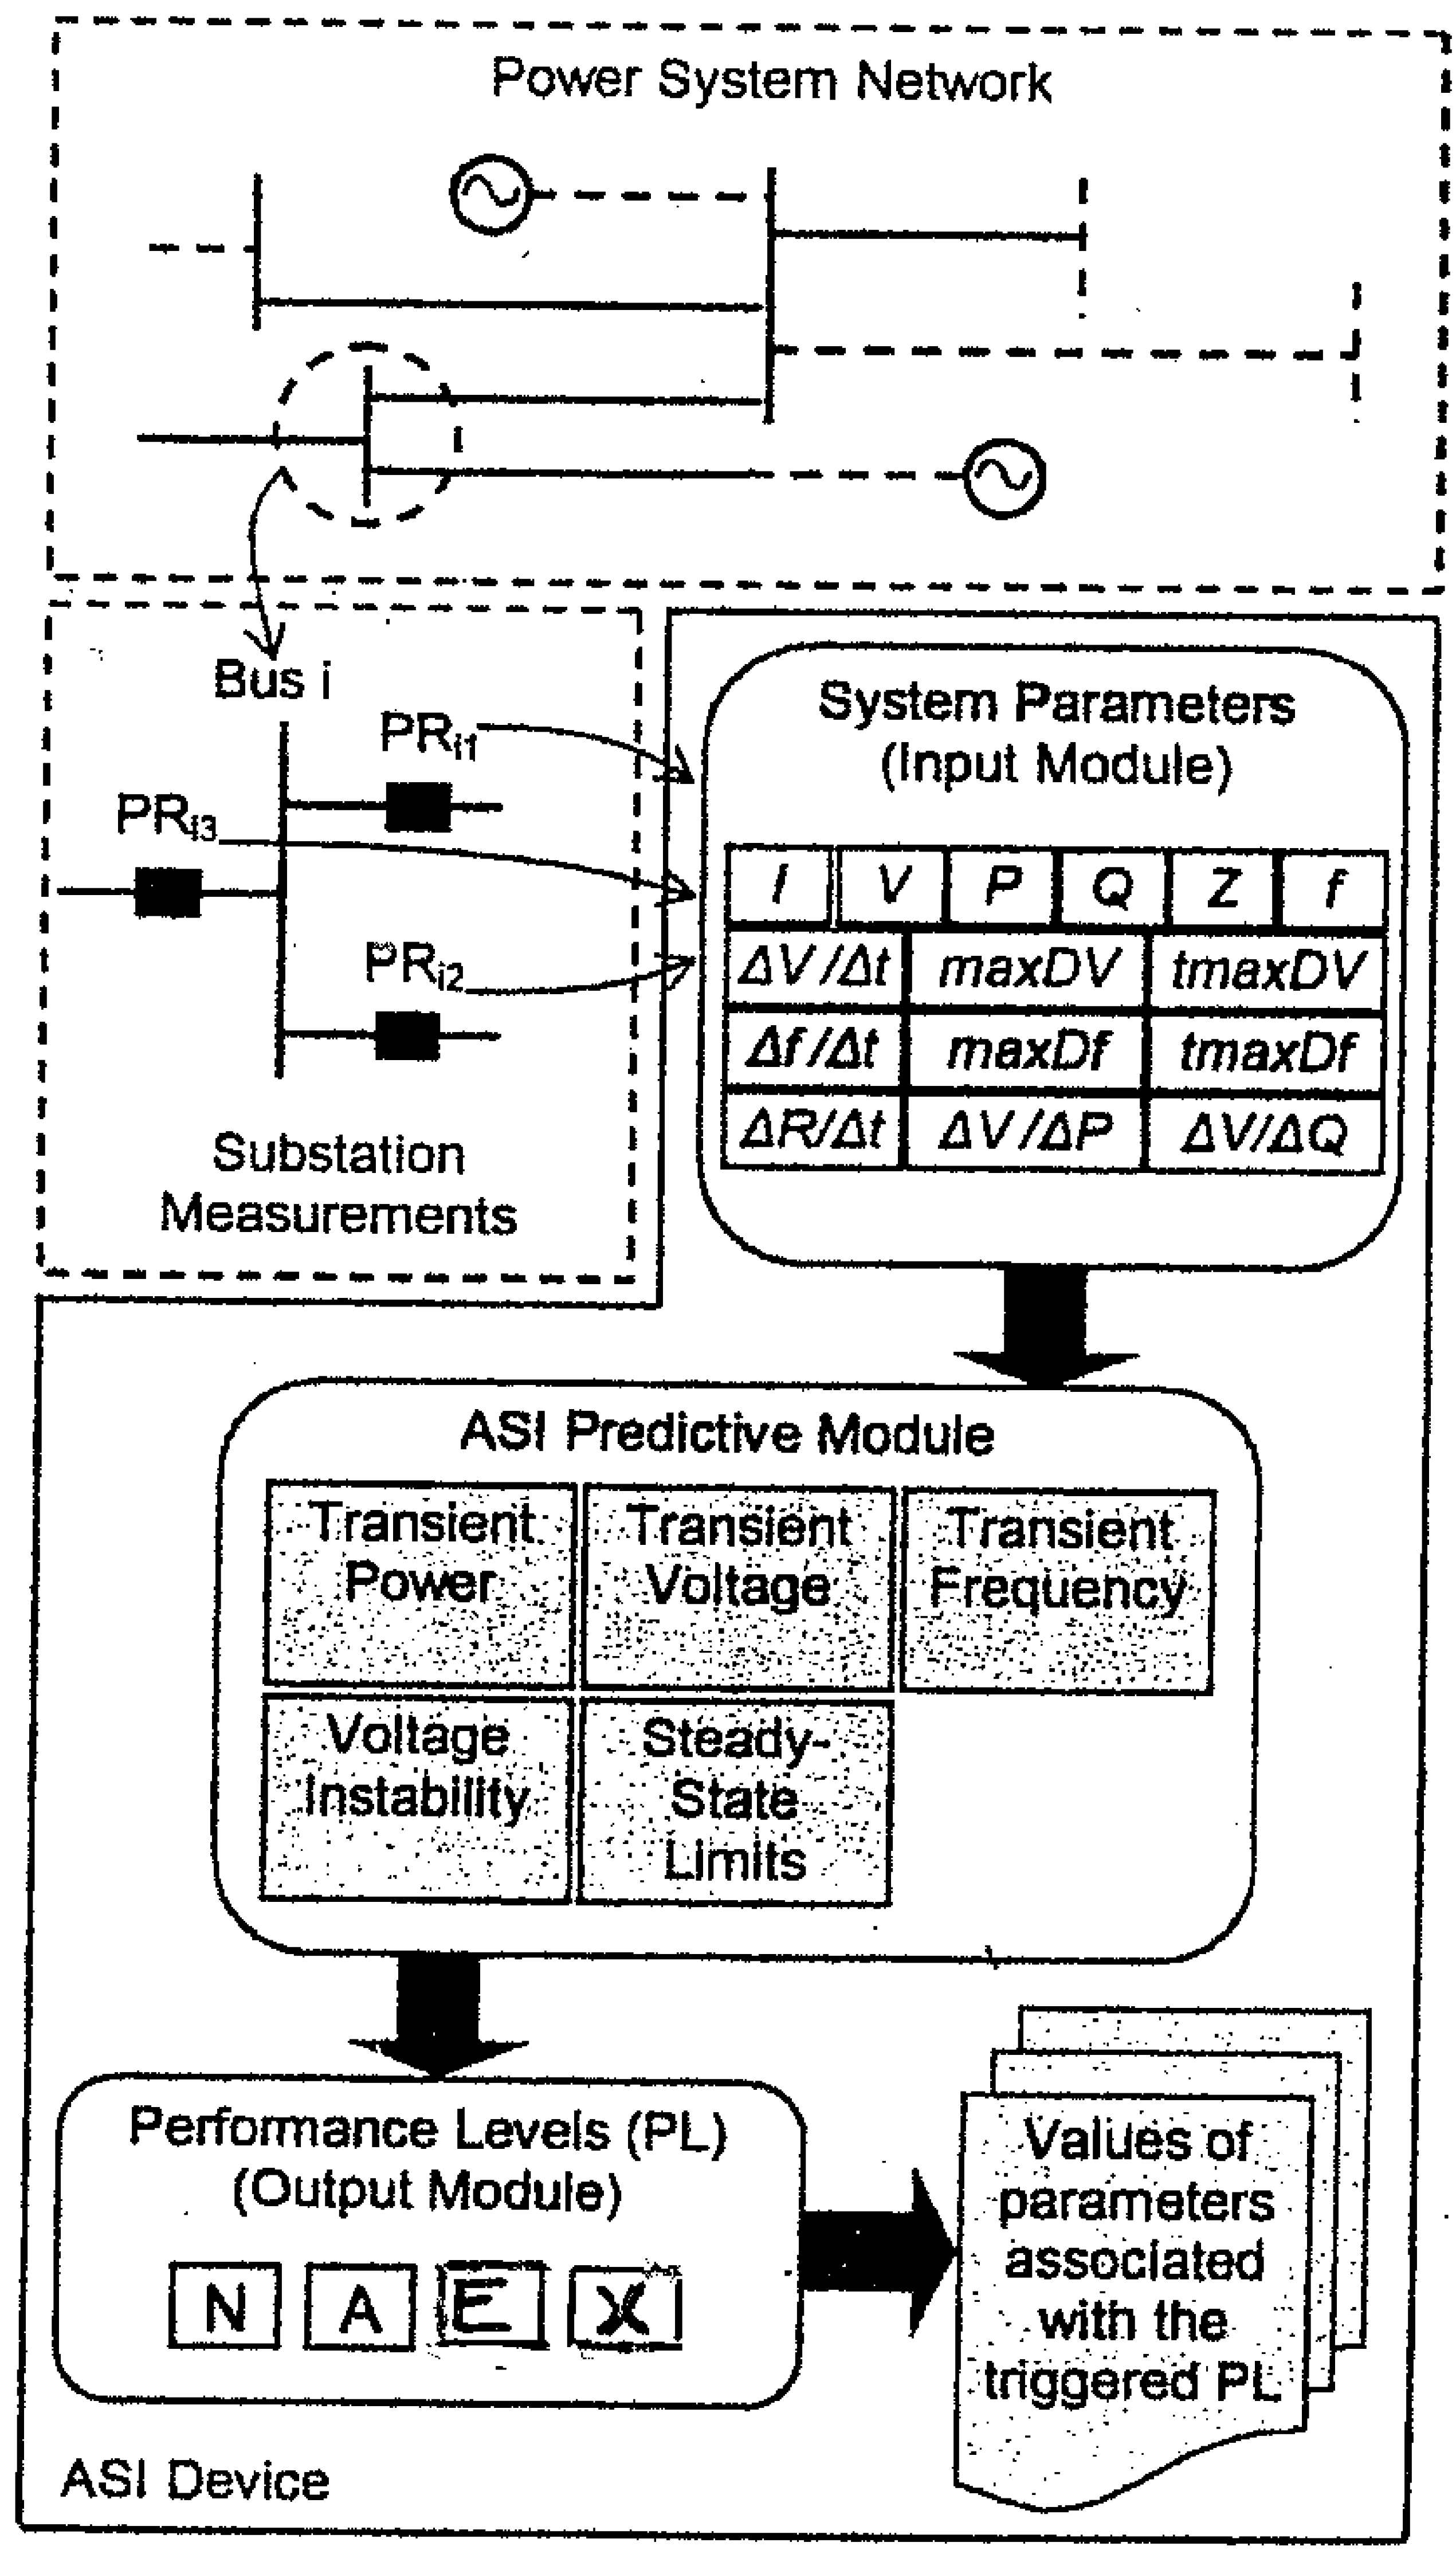
Concept of the ASI. (N = Normal, A = Alert, E = Emergency condition, X = eXtreme condition. There would be a local display of Levels and at the System Office there would simply be the four lights plus a curser click to bring up only the important parameters on the main screen.
Figure 1.
Concept of the ASI. (N = Normal, A = Alert, E = Emergency condition, X = eXtreme condition. There would be a local display of Levels and at the System Office there would simply be the four lights plus a curser click to bring up only the important parameters on the main screen.
2. The Nature of Stress and Its Relation to Contingencies
The concept of stress in the context of the paper could be defined as “operating a system under a reduced level of security [2].” While most power systems are operating close to their normal limits, such a state is not considered as a stress in this context. Rather, stress has been defined in terms of the contingencies that are suffered by the power system. The degree of severity of the contingency has likewise been defined as the corresponding operating state and has also been defined as a performance level and denoted by the symbols NAEX, as shown in Figure 1. The objective of the ASI is to select the appropriate performance level and forward this to the System Operator for action.
For a stress-alert device to be effective it must be able to predict the stresses that occur in the system (at its location) and their degree of severity. The principal characteristics of this device are therefore its predictive and analytical features and to describe these one should begin with the third and last module of ASI, namely the Output Module, as shown in Figure 1.
While the Output Module is the object of the ASI design and its alert system, it is probably necessary to review the process whereby this alert system was conceived. To predict a possible stress in the system one must first accumulate a repository of patterns related to system disturbance. They are obtained by simulating these contingencies and recording the results. This is the area where data mining is useful. From these patterns (referred to as ASI Predictors) the ASI can predict the result of an actual system disturbance and its degree of severity from its repository of coincidental events, a process termed “pattern recognition.”
Thus the ASI encompasses the following unique and distinctive features, namely:
- -
- A data-mining system to select the simulated contingencies off-line and record their patterns.
- -
- A pattern-recognition system to predict the degree of severity of an actual contingency.
- -
- The built-in algorithms necessary to carry out these complex calculations.
By these means, the objective of the ASI as a stress-alert device can be achieved.
It is important to realize that the signals sent to the System Operator by the ASI are the single most important pieces of information that can be delivered. They describe the state of the system at the ASI location. These signals are defined as follows based on NERC Planning Standards.
N: denotes a normal condition that does not involve a contingency and simply alerts the System Operator to the fact that ASI is operational.
A: denotes alert in a degraded system (N-1) that requires the System Operator to correct this situation so that it does not deteriorate into a more severe condition.
E: denotes an emergency condition (a system on the verge of collapse) that allows the System Operator to reject load or generator (or both) to maintain the integrity of the system.
X: denotes an extreme condition that will require the System Operator to create ‘islands’ that are self-sustaining so as to maintain at least some degree of service.
Since the states of the system (the Performance levels) are related to the contingencies, there must be an algorithm to relate the Performance levels to the contingencies to assure the successful operation of the ASI.
The relation between the states of a system and the contingencies has been covered extensively in the paper on the “Process of System Collapse” [3]. Four possible states of the system have been defined, namely: secure, degraded, verge of collapse and extreme. Because of the wide interpretation of the contents of these four states, an attempt has been made to relate these states to the contingencies to describe how a system can disintegrate from a secure state to an emergency: a process described as a migration of states. When the states of a system migrates as a result of some contingency, it must be provided with the means to restore itself to the secure state, otherwise the system is on the verge of collapse. There is only one permanent state, namely the secure state.
Of particular interest is the degraded state that results from the occurrence of a normal contingency such as the loss of a line (N-1). The system Performance level is described by A (for Alert) and the system must be resolved to the secure state before it migrates to the verge-of-collapse state denoted by E (for Emergency).
In general, the degraded state, which is denoted by the Performance Level A, is the state that most often occurs and hence if this state is due to one particular event it may be sufficient to alert the System Operator of this fact without recourse to the Predictive Module for confirmation.
3. The Concept of the ASI
Many projects have been developed on the subject of monitoring and security analysis to assist the System Operator manage information overload. Those projects have provided elegant solutions that are real-time measured. However, they require wide-area measurements and high-speed communication links between the measured points.
As an alternative approach, ASI is proposed as a device designed to recognize the advent of a possible system stress at its location and alert the system operator accordingly. There are four principal characteristics that define the ASI, namely autonomous, selective, accurate and intelligent. These characteristics are critical to the reliable operation of the autonomous stress indicator and to the stress-alert system which it embodies. These characteristics are now described in detail.
Autonomous
This refers to the fact that the operation of the ASI does not require any external information. The operation depends on the information that it gathers from the protective relays at its specific location and processes it by means of its internal algorithm.
Selective
This refers to the choice of locations of the ASIs in the system. These locations have been termed “Areas of Vulnerability” and are based on the concept of a vulnerable system as one operating in a degraded state or with a “reduced level of security.” The whole concept of an area of vulnerability will be discussed in Section 6 of this paper since this concept is one of the two pillars that support the operation of the ASI
Accurate
This refers to the successful operation of the ASI and depends on the accuracy of the information that it gathers and analyzes and in this respect the credibility of the algorithms is extremely significant.
Intelligent
This refers to the fact that the operation of ASI depends ultimately on the imbedded algorithms. Each component of the ASI is equipped with appropriate algorithms to carry out the associated functions.
The objective, therefore, is to design a device that would have the above characteristics. Based on this objective, the design of ASI is presented in terms of its architecture (components) and the associated methodology (functions). As a prelude to this design subject, one could define the concept of ASI in the following statement or summary.
The basic concept of ASI is to simulate a pre-specified range of system contingencies so as to generate patterns in areas of vulnerability. The ASIs then compare these actual measurements (system parameters at these locations) against known patterns from which the stress levels of disturbances are predicted. These stress levels are defined in terms of performance levels (status of a system) and the resulting levels sent to the System Operator as required.
Referring to Fig.1, a summary of this concept follows:
- Simulate off-line contingencies and generate patterns for the Predictive Module as described in Section 5.
- Generate on-line system parameters on a continuous basis.
- Compare the on-line parameters with the many simulated patterns.
- Predict the corresponding stress levels.
- Initiate alarms.
- Provide the System Operator with information as requested.
4. The Architecture of the ASI (Figure 1)
This paper proposes an ASI whose functions are to interpret the on-line data being monitored and relate this data to the record of system performance under adverse conditions which has been recorded off-line. From its embedded algorithms, the ASI predicts the performance of the system under similar stresses. Those operations are all carried out on a selected location termed an Area of Vulnerability.
The concept of an ASI as monitor, interpreter and predictor is realized as shown in Figure 1 by means of the following three components, namely:
- -
- The Input Module
- -
- The Predictive Module
- -
- The Output Module.
These modules are described in some detail in this section.
The Input Module
The Input Module monitors the state of the system at the ASI location. The values measured are the current and voltage and from these values, the real and reactive power, frequency and apparent impedance are calculated. Breaker status and certain impedance relay quantities are also monitored. These calculated values are transformed into system parameters by the internal algorithms of the Input Module.
Some of these system parameters include the rate of change of:
- The apparent resistance
- The bus voltage
- The frequency
- Voltage with real power
- Voltage with reactive power
The internal algorithms that produce these system parameters mark the beginning of the ASI process since no progress can be made without these parameters. The patterns that they form and the functions that they fulfill are all the work of these algorithms as discussed in the Methodology.
The Predictive Module
The Predictive Module stores the system parameters supplied by the Input Module as well as the system parameters that it calculates from the simulation of system disturbances carried out off-line at the ASI location. The Predictive Module then compares these two sets of system parameters to determine if a system disturbance is occurring and its degree of severity in terms of a Performance Level which it will transfer to the Output Module.
The Predictive Module is a processing model based on data- mining technology. It predicts the system Performance Level at a specific location by processing and analyzing historical and real-time parameters. This model is constructed from five basic performance characteristics that are sensitive to system stress. As illustrated in Figure 1, these characteristics comprise transient power swing, transient voltage, transient frequency, voltage instability and steady-state limits. These characteristics generate the ASI Predictors and are discussed in detail in the Methodology dealing with the associated algorithms.
The Output Module
The Output Module stores the Performance Levels supplied by the Predictive Module and will initiate an alert to the System Operator if the Performance Level indicates a stressful condition in the system.
Thus the output of this module is a stress-level indicator corresponding to the severity of a disturbance at a given location. The stress-level indicator ranges from having no appreciably adverse effects to having a substantial effect. As indicated in Figure 1, four levels describe the states Normal, Alert, Emergency and Extreme (NAEX). These levels correspond to the North American Electric Reliability Council/Western Electricity Coordinating Council (NERC/WECC) Planning Standards [10].
The methodology for the operation of an ASI is now discussed in terms of the functions associated with these three modules and their embedded algorithms.
The Output Module could be considered as the stress-alert device since its function is to alert the System Operator of the degree of severity of the system disturbance.
The real question is whether there is time to identify the severity of a system disturbance and predict its consequences.
Perhaps the first application of ASI should be limited to the A (Alert) state.
5. The Methodology of ASI
The functions of the ASI modules are the work of the algorithms embedded in these modules. The algorithms associated with the technology of ASI are extremely complex and require expertise in their design and reliable transient stability programs for their testing to assure the prescribed performance.
In carrying out these functions of ASI, these algorithms are involved in all the three modules of ASI. At the present time, they have not yet been developed.
A brief survey of the required algorithms would be in order to establish their design characteristics, their implementation in the associated modules and their test prescriptions.
Once an Area of Vulnerability has been identified, the ASI can be installed at this location and the methodology then takes over to permit the ASI to execute its appointed functions. These are discussed in terms of the ASI modules.
The Input Module
The function of the Input Module is to monitor the performance of the system at the ASI location. On a continuous basis, the ASI records the current, voltage, real and reactive power and the corresponding system parameters, generally the rate of change of these values. This is the real work of the algorithms associated with the Input Module.
In a sense, this algorithm resembles the old oscillograph-perturbograph where increments of time are used to calculate these system parameters. If there is no significant change in a system parameter from one time increment to the previous one, the algorithm moves on to the next time increment.
If the algorithm does record a significant change, or a breaker status/relay quantity changes, the new system parameter is transferred to the Predictive Module, in the form of a pattern, so that the next phase of the methodology, the work of the Predictive Module and can be engaged.
The Predictive Module
The algorithms that carry out the functions of the Predictive Module represent the central activities of the ASI. Briefly, the Predictive Module receives the system parameters from the Input Module, compares them with the system parameters obtained from the off-line simulations to establish the degree of severity of an event.
There are quite a number of activities involved in this work of the Predictive Module or more precisely its algorithms. Some of these activities are of a unique character such as data mining and pattern recognition. It is evident that the Predictive Module is the engine that drives the ASI. However, the algorithms required for this purpose have yet to be developed and then tested to make sure that the activities involved can be executed in the time available for the event to be identified and corrected by whatever remedial action is necessary. No hardware has been built.
The first activity of the Predictive Module is to carry our simulations of system disturbances off-line and record these results. This activity involves the selection of the tests that will comprise the repository of events to be tested. Recourse can be made to data-mining technology for this activity. In a sense, the selection of the appropriate tests can be seen as similar to the method used by Hydro Quebec to select the tests on the 735 kV system to meet the design criteria [4].
The results of these tests have come to be known as ASI Predictors. They are generated by the performance characteristics as part of the data-mining process. They are in the form of patterns produced by the transient-stability program that carries out these tests. It is important, therefore, to have a reliable transient-stability program to produce the significant patterns that comprise the repository of these tests. There is no need to carry out thousands of tests since a limited number of tests should be sufficient for this purpose of producing the ASI Predictors.
The second activity of the Predictive Module is to compare the ASI Predictors – the results of the off-line tests – with the system parameters provided by the Input Module which have exhibited some degree of severity. Actually, both the ASI predictors and the system parameters are in the form of patterns and can be compared by a process called pattern recognition.
The pattern of the ASI Predictors, when compared with those of the system parameters from the Input Module, leads to a recognition that a system disturbance of some gravity has occurred at this ASI location. Moreover, because of this pattern recognition, the gravity of this event can be estimated and even predicted by the ASI Predictors. This is the purpose of the ASI Predictors.
Evidently, the link between the ASI Predictors and the system parameters is the key to the recognition of a system disturbance and its degree of severity.
The third activity of the Predictive Module is to evaluate the degree of severity of a system disturbance by a comparison of the patterns of the ASI Predictor and the system parameters. In fact, this comparison will lead to a prediction of the severity of the event, namely A or E or X as already defined. The prediction will then be transferred to the Output Module.
6. Areas of Vulnerability
Introduction
In the development of the ASI, two fundamental ideas have emerged namely the areas of vulnerability in a power system and the problem of stress in the system that results. In other words, an Area of Vulnerability is usually a source of stress in the system.
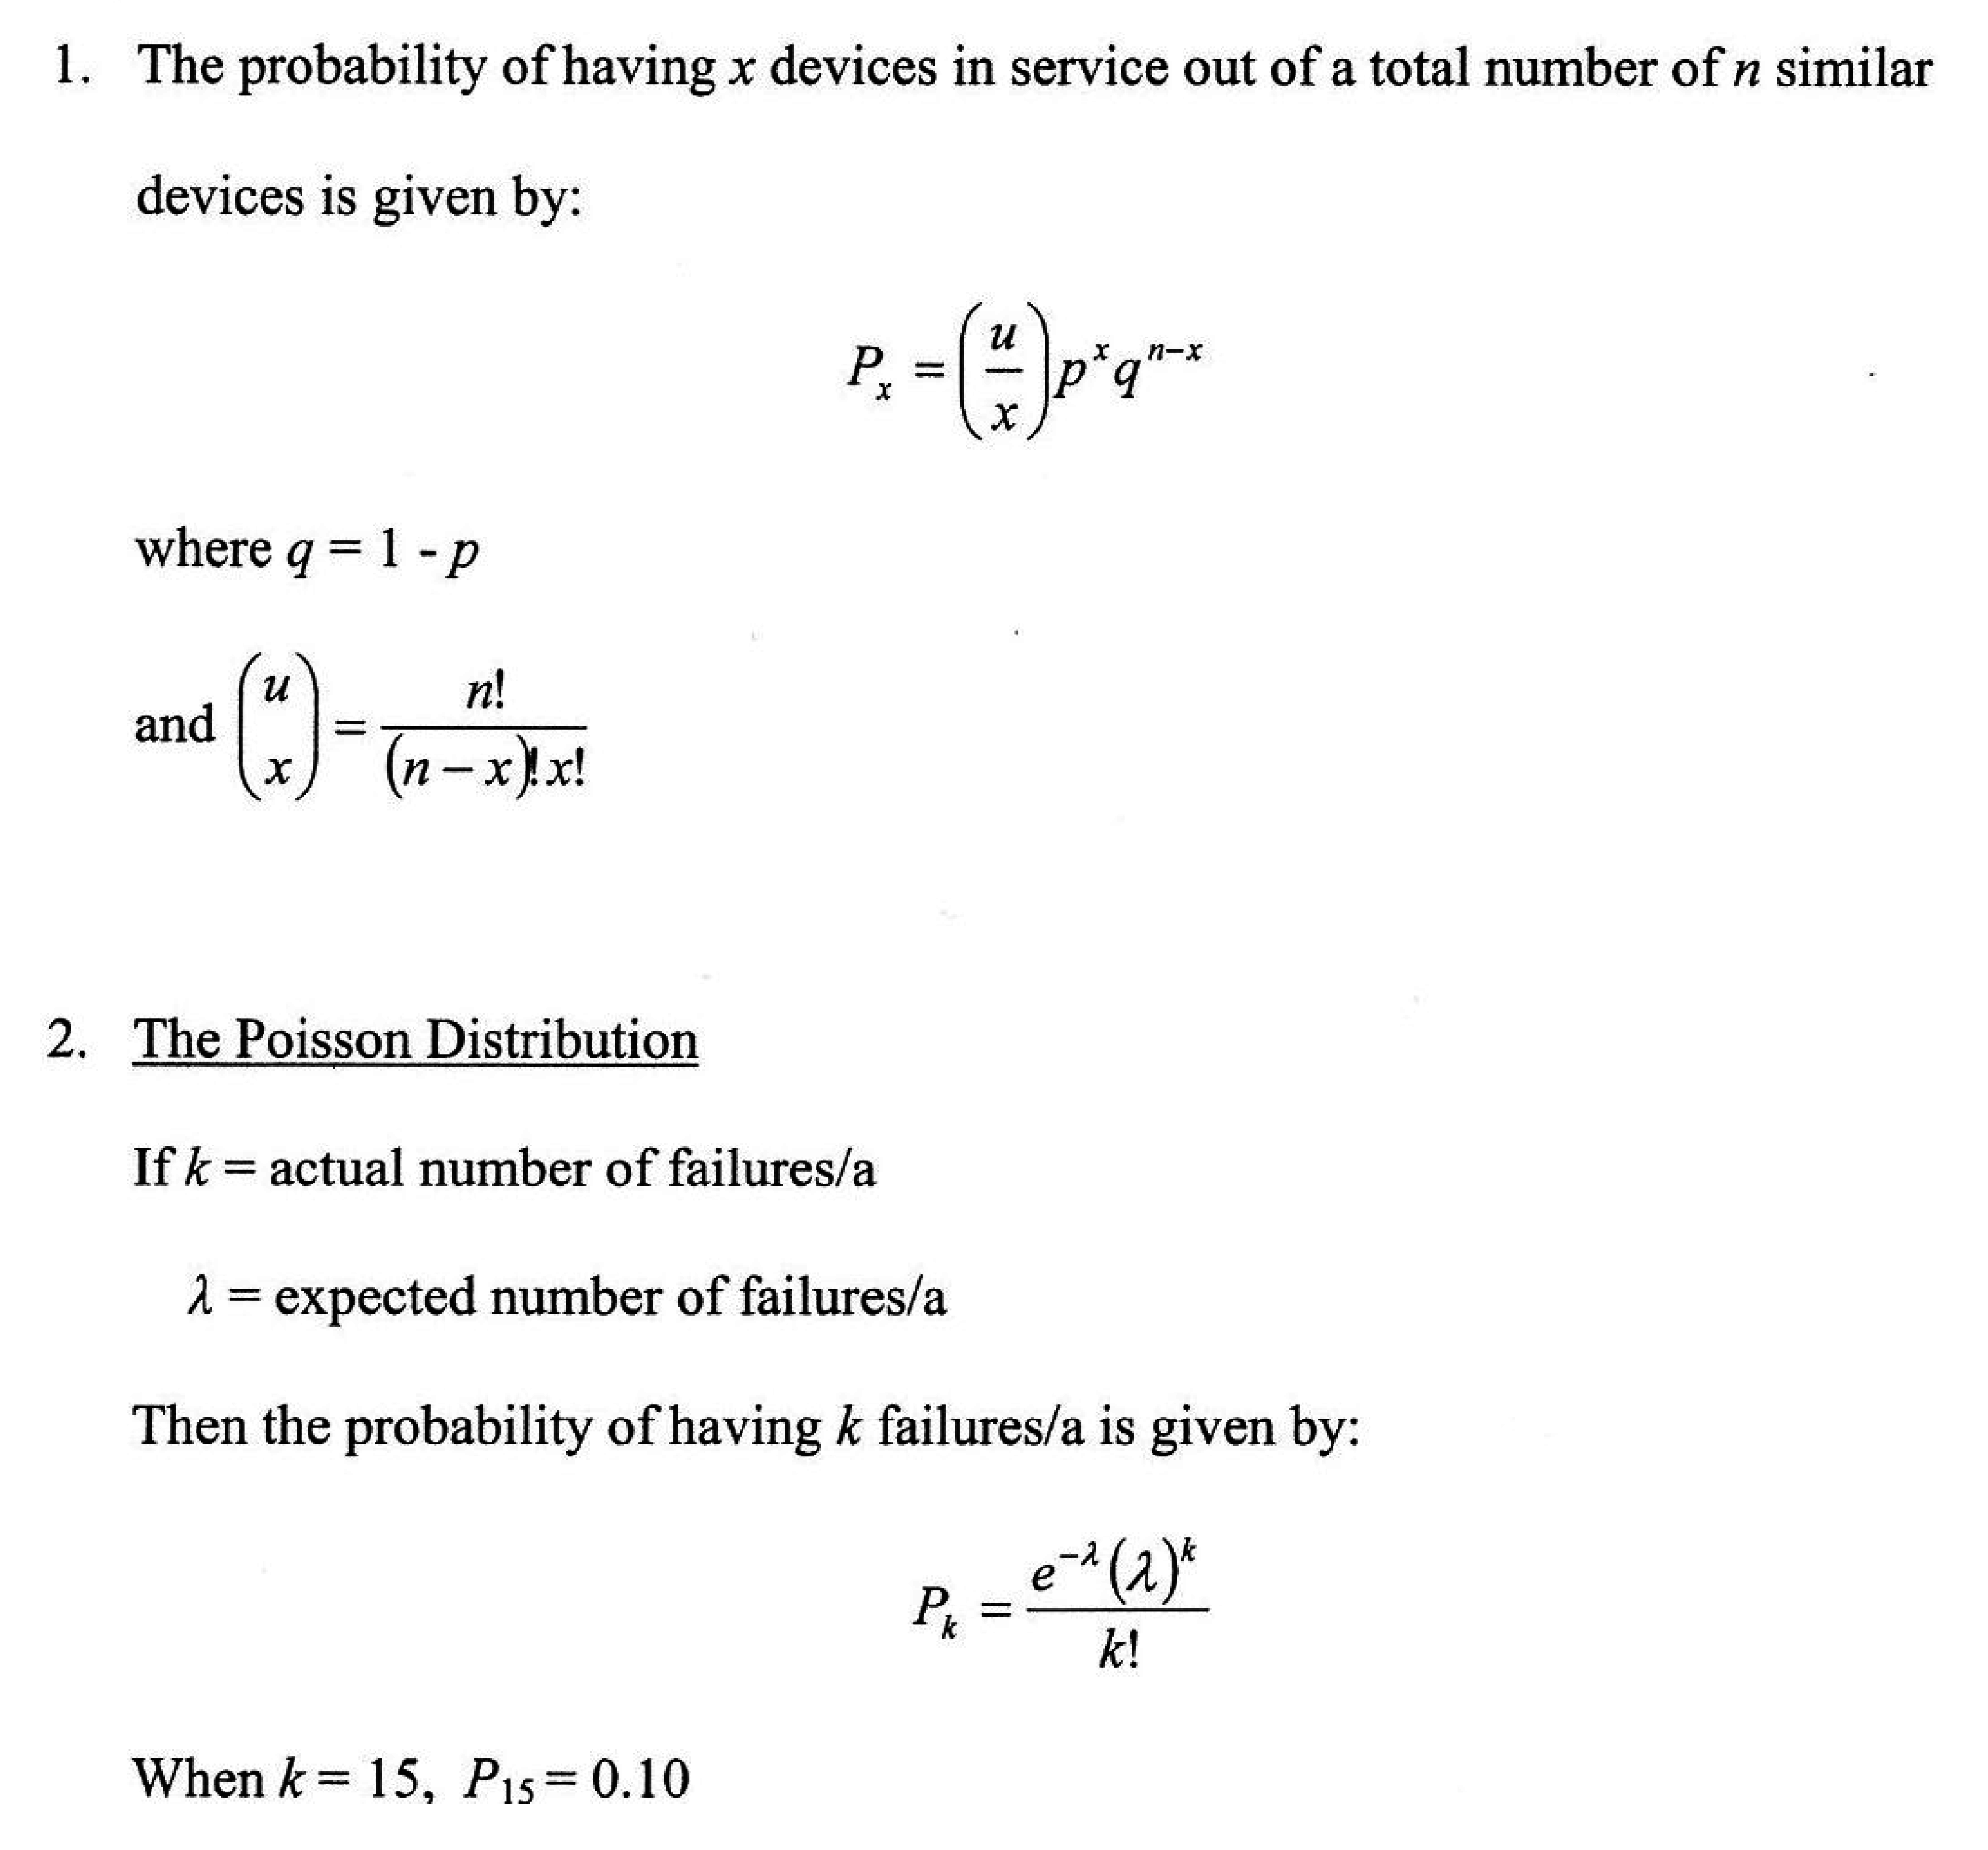
One can analyze this source of stress in two ways: either by a deterministic approach or a probabilistic approach. The deterministic approach is related to the design criteria of the system and involves an analysis of the adverse events and their consequences. The probabilistic approach is related to the impact of uncertainty in the planning and operation of a power system and involves a risk-of-failure approach for this analysis. The mathematics of this approach is shown in Fig. 2 and is discussed further in this Section and in Section 7.
The Concept of a Vulnerable System
The concept of a vulnerable system was first introduced by Fink and Carlson in the landmark paper entitled, “Operating under Stress and Strain,” where it was noted that a vulnerable system can be expressed as a system operating “with a reduced level of security” that renders it vulnerable to the cumulative effects of a series of moderate disturbances [2]. In other words, a vulnerable system begins to develop in a specific area of the system such as a major substation which has thus been designated as an Area of Vulnerability.
The concept of a vulnerable system is linked to the concept of an Area of Vulnerability since identifying such areas in a network reduces the task to a manageable size for the purpose of initiating the remedial action required to cope with these areas since they are the cause of the migration of the system states.
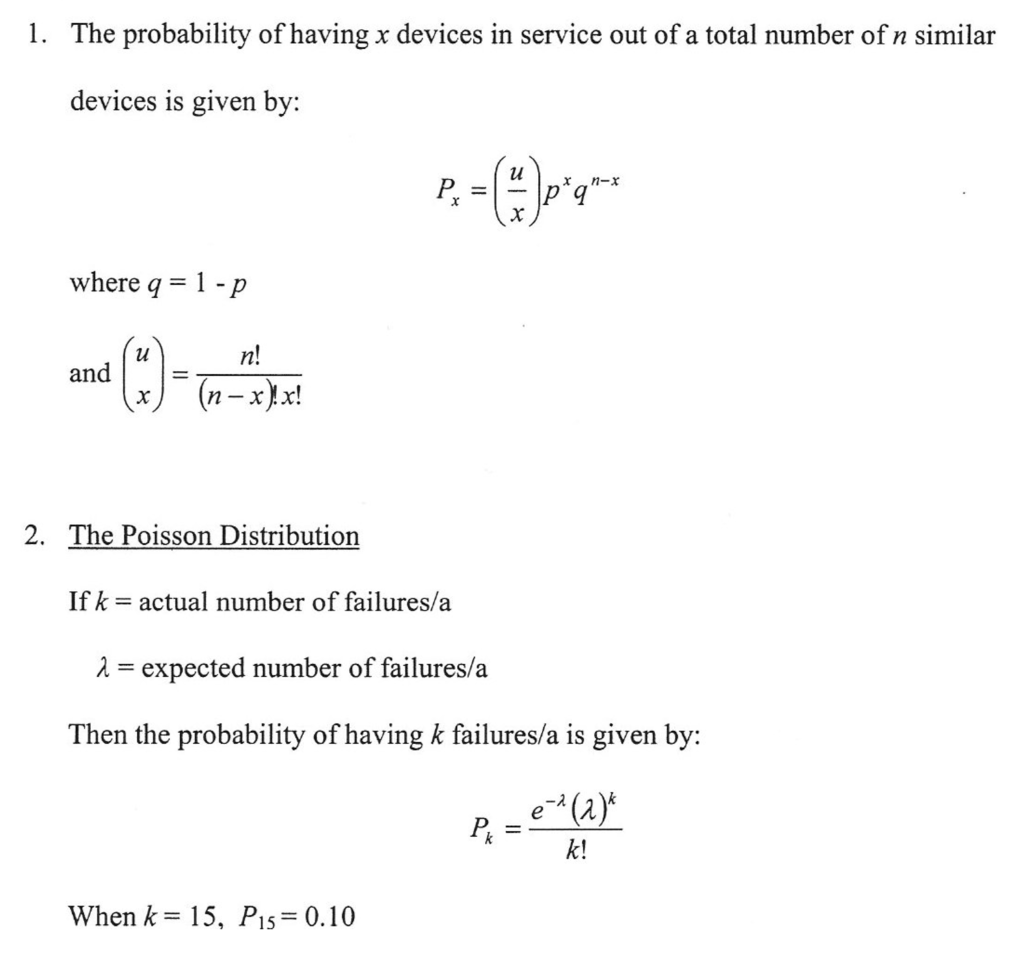
Figure 2.
Availability and its Implications.
(a= unit time)
Figure 2.
Availability and its Implications.
(a= unit time)
The Concept of Areas of Vulnerability
The concept of areas of vulnerability begins with a degraded area of the system (one operating with a reduced level of security) which may be subjected to further contingencies usually because of uncertainty. It is understood that remedial measures will be initiated to restore the system to the secure state. If, on the other hand, the degraded state persists, the system now moves to the verge-of-collapse state.
The area of vulnerability is thus a critical location in the network since it is the pivot that moves the system back to the secure state or forward to the verge-of-collapse state.
A methodology to identify these areas of vulnerability can be carried out using probabilistic security assessment which deals with the determination of contingencies that cause power system limit variations. Typical limits include line thermal limits, low voltage constraints, steady-state instability margins and transient instability margins [5].
Identifying Areas of Vulnerability
The process of identifying areas of vulnerability consists of carrying out simulations in critical locations in the network and recording the values of the system parameters that result from these simulations. These system parameters could be the rate of change of the apparent resistance, the voltage, the frequency and the real and reactive power. When these system parameters move towards the verge-of-collapse state, the identity of this area of vulnerability is confirmed.
The mechanism of this process is based on an events generator. Initially, it may be sufficient to simulate contingencies that would result in an Alert State (normal contingencies). Actually, it should not be too difficult to simulate these contingencies and to identify a particular area of vulnerability. The identification of these areas is the first step in the implementation of the ASI.
The Deployment of the ASI
The Area of Vulnerability is one of the two pillars that support the ASI. It is where the implementation of the ASI begins. It is important, therefore, that these areas of vulnerability be defined and identified. Not all locations in a network can be classified in this way but where they are identified, the ASI can be deployed.
In the area of power system prediction, the deployment of the ASI’s is critical to the defense of the network in terms of stress. Indeed, the identification of areas of vulnerability is the key that makes possible the deployment of the ASI’s for effective and successful system operation.
The deterministic approach to areas of vulnerability has been adopted since it relates stress to contingencies and their consequences. However, when the stress is from some uncertainty, the effect is more difficult to assess and a probabilistic approach is more suitable, as discussed in Section 7.
7. The Impact of Uncertainty
The probabilistic approach to the identification of Areas of Vulnerability is based on the impact of uncertainty on power system planning and operation.
Planning is essentially a conceptual exercise. It involves finding a balance between the requisites and constraints that define the planning environment. The requisites can easily be described as meeting the design criteria, keeping a sense of proportion, providing adequate reserves and maintaining flexibility of implementation and simplicity of operation. The constraints are obviously related first of all to the physical environment and the existing level of technology.
Design can be considered as the project definition of whatever facility is being planned. Evidently, when it comes to specifying the design characteristics, system simulation studies will be required. In this respect, it should be noted that the “curse of dimensionality” is highly over-rated. In fact, it can be shown that a very discrete number of tests is usually sufficient to define system performance under conditions of equipment malfunction.
Design criteria can be defined in deterministic or probabilistic terms as a set of events to be coped with (such as the type of fault) or as a risk of failure (such as failure and repair rates). In the deterministic approach, the N-1 criterion is mostly used for transmission lines and power transformers. It is generally recognized that this criterion more than adequately covers the reliability requirements for substation supply. The same is not true, however, for substation design itself whose reliability depends on the arrangement of the equipment and its associated buswork. This subject has been studied quite extensively and probabilistic methods to evaluate the Loss of Load Expectancy (LOLE) of various configurations have been devised. Indeed, all design is geared ultimately to reliability and especially to its economic implications.
Reliability can be defined as a measure of the ability of a device to perform its intended function. This performance is measured in terms of failure rate and repair rate and unavailability. The combination of these indices in a reliability evaluation results in a Markov Process that determines the probability of loss of load since all equipment has a certain expectancy of failure. Critical to this evaluation is the importance of dependable outage data: its collection in a systematic manner and its interpretation and application. There is such a data-collection system in Canada [6].
This section begins, therefore, with the role of Probability Analysis in power system planning.
The Role of Probability Analysis
There has always been uncertainty in the design of power systems because of the random nature of equipment forced outages and surges in transmission lines. Those uncertainties have been addressed through a probability analysis involving risk-of-failure calculations. Generation and transmission uncertainties have been defined in terms of risk of failure by means of convolutions of the associated parameters.
For example, with respect to forced outages on static compensators, the probability of having x devices in service out of a total of n similar devices is given by the equation in Figure 2 [7].
Similarly, with respect to the forced outages of 735kV power transformers, the number of massive failures over a thirty-year period encompassing 4000 transformer years was one hundred failures resulting in a failure rate of 2.5 percent [8]. As shown in Figure 2, if k is the actual number of failures per year and λ is the expected number of failures per year, then k is a probability distribution shown in Figure 2.
In this way one can estimate the cost of the unavailability of major equipment.
The Nature of Uncertainty
The nature of uncertainty has been demonstrated lately by the introduction of wind generation into the reliability evaluation process [9]. Wind generation is a probabilistic phenomenon because of the random nature of its production. One can compensate by firming up their production by means of spinning reserve but these reserves are not always available from the transmission system.
In many cases, it has been found that the penetration level of about twenty percent of the system capacity is a practical limit based on the ability of the transmission system to provide the required reserves at the right location. While a risk-of-failure approach has been applied to this problem, it is now believed that such an approach should be confined to the points of common contact (between the wind generation and the system) which would normally be considered as areas of vulnerability [9].
The Role of the Transmission System
It is evident that the transmission system plays a critical role in the analysis of the impact of uncertainty in the vulnerability of power systems. It is the link that governs the performance of the power system under stress and strain. Normally, forced outages of transmission lines are an uncommon event. Terminal equipment is the cause of most transmission line outages especially at extra-high voltages [8].
8. Application Example
The ASI is an information analysis rather than a protection device which is located in an area of vulnerability. It cannot know everything that is going on in the system but is watching for signs of impending trouble as in the case of multiple contingencies which will now be described.
Consider the IEEE 39-bus system shown in Fig. 3: The system is running at the expected day-before load and all bus voltages are satisfactory in the range of 1.02 pu to .98 pu. All required backup generation is in place and reactive power is of the required format such as capacitors or rotational apparatus is in service. As a result of numerous tests it has been decided to install two ASI’s, specifically at Bus-1 and Bus-16, and they are set up in accordance with the concept at the end of Section 3. Generator G10 fails and is shut down. The regular telemetering will inform the System Operator of this. ASI-Bus-1 will detect a momentary flicker of voltage due to the momentary short circuit in G10 and a pattern similar to Fig 4 may develop due to the redistribution of currents to supply the loads from the remaining generators. But ASI-1 determines that the voltage is still within specification and registers Performance Level N (Normal) because the spinning reserve has been adequate. The System Operators know that this is contingency No. 1 and that eventually they will get a report from the powerhouse as to when G10 will be back on line.
While this event is going on and the operators are coping with the loss of G10, a second contingency occurs and it happens to involve Bus-16, namely Line 16-17 which trips and locks out. The System Operators know about this via the regular telemetering. Now the shortfall of Bus-17 must be supplied by other far-away generators. ASI-Bus-16 is still very busy because it is receiving power from Bus-19, Bus-21 and Bus-24. It was distributing it to Bus-15 and Bus-17. The ASI is aware of the lockout on line 16-17 and will factor this into the stress analysis. It turns out that instead of the voltage of Bus-16 rising, it falls to .95 pu, putting the bus into the verge of collapse region. This is the region where voltage-restraint-overcurrent relays may start to time out and drop the load. The low-voltage condition will be reported by the regular telemetering but the fact that the voltage is at a dangerous level may not be known to the Operators. To make matters even worse, the ASI has detected instability on lines 16-21 and 16-24. (See Fig. 4 and Fig. 5.) This fact will not likely be known because the relay information is not usually telemetered. The ASI-Bus-16 determines from a pattern similar to Fig. 5 that the instability is of small magnitude and there is adequate time for the operator to take corrective action so, instead of putting out an E (Emergency) or X (Extreme) warning, it puts out A (Alert). The stability problem is part of the message that goes with the Performance Level shown in Fig. 1. Meanwhile the system operators will know via the regular telemetering that this line lockout is a second contingency and will be treating it as Emergency. Without this local analysis the system operators might not know of the situation at Bus-16.
It can be seen from the foregoing example that the ASI functions on having a supply of reference voltage patterns for various known situations which can be referenced to determine the Performance Level category, as accessed by the data mining algorithm. The example makes it clear that the ASI puts out warnings (Performance Levels) based on what it is sure is happening and it does not repeat status information that is sent via regular telemetering.
It is also clear that operator training on the application of the ASI is essential for its successful operation.
9. Conclusions
These conclusions are intended to set the stage for the implementation of the ASI based on the twin pillars of Areas of Vulnerability and the Predictive Module. From these basic concepts, the structure and operation of the ASI becomes evident as the mechanism for predicting the severity of stresses and the possibility of system collapse.
- Identifying areas of vulnerability is a critical step in anticipating the process of system collapse since it marks the beginning of the migration of the system states.
- The advent of uncertainty in power system operation as a result of wind generation will require a probabilistic approach to identify areas of vulnerability and the subsequent deployment of the ASI’s based on their prescribed design characteristics, namely, autonomous, selective, intelligent and accurate.
- The transmission system plays a significant role in this environment of uncertainty as it governs the successful operation of the power system under such stresses.
- The concept of a Predictive Module has not been found in the current literature.
- The idea that the system parameters can be stored and compared with those of the simulation exercise has not been found in the current literature.
- What is significant is that the assessment of the degree of severity can be evaluated and forwarded to the System Operator for remedial action as required.
- The Predictive Module is the key to the successful operation of the autonomous stress indicator provided these ASIs are deployed correctly.
- The design of the Predictive Module has involved two features not commonly associated with power system prediction, namely data mining and pattern recognition. Yet both of these concepts are essential to the design of the Predictive Module.
- As a first application of the autonomous stress indicator, it is suggested that the system contingencies be restricted to the Alert State (the Degraded State) so as to estimate the correctness of this device.
- In conclusion, the autonomous stress indicator could be identified as a stress-alert device since its main function is to alert the System Operator of the possibility of system collapse
- There are no financial incentives for the authors to publish this paper and there are no relationships with a company which could market such a device.
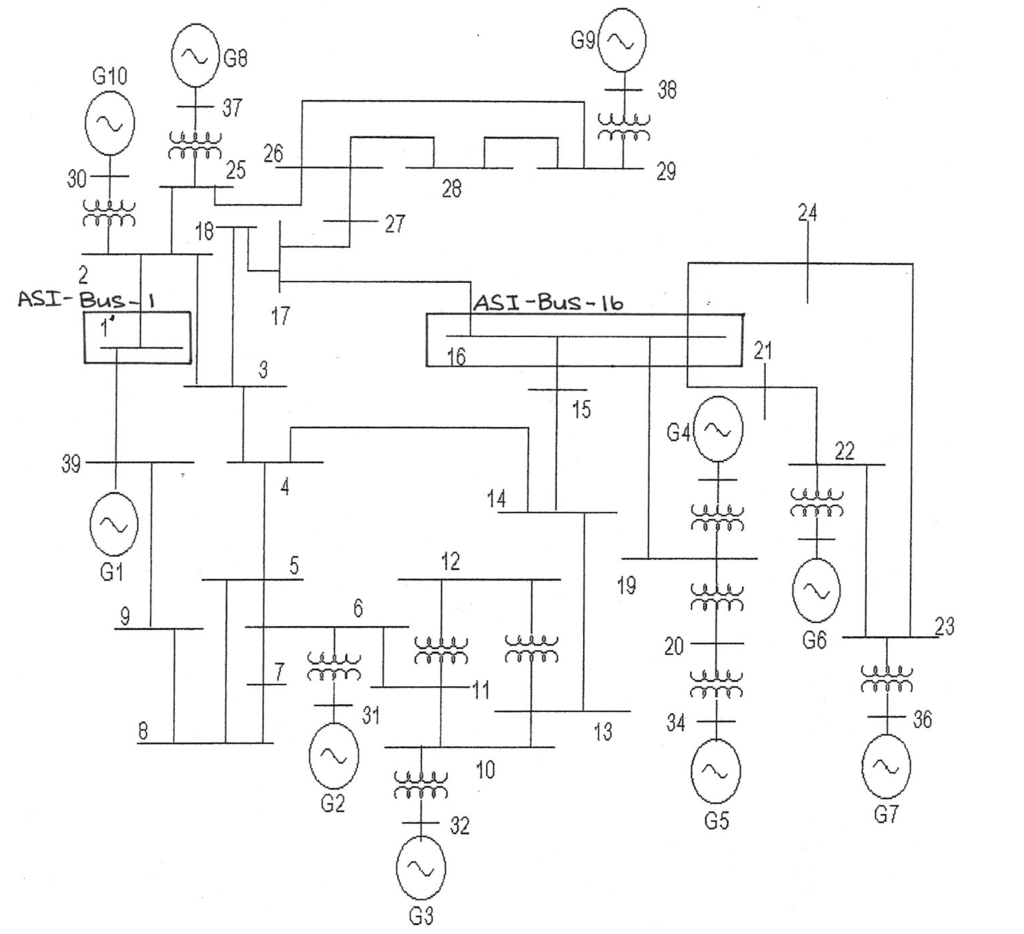
Figure 3.
10-machine, 39-Bus New England Test System.
Figure 3.
10-machine, 39-Bus New England Test System.
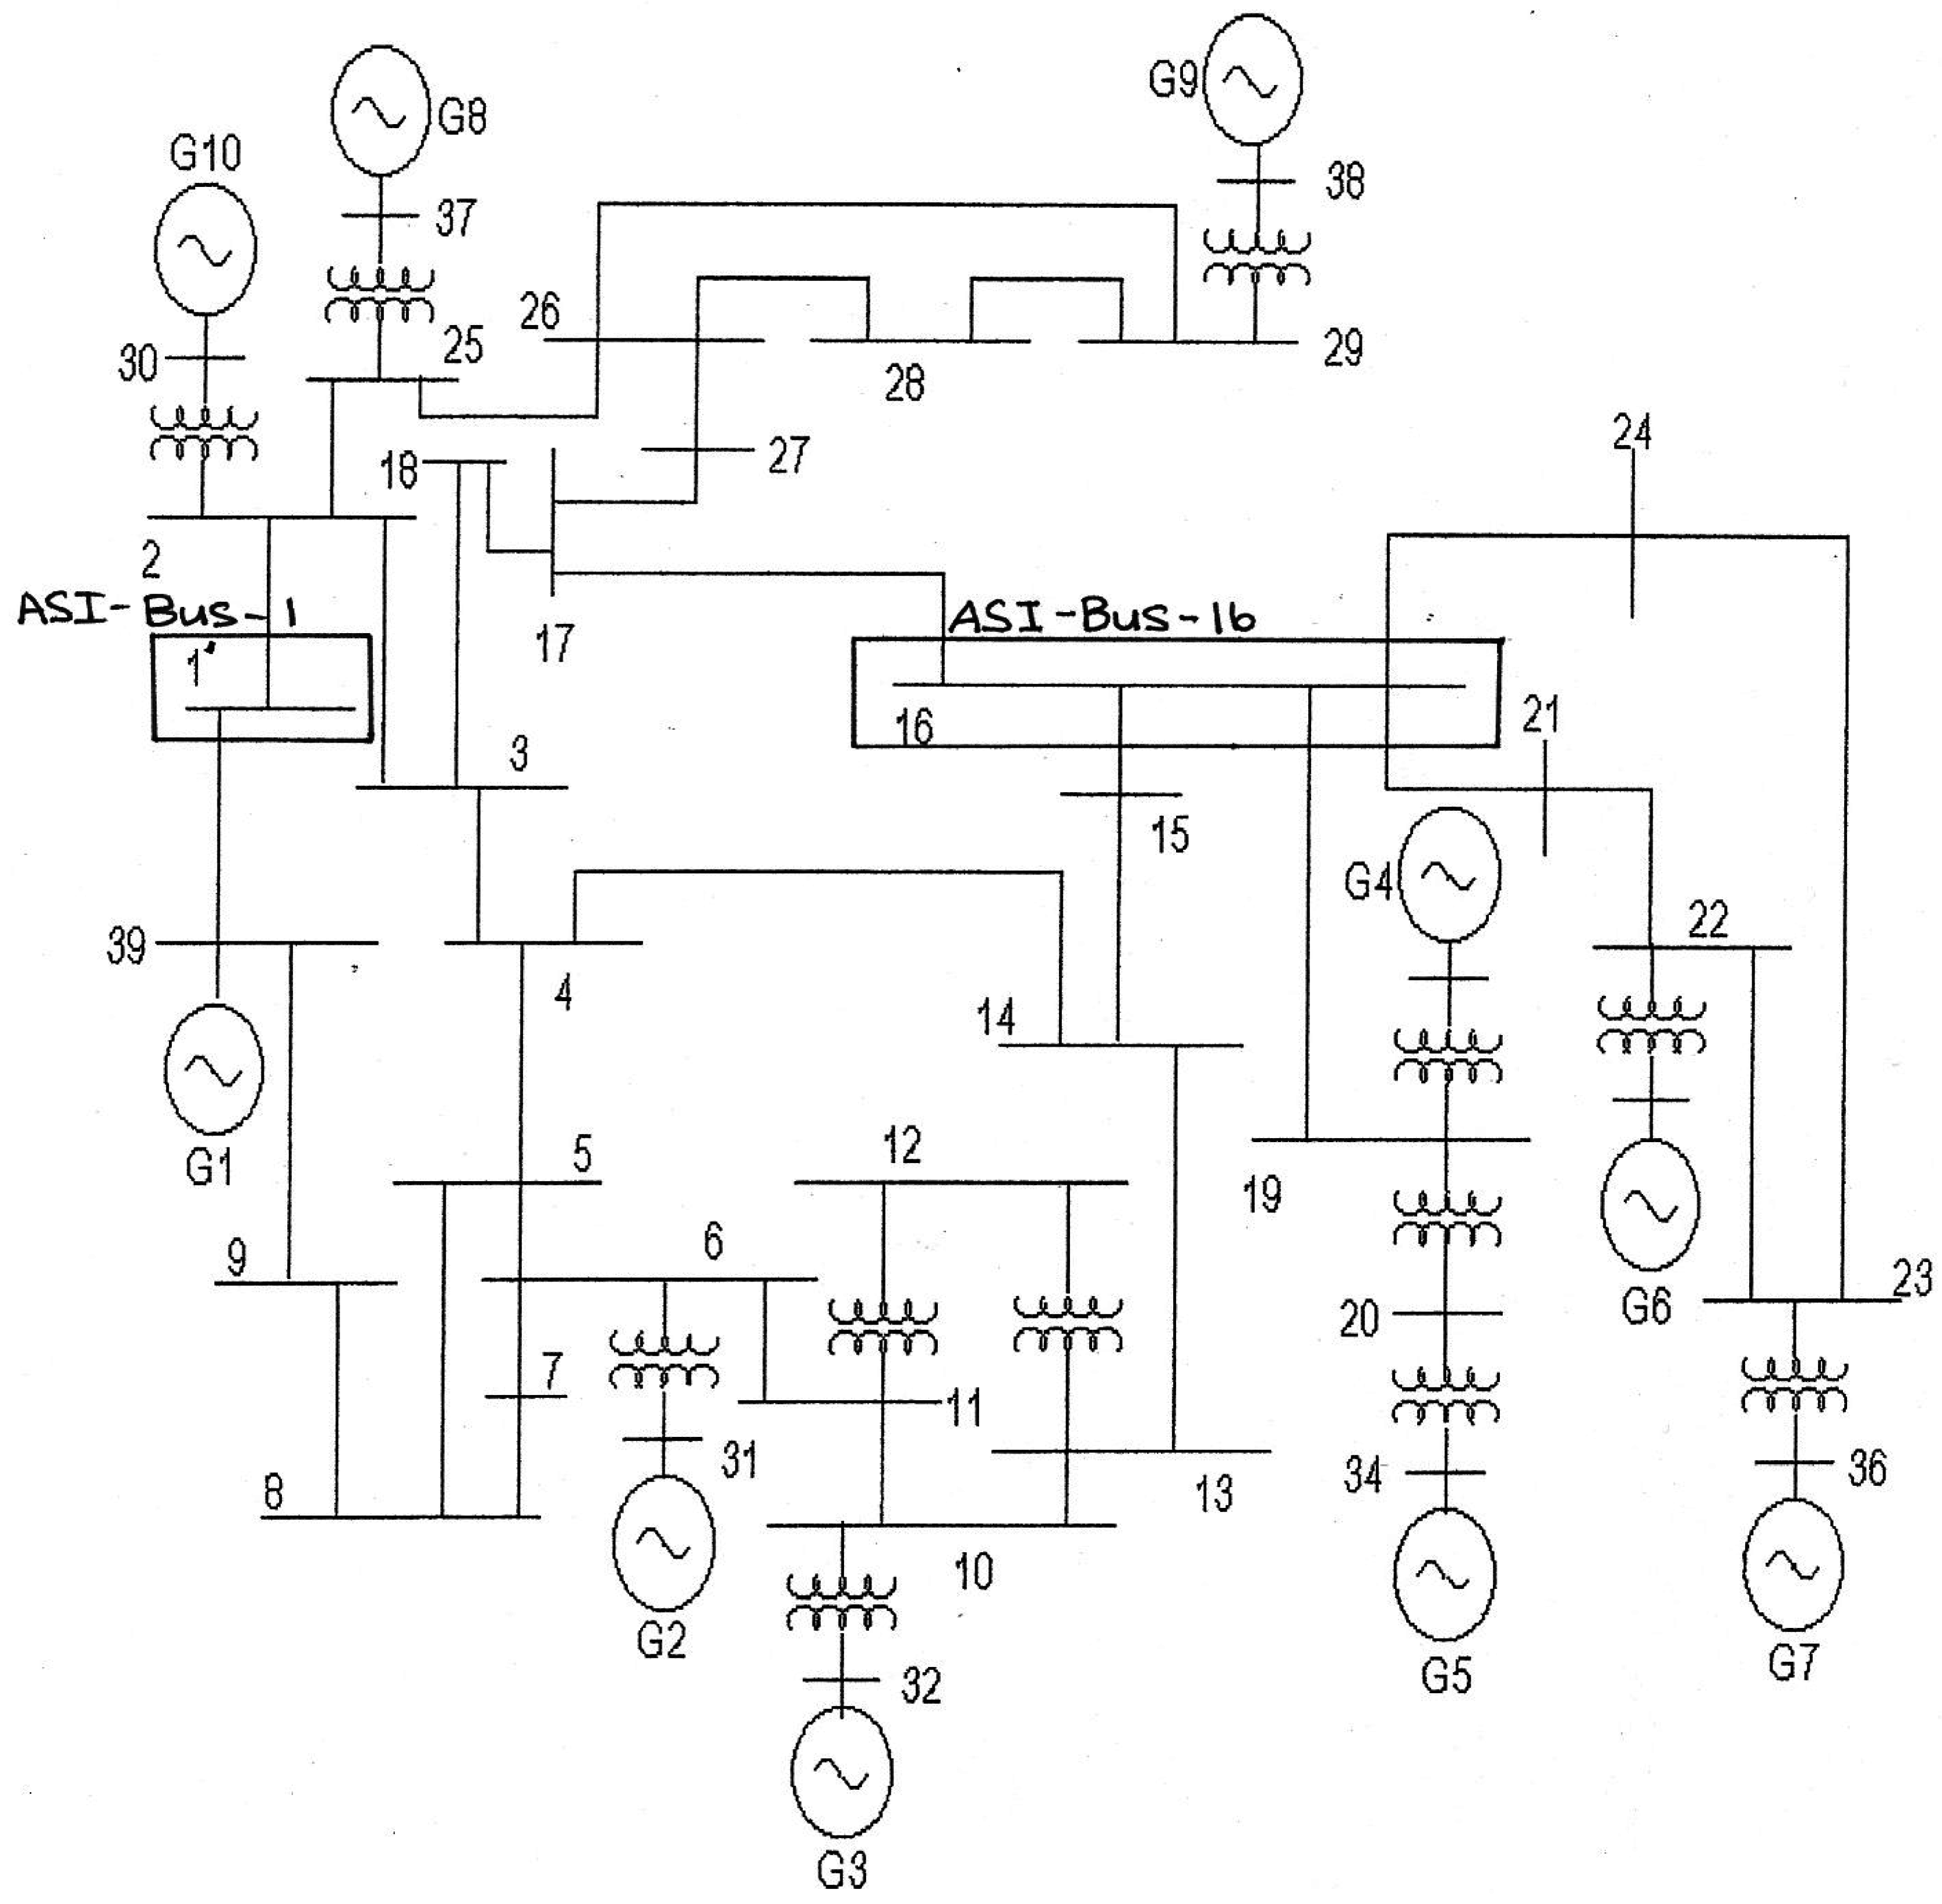
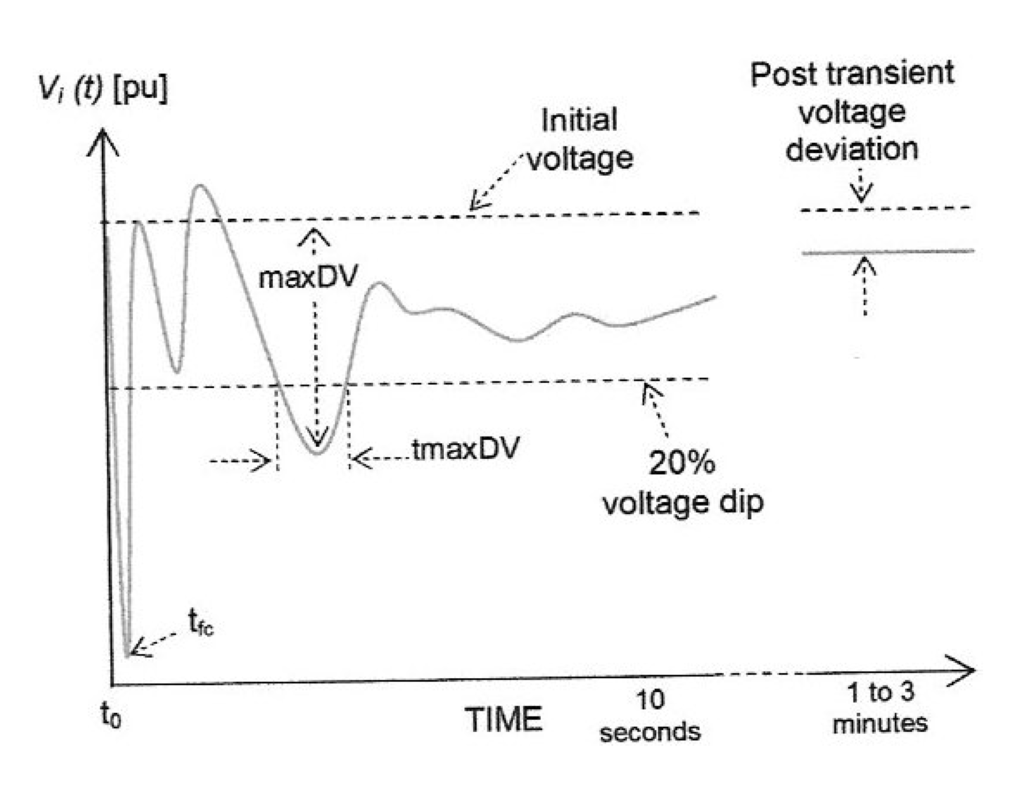
Figure 4.
WSCC transient voltage performance parameters [10] at bus i.
Figure 4.
WSCC transient voltage performance parameters [10] at bus i.
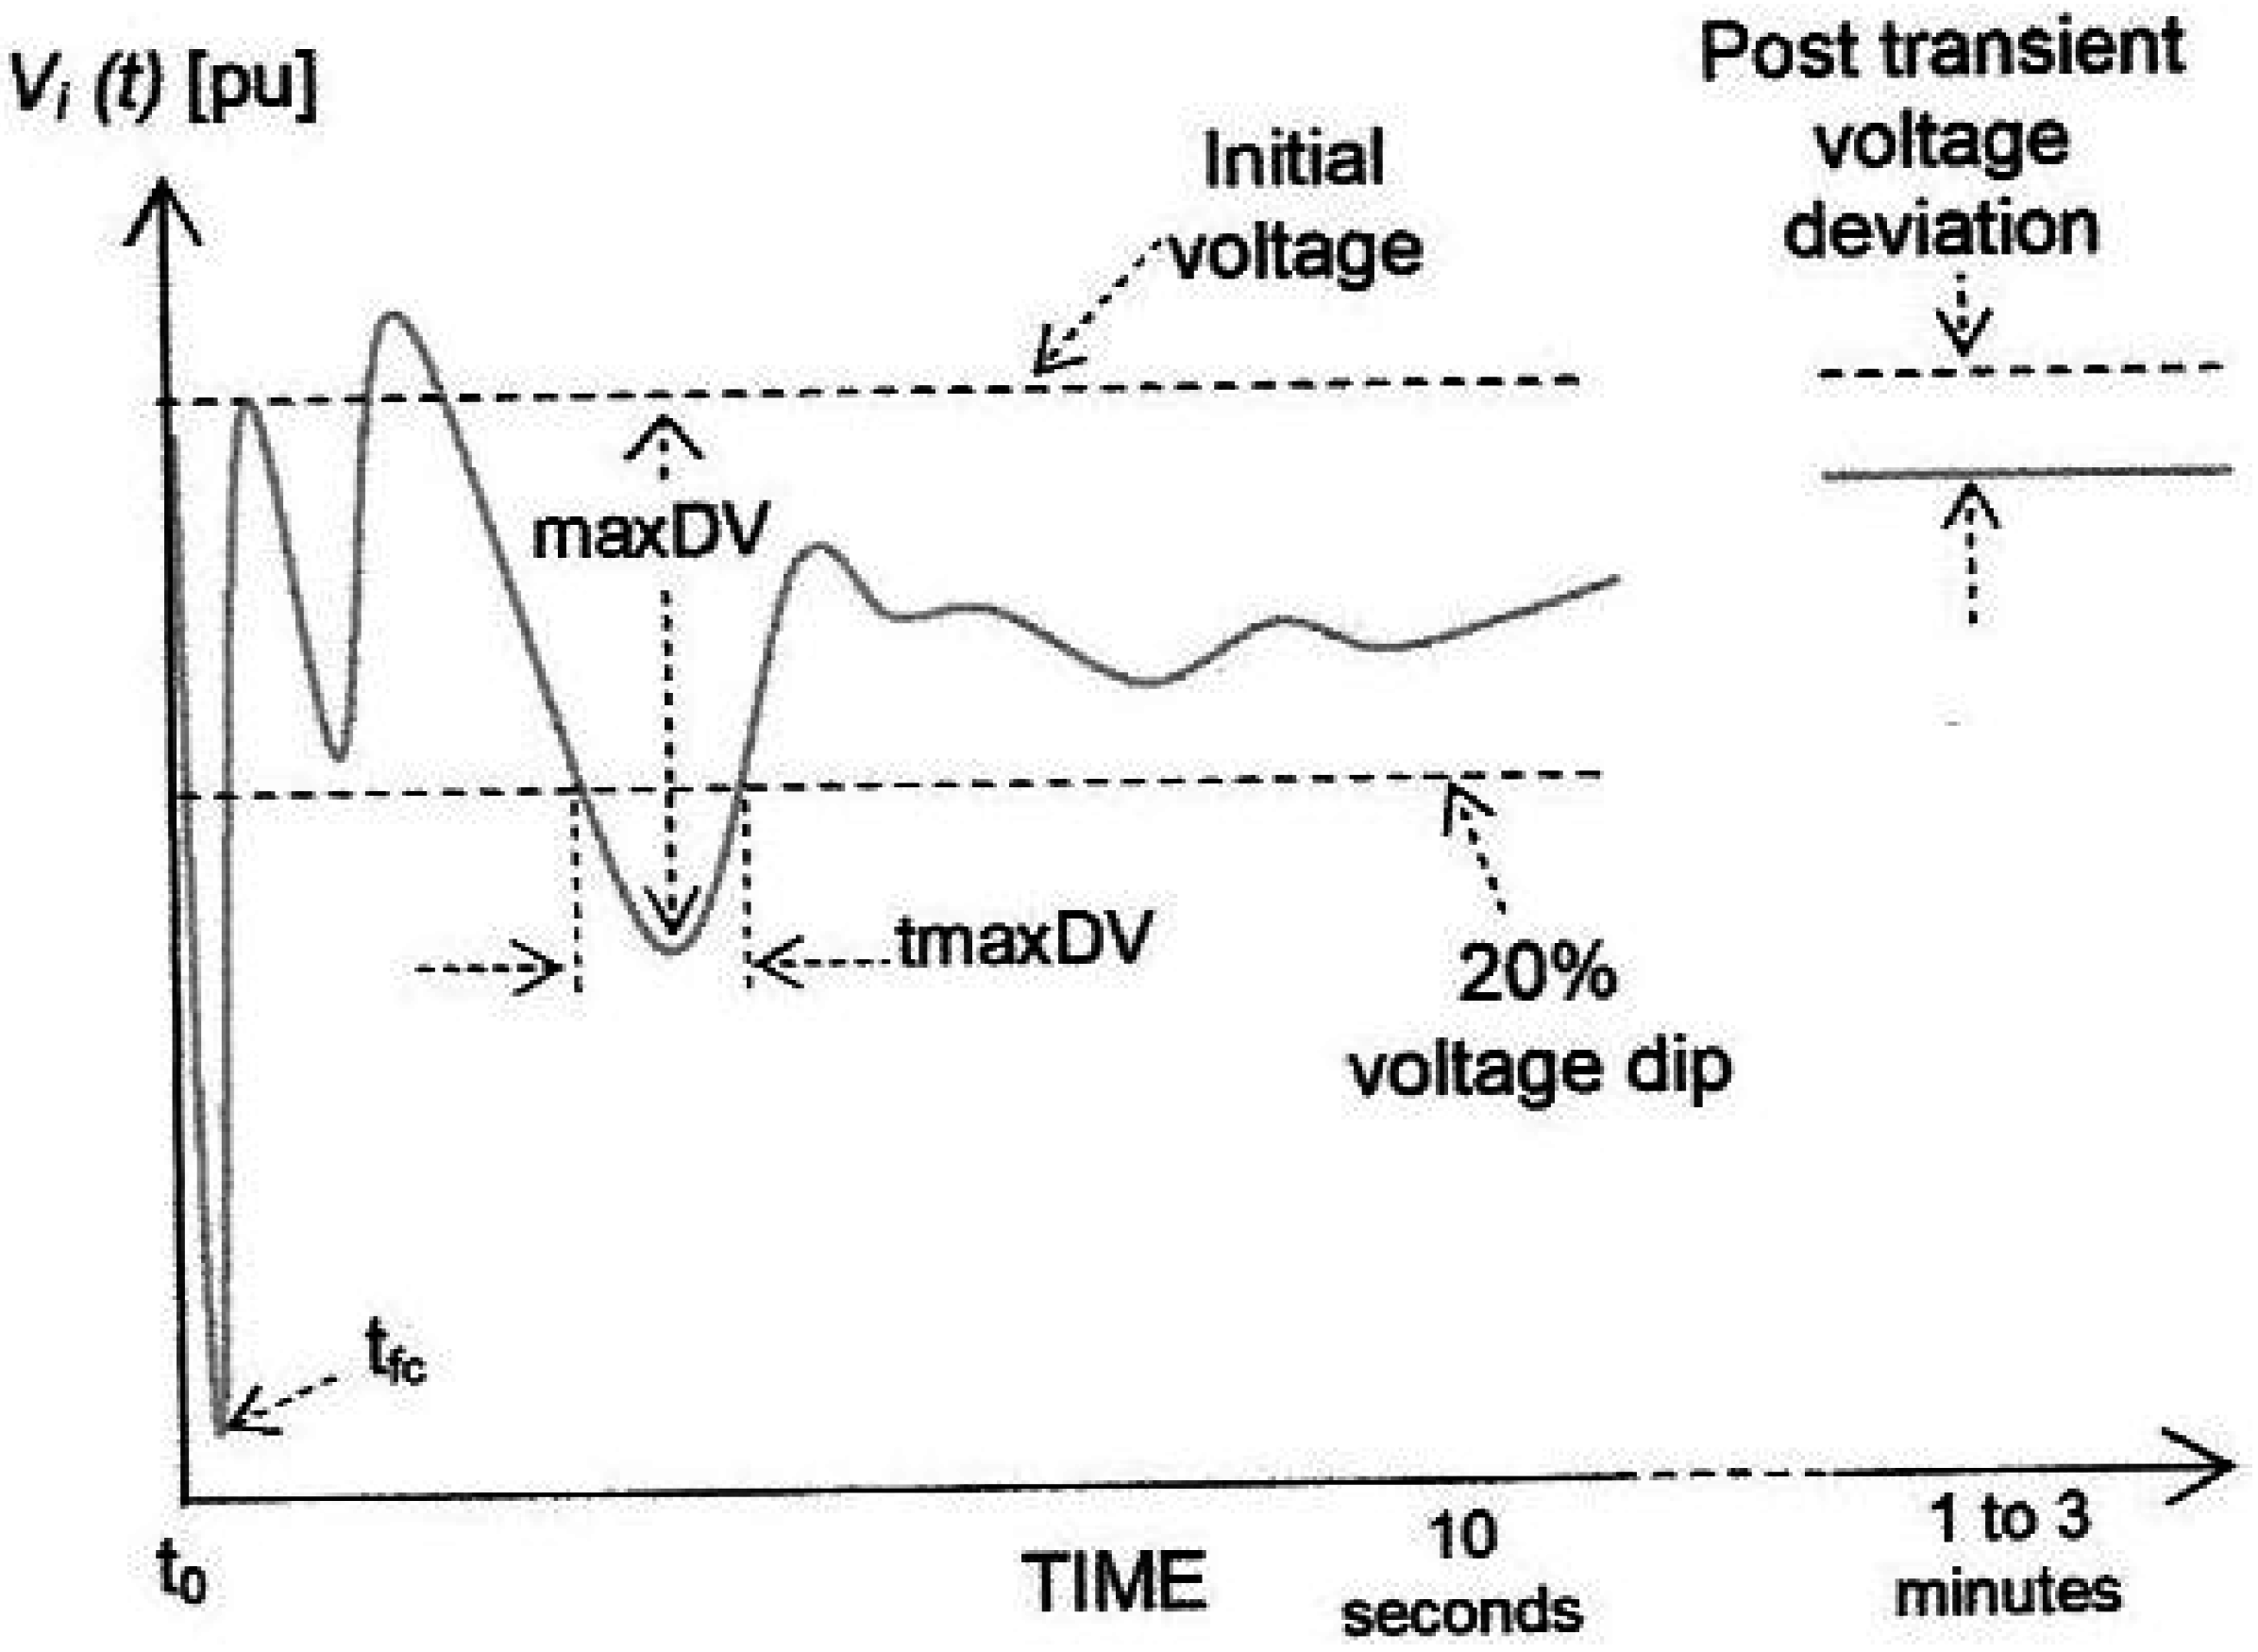
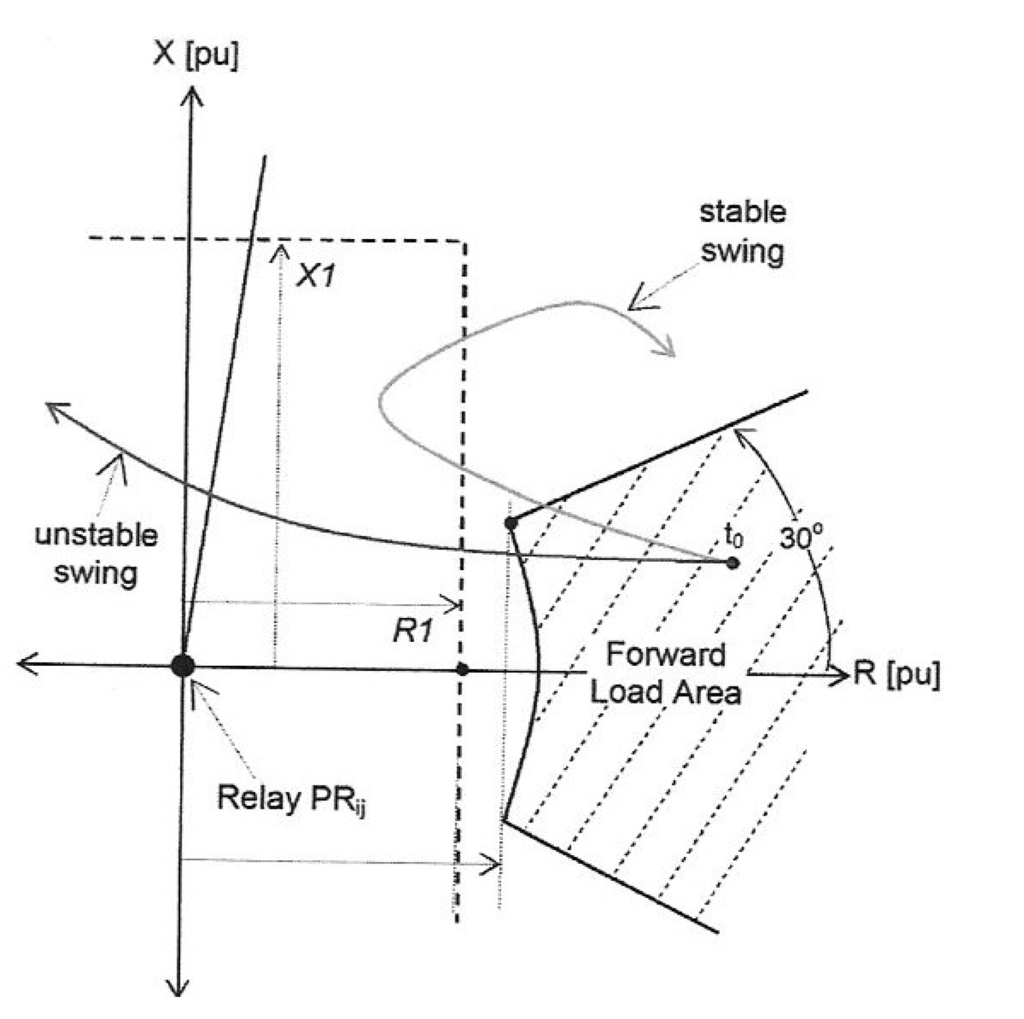
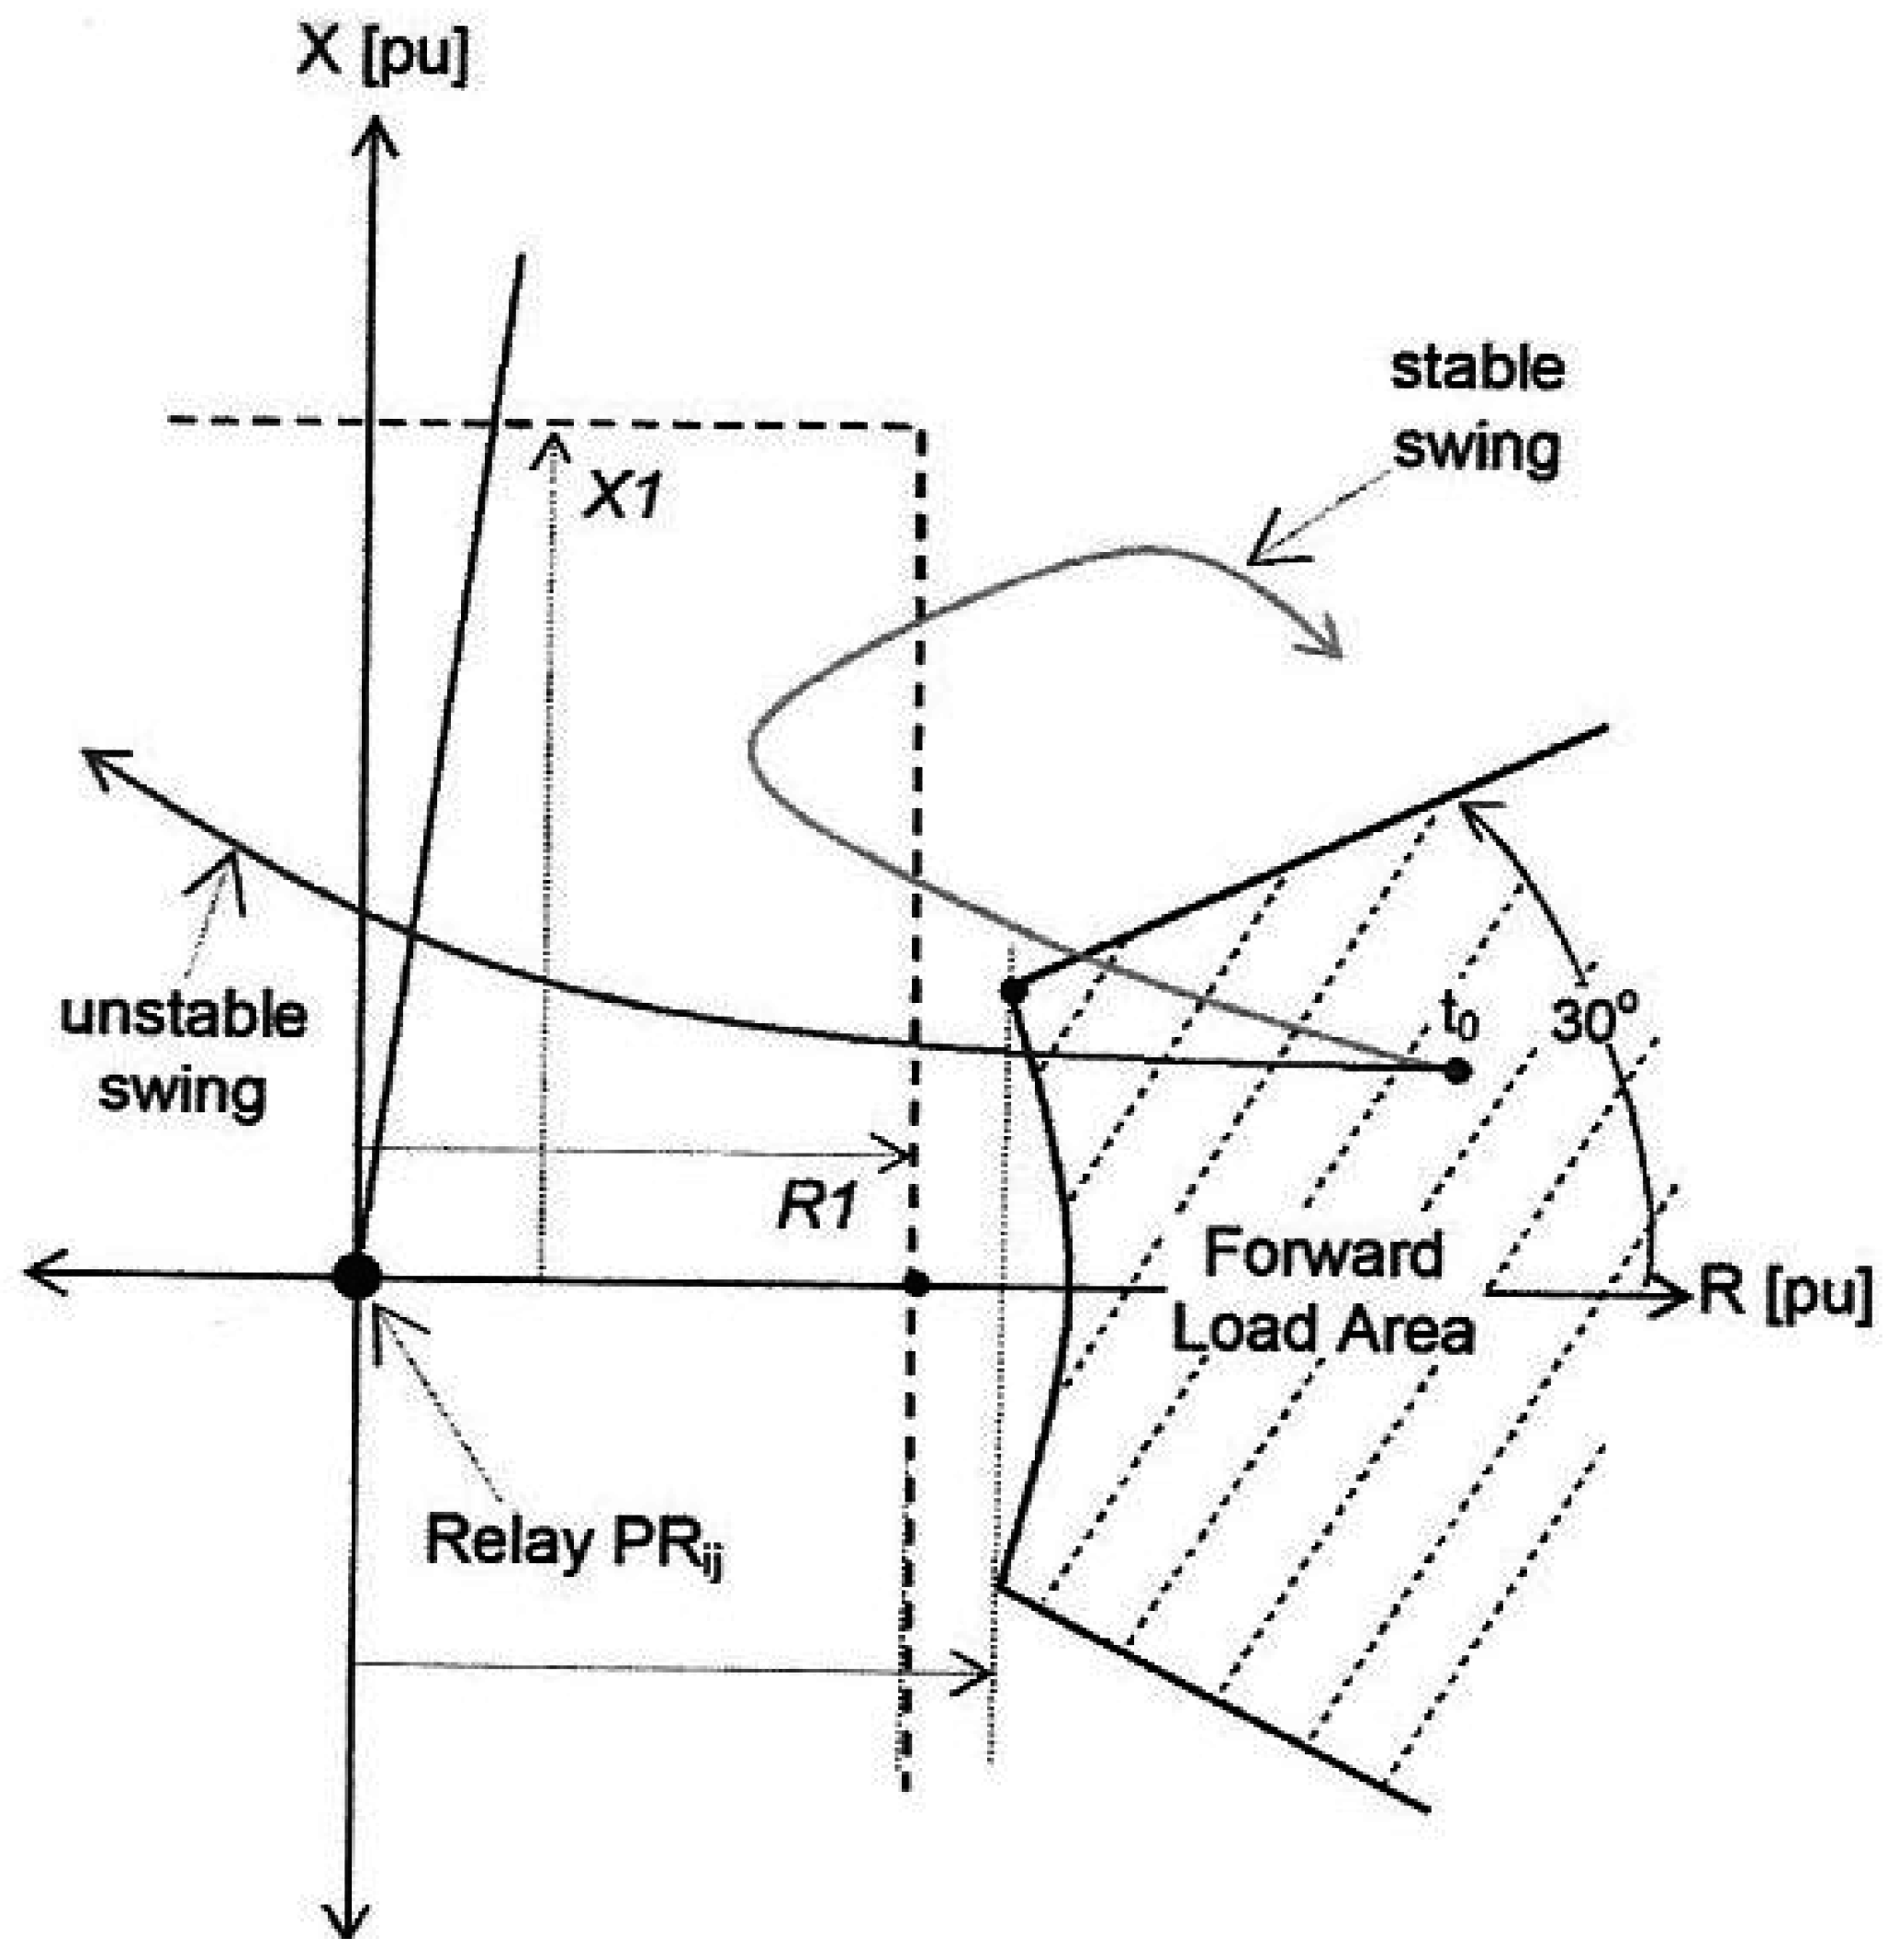
Figure 5.
Trajectory of the apparent impedance seen by the relay PRij of the ASI on bus i. Symbols are: R1 (resistance of zone-1 setting), X1 (reactance of zone-1 setting), and t0 (pre-disturbance state).
Figure 5.
Trajectory of the apparent impedance seen by the relay PRij of the ASI on bus i. Symbols are: R1 (resistance of zone-1 setting), X1 (reactance of zone-1 setting), and t0 (pre-disturbance state).
References and Notes
- Report of the Joint United-States – Canada Task Force on the August 14, 2003 blackout.
- Fink, H. L.; Carlson, K. Operating under Stress and Strain. IEEE Spectrum 1978, 48–53. [Google Scholar] [CrossRef]
- McGillis, D.; El-Arroudi, K.; Brearley, R.; Joos, G. The Process of System Collapse Based on Areas of Vulnerability. In IEEE – LESCOPE, Halifax, July 2006.
- Naggar, R.; Laurin, D.; McGillis, D. Transmission System Security Analysis for the Choice of Design Criteria. In Sixth CEPSI Conference, Jakarta, November 1986.
- McGillis, D.; El-Arroudi, K.; Brearley, R.; Joos, G. Areas of Vulnerability in an Environment of Uncertainty. In IEEE – CCECE, Vancouver, April 2007.
- The Equipment Reliability Information System Canadian Electricity Association “Forced – Outage Performance of Transmission Equipment for the Period of January 1, 1994 to December 31, 1998.
- Dupas, H.; McGillis, D. The Forced – Outage Unavailability of Large Static Compensators. In IEE Conference on AC and DC Transmission, London, September 1985.
- Baril, G. A.; McGillis, D.; Jolicoeur, A. Reliability Performance of 735 kV Power Transformers. In CIGRE Symposium, Montreal, November 1991.
- El-Arroudi, K.; Joos, G.; McGillis, D.; Brearley, R. Severity Index for Estimating the Impact of Wind Generation on System Vulnerability. In IEEE Power Engineering Society, Tampa Bay, June 2007.
- NERC/WECC Planning Standards. August 2002.
© 2009 by the authors; licensee Molecular Diversity Preservation International, Basel, Switzerland. This article is an open-access article distributed under the terms and conditions of the Creative Commons Attribution license (http://creativecommons.org/licenses/by/3.0/).