1. Introduction
Traffic sign recognition is an important component of intelligent transportation systems, advanced driver assistance systems, and autonomous driving pipelines [
1]. Traffic signs communicate speed limits, warnings, restrictions, and navigation rules; therefore, classification errors can affect safety-related downstream decisions. Although benchmark datasets have enabled substantial progress in traffic sign classification, real road conditions remain more variable than clean test images. Traffic signs may appear blurred, partially occluded, poorly illuminated, noisy, small, or captured from different viewpoints. A model that performs well on clean benchmark images may therefore still behave unreliably when visual conditions change. The German Traffic Sign Recognition Benchmark (GTSRB) [
2] is a widely used benchmark for traffic sign classification and contains traffic sign images from 43 semantic classes [
3]. In this study, GTSRB is used for model training, validation, clean testing, and controlled corruption testing. To examine external transfer, the German Traffic Sign Detection Benchmark (GTSDB) [
4] is used only for external evaluation after cropping annotated traffic sign regions and mapping compatible labels to the GTSRB class taxonomy. No GTSDB image is used for model training, validation, calibration, or hyperparameter selection. Recent traffic sign recognition studies have examined convolutional neural networks, residual networks, lightweight mobile models, attention mechanisms, transformer-based detectors, and model compression strategies. However, many comparisons still emphasize clean accuracy or accuracy–speed trade-offs. For safety-relevant visual recognition, this is incomplete. A practical model comparison should also consider training variability, paired statistical evidence, confidence calibration, degradation sensitivity, external transfer, computational cost, and visual diagnostic behavior. Therefore, this study presents a reliability-oriented comparative evaluation of five model configurations: BaselineCNN, ResNet18 [
5], MobileNetV2 [
6], MobileNetV2 enhanced with CBAM [
7], and knowledge-distilled MobileNetV2 [
8]. The objective is not to introduce a new neural network backbone, but to compare representative model families under the same preprocessing, splitting, training, and evaluation protocol. BaselineCNN provides a shallow reference classifier, ResNet18 represents residual feature learning, MobileNetV2 represents compact mobile classification, MobileNetV2 + CBAM examines attention-based feature refinement, and MobileNetV2-KD examines teacher–student compression using ResNet18 as the teacher.
1.1. Gap Analysis and Study Objective
Existing traffic sign classification studies often report strong clean-set performance, but clean accuracy alone does not establish whether a model is stable across training runs, calibrated in its confidence estimates, robust under visual degradation, transferable to an external dataset, computationally feasible, or diagnostically interpretable. The effects of attention and knowledge distillation are also difficult to isolate when model comparisons use different training protocols, data splits, preprocessing pipelines, or evaluation metrics. This motivates a controlled comparison in which all evaluated models are trained and tested under the same experimental conditions. In this study, reliability-oriented evaluation refers to the joint assessment of clean predictive performance, training stability, paired statistical evidence, probabilistic calibration [
9], robustness under controlled visual corruptions, external generalization, computational efficiency, and Grad-CAM-based diagnostic behavior. These dimensions are considered together because the model with the highest clean GTSRB accuracy may not necessarily be the most robust, best calibrated, fastest, most transferable, or most useful for diagnostic failure analysis.
1.2. Novelty and Contributions
The novelty of this study lies in the controlled, multi-dimensional evaluation protocol rather than in the proposal of a new neural network architecture. The main contributions are as follows:
A five-model comparison is conducted using a fixed stratified GTSRB partition and five independent random seeds, allowing clean performance and training stability to be reported separately.
Statistical and probabilistic reliability are assessed using bootstrap confidence intervals, McNemar paired tests, expected calibration error, negative log-likelihood, and Brier score.
Robustness is evaluated under three severity levels of blur, central occlusion, low-light, and Gaussian noise corruptions.
External generalization is evaluated using 360 cropped GTSDB signs mapped to compatible GTSRB labels, without using GTSDB for training or hyperparameter selection.
The effects of CBAM and knowledge distillation are examined under the same training and evaluation protocol as the standard MobileNetV2 model.
Computational efficiency is characterized through parameter count, model size, training time, inference latency, throughput, and peak memory usage.
Grad-CAM [
10] is used for diagnostic analysis of correct predictions, misclassifications, and high-confidence failure cases. Note that heatmap concentration is not necessarily a validated explanation-quality metric.
1.3. Research Questions
The study is guided by the following research questions:
How do BaselineCNN, ResNet18, MobileNetV2, MobileNetV2 + CBAM, and knowledge-distilled MobileNetV2 compare in clean GTSRB classification performance, and how stable are their results across independent training seeds?
How do the evaluated models compare in probabilistic calibration, including expected calibration error, maximum calibration error, negative log-likelihood, and Brier score?
How robust are the evaluated models under severity-wise blur, low-light, Gaussian noise, and occlusion corruptions, and how does targeted central occlusion differ from support-matched random occlusion?
What effects do CBAM and knowledge distillation have on clean performance, robustness, calibration, external generalization, computational efficiency, and visual-attention behavior relative to standard MobileNetV2?
How well do the evaluated models generalize from GTSRB to the class-compatible subset of GTSDB, considering class coverage, unequal support, and per-class performance?
What relationships exist between Grad-CAM center concentration, prediction confidence, and prediction correctness, and what limitations arise when concentration is used as a diagnostic explanation measure?
The remainder of the paper is organized as follows:
Section 2 reviews related work and positions the present study.
Section 3 describes the datasets, model architectures, training protocol, and evaluation metrics.
Section 4 reports the experimental results.
Section 5 discusses the findings, limitations, and practical implications.
Section 6 concludes the paper.
3. Methodology
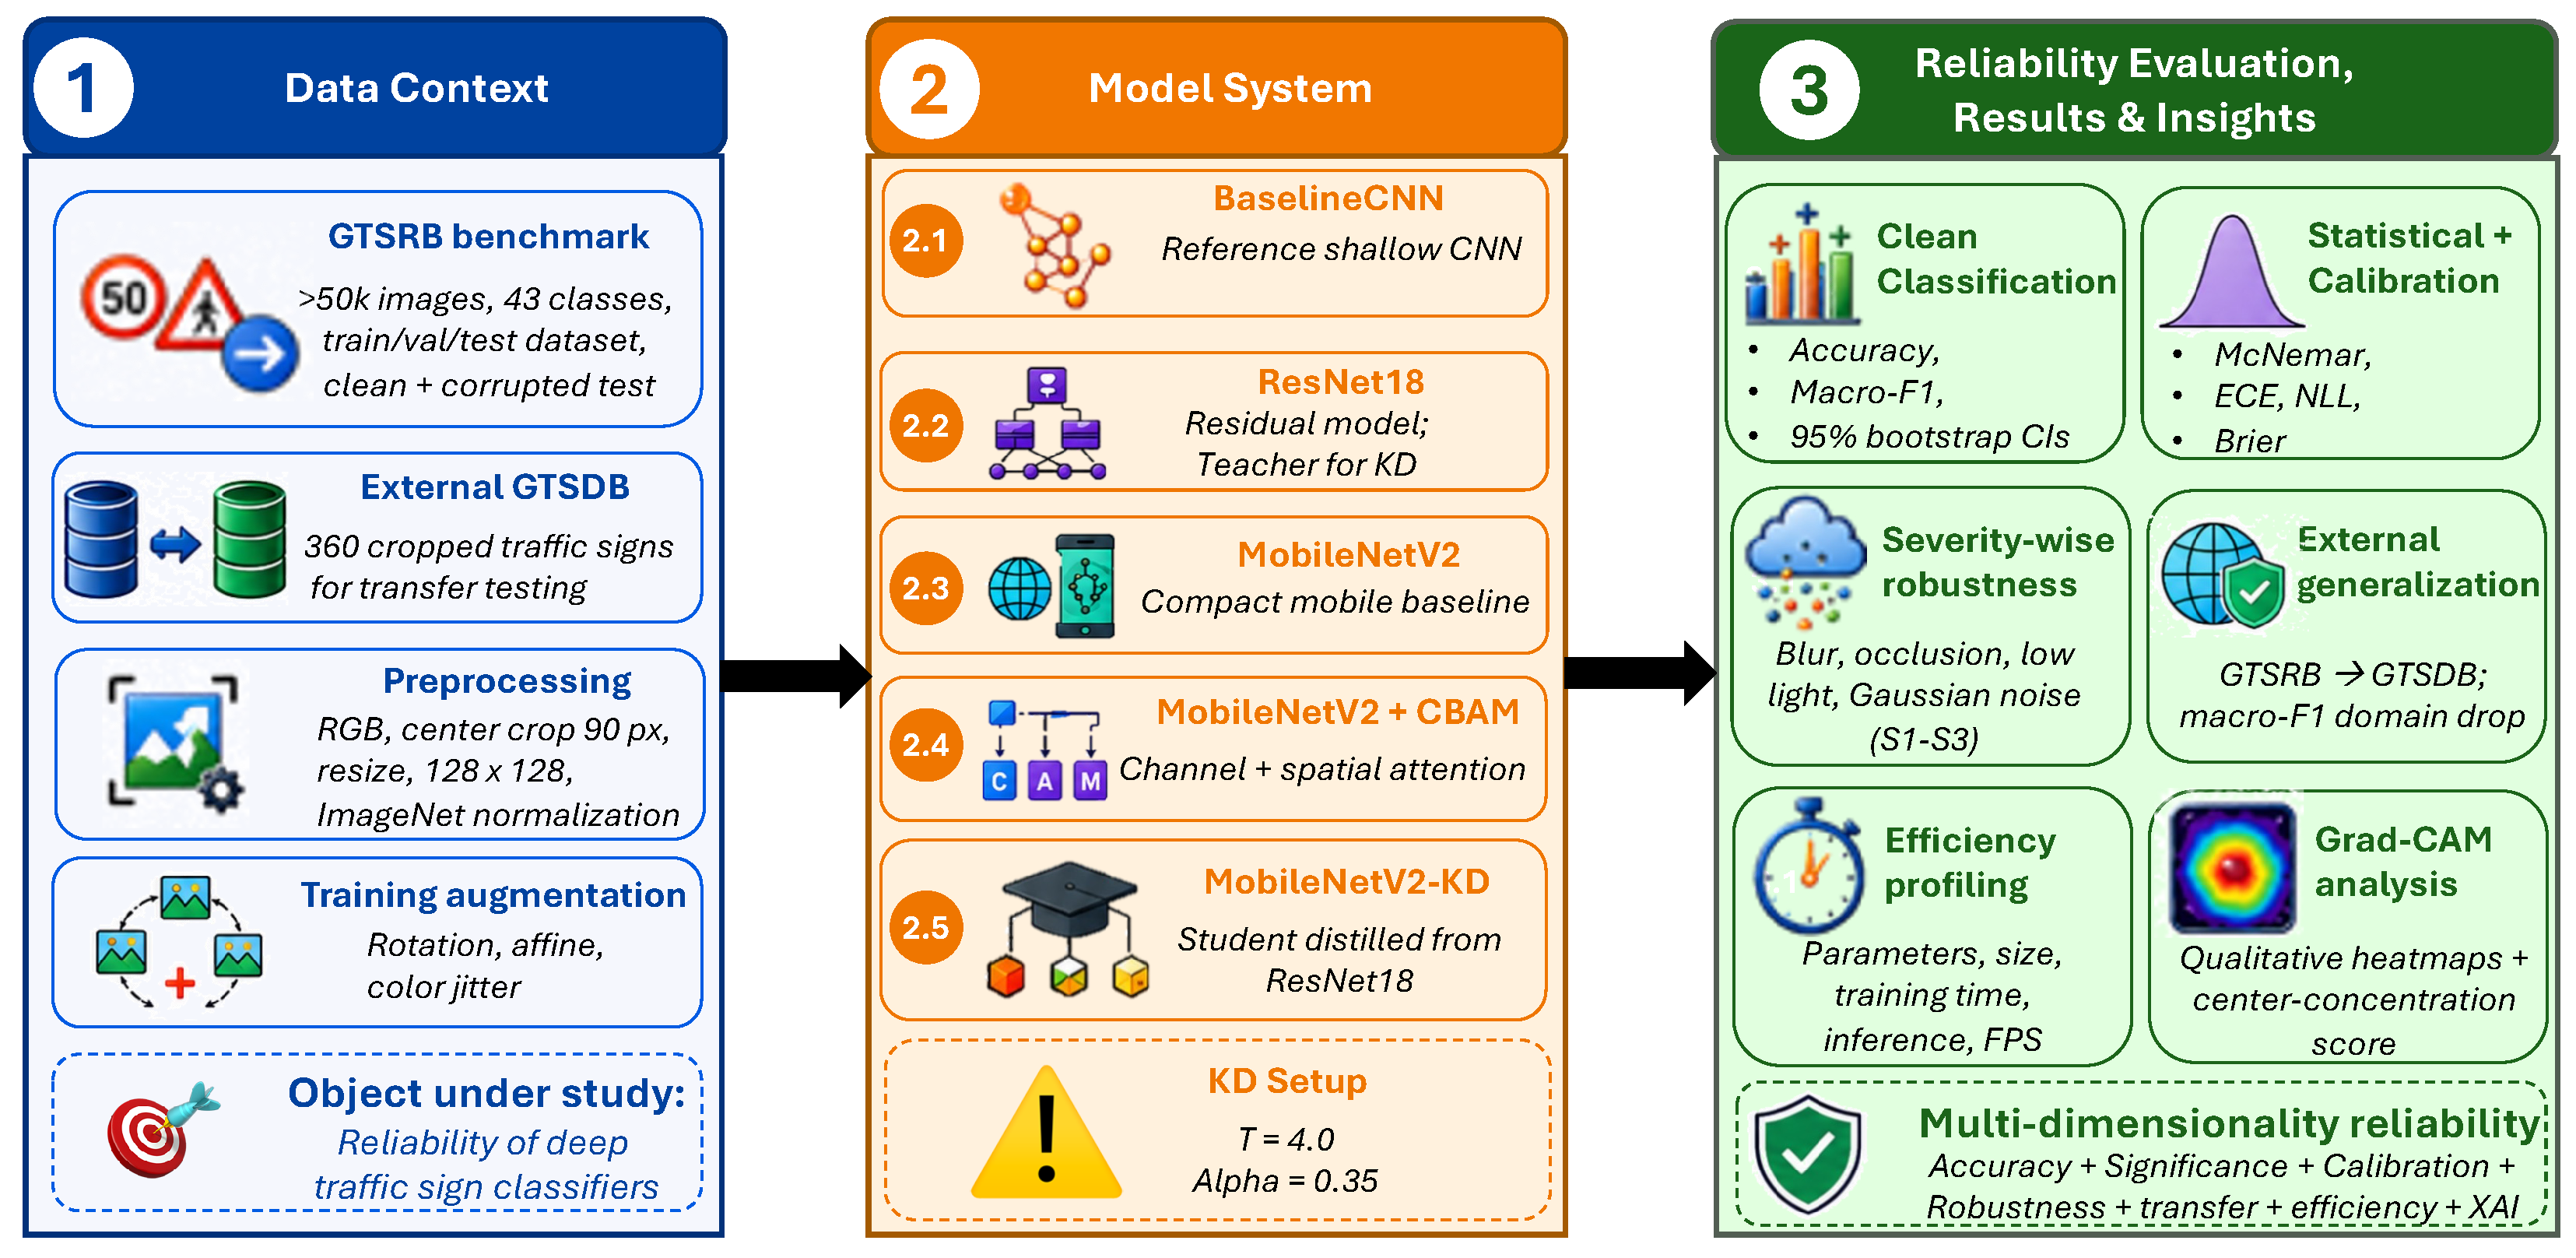
This study adopts a controlled reliability-oriented framework for comparing traffic sign classifiers across complementary evaluation dimensions. No new traffic sign dataset was created. GTSRB was used for model development, held-out clean testing, and controlled corruption testing, while cropped and label-compatible GTSDB signs were used only for external validation. All model configurations used the same preprocessing, augmentation, optimizer, learning rate, batch size, and early-stopping protocol. The train, validation, and test partition was fixed once and reused across all models. Training was repeated with five random seeds: 42, 123, 777, 2024, and 3407. Seed 42 was used only for representative qualitative figures and diagnostic examples; the main quantitative conclusions are based on five-seed summaries unless explicitly stated otherwise. The overall workflow is shown in
Figure 1.
3.1. Datasets and Experimental Design
The main experiments were conducted using the German Traffic Sign Recognition Benchmark (GTSRB), which contains traffic sign images from 43 classes. GTSRB was used for training, validation, clean testing, and corruption testing. To evaluate external generalization, cropped traffic sign samples from the German Traffic Sign Detection Benchmark (GTSDB) were used as an external test set. As GTSDB is originally structured for detection, annotated traffic sign regions were cropped and mapped to compatible GTSRB class labels. This external set contained 360 cropped signs covering 38 of the 43 GTSRB classes. No GTSDB samples were used during training, validation, calibration, or hyperparameter selection. The data partition was generated once and reused across all model configurations and seed-specific training runs. Bootstrap confidence intervals were computed by resampling the held-out test predictions and therefore estimate test sample uncertainty for a given checkpoint. Training variability is reported separately using the mean and sample standard deviation across the five independent seeds.
3.2. Reproducibility and Multi-Seed Training Protocol
To quantify variability caused by model initialization, minibatch ordering, augmentation randomness, and stochastic optimization, every principal architecture was trained independently using five predetermined random seeds: 42, 123, 777, 2024, and 3407. The same stratified data split was reused across all runs. For each model and seed, clean classification metrics, calibration metrics, corruption robustness results, external GTSDB performance, and efficiency measurements were saved. Seed 42 was retained for representative visualizations such as confusion matrices, reliability diagrams, Grad-CAM panels, and qualitative failure cases. These representative figures are not used as substitutes for the five-seed quantitative analysis. To support reproducibility, the complete experimental implementation is publicly available at
https://github.com/KlausCaka1/MDPI-Traffic-Sign (accessed on 2 July 2026). The repository contains the five seed-specific notebooks used for the independent training runs, together with execution instructions, dependency information, citation metadata, and licensing information.
3.3. Model Architectures
Table 2 displays the five model configurations evaluated in this study: BaselineCNN, ResNet18, MobileNetV2, MobileNetV2 + CBAM, and MobileNetV2-KD. These configurations were selected to represent a shallow reference model, residual learning, compact mobile classification, attention-enhanced mobile classification, and teacher–student compact model learning. Other architectures such as VGG-16, LeNet-5, TrafficSignNet, EfficientNetB7, and YOLO-family detectors were not included in the main comparison because the purpose of this study was to compare representative classification models under a controlled reliability protocol rather than to exhaust all possible traffic sign architectures. YOLO-family methods are primarily detection models and require a different scene-level detection and classification protocol.
3.4. Statistical Significance Testing
McNemar paired tests were used to compare two classifiers on the same held-out GTSRB test images. For each model pair, every test image was assigned to one of four outcomes: both models correct, both models incorrect, the first model correct and the second model incorrect, or the first model incorrect and the second model correct. The test uses only the two discordant counts because these represent images on which the paired classifiers disagree. In this study, n01 denotes the number of test images misclassified by the first model but correctly classified by the second model, while n10 denotes the reverse case. The null hypothesis is that the two models have equal probability of being correct on the paired test instances. McNemar testing was therefore used to determine whether observed performance differences reflected systematic paired-prediction differences rather than small numerical variation.
3.5. Calibration Analysis
The reliability of predicted probabilities was evaluated using expected calibration error (ECE), negative log-likelihood (NLL), and Brier score on the clean GTSRB test set. ECE measures the gap between predicted confidence and empirical accuracy across confidence bins. NLL evaluates the quality of the full predicted probability distribution assigned to the true class, while the Brier score measures the squared error between predicted probabilities and one-hot class labels. Lower values indicate better probabilistic calibration. Calibration is important because a traffic sign classifier should not only predict the correct class but also provide confidence estimates that are consistent with its empirical correctness.
3.6. Robustness Evaluation Under Visual Degradations
Robustness was evaluated by applying controlled synthetic corruptions to the GTSRB test images. Four corruption types were considered: Gaussian blur, central occlusion, low-light, and Gaussian noise. Each corruption was evaluated at three severity levels. Central occlusion was designed as a targeted stress test because the central region of a traffic sign often contains the discriminative symbol, digit, or directional arrow. Therefore, central occlusion should be interpreted as a worst-case corruption rather than as an unbiased estimate of average real-world obstruction. Macro-F1 was used as the main robustness indicator because it is more sensitive to class imbalance than accuracy. This protocol allows degradation sensitivity to be compared across shallow, residual, lightweight, attention-enhanced, and knowledge-distilled classifiers under the same controlled corruption settings.
3.7. Computational Efficiency Assessment
Computational efficiency was evaluated in the same execution environment for all models. The reported measures include parameter count, serialized model size, number of training epochs, total training time, mean inference time per image, frames per second, and peak GPU memory usage. Inference latency was measured with models in evaluation mode and gradient computation disabled. These measurements provide an implementation-specific comparison under the reported software and hardware environment; they should not be interpreted as hardware-independent deployment latency.
3.8. Evaluation Metrics
The evaluation framework was designed to assess not only clean classification performance but also training stability, predictive uncertainty, statistical significance, calibration, robustness, external generalization, computational efficiency, and visual interpretability.
Table 3 summarizes these evaluation dimensions, together with the corresponding datasets or experimental settings and the metrics reported for each analysis.
3.9. Training Configuration
All models were trained in the Kaggle notebook environment using PyTorch 2.10.0 with GPU acceleration. The main models were trained for a maximum of 25 epochs with early stopping patience of 4 epochs based on validation performance. The knowledge-distilled MobileNetV2 was trained for a maximum of 15 epochs with a patience of 4 epochs. The no-augmentation ablation models were trained for a maximum of 12 epochs with patience of 3 epochs. Adam was used as the optimizer with a learning rate of
and weight decay of
. The batch size was set to 64, and mixed-precision training was used to reduce training time and memory usage. Pretrained ImageNet weights were not used so that all architectures were evaluated under the same training-from-scratch setting.
Table 4 displays the training configurations used in this study.
4. Results
Unless explicitly identified as a representative qualitative analysis, the principal quantitative results are reported as mean ± sample standard deviation over five independent training seeds. Seed 42 is used for detailed confusion matrices, reliability diagrams, Grad-CAM panels, and illustrative failure cases. Bootstrap confidence intervals quantify held-out test sample uncertainty for the representative checkpoint, whereas variability across the five training runs is reported separately and is used as the primary measure of training stability.
4.1. Clean GTSRB Classification Performance and Statistical Reliability
Table 5 reports clean GTSRB classification performance as mean ± sample standard deviation over five independent training seeds. ResNet18 achieved the strongest mean clean performance, with an accuracy of 0.9856 ± 0.0093 and macro-F1 of 0.9817 ± 0.0134. MobileNetV2 was slightly lower but more stable, reaching 0.9813 ± 0.0057 accuracy and 0.9773 ± 0.0069 macro-F1. MobileNetV2 + CBAM and MobileNetV2-KD did not provide consistent mean improvements over standard MobileNetV2 across the five runs, although all four advanced models substantially outperformed BaselineCNN. BaselineCNN achieved 0.8459 ± 0.0165 accuracy and 0.8384 ± 0.0189 macro-F1, confirming that the shallow reference model was insufficient for fine-grained GTSRB classification.
Table 6 reports representative paired McNemar tests on the Seed-42 clean GTSRB predictions. These tests compare models on exactly the same test images and therefore evaluate whether the observed paired disagreement pattern is statistically meaningful. The BaselineCNN was significantly different from all stronger architectures, confirming that its lower clean performance is not a small numerical fluctuation. Differences among the stronger architectures were smaller and should be interpreted together with the five-seed mean and standard-deviation results.
These results refine the clean-performance interpretation. Rather than simply stating that a deeper model performs best, the evidence shows that ResNet18 and MobileNetV2 + CBAM form the strongest clean performance group, that standard MobileNetV2 remains a competitive compact model, and that statistical testing is required before interpreting small numerical differences as meaningful.
4.2. Calibration Reliability and Confidence Quality
To evaluate whether the models are not only accurate but also reliable in their confidence estimates, calibration metrics were computed on the clean GTSRB test set.
Table 7 reports expected calibration error (ECE), negative log-likelihood (NLL), and Brier score. Lower values indicate better probabilistic reliability.
The calibration results show that ResNet18 and MobileNetV2 + CBAM are not only highly accurate but also well calibrated. ResNet18 achieved the lowest ECE of 0.0017, while MobileNetV2 + CBAM achieved the lowest Brier score of 0.0079. BaselineCNN had the weakest calibration behavior, with an ECE of 0.0852 and Brier score of 0.2453. The knowledge-distilled MobileNetV2 did not improve calibration compared with standard MobileNetV2 in this run, suggesting that distillation should not be assumed to automatically improve confidence reliability.
4.3. Severity-Wise Robustness Under Visual Degradations
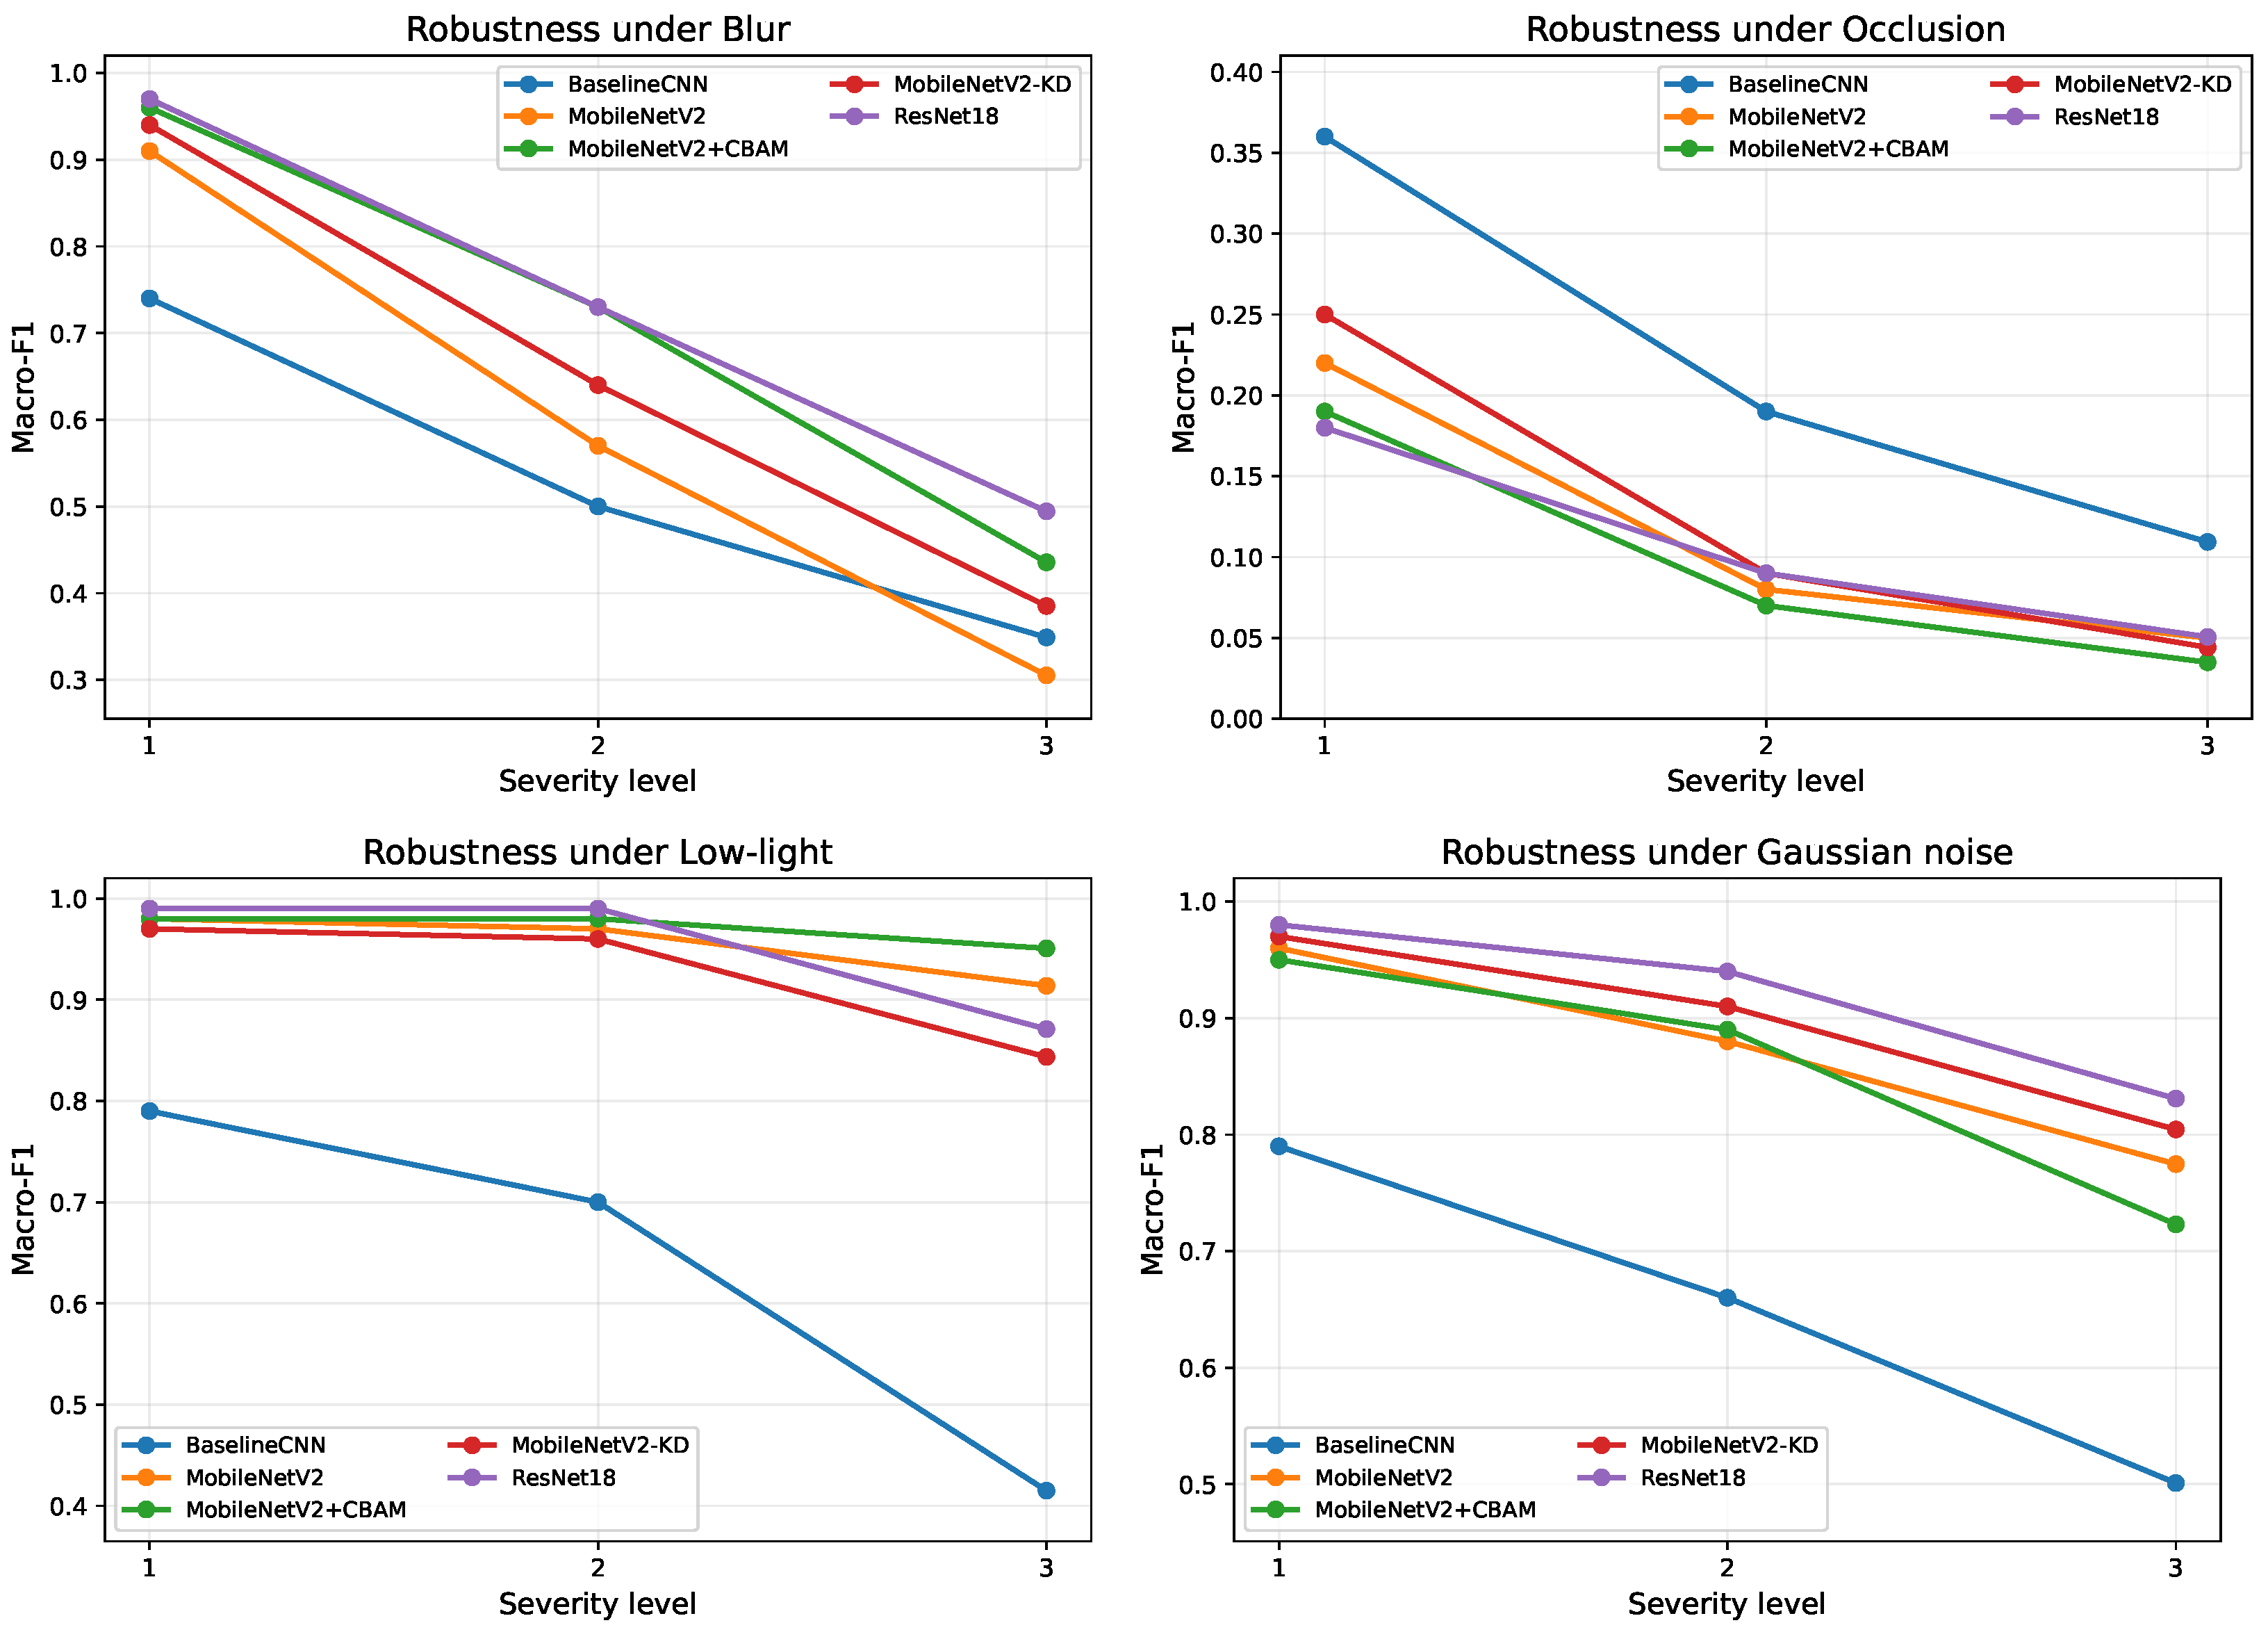
The robustness analysis evaluates model behavior under four controlled degradation types: blur, occlusion, low-light, and Gaussian noise. Each degradation was applied at three severity levels, and macro-F1 was used as the main robustness indicator because it is more sensitive to class imbalance than accuracy. The full severity-wise robustness curves are shown in
Figure 2.
Table 8 summarizes the macro-F1 scores at the most severe corruption level.
The results show that occlusion is the most damaging degradation for all models. At severity level 3, all macro-F1 scores fall below 0.11, and the advanced architectures do not maintain their clean-set advantage. This finding indicates that partial information loss remains a critical weakness for traffic sign classification and cannot be solved by clean-set training alone. Blur also causes substantial degradation, although ResNet18 remains the most robust model under severe blur with a macro-F1 of 0.4944. Low-light is comparatively less harmful for the stronger architectures, with MobileNetV2 + CBAM maintaining the highest macro-F1 of 0.9507 at severity level 3. Gaussian noise produces an intermediate robustness challenge, where ResNet18 and MobileNetV2-KD retain the strongest performance.
These results provide a more detailed interpretation than the earlier single-level robustness analysis. The practical implication is that robustness strategies should be degradation-specific: occlusion requires stronger occlusion-aware training or detection-before-classification strategies, blur requires blur augmentation or restoration-based preprocessing, low-light degradation can be mitigated through brightness and contrast augmentation, and Gaussian noise can be addressed through noise augmentation or denoising mechanisms.
4.4. Effect of CBAM and Knowledge Distillation
The five-seed results indicate that CBAM and knowledge distillation should be interpreted as condition-dependent modifications rather than uniformly superior enhancements. Across the five principal runs, MobileNetV2 + CBAM did not improve mean clean macro-F1 over standard MobileNetV2. However, the no-augmentation ablation in
Table 9 shows whether CBAM changes performance when augmentation is removed from the comparison. Knowledge-distilled MobileNetV2 remained compact and training efficient, but it did not consistently outperform standard MobileNetV2 across clean performance, calibration, external transfer, and Grad-CAM diagnostics.
To separate the effect of CBAM from data augmentation, an additional no-augmentation ablation was conducted. As shown in
Table 9, CBAM improved no-augmentation MobileNetV2 clean accuracy from 0.9561 to 0.9712 and macro-F1 from 0.9369 to 0.9584. Under severity-2 blur, CBAM also improved macro-F1 from 0.6267 to 0.7038. However, under low-light severity 2, the CBAM variant slightly decreased macro-F1 from 0.9181 to 0.9052, and under occlusion severity 2 both variants remained weak.
These ablation results directly clarify the role of CBAM. CBAM improves clean classification and blur robustness in this setting, provides only marginal benefit under occlusion, and does not consistently improve low-light robustness. Therefore, CBAM should be interpreted as a selective feature-refinement mechanism rather than as a universal robustness solution. Knowledge distillation also provides compact model enhancement, but the results show that the distilled MobileNetV2 does not consistently outperform standard MobileNetV2 or MobileNetV2 + CBAM across all criteria.
4.5. External Generalization on GTSDB
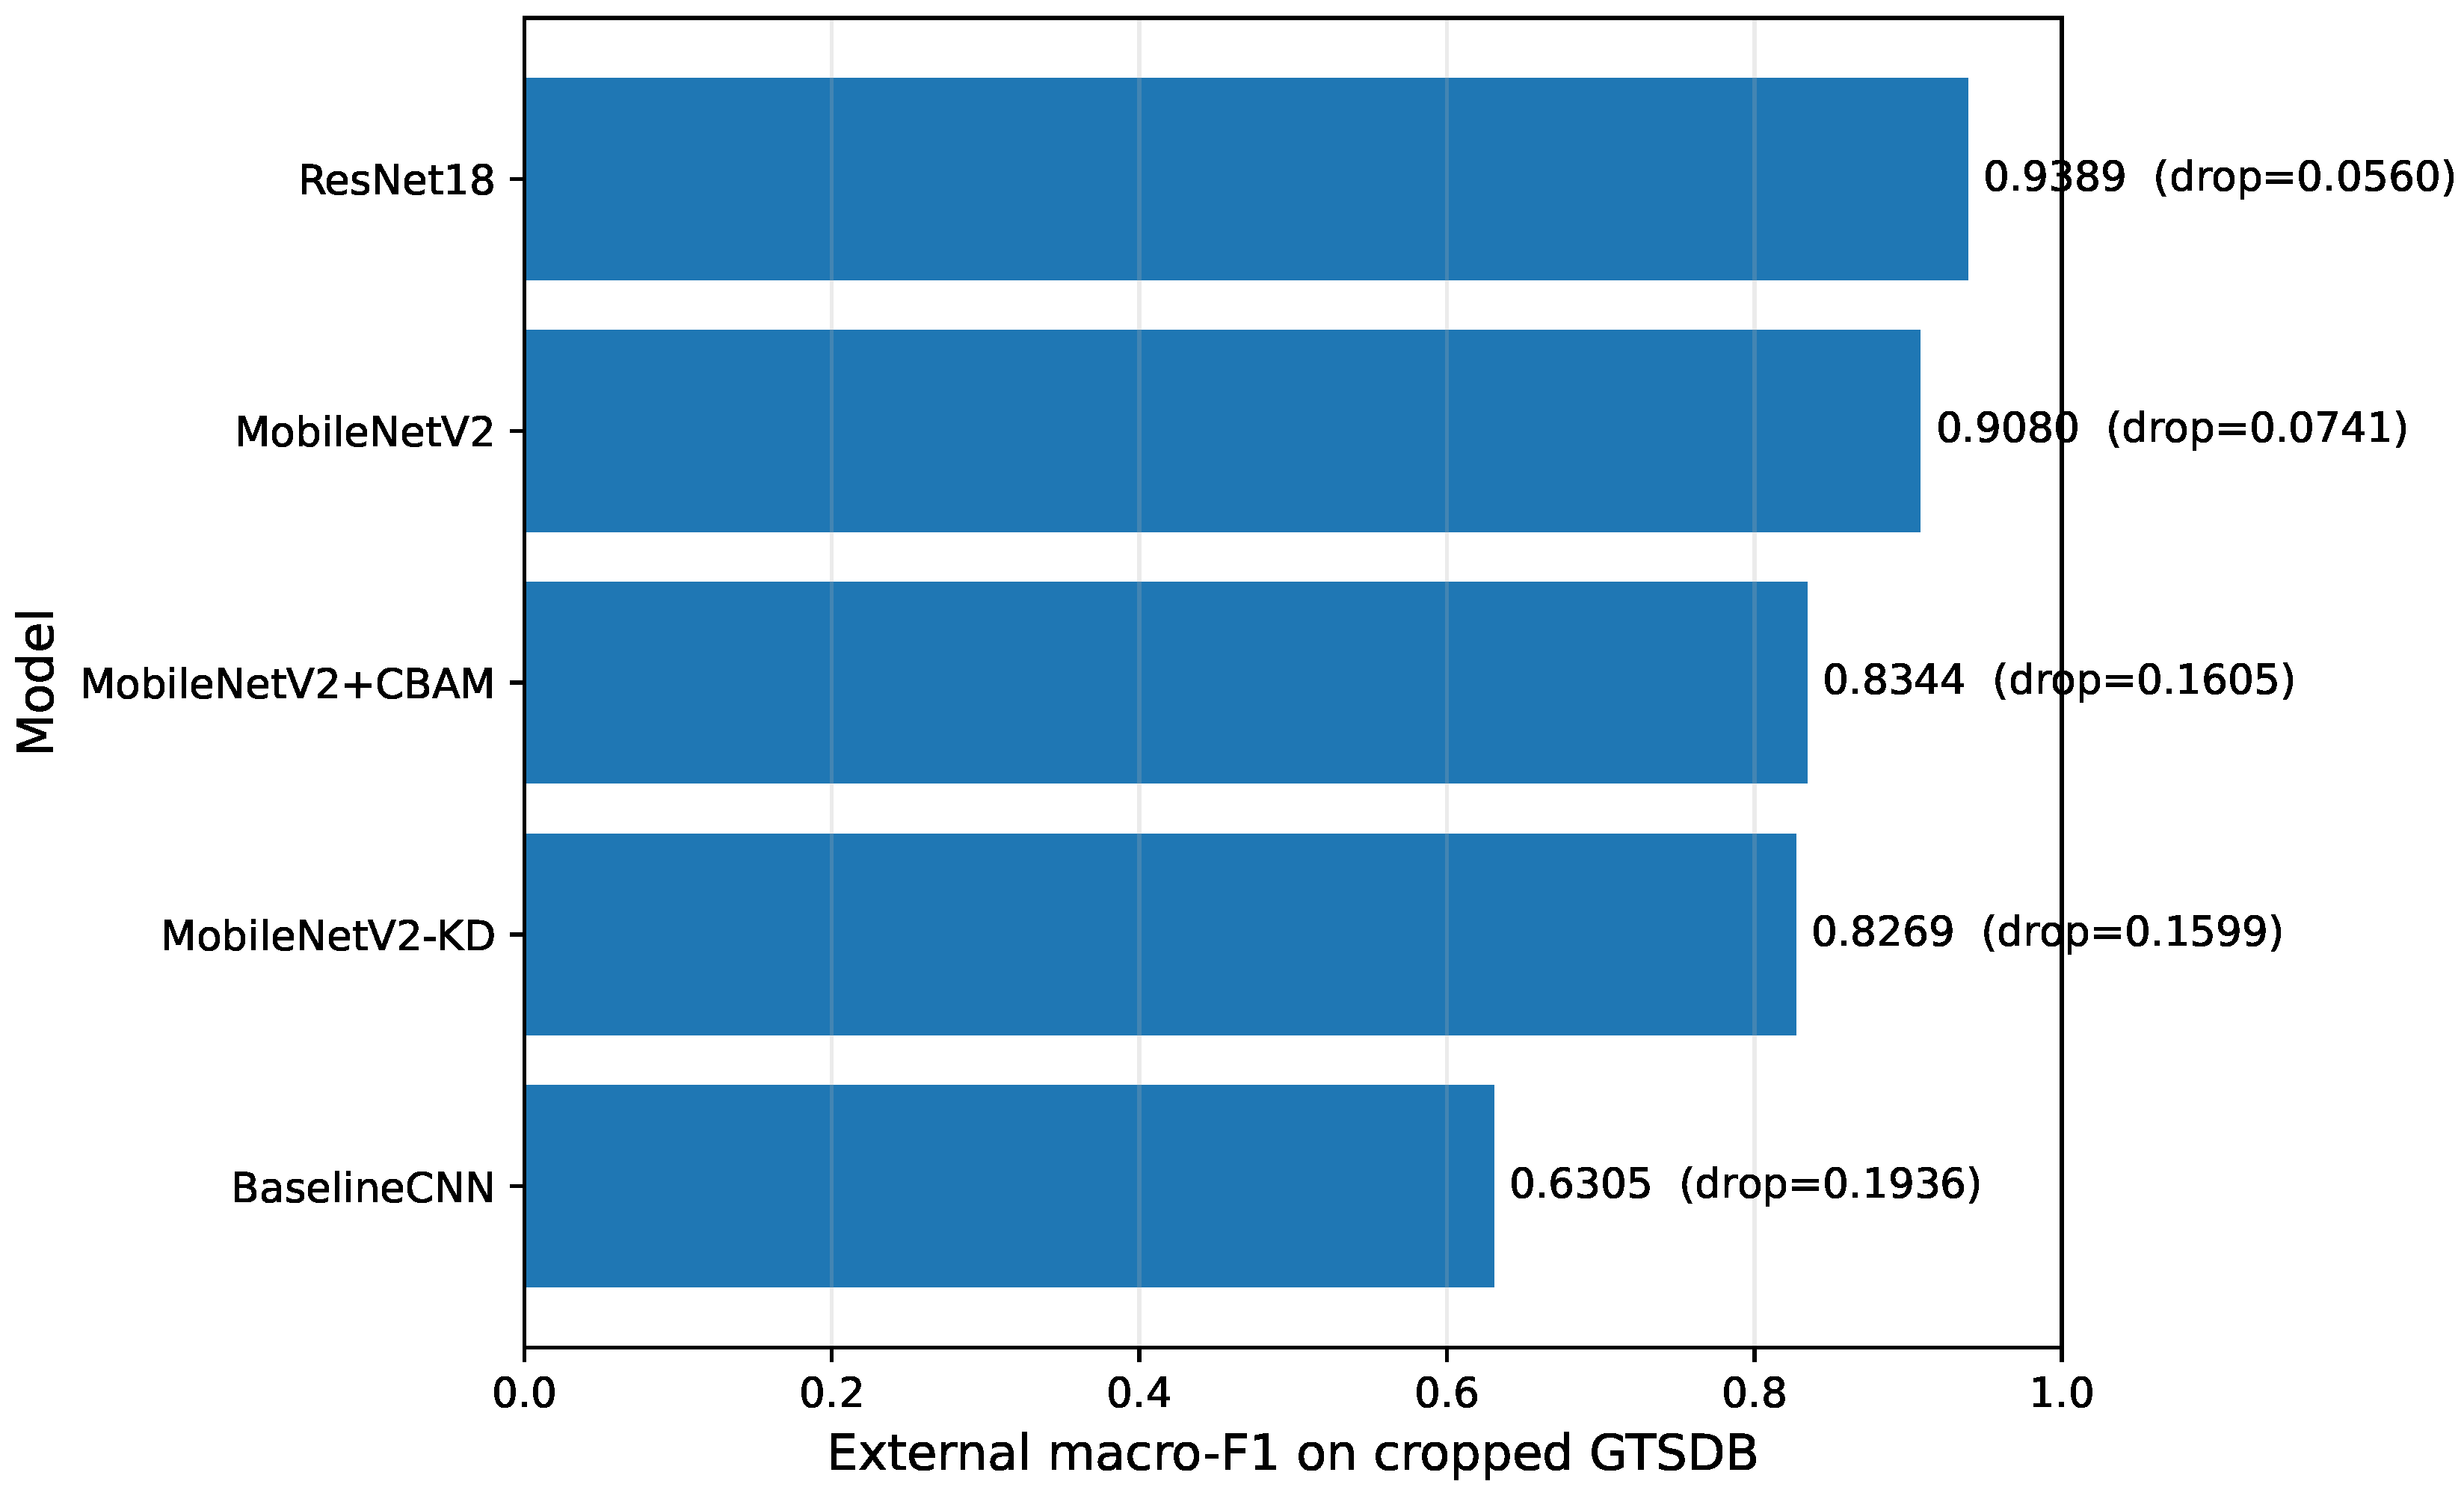
To evaluate whether the models generalize beyond GTSRB, the trained models were tested on cropped traffic sign samples extracted from GTSDB. This external evaluation used 360 cropped sign samples. The results are shown in
Figure 3 and in
Table 10.
ResNet18 achieved the strongest external generalization, with 0.9778 accuracy and 0.9389 macro-F1 on GTSDB. MobileNetV2 also generalized well, reaching 0.9583 accuracy and 0.9080 macro-F1. In contrast, MobileNetV2 + CBAM showed a larger domain drop, decreasing from 0.9949 macro-F1 on clean GTSRB to 0.8344 macro-F1 on GTSDB. This result is important because it shows that CBAM improves in-domain GTSRB performance but does not necessarily improve external transfer. MobileNetV2-KD also showed a relatively large domain drop, indicating that the distillation configuration did not fully close the generalization gap.
Therefore, the external validation changes the interpretation of the clean-set results. Although ResNet18 and MobileNetV2 + CBAM were nearly tied on clean GTSRB performance, ResNet18 was more stable under external GTSDB evaluation. This suggests that the best model for clean benchmark classification is not necessarily the best model for cross-dataset generalization.
4.6. Computational Efficiency and Model Complexity
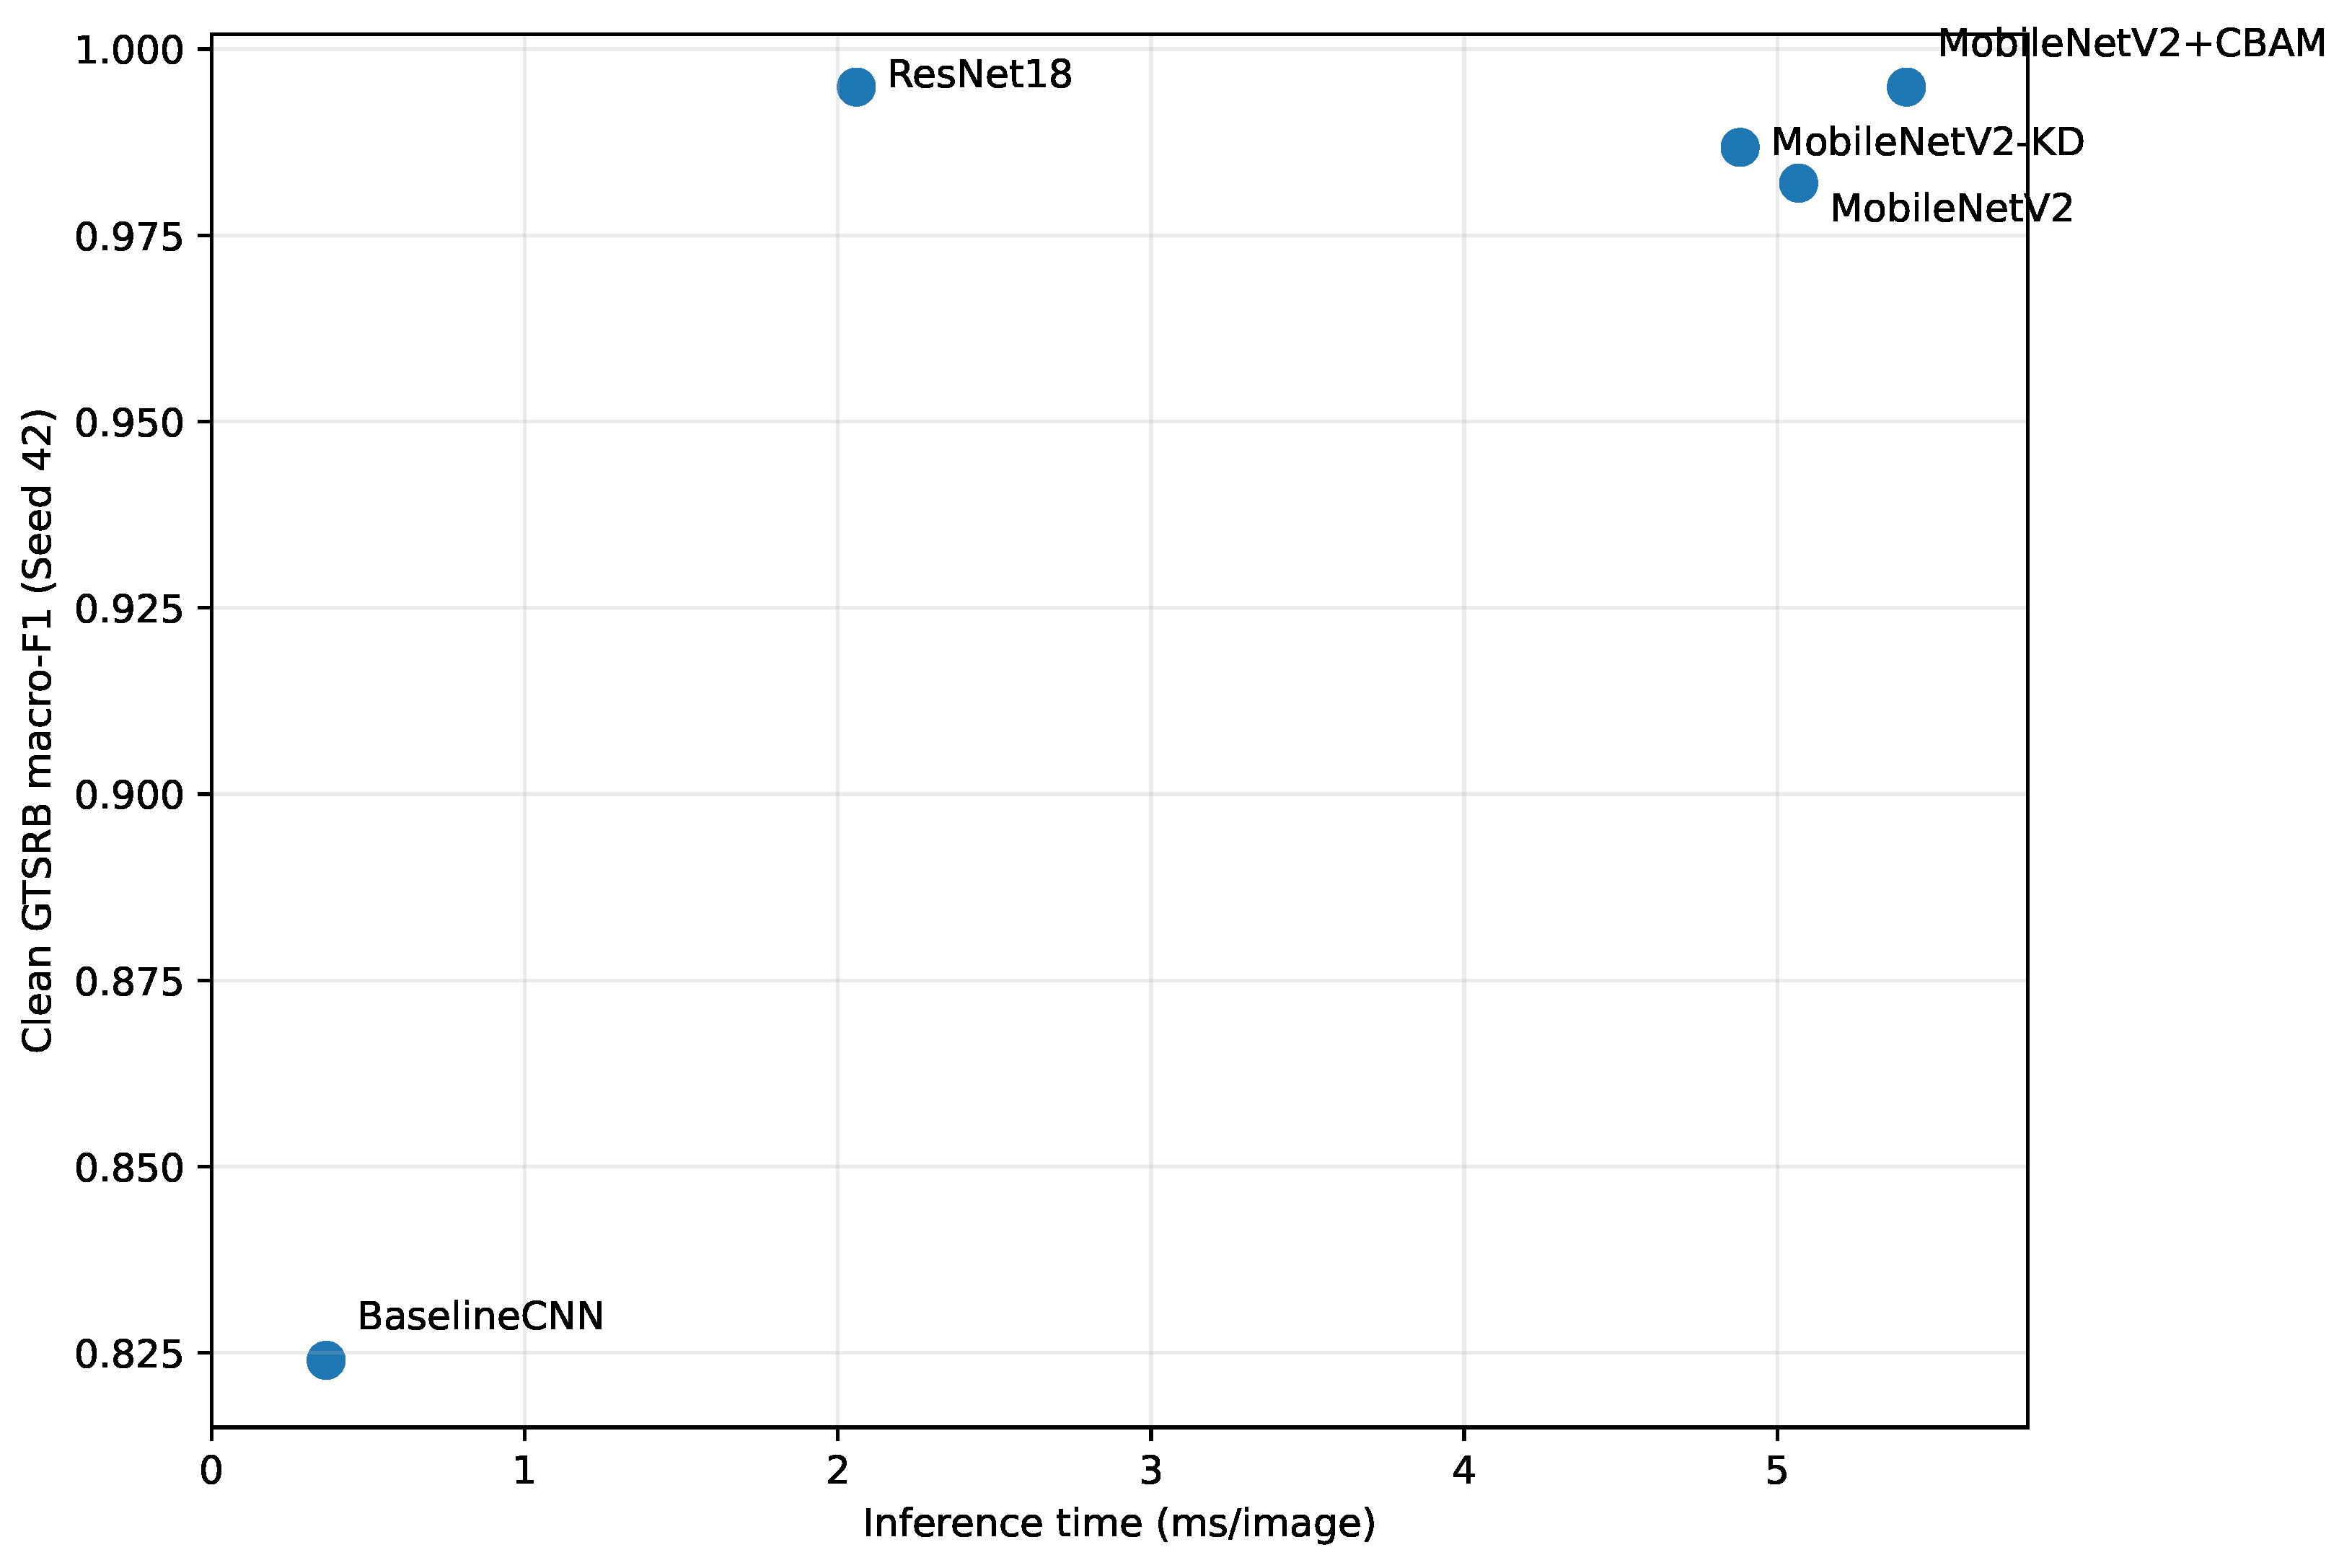
The computational-efficiency analysis evaluates parameter count, model size, training time, inference time, frames per second, and peak GPU memory. The results are summarized in
Table 11 and
Figure 4.
BaselineCNN was the fastest and smallest model, but this efficiency was achieved at the cost of substantially weaker predictive performance. ResNet18 had the largest parameter count and model size, but it remained faster at inference than the MobileNetV2 variants in the measured environment. This confirms that nominally lightweight architecture does not always translate into the lowest observed latency under a particular software and hardware configuration. MobileNetV2-KD required the fewest training epochs among the advanced models and had the lowest total training time, which supports its value as a compact-model alternative. However, its predictive and external-generalization results did not consistently exceed those of standard MobileNetV2.
The efficiency results therefore support a practical model selection interpretation. ResNet18 is the strongest overall option when clean performance, calibration, external generalization, and measured inference speed are considered together. MobileNetV2 remains a useful compact baseline, MobileNetV2 + CBAM is most attractive when in-domain clean performance and low-light robustness are prioritized, and MobileNetV2-KD is useful when shorter training and compactness are important.
4.7. Grad-CAM-Based Interpretability and Explanation Concentration
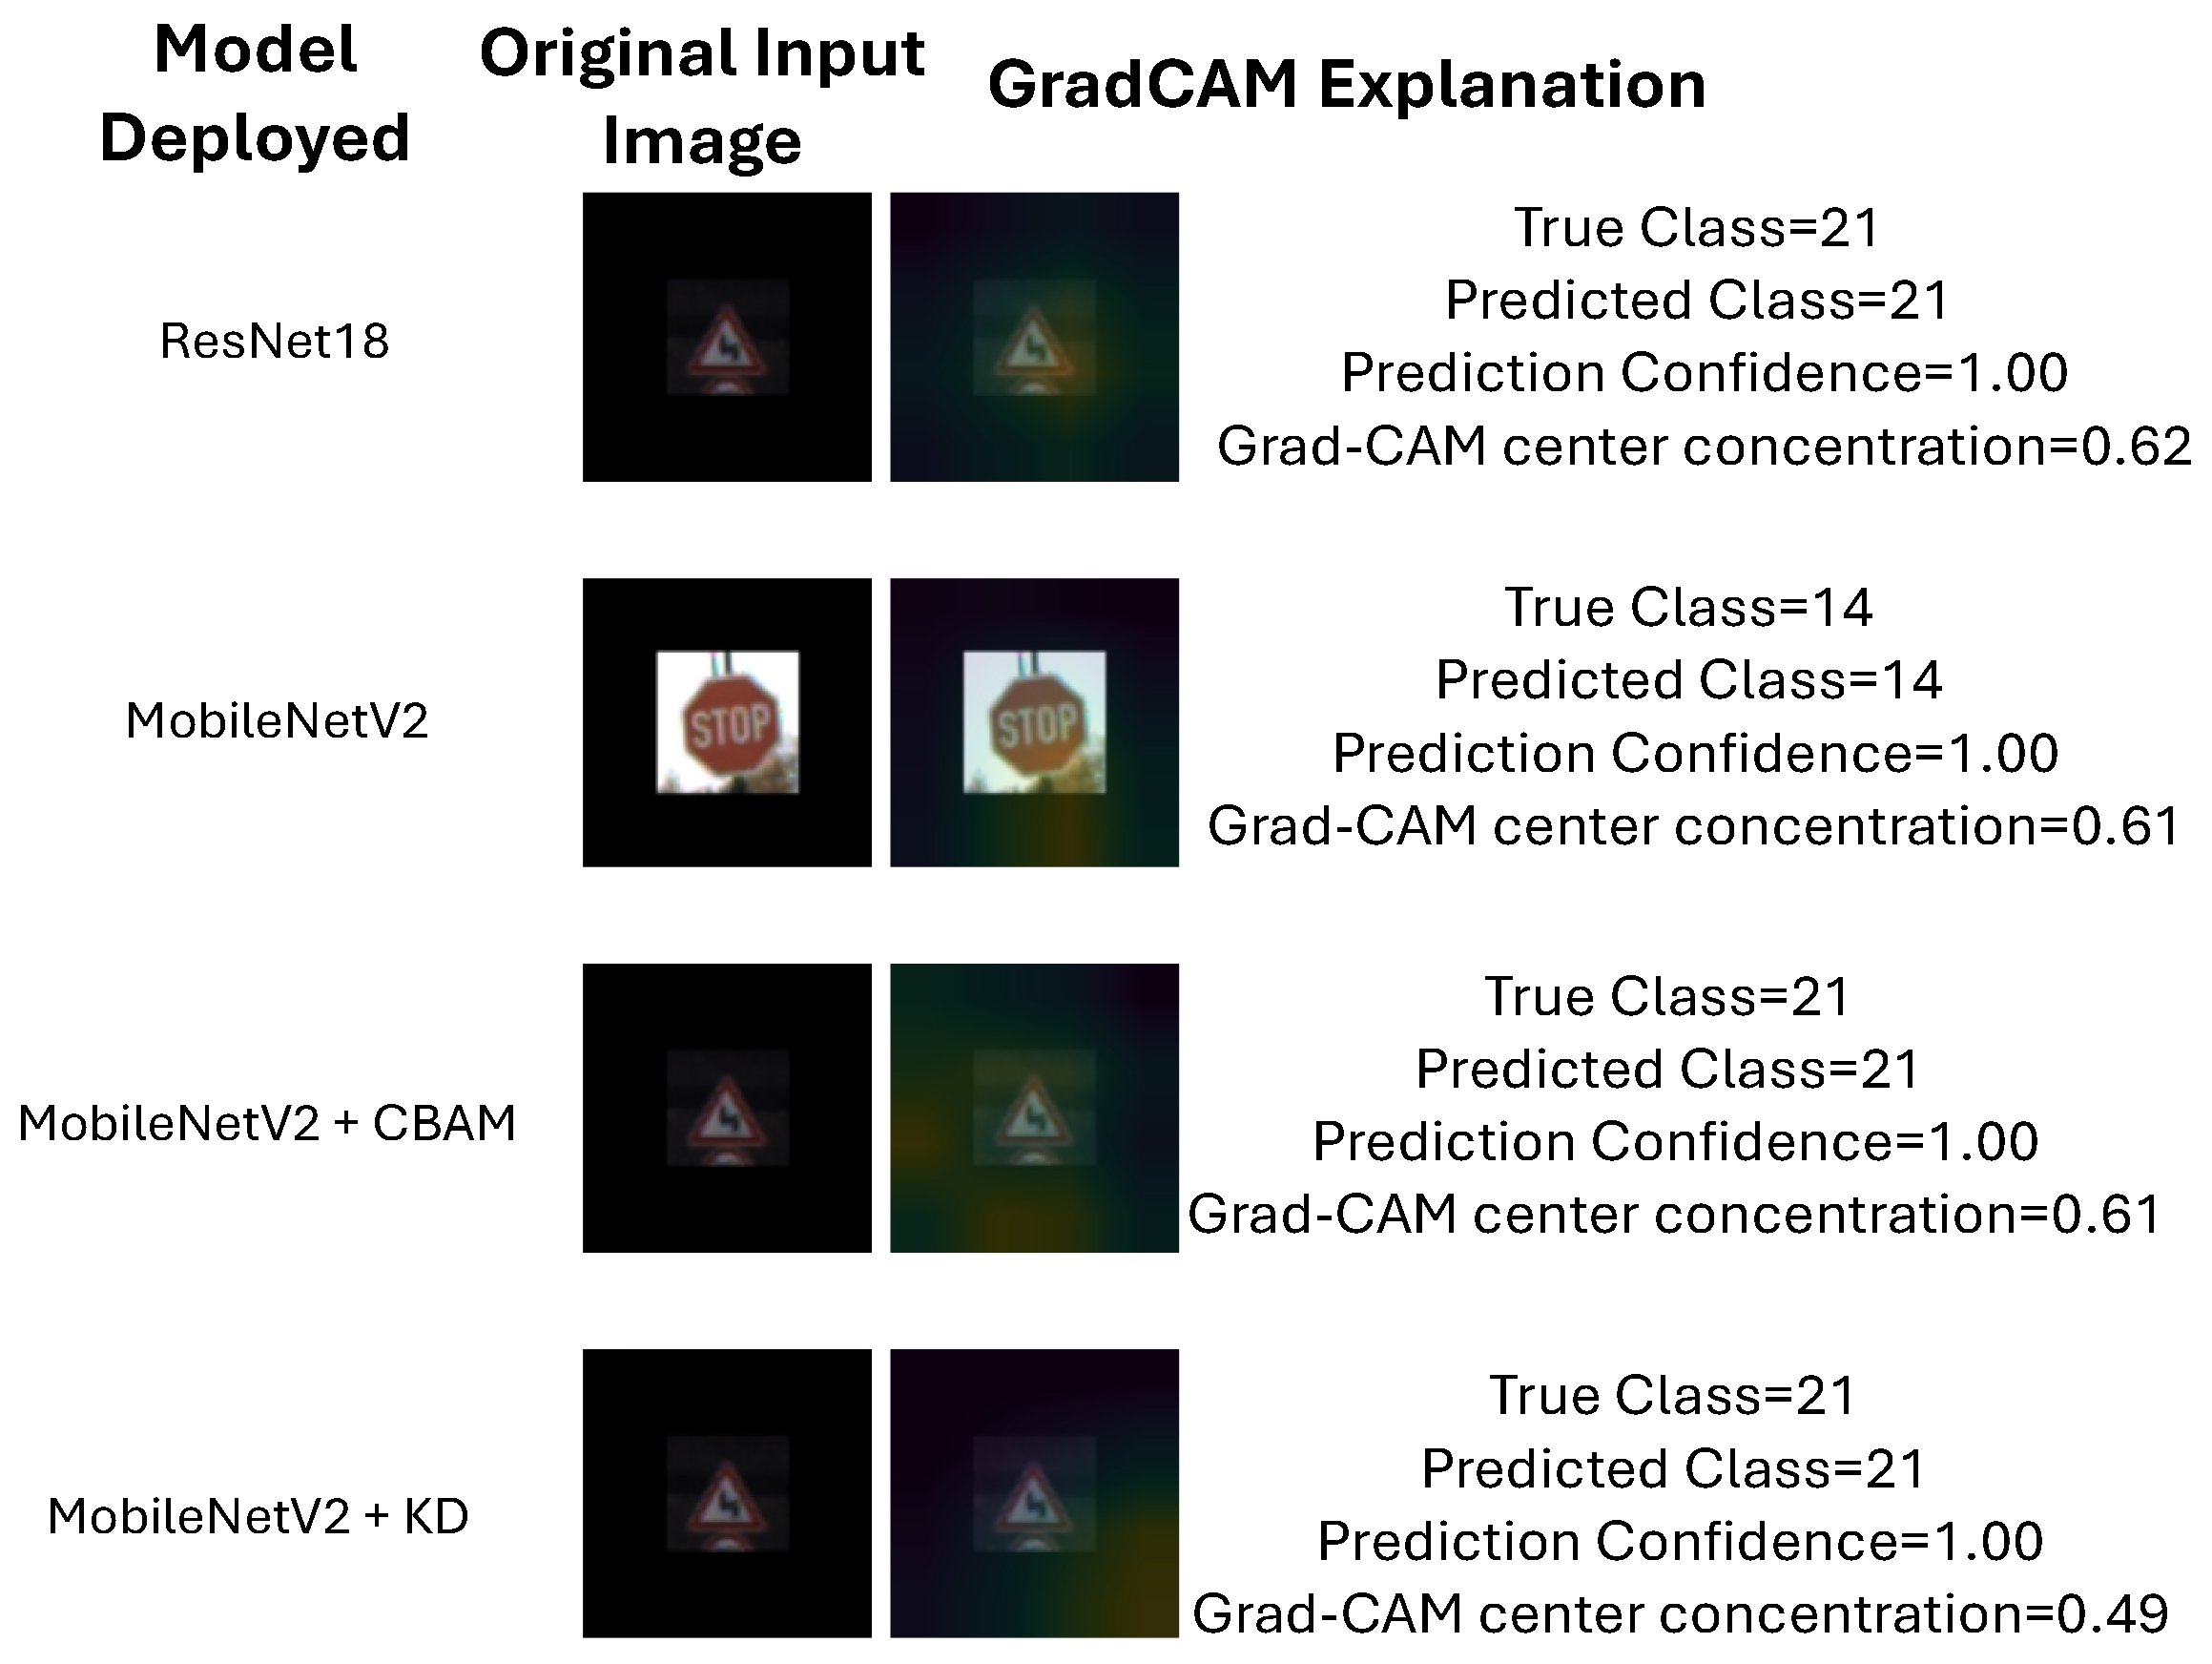
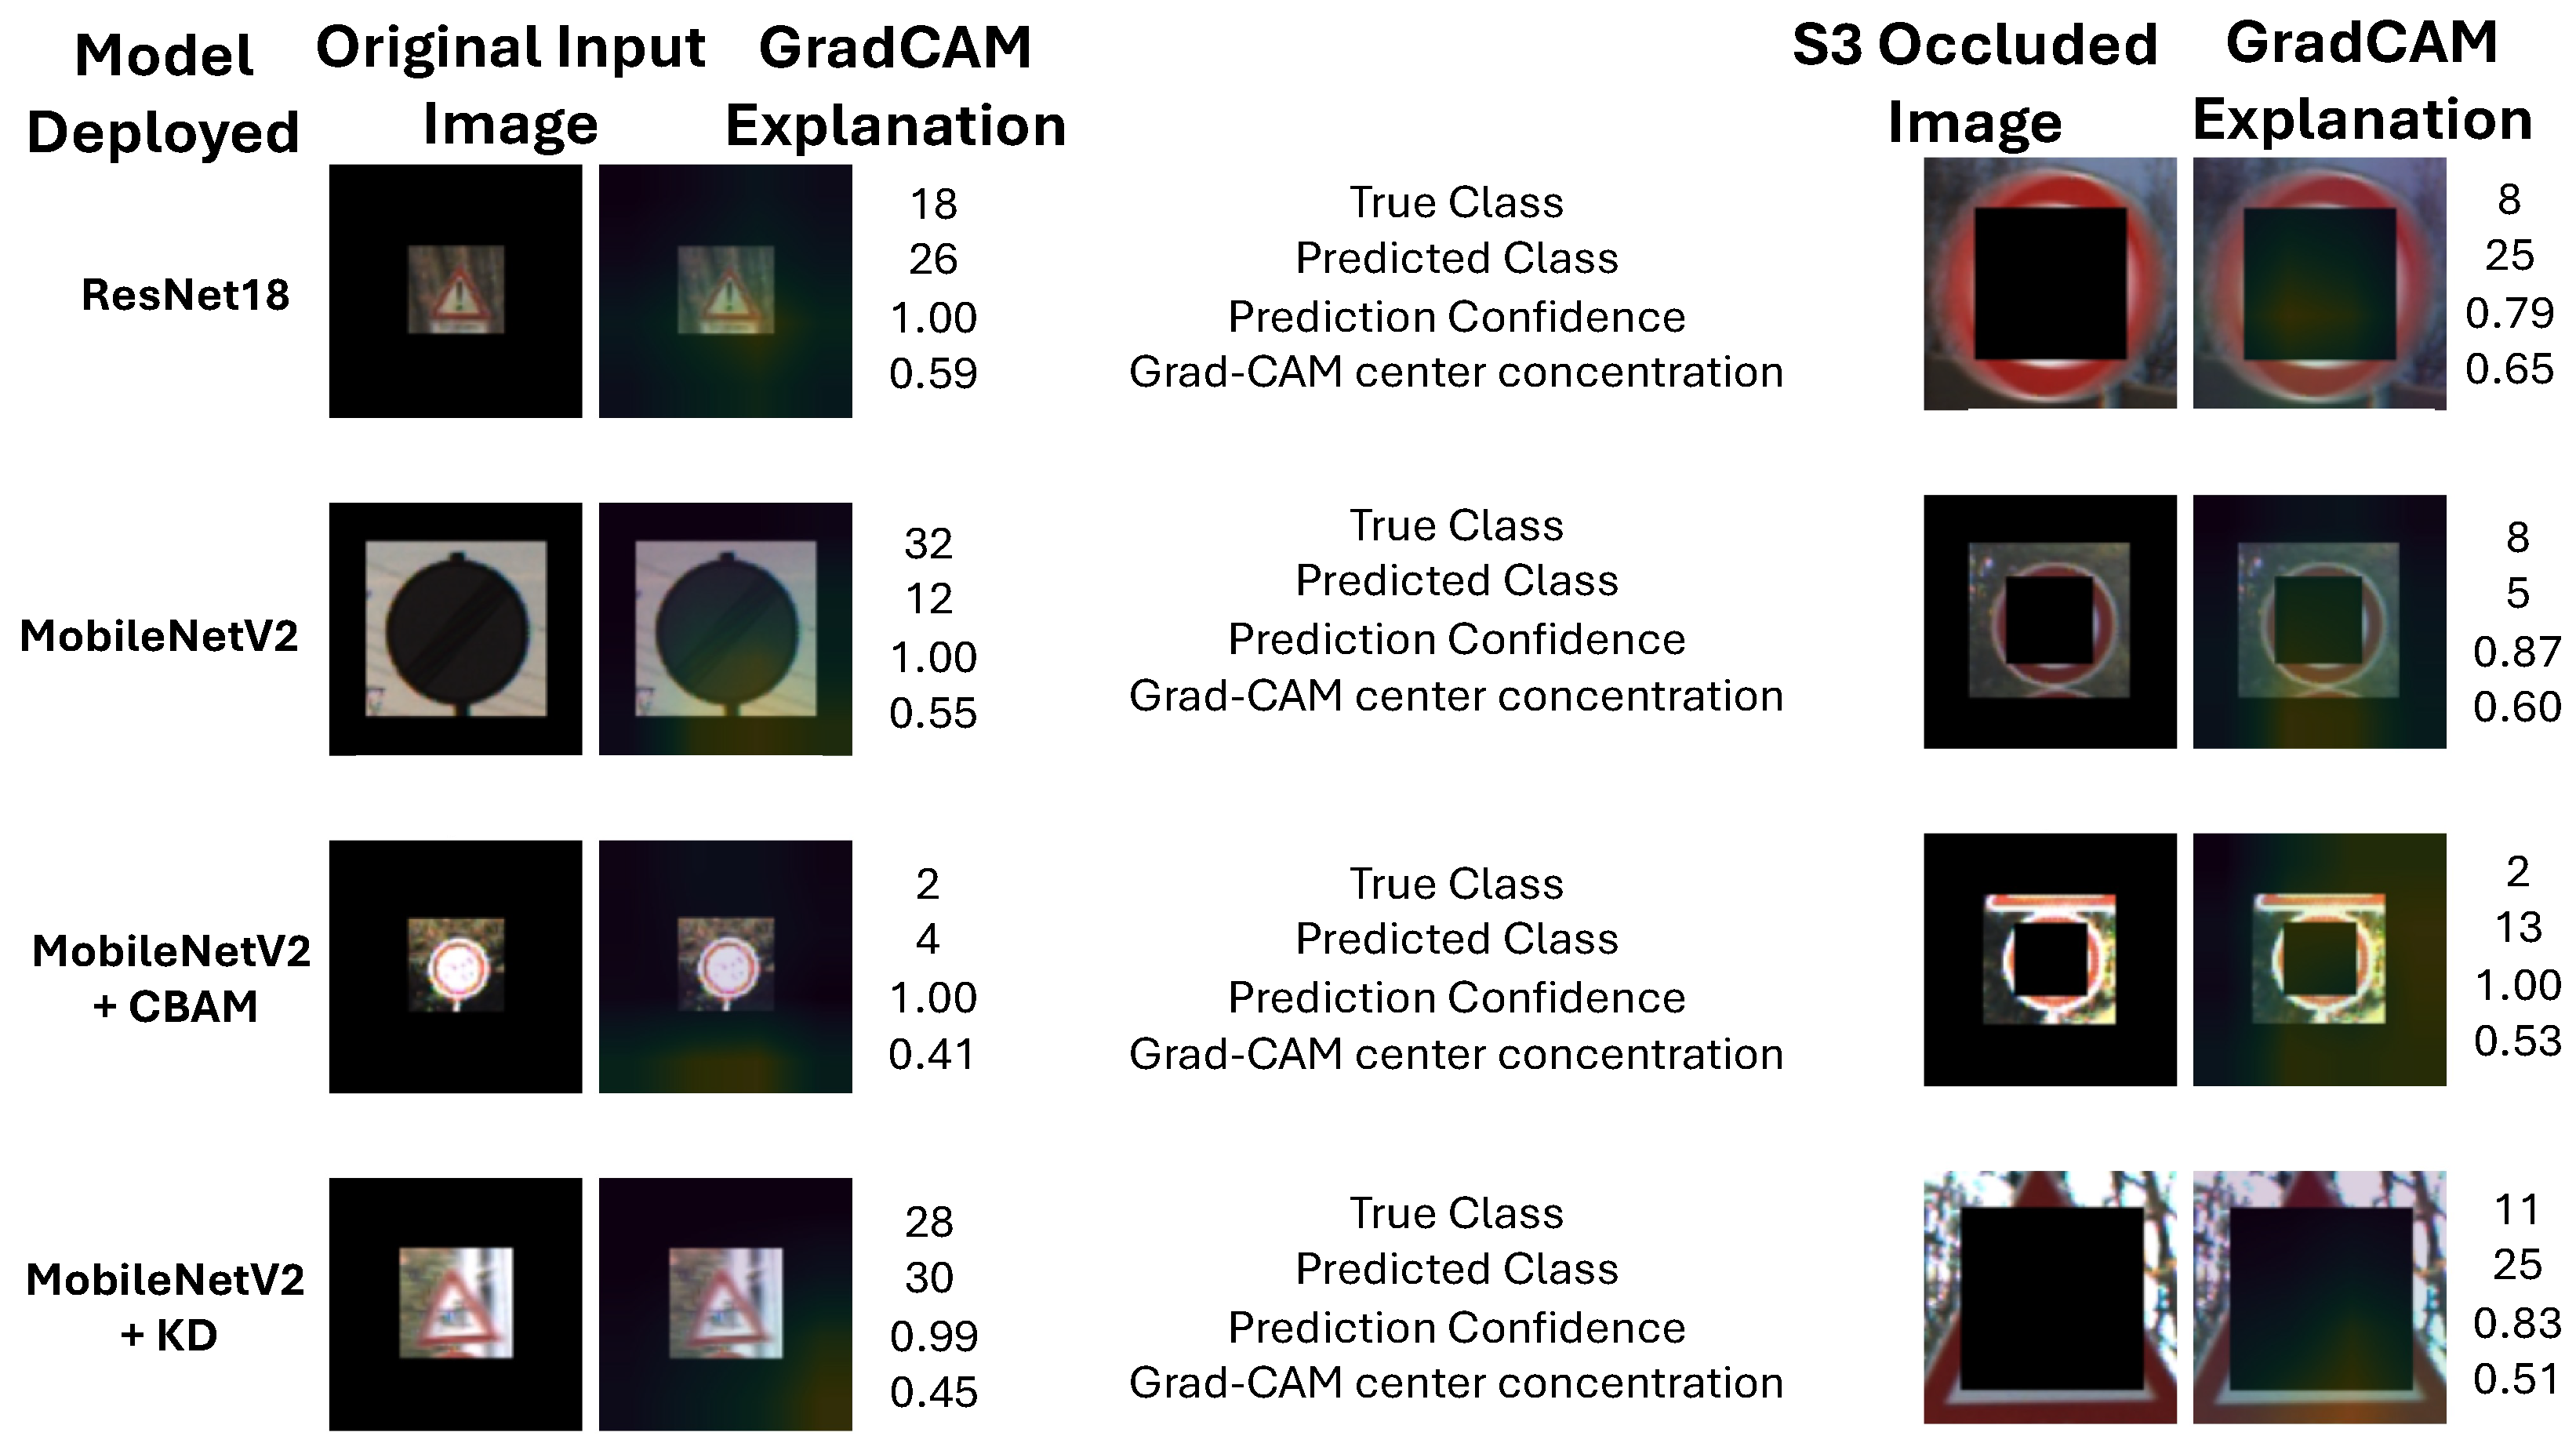
Grad-CAM was used to examine whether the models focused on visually meaningful traffic sign regions during prediction. In the analysis, Grad-CAM is not treated only as a qualitative visualization tool. Instead, representative heatmaps are complemented by a quantitative center-concentration score that estimates how strongly the explanation is concentrated around the central sign region. The representative Grad-CAM examples are shown in
Figure 5 and
Figure 6, and the quantitative summary is given in
Table 12.
Table 12 shows that center concentration was not consistently associated with either prediction confidence or correctness. ResNet18 produced the highest mean concentration, but its Pearson and Spearman correlations with confidence were both negative. Moreover, incorrect ResNet18 predictions showed greater mean concentration than correct predictions. MobileNetV2 exhibited a similarly weak negative relationship, while MobileNetV2 + CBAM showed only a small positive Pearson correlation and a near-zero negative Spearman correlation. MobileNetV2-KD produced the strongest positive rank correlation, although its mean concentration was the lowest among the evaluated architectures and its correct–incorrect difference was negligible. These results indicate that stronger center concentration should not be interpreted as evidence of greater predictive reliability or explanation quality. The score is therefore retained only as a descriptive measure of spatial activation distribution.
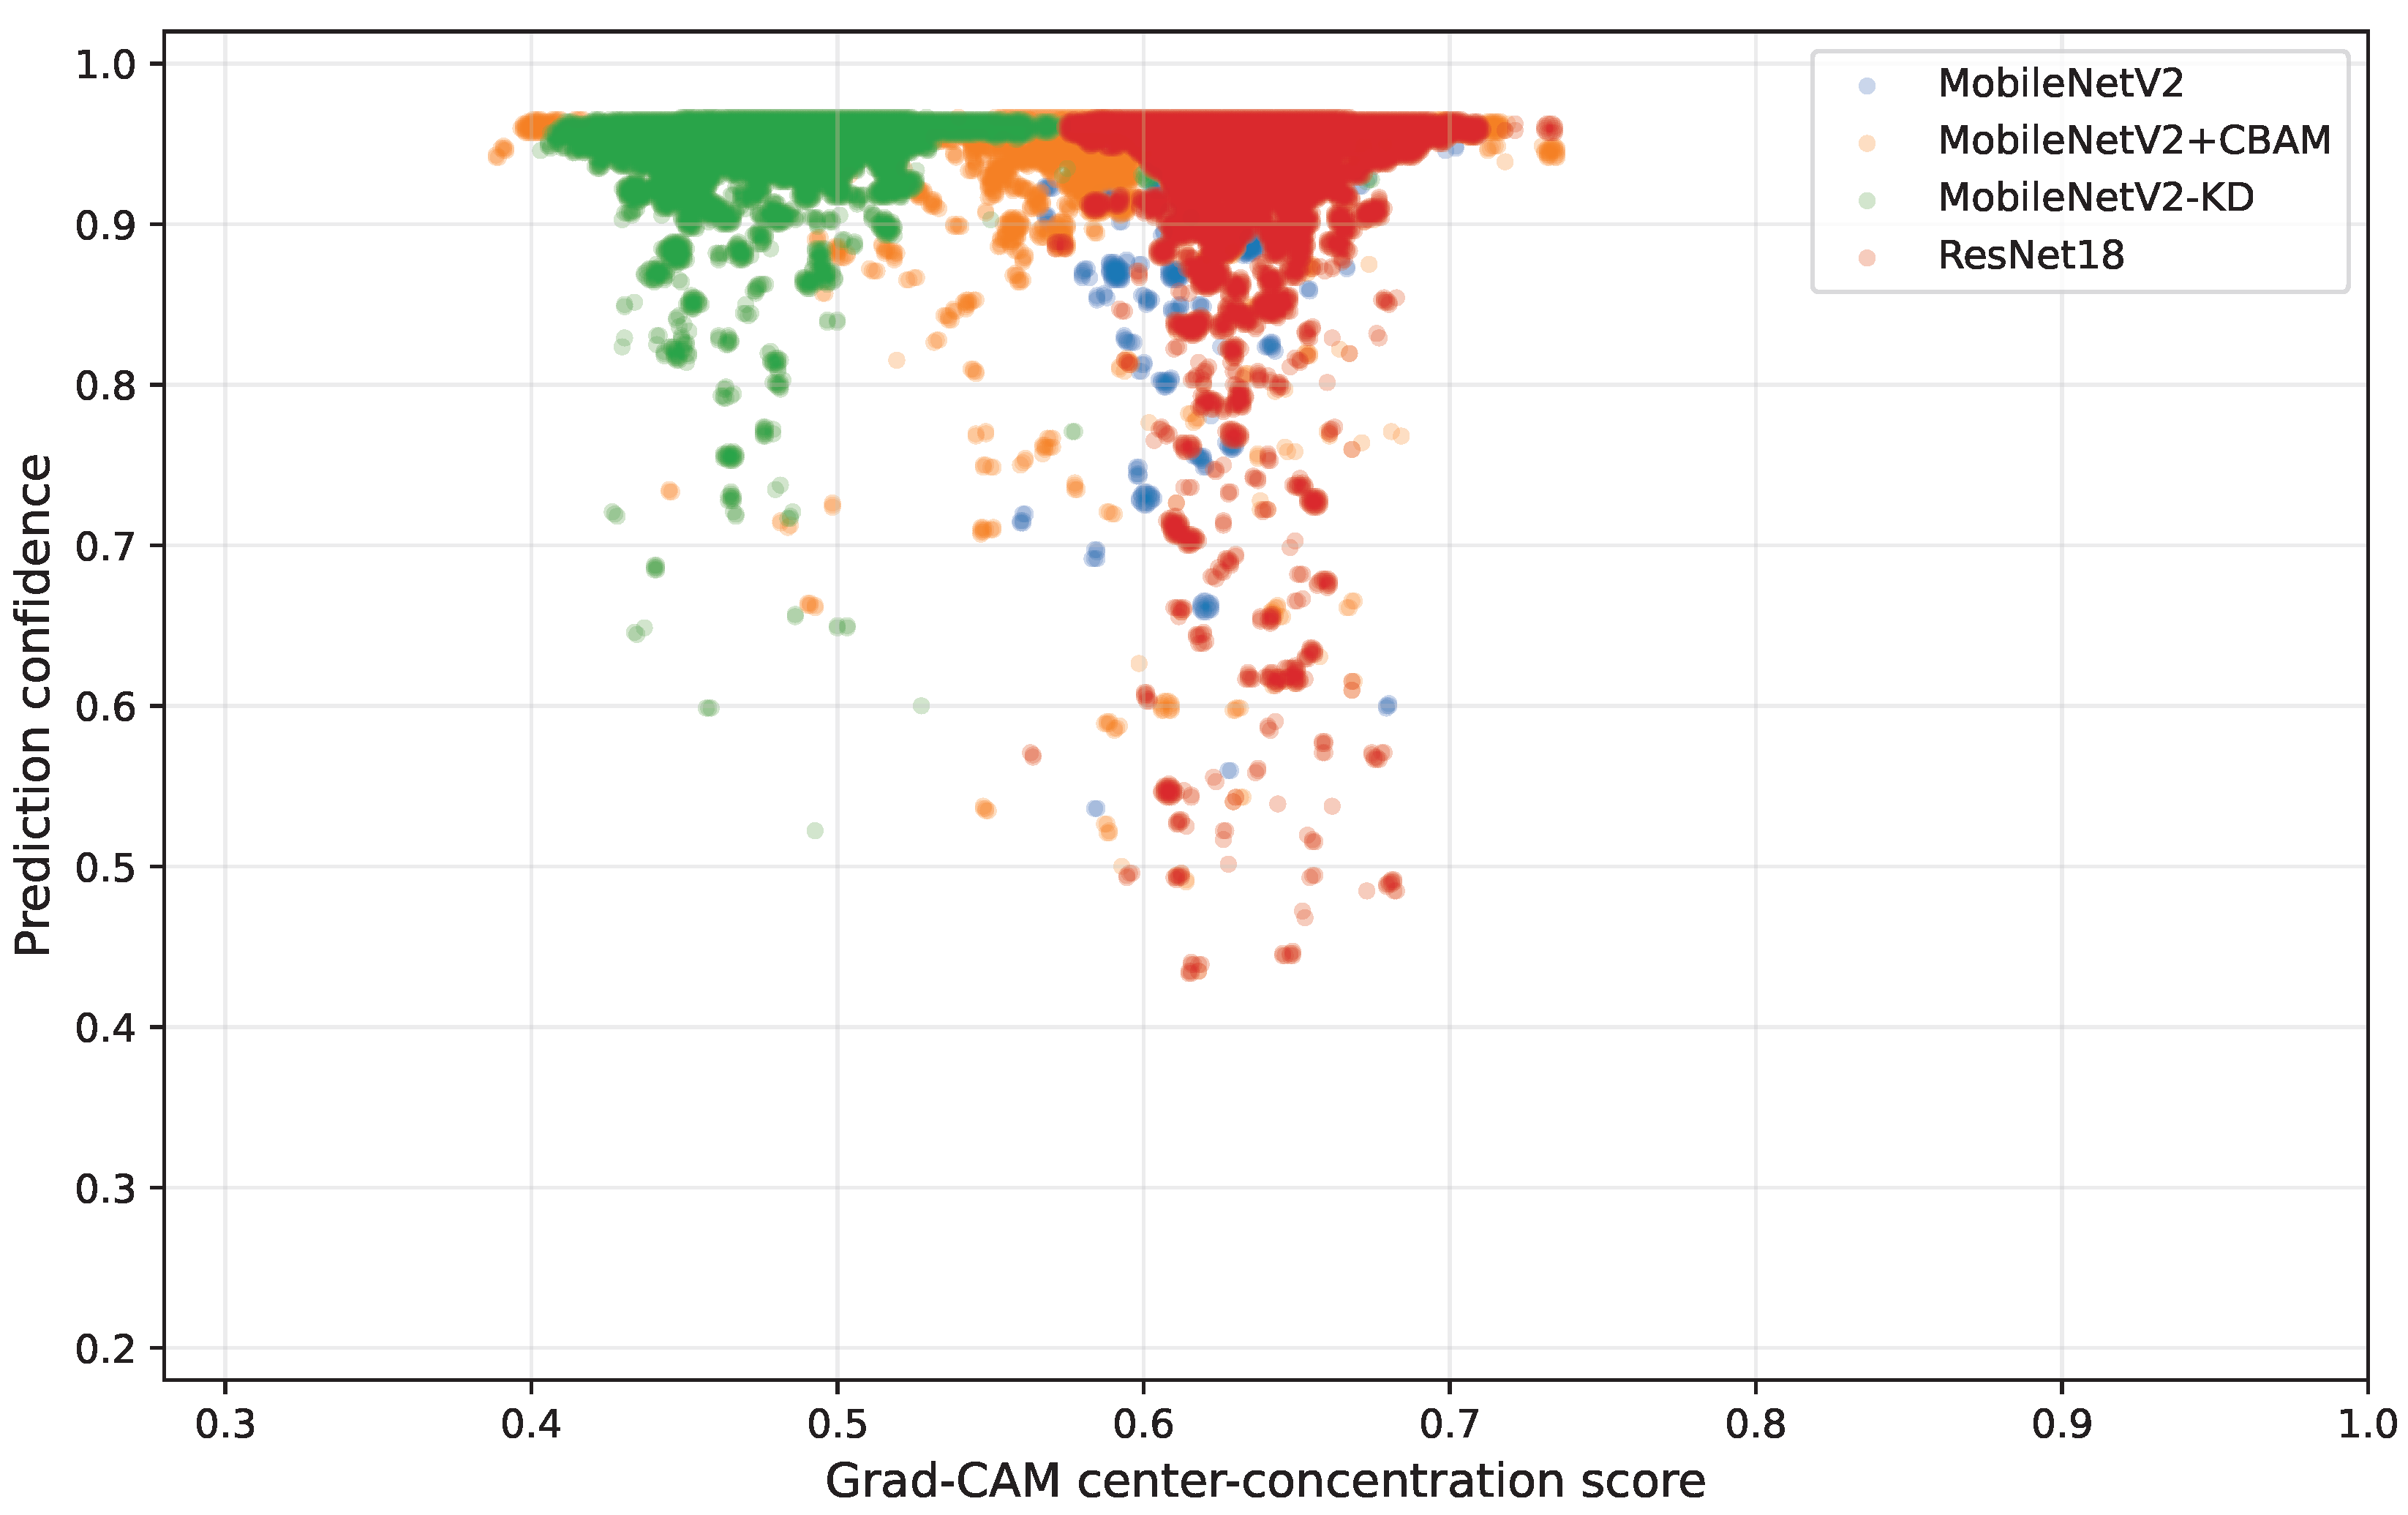
To further examine whether spatial concentration is associated with model confidence,
Figure 7 presents the relationship between the Grad-CAM center concentration score and prediction confidence for the representative Seed 42 checkpoints. The observed associations are weak and model dependent. ResNet18 and MobileNetV2 exhibit negative Pearson and Spearman relationships, indicating that increasingly central activation does not necessarily correspond to greater confidence. MobileNetV2 + CBAM shows only a weak positive Pearson association and an approximately negligible rank-based relationship, whereas MobileNetV2-KD exhibits a more noticeable positive Spearman correlation but a substantially weaker Pearson correlation. These inconsistencies indicate that center concentration is not a reliable general surrogate for prediction confidence. Accordingly, the measure is interpreted only as a descriptive indicator of spatial attention distribution rather than as a validated measure of explanation quality or predictive reliability.
The Grad-CAM concentration results show that ResNet18 produced the most concentrated explanations on average, followed by MobileNetV2 + CBAM and MobileNetV2. The CBAM variant showed a modest increase in explanation concentration relative to standard MobileNetV2, which supports the interpretation that CBAM can refine visual focus. However, the improvement is moderate rather than decisive, and the external GTSDB results show that stronger in-domain attention concentration does not automatically imply better cross-dataset generalization. MobileNetV2-KD produced the lowest mean concentration score among the analyzed advanced models, suggesting that the distillation setup used in this study did not improve Grad-CAM localization.
The qualitative examples further show that correct predictions are generally associated with focused activation around the sign region, while errors and difficult cases often show more diffuse or misplaced attention. These findings support the use of Grad-CAM as a diagnostic tool for identifying hidden visual-reasoning failures. At the same time, the results also show that Grad-CAM should not be interpreted as a complete proof of model reliability; it is most useful when combined with quantitative performance, robustness, calibration, and external generalization evidence. Overall, the qualitative cases in
Figure 5 and
Figure 6, the summary statistics in
Table 12, and the correlation analysis in
Figure 7 jointly show that visually concentrated activation should not be interpreted as evidence of correct, confident, or faithful model reasoning.
5. Discussion
The results show that traffic sign classifier selection depends strongly on the evaluation dimension. ResNet18 achieved the strongest overall balance in this study because it combined high clean GTSRB performance, strong calibration, good external GTSDB transfer, and competitive measured inference speed. However, no single model dominated every criterion. MobileNetV2 remained a strong compact classifier, MobileNetV2 + CBAM provided condition-dependent gains, and MobileNetV2-KD offered a compact teacher–student alternative without consistently surpassing the standard MobileNetV2. These findings support the central argument that traffic sign classifiers should not be selected using clean accuracy alone.
5.1. Clean Classification Performance, Statistical Significance, and Calibration
The comparison of BaselineCNN, ResNet18, MobileNetV2, MobileNetV2 + CBAM, and knowledge-distilled MobileNetV2 on the clean GTSRB test set showed that deeper and better structured models produced substantially stronger performance than the BaselineCNN. It also shows that residual and lightweight deep architectures are better able to capture fine-grained sign structures than a shallow convolutional baseline. However, the analysis provides a more careful interpretation because clean performance was supported by bootstrap confidence intervals and McNemar paired statistical tests. The strongest clean-set models were ResNet18 and MobileNetV2 + CBAM. Their performance was very close, and the McNemar test did not show a statistically significant difference between them. This result is important because it prevents overinterpreting small numerical differences in accuracy or macro-F1 score. In contrast, the performance differences between the BaselineCNN and the stronger models were statistically significant, confirming that the baseline architecture was clearly less suitable for fine-grained traffic sign classification in the present setting. MobileNetV2 remained a strong compact alternative, while the knowledge-distilled MobileNetV2 achieved competitive clean performance but did not significantly outperform the standard MobileNetV2. The calibration results further refine the interpretation of model reliability. ResNet18 and MobileNetV2 + CBAM were not only accurate but also well calibrated, meaning that their predicted probabilities were more reliable than those of the BaselineCNN. This is relevant for safety-oriented traffic sign recognition because an overconfident wrong prediction may be more problematic than an uncertain prediction. The BaselineCNN showed weaker calibration, which suggests that shallow models may not only misclassify more frequently but also provide less reliable confidence estimates. The knowledge-distilled MobileNetV2 did not improve calibration over the standard MobileNetV2 in the present run, indicating that distillation should not be assumed to automatically improve probabilistic reliability.
5.2. Robustness Under Visual Degradation
The robustness results show that model performance depends strongly on the type and severity of visual degradation. This directly supports the central argument that clean benchmark accuracy alone is not sufficient for evaluating traffic sign classifiers. The severity-wise analysis revealed that occlusion was the most damaging condition across all models. At the highest occlusion severity, even the stronger architectures suffered severe performance degradation, indicating that partial information loss remains a critical weakness in traffic sign classification. This finding is practically important because real traffic signs may be partially blocked by vehicles, poles, vegetation, road infrastructure, or other environmental objects. Blur also caused substantial degradation, although the models did not fail as severely as under occlusion. ResNet18 was comparatively more stable under severe blur, suggesting that residual feature extraction may help preserve discriminative structure when image sharpness is reduced. However, the performance drop under blur still indicates that motion-related or sensor-related image distortion can strongly affect recognition reliability. This supports the need for blur-aware training, multi-scale representation learning, or image restoration mechanisms in future traffic sign recognition systems.
Low-light degradation was comparatively less harmful for the stronger architectures. MobileNetV2 + CBAM maintained particularly strong performance under severe low-light conditions, suggesting that attention-based feature refinement can help the model preserve relevant sign structures when illumination is reduced. However, this benefit should be interpreted carefully because CBAM did not improve every robustness condition. Gaussian noise produced an intermediate challenge, whereas ResNet18 and MobileNetV2-KD retained comparatively strong performance. These results show that robustness should be discussed separately for each degradation type rather than reported as a single average score. From a practical perspective, the results suggest different mitigation strategies for different failure modes. Occlusion may require occlusion-aware augmentation, random erasing, detection-before-classification pipelines, or temporal information from video sequences. Blur may be addressed through blur augmentation, deblurring preprocessing, or multi-scale features. Low-light conditions may be improved through brightness and contrast augmentation, while Gaussian noise may require noise augmentation or denoising-based preprocessing. Therefore, robustness improvement should be degradation specific rather than treated as a general property of a model.
5.3. Role of CBAM and Knowledge Distillation
The experiments indicate that CBAM provides condition-dependent effects rather than a uniform improvement. The clean GTSRB results showed that MobileNetV2 + CBAM improved over standard MobileNetV2, and the no-augmentation ablation further confirmed that CBAM can improve clean classification and blur robustness even when the effect of data augmentation is separated. This supports the view that channel and spatial attention can help lightweight models focus on more informative visual regions. However, the effect of CBAM was condition dependent rather than universally beneficial. The ablation results showed that CBAM provided only a marginal benefit under occlusion and did not consistently improve low-light robustness. More importantly, the external GTSDB evaluation showed that MobileNetV2 + CBAM suffered a larger domain drop than ResNet18 and standard MobileNetV2. This indicates that stronger in-domain attention focusing does not automatically guarantee stronger external transfer. Therefore, CBAM should be interpreted as a useful feature-refinement mechanism for certain conditions, especially clean GTSRB classification and blur robustness, but not as a complete solution for robustness or generalization. Knowledge distillation was included as a compact-model enhancement strategy. The distilled MobileNetV2 achieved competitive clean performance and required fewer training epochs than some of the other advanced models. This suggests that distillation can be useful when compactness and training efficiency are important. However, the distilled model did not consistently outperform standard MobileNetV2 across calibration, external generalization, and interpretability metrics. Therefore, in the present study, knowledge distillation is best understood as a promising but not uniformly superior compact model strategy. Future work may explore different teacher–student combinations, distillation temperatures, loss weightings, and robustness-aware distillation objectives.
5.4. External Generalization from GTSRB to GTSDB
The external GTSDB evaluation tests whether strong GTSRB performance transfers to a related but distinct traffic sign dataset. The results showed that ResNet18 achieved the strongest external generalization, followed by standard MobileNetV2. This finding changes the interpretation of the clean-set results: although ResNet18 and MobileNetV2 + CBAM were nearly tied on clean GTSRB performance, ResNet18 generalized more reliably to GTSDB. The larger domain drop observed for MobileNetV2 + CBAM and MobileNetV2-KD suggests that model enhancements that improve in-domain performance may not always improve cross-dataset robustness. This is an important practical finding because traffic sign recognition systems are expected to operate across changing camera conditions, sign appearances, backgrounds, and acquisition settings. A model that learns dataset-specific visual cues may perform strongly on one benchmark while losing performance on another dataset. Therefore, external validation should be treated as an essential component of traffic sign classifier evaluation rather than an optional extension. At the same time, the external evaluation remains limited because the GTSDB experiment used cropped traffic sign samples rather than a full detection-and-classification pipeline. Therefore, the results should be interpreted as evidence of cross-dataset classification transfer, not as complete real-world deployment validation. Nevertheless, the GTSDB analysis provides stronger evidence than a GTSRB-only evaluation and helps identify which models are more stable beyond the original benchmark.
5.5. Computational Efficiency and Practical Model Selection
The relationship between prediction quality and computational efficiency is not as simple as separating models into “deep” and “lightweight” categories. The BaselineCNN achieved the fastest inference and smallest model size, but its weaker accuracy, macro-F1 score, calibration, and robustness limit its suitability when recognition reliability is the main requirement. Therefore, while the baseline model is computationally attractive, it is not the strongest practical choice for reliable traffic sign classification. ResNet18 had the largest parameter count and model size, but it provided the strongest overall balance across clean performance, calibration, external generalization, and measured inference speed in the present environment. This is an important finding because it shows that a nominally larger architecture may still be practically competitive when evaluated using actual runtime measurements. MobileNetV2 and MobileNetV2 + CBAM remained valuable compact alternatives, but their measured inference times were not lower than ResNet18 in this implementation. This confirms that architectural compactness does not always translate directly into lower observed latency, since runtime can depend on hardware, library optimization, batch configuration, and implementation details. MobileNetV2-KD offered a useful training efficiency advantage because it required fewer epochs and lower total training time than several other advanced models. However, its predictive and generalization performance did not consistently exceed standard MobileNetV2. This suggests that model selection should be based on the intended deployment priority. If clean accuracy, calibration, and external generalization are most important, ResNet18 is the strongest option in this study. If compactness and in-domain performance are prioritized, MobileNetV2 + CBAM is attractive. If shorter training time and compact architecture are more important, MobileNetV2-KD may be useful.
5.6. Grad-CAM Interpretability and Visual Attention Behavior
Grad-CAM analysis provided useful insight into how the evaluated models arrived at correct and incorrect predictions. The analysis strengthens this interpretation by adding a quantitative center concentration score, which provides an approximate measure of how strongly the Grad-CAM activation is concentrated around the central sign region. The results showed that ResNet18 produced the highest mean Grad-CAM concentration, followed by standard MobileNetV2 and MobileNetV2 + CBAM. This supports the interpretation that ResNet18 not only performed strongly in classification and external generalization but also produced comparatively focused visual explanations. The CBAM variant showed comparable results in explanation concentration compared with standard MobileNetV2, suggesting that attention refinement can be comparable for visual focus to some extent. The qualitative Grad-CAM examples further showed that correct predictions were generally associated with focused activation on the traffic sign region, including sign borders, symbols, and central iconography. In contrast, incorrect predictions and failure cases were more likely to show diffuse or misplaced attention on background objects, poles, sky regions, or surrounding structures. This confirms that accuracy scores alone may hide important visual-reasoning failures. At the same time, Grad-CAM should not be treated as complete proof of interpretability or causal reasoning. It is more reliable when used as a diagnostic tool alongside performance, robustness, calibration, and external validation results.
5.7. Significance of This Study
The significance of this study lies in its numerical evaluation and methodological framing. Rather than presenting a new backbone architecture, the study provides a reliability-oriented evaluation framework for traffic sign classification. This framework compares baseline, residual, lightweight, attention-enhanced, and knowledge-distilled models across multiple criteria that are relevant for practical use. These criteria include clean predictive performance, statistical significance, calibration reliability, robustness under controlled degradation severity, external generalization, computational efficiency, and Grad-CAM based explanation behavior. The study therefore contributes to the traffic sign recognition literature by showing that model evaluation should not be based on clean benchmark accuracy alone. The findings demonstrate that different models can be preferred under different priorities. ResNet18 is the strongest overall model when clean performance, calibration, external generalization, and measured inference speed are considered together. MobileNetV2 remains a competitive compact model. MobileNetV2 + CBAM improves clean and some robustness results but is not universally superior, especially under external transfer. MobileNetV2-KD offers a compact and training-efficient alternative, although its benefits are not consistent across all metrics. Together, these findings provide practical guidance for researchers and engineers developing traffic sign classification systems. The study highlights that robust traffic sign recognition requires a balanced evaluation of accuracy, confidence reliability, degradation sensitivity, transferability, computational cost, and visual reasoning. In this sense, the contribution of the study is not only the comparison of several models but also the demonstration of a more complete evaluation protocol for reliable and interpretable traffic sign classification.
5.8. Limitations and Future Directions
Several limitations remain. First, although five independent training seeds quantify variability due to stochastic training, five runs provide limited power for seed-level non-parametric significance tests. The reported mean, standard deviation, paired differences, and seed-wise win counts should therefore be interpreted together rather than relying only on binary significance thresholds. Second, the external evaluation contains 360 cropped GTSDB signs covering 38 of the 43 target classes. Several represented classes have very low support, and the experiment does not evaluate a complete scene-level detection-and-classification system. The external metrics therefore provide limited cross-dataset evidence rather than comprehensive real-world validation. Third, the corruption experiments use controlled synthetic degradations. Central occlusion intentionally represents a targeted worst-case condition, while random occlusion provides a less targeted comparison; neither protocol fully captures natural obstruction by vehicles, vegetation, poles, weather, or complex backgrounds. Fourth, the knowledge distillation analysis considers one teacher–student architecture and one prespecified main hyperparameter configuration. The sensitivity analysis is local and does not establish a globally optimal temperature or loss weighting. Distillation also did not provide a consistent calibration advantage across seeds. Fifth, Grad-CAM center concentration is a descriptive spatial measure and was not validated against human expert judgments or perturbation-based faithfulness tests. It should not be interpreted as a direct measure of explanation quality. Finally, computational measurements depend on the software and hardware environment and may not transfer directly to embedded processors, automotive accelerators, or edge devices. Future work should include additional geographic datasets, naturally degraded traffic scenes, hardware-specific profiling, broader distillation and attention configurations, and human- or perturbation-based explanation validation.
6. Conclusions
This study presented a reliability-oriented comparative evaluation of BaselineCNN, ResNet18, MobileNetV2, MobileNetV2 + CBAM, and knowledge-distilled MobileNetV2 for traffic sign classification. The models were evaluated on GTSRB, with additional external validation using cropped traffic sign samples from GTSDB. Unlike a conventional clean-accuracy comparison, the proposed framework considered statistical significance, calibration reliability, severity-wise robustness, external generalization, computational efficiency, and Grad-CAM based interpretability. The results showed that ResNet18 and MobileNetV2 + CBAM achieved the strongest clean GTSRB performance, while their difference was not statistically significant. ResNet18 also provided the strongest external generalization to GTSDB and showed highly reliable calibration. MobileNetV2 remained a competitive compact model, whereas BaselineCNN was weaker in both predictive performance and confidence reliability. The robustness analysis showed that occlusion was the most damaging degradation across all models, followed by blur, while low-light degradation was comparatively more manageable for the stronger architectures. These findings confirm that robustness should be evaluated separately for different degradation types rather than treated as a single general model property. The CBAM and knowledge-distillation results provided a more balanced view of model enhancement strategies. CBAM improved clean performance and some robustness behavior, particularly under blur, but its benefits were condition-dependent and did not automatically improve external transfer. Knowledge-distilled MobileNetV2 offered a compact alternative, but it did not consistently outperform standard MobileNetV2 across all evaluation dimensions. Grad-CAM analysis showed that correct predictions were generally associated with focused activation on traffic sign regions, while failure cases often involved diffuse or misplaced attention toward background structures. Overall, the study demonstrates that traffic sign classifiers should be evaluated using a multi-dimensional reliability framework that jointly considers accuracy, statistical evidence, calibration, robustness, generalization, efficiency, and interpretability. Future work should extend this framework to additional traffic sign datasets, naturally degraded images, more diverse weather and viewpoint conditions, edge-device deployment, and stronger quantitative explanation metrics.



 ,
,