An RMST-Integrated Machine Learning Framework for Interpretable Survival Analysis Under Non-Proportional Hazards: Application to the METABRIC Cohort


Abstract
1. Introduction
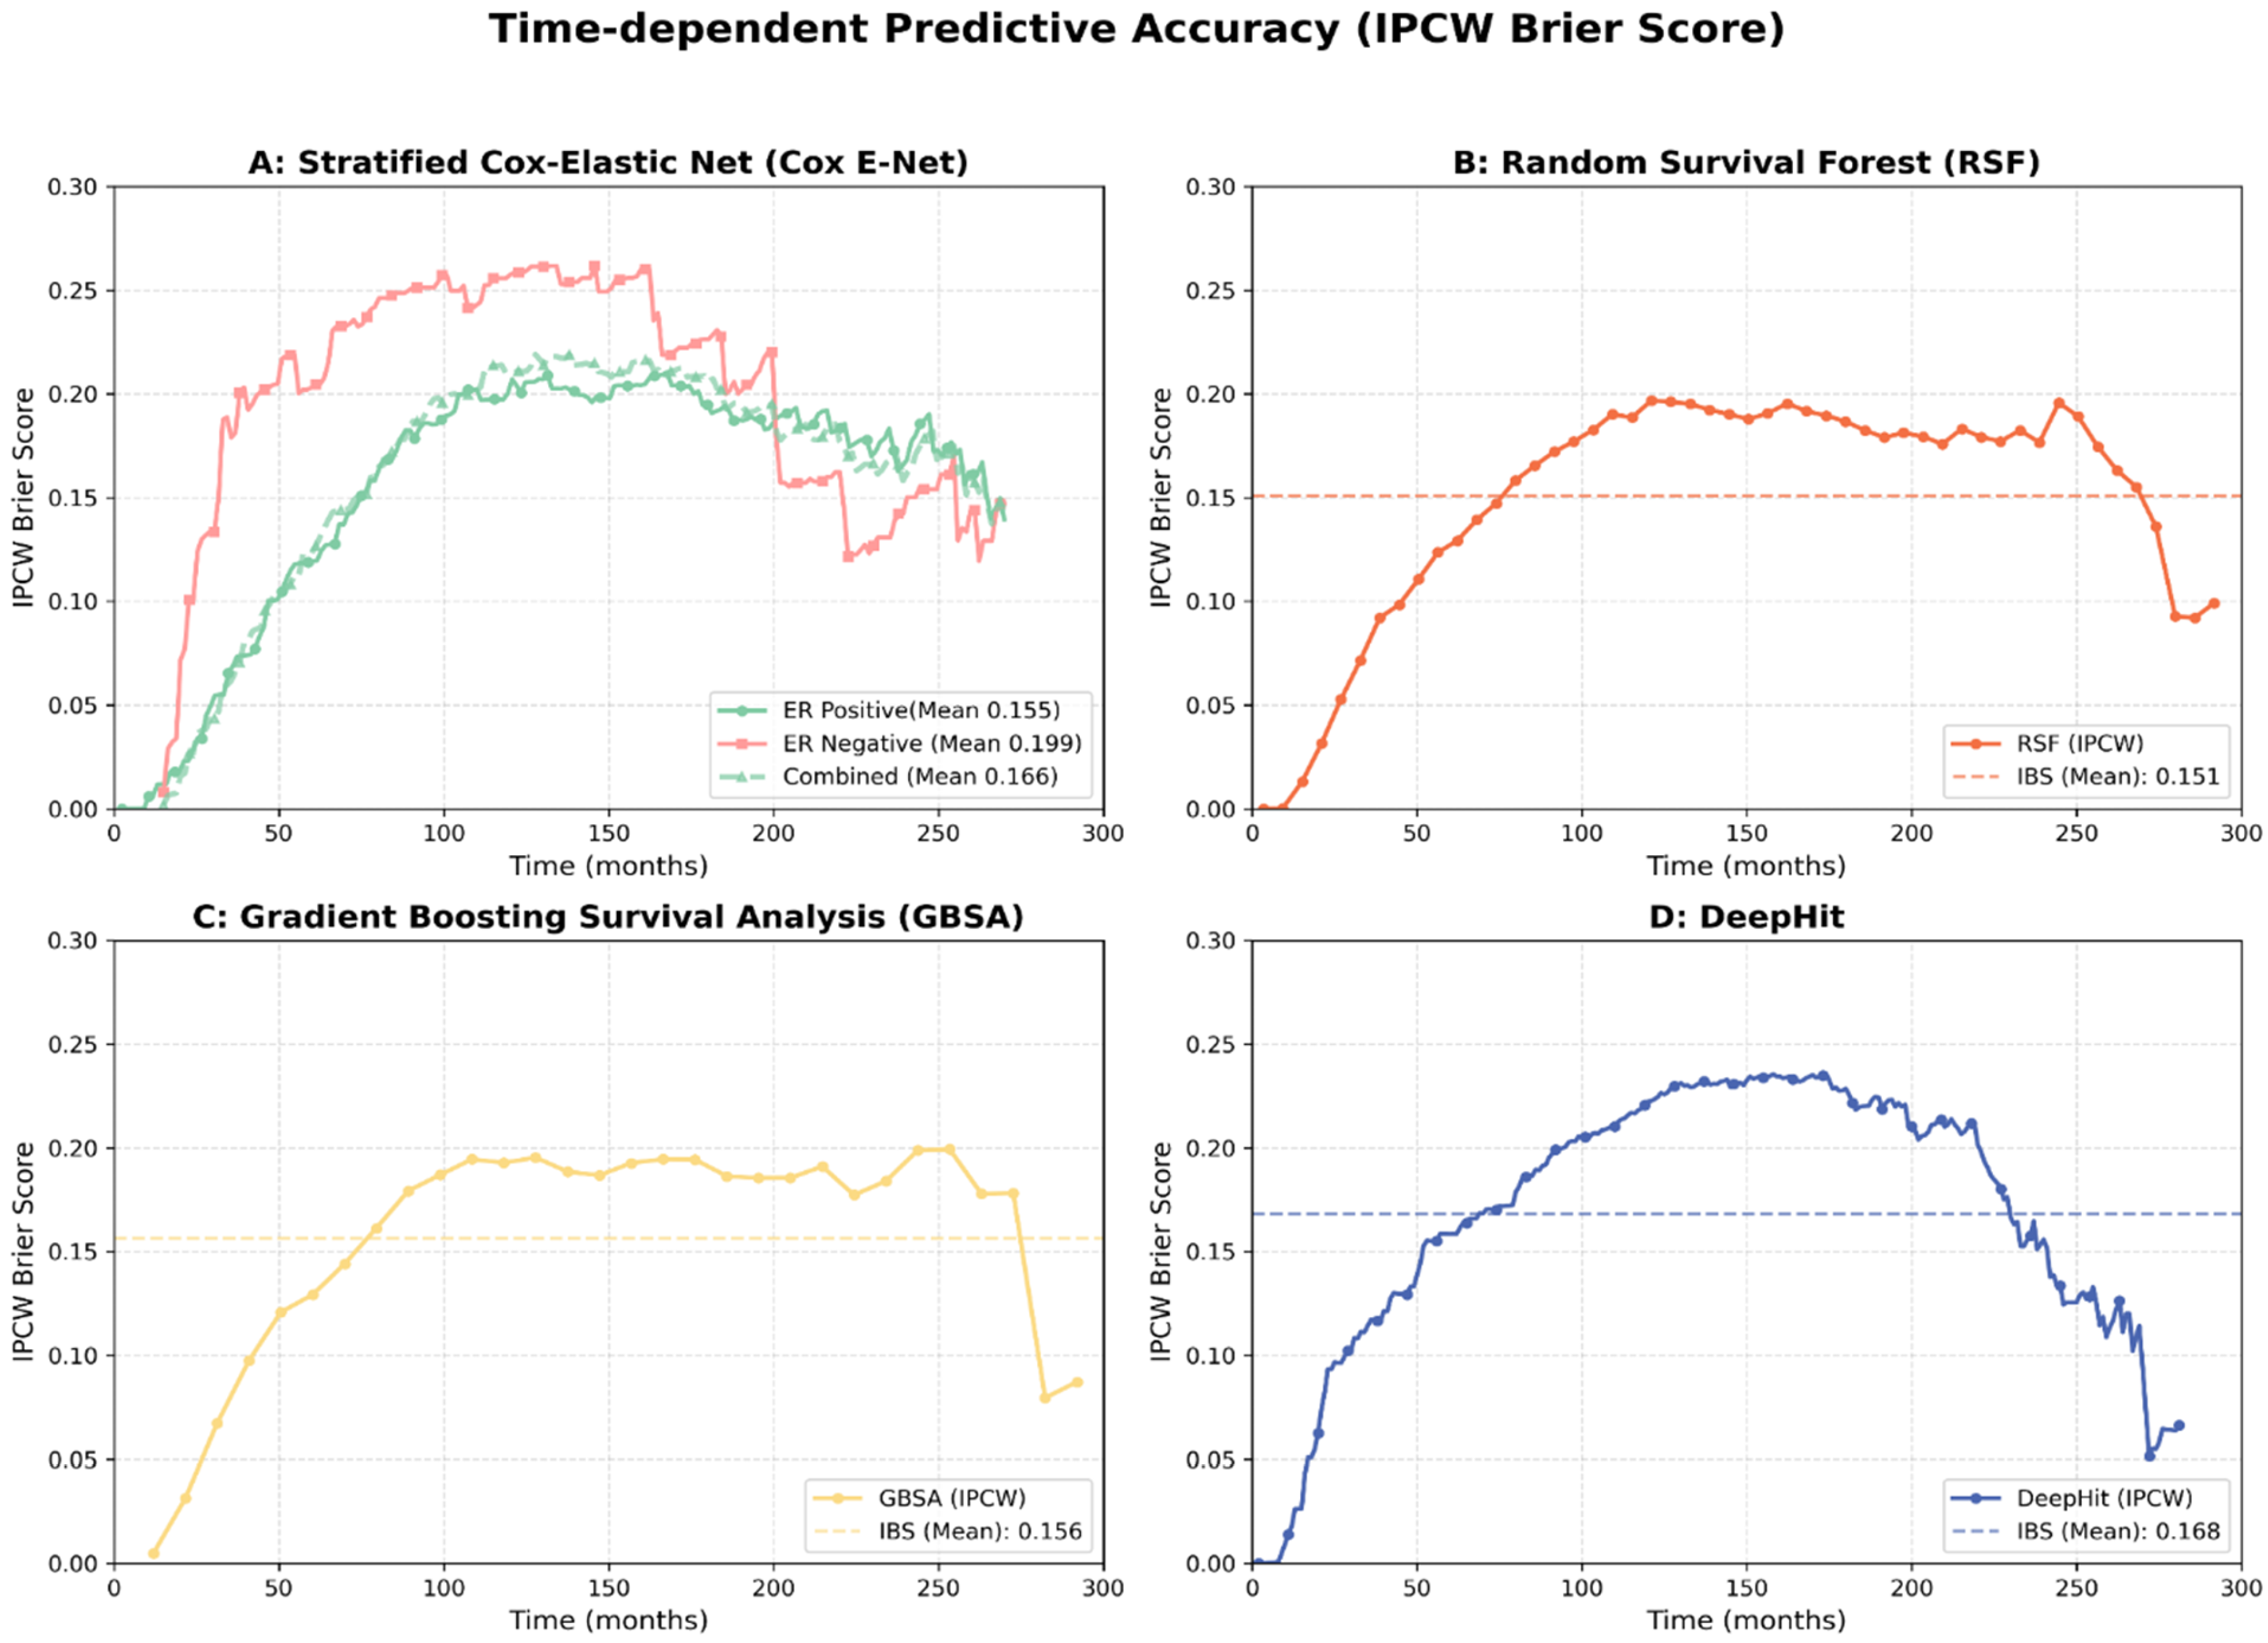
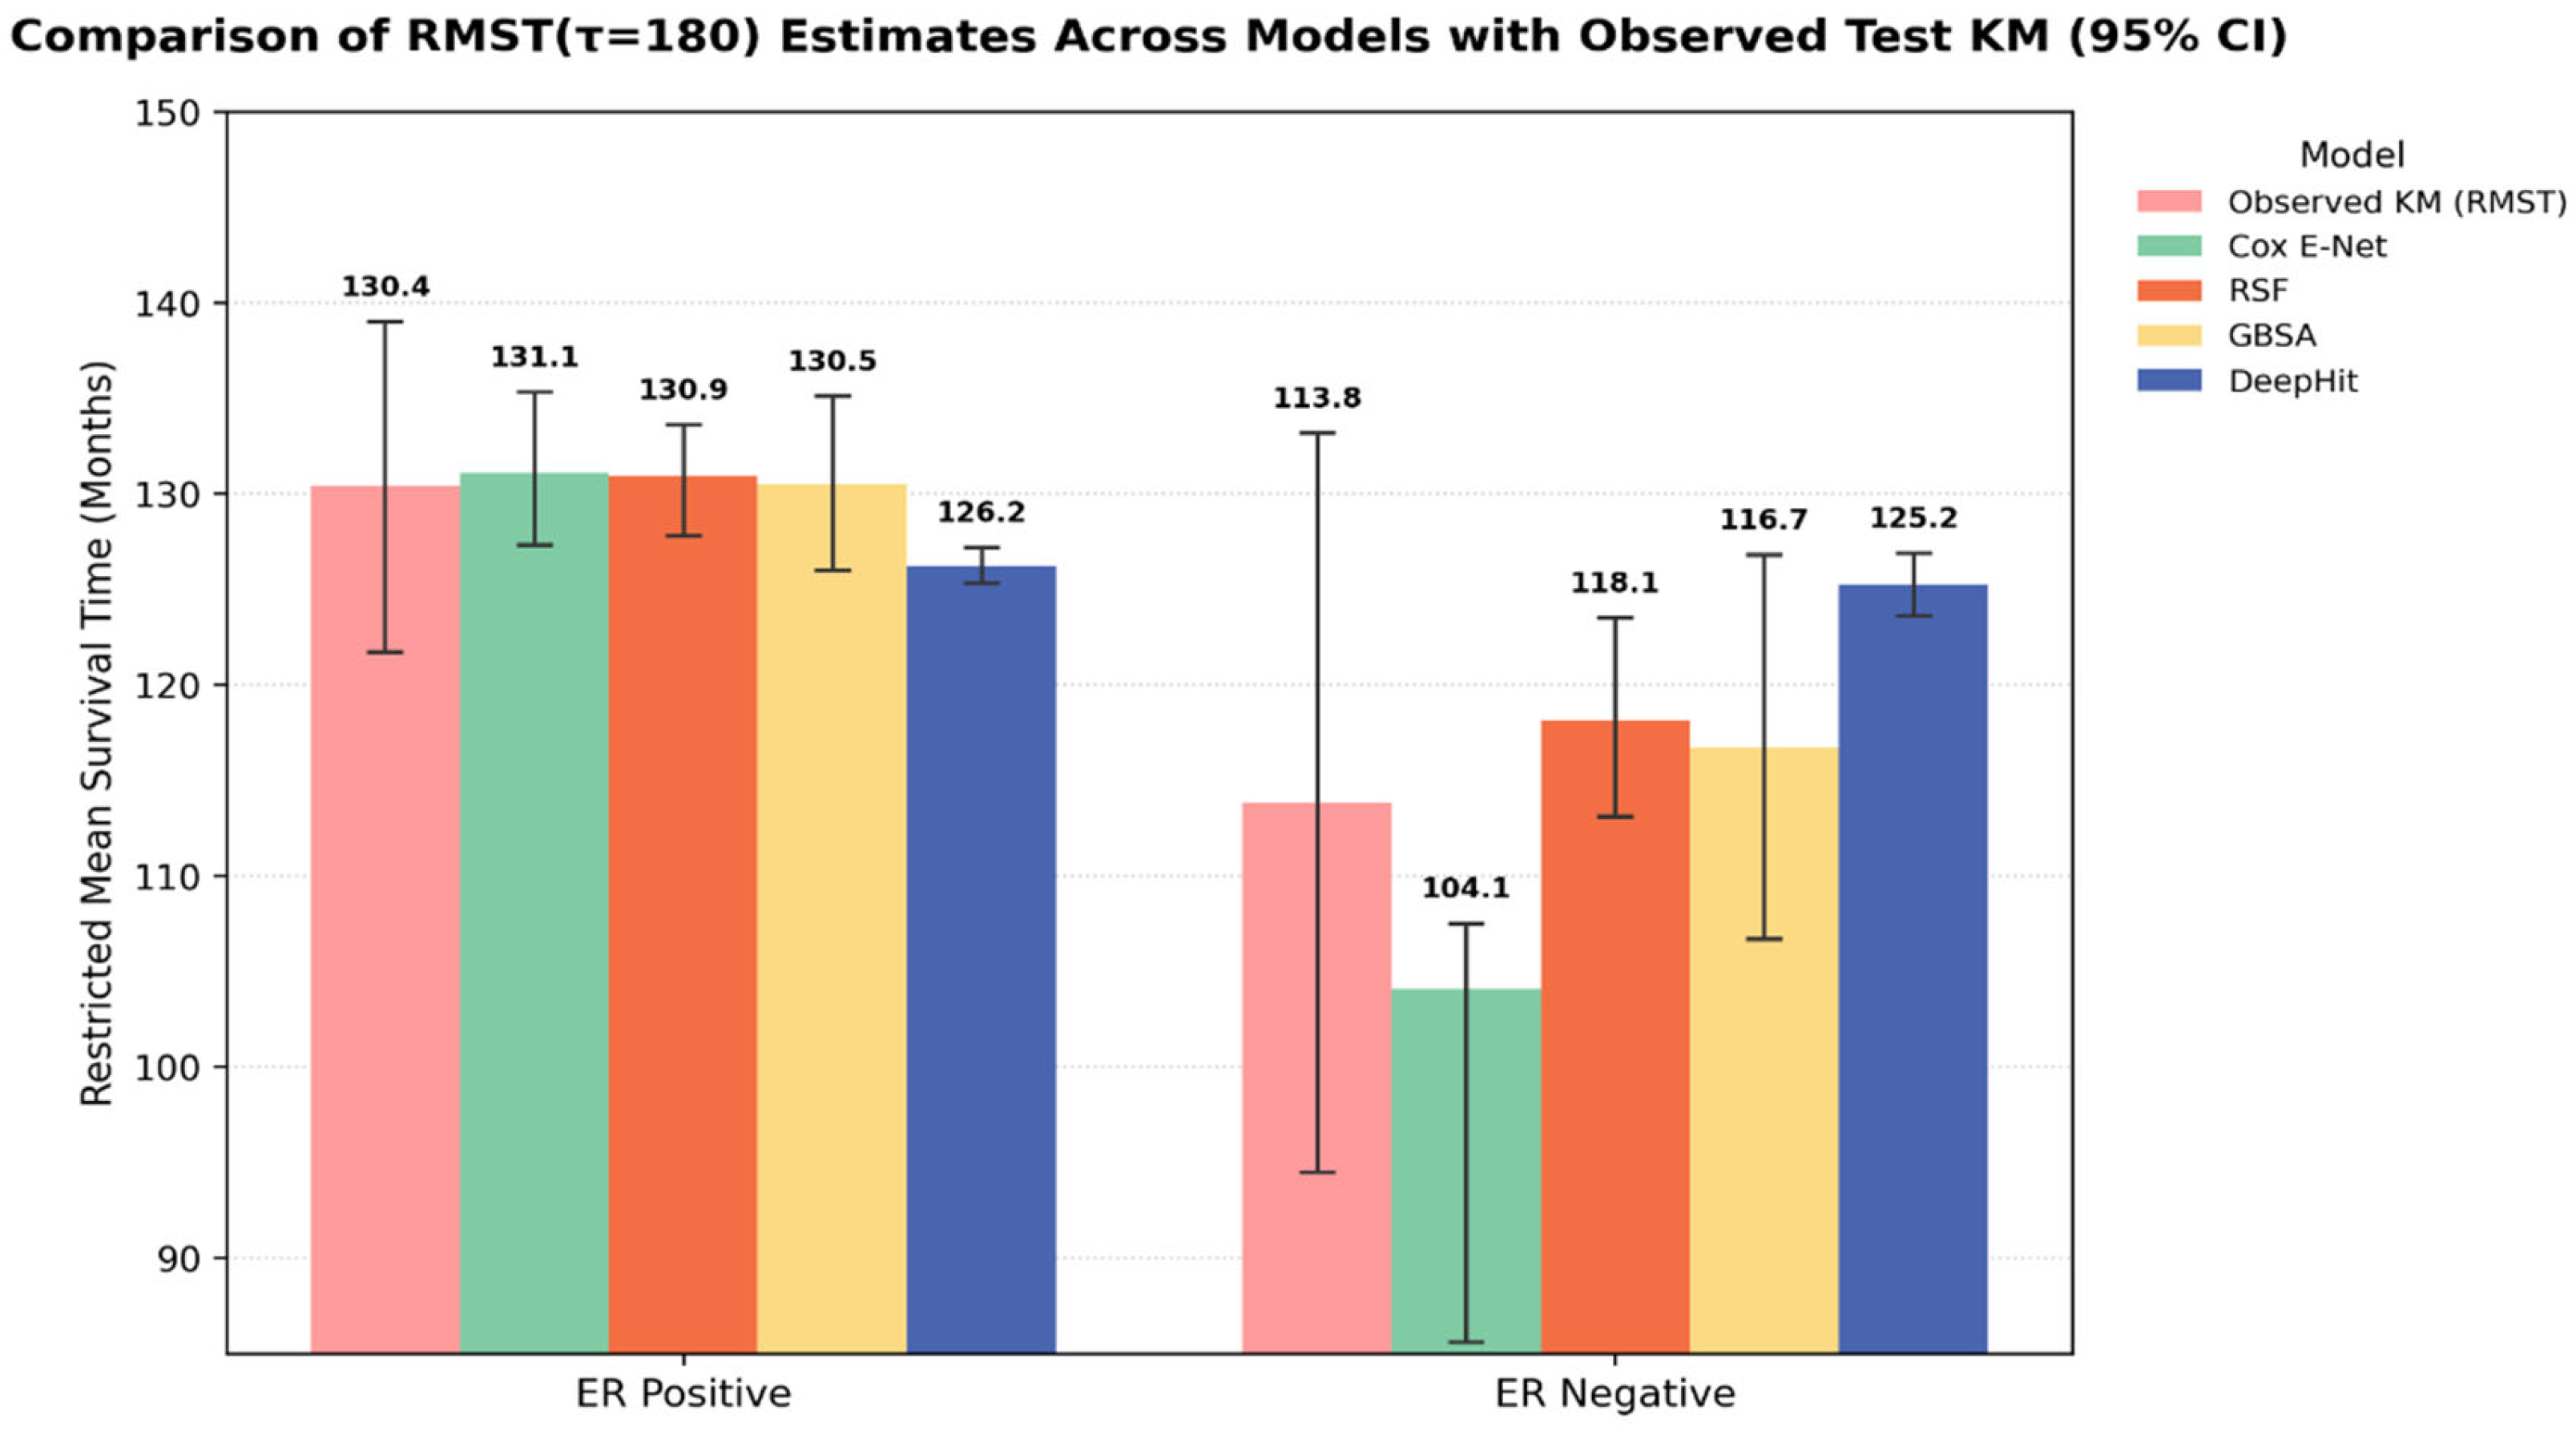
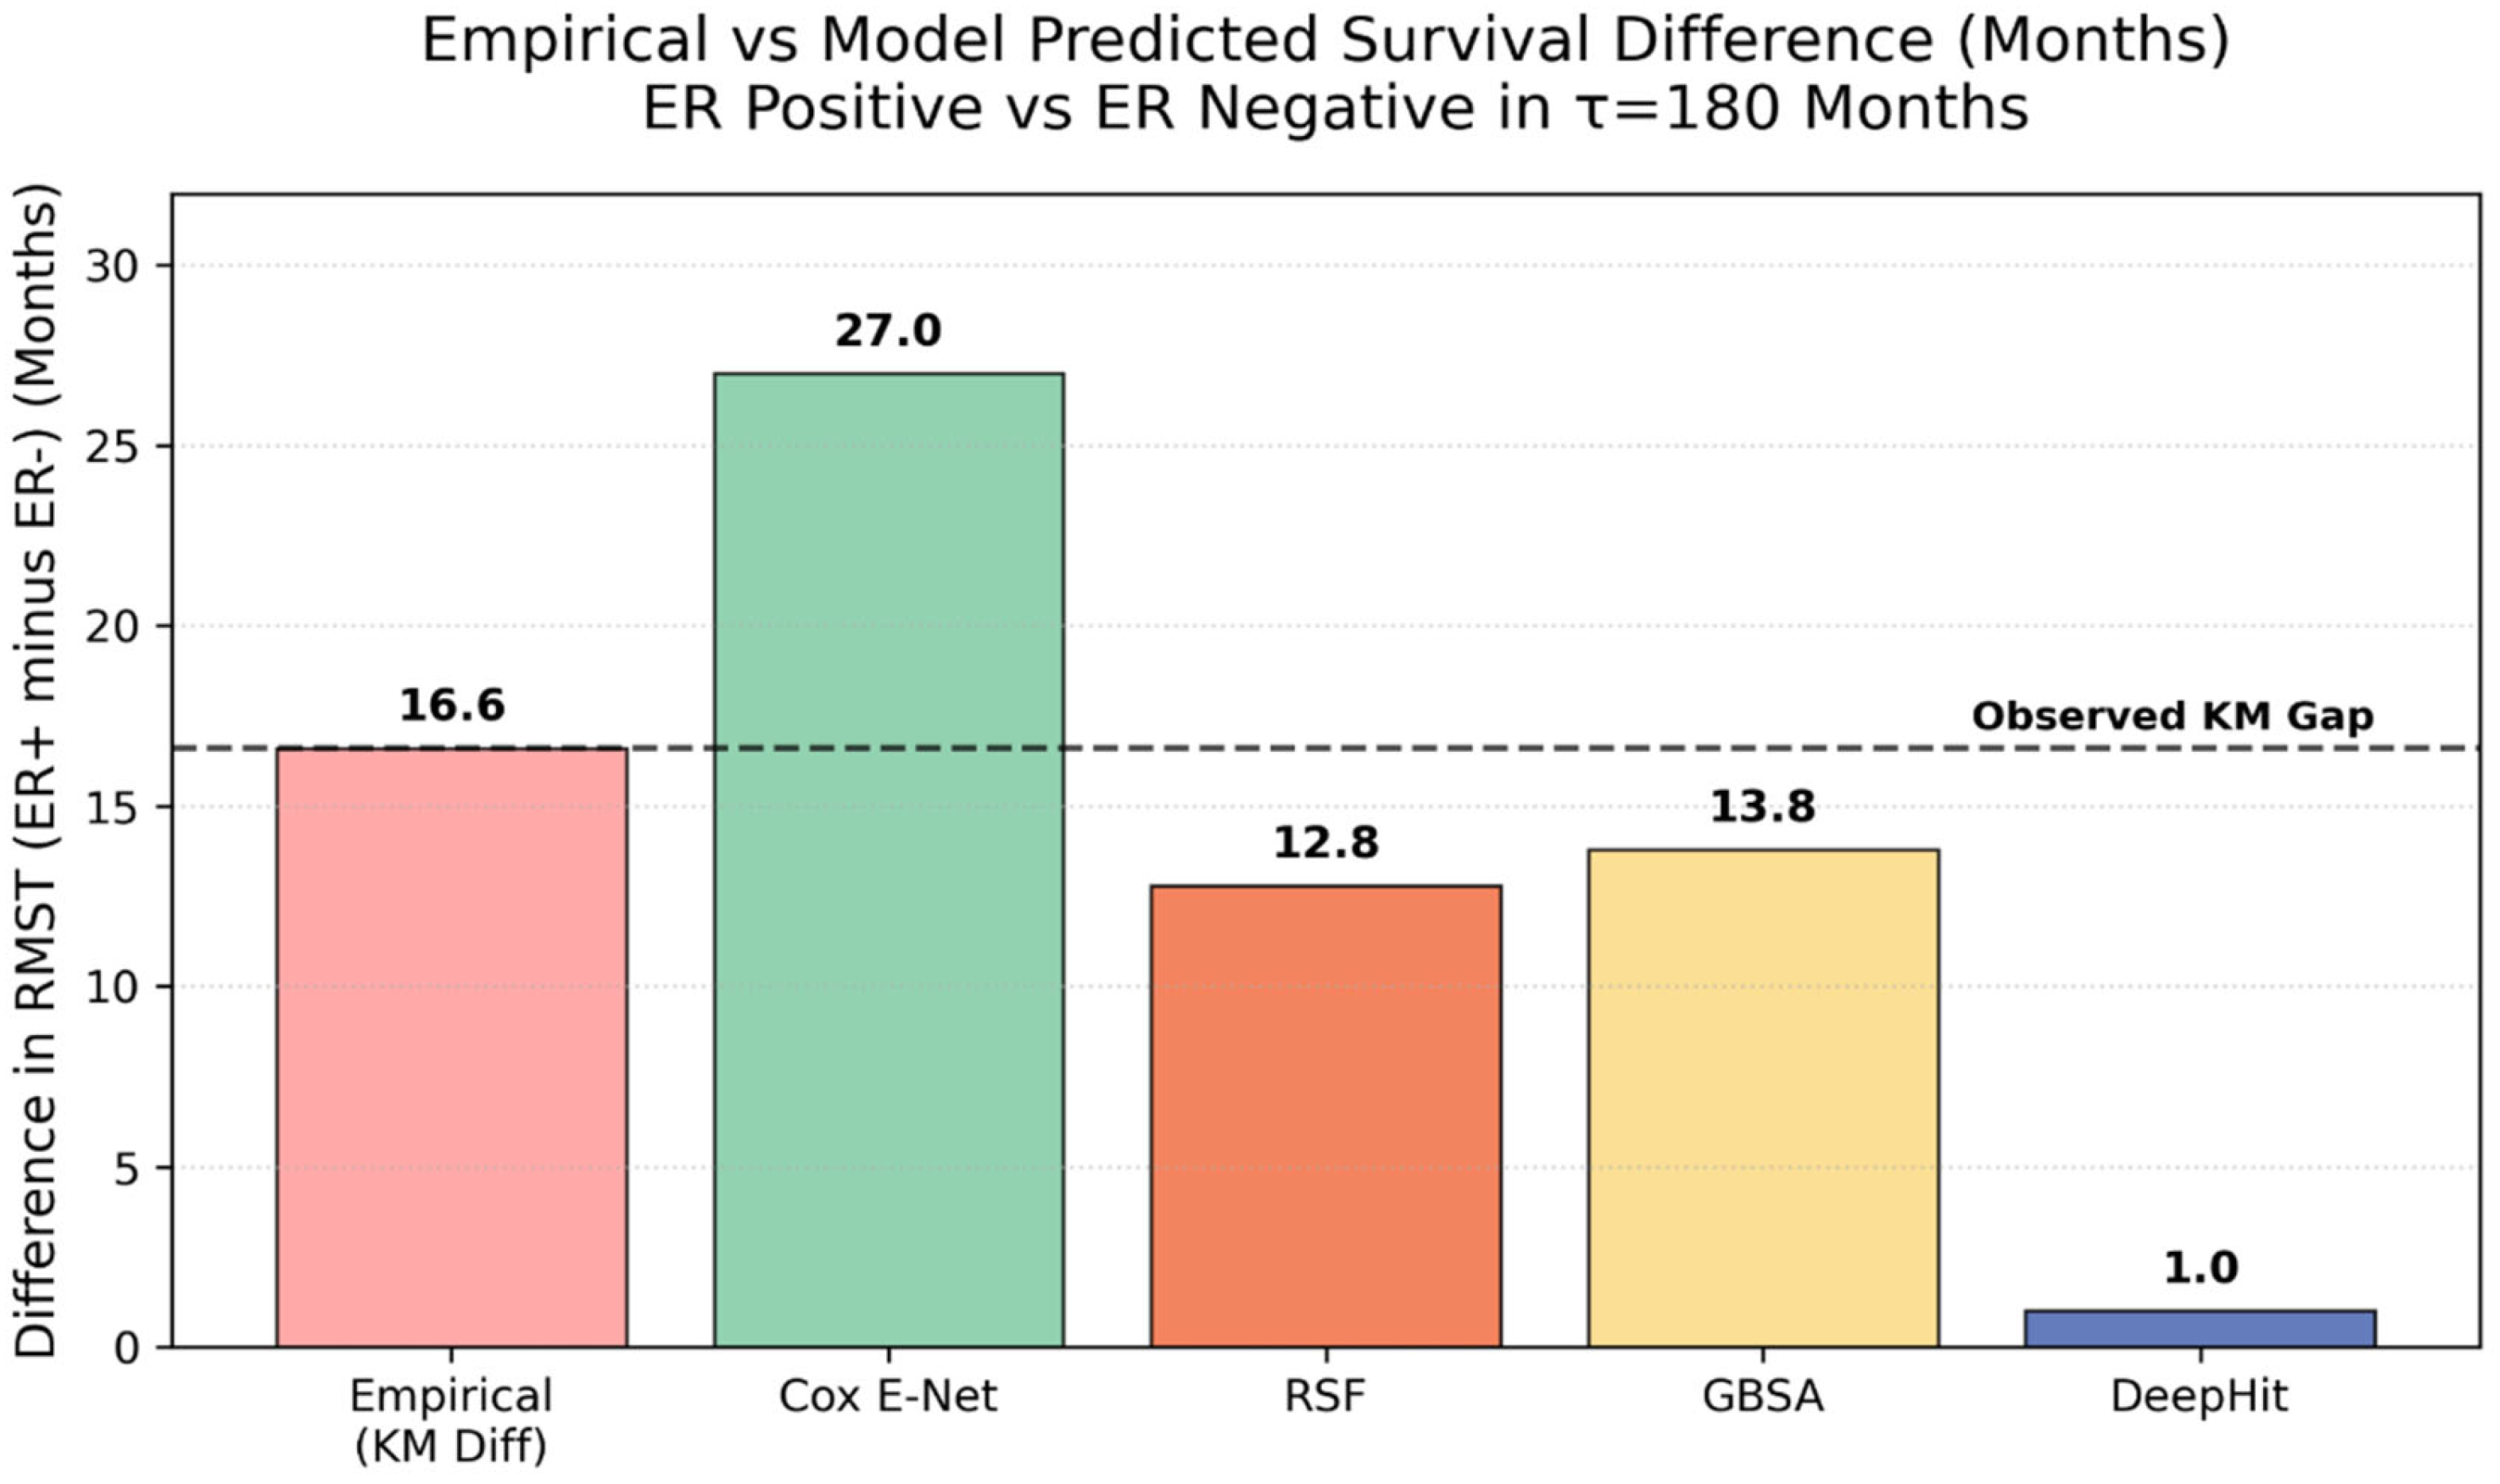
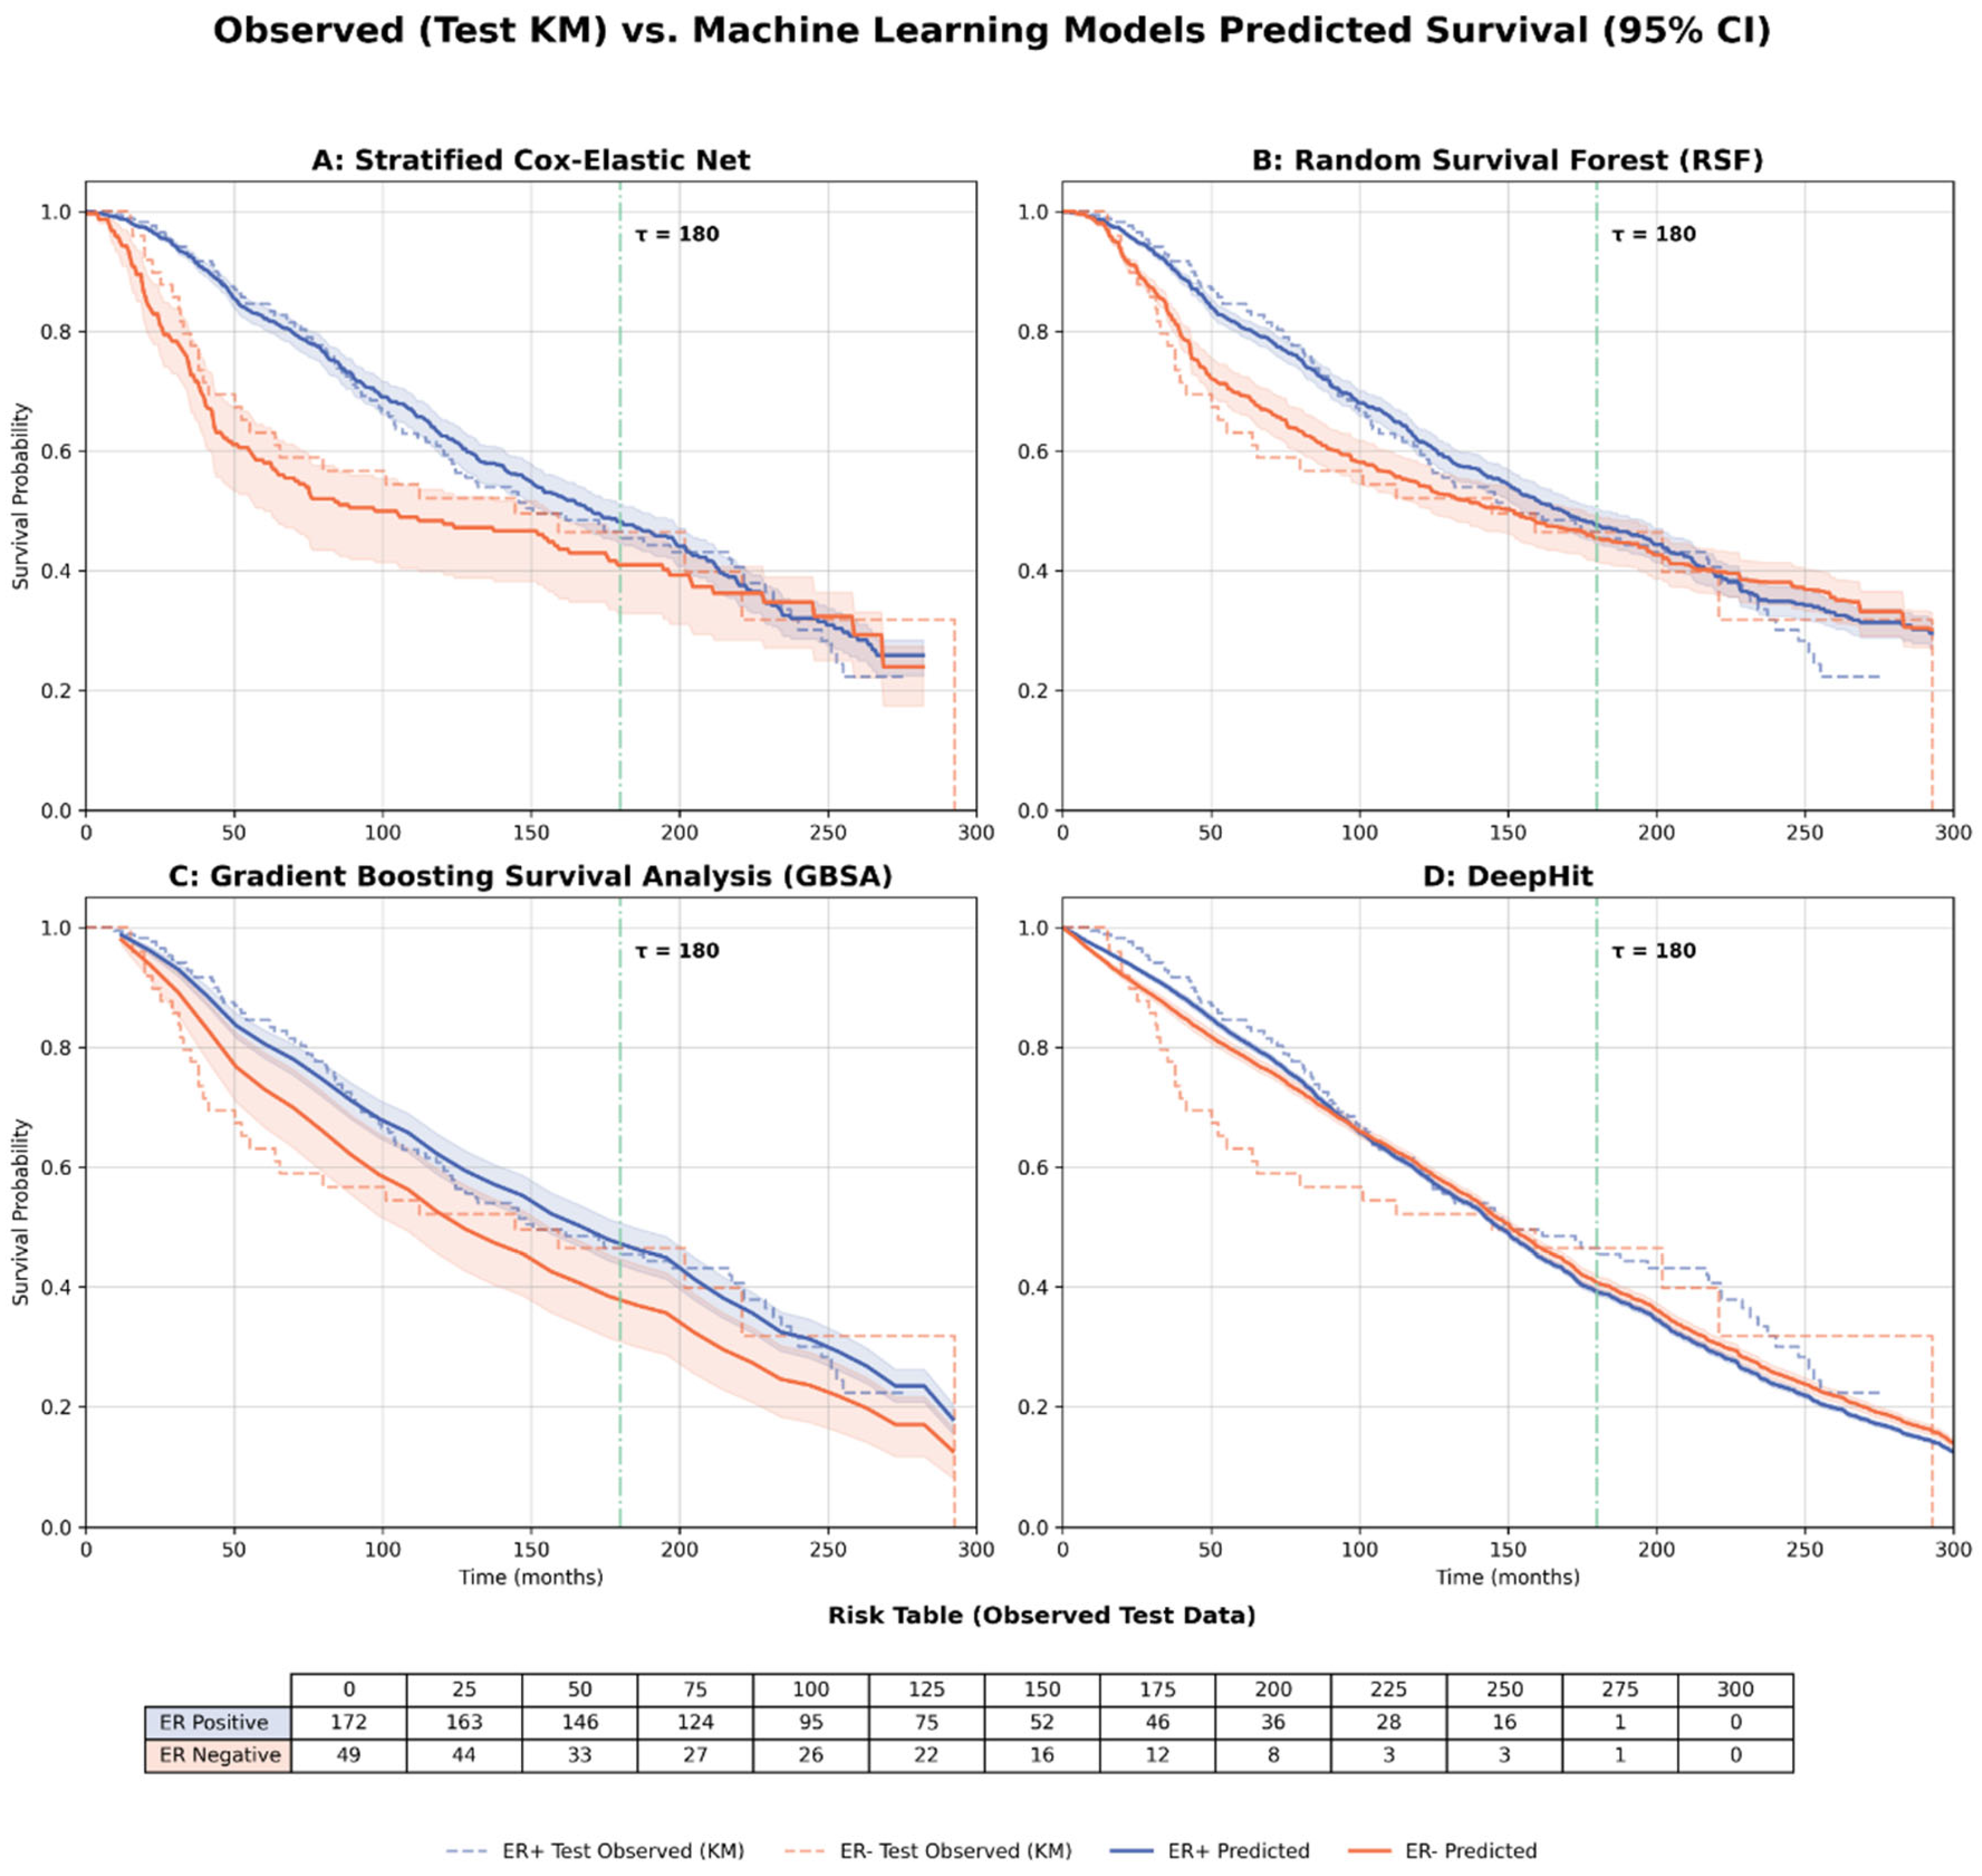
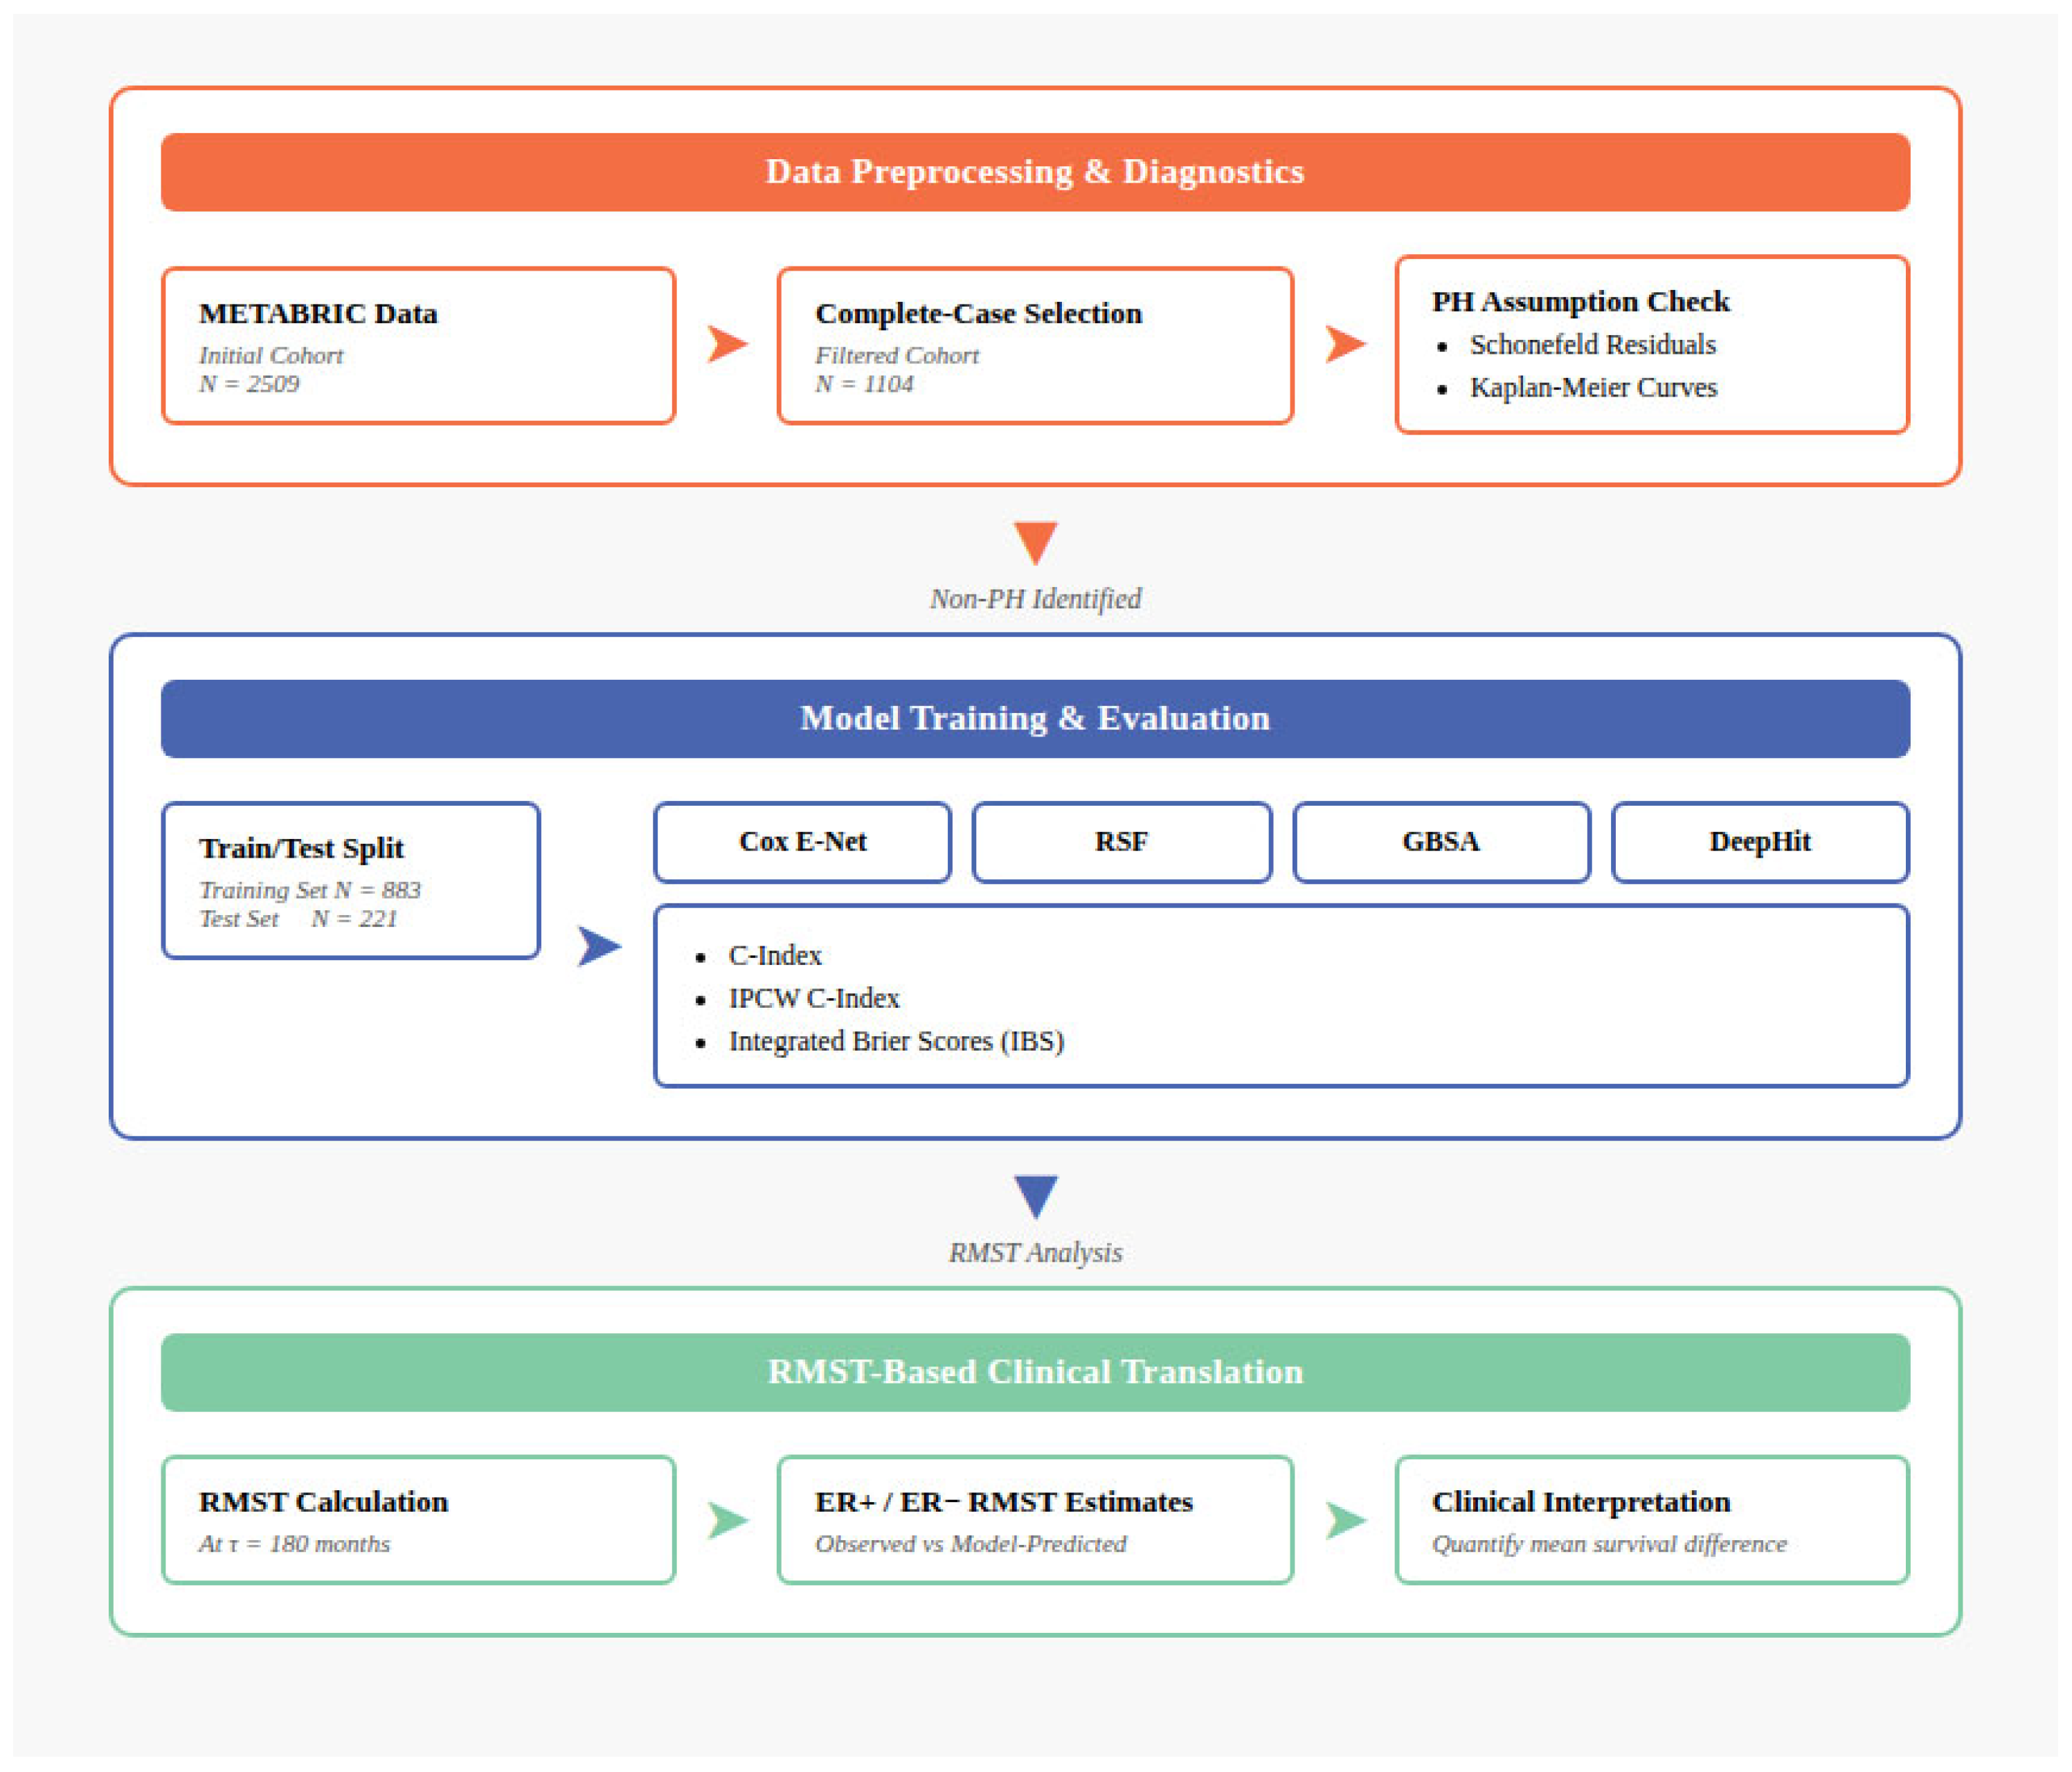
- Practical Application (Interpretability): We calculate the group-mean RMST at τ = 180 values derived from individualized model predictions and compare them with the benchmark RMST observed in the original patient groups [26].
2. Materials and Methods
2.1. Data Preprocessing
2.2. Restriction Time Horizon (τ)
2.3. Modeling Architectures
2.4. Training and Validation Strategy
- Model Predictive Performance.
- 2.
- Clinical Utility and RMST Estimation τ = 180.
3. Results
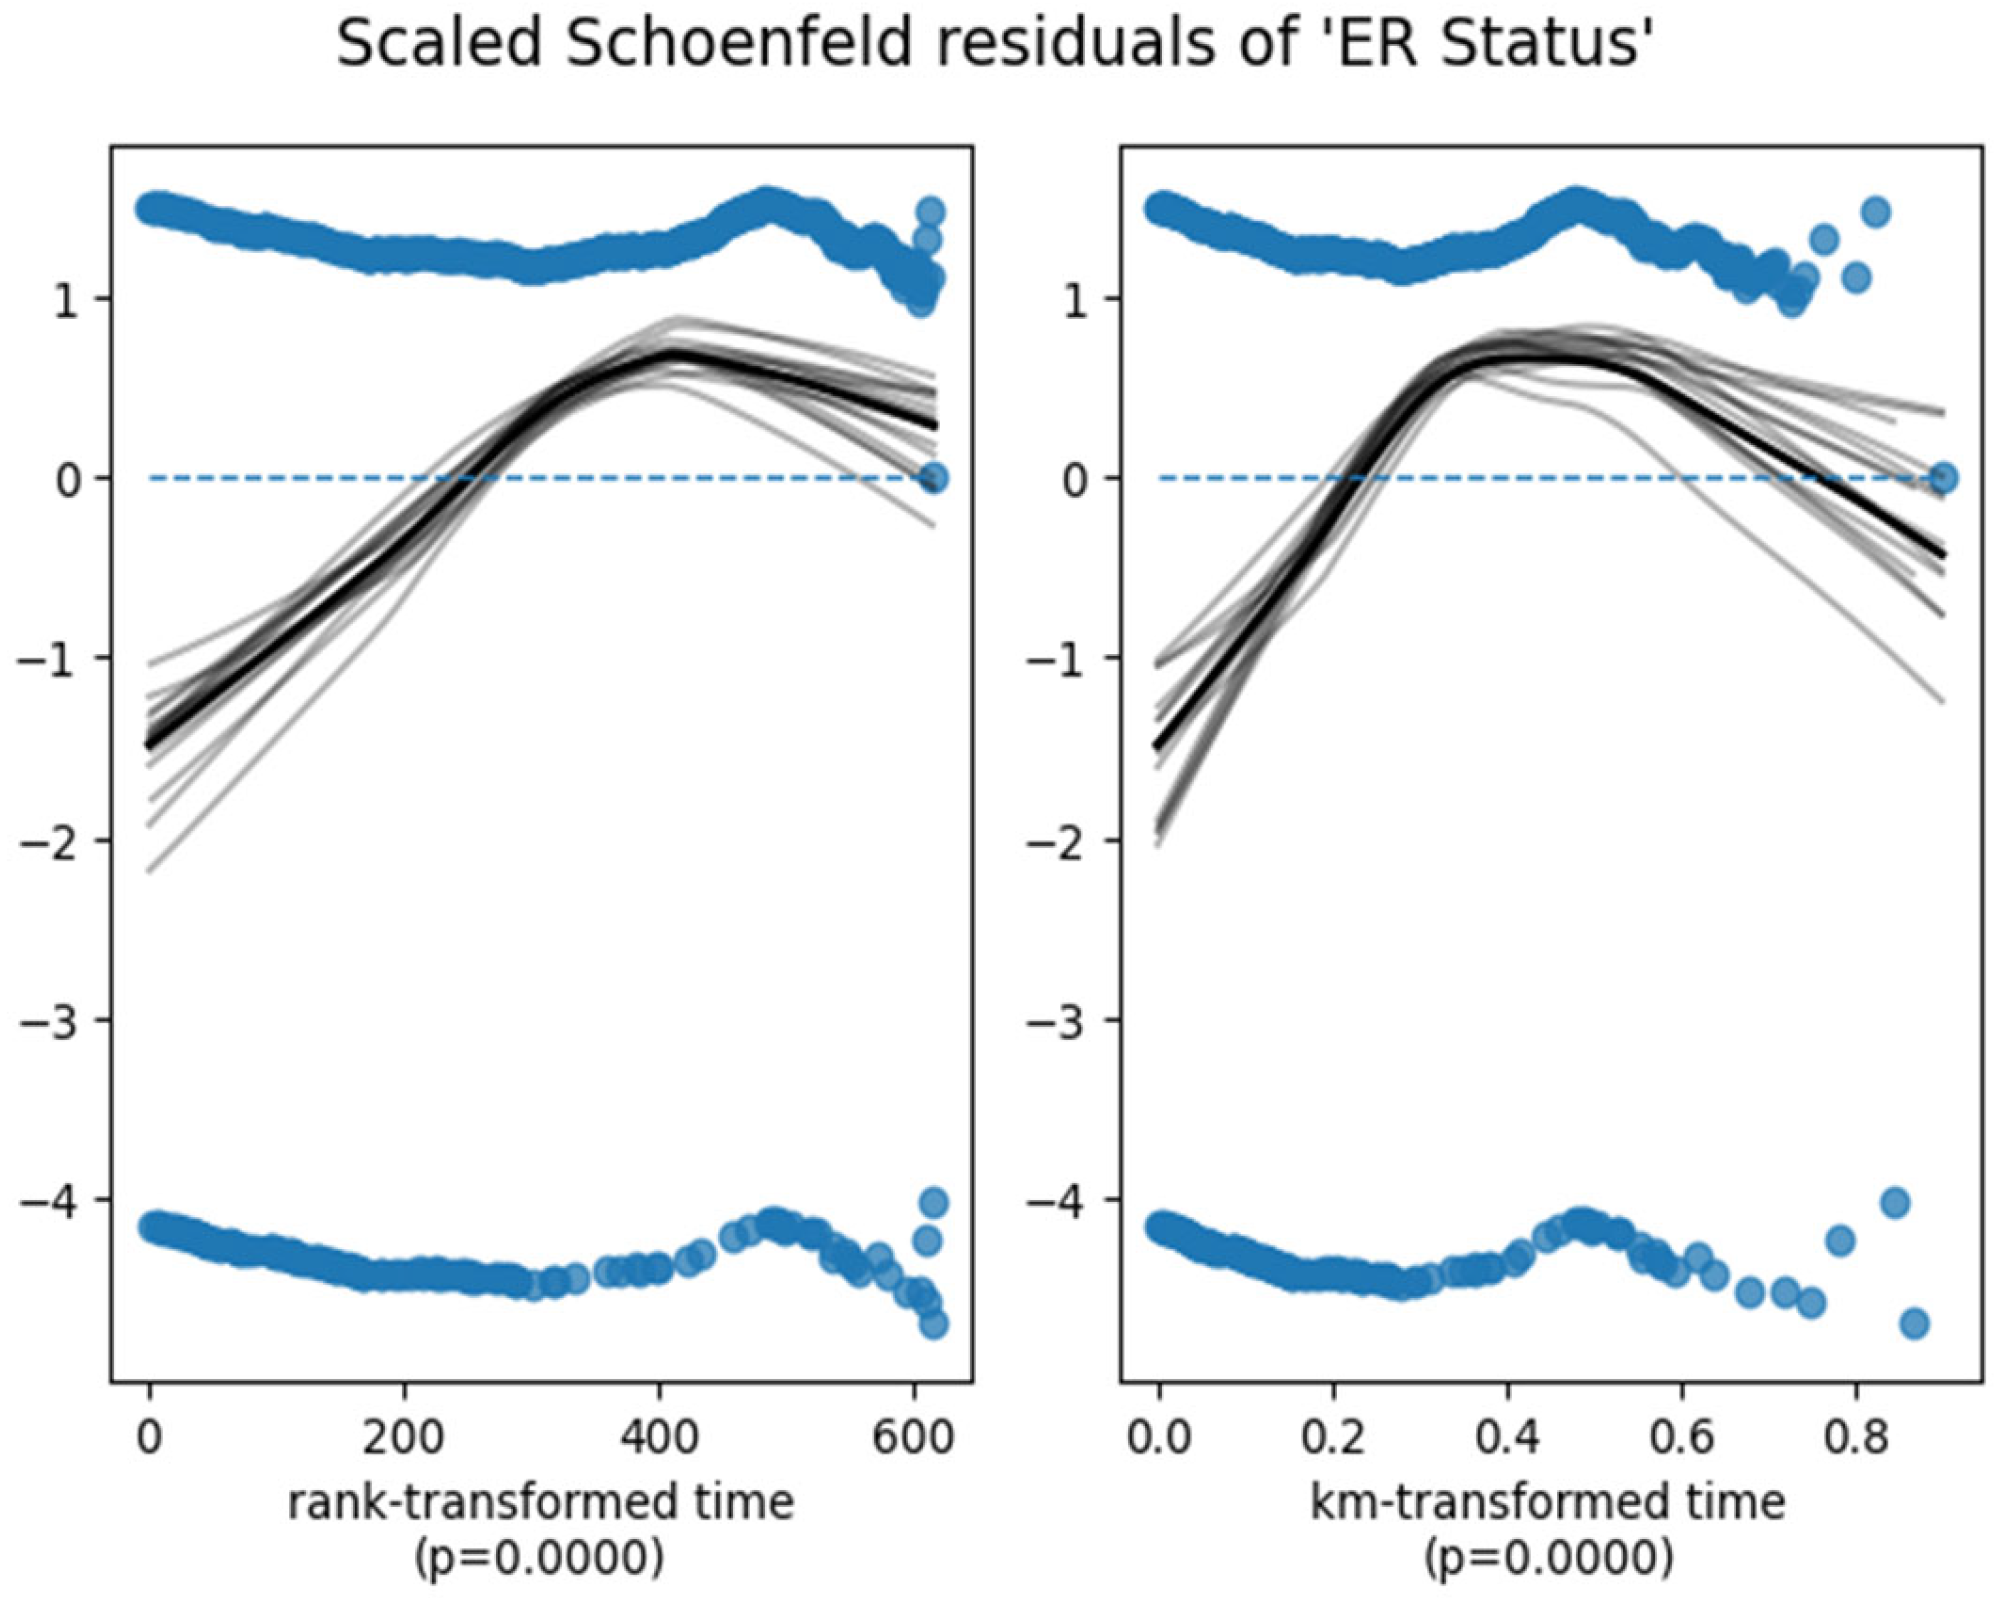
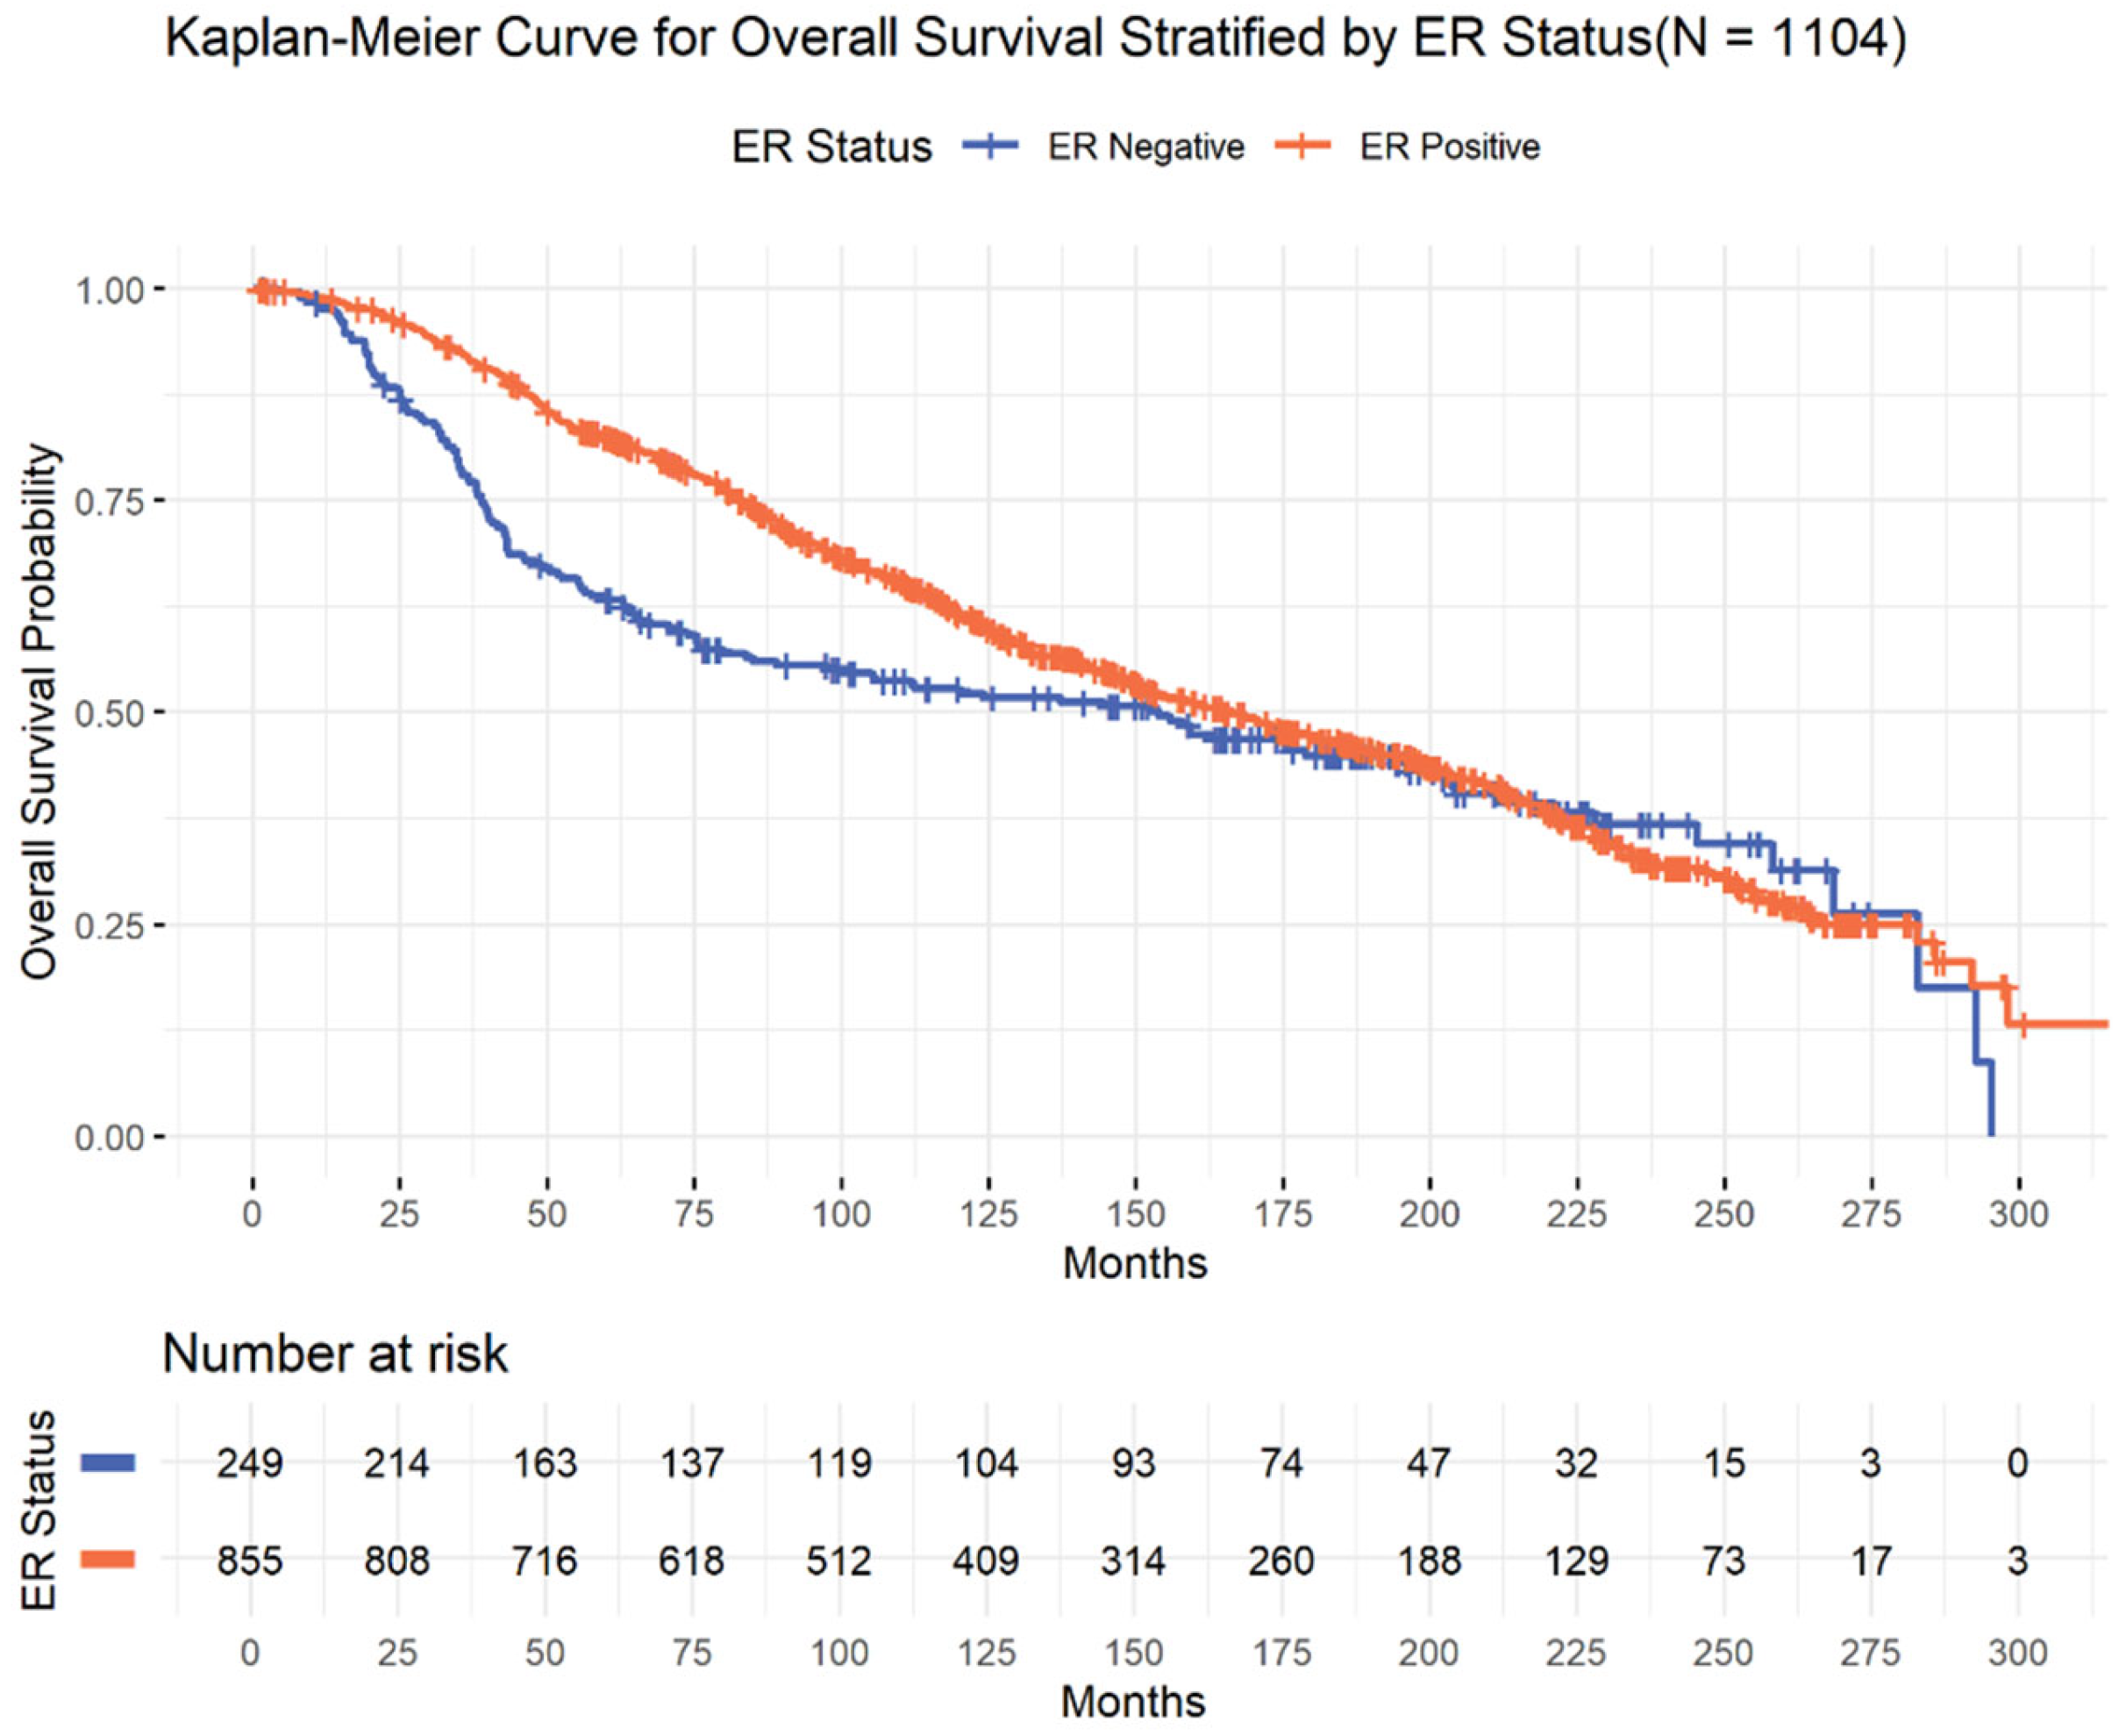
3.1. Assessment of the Proportional Hazard Assumption
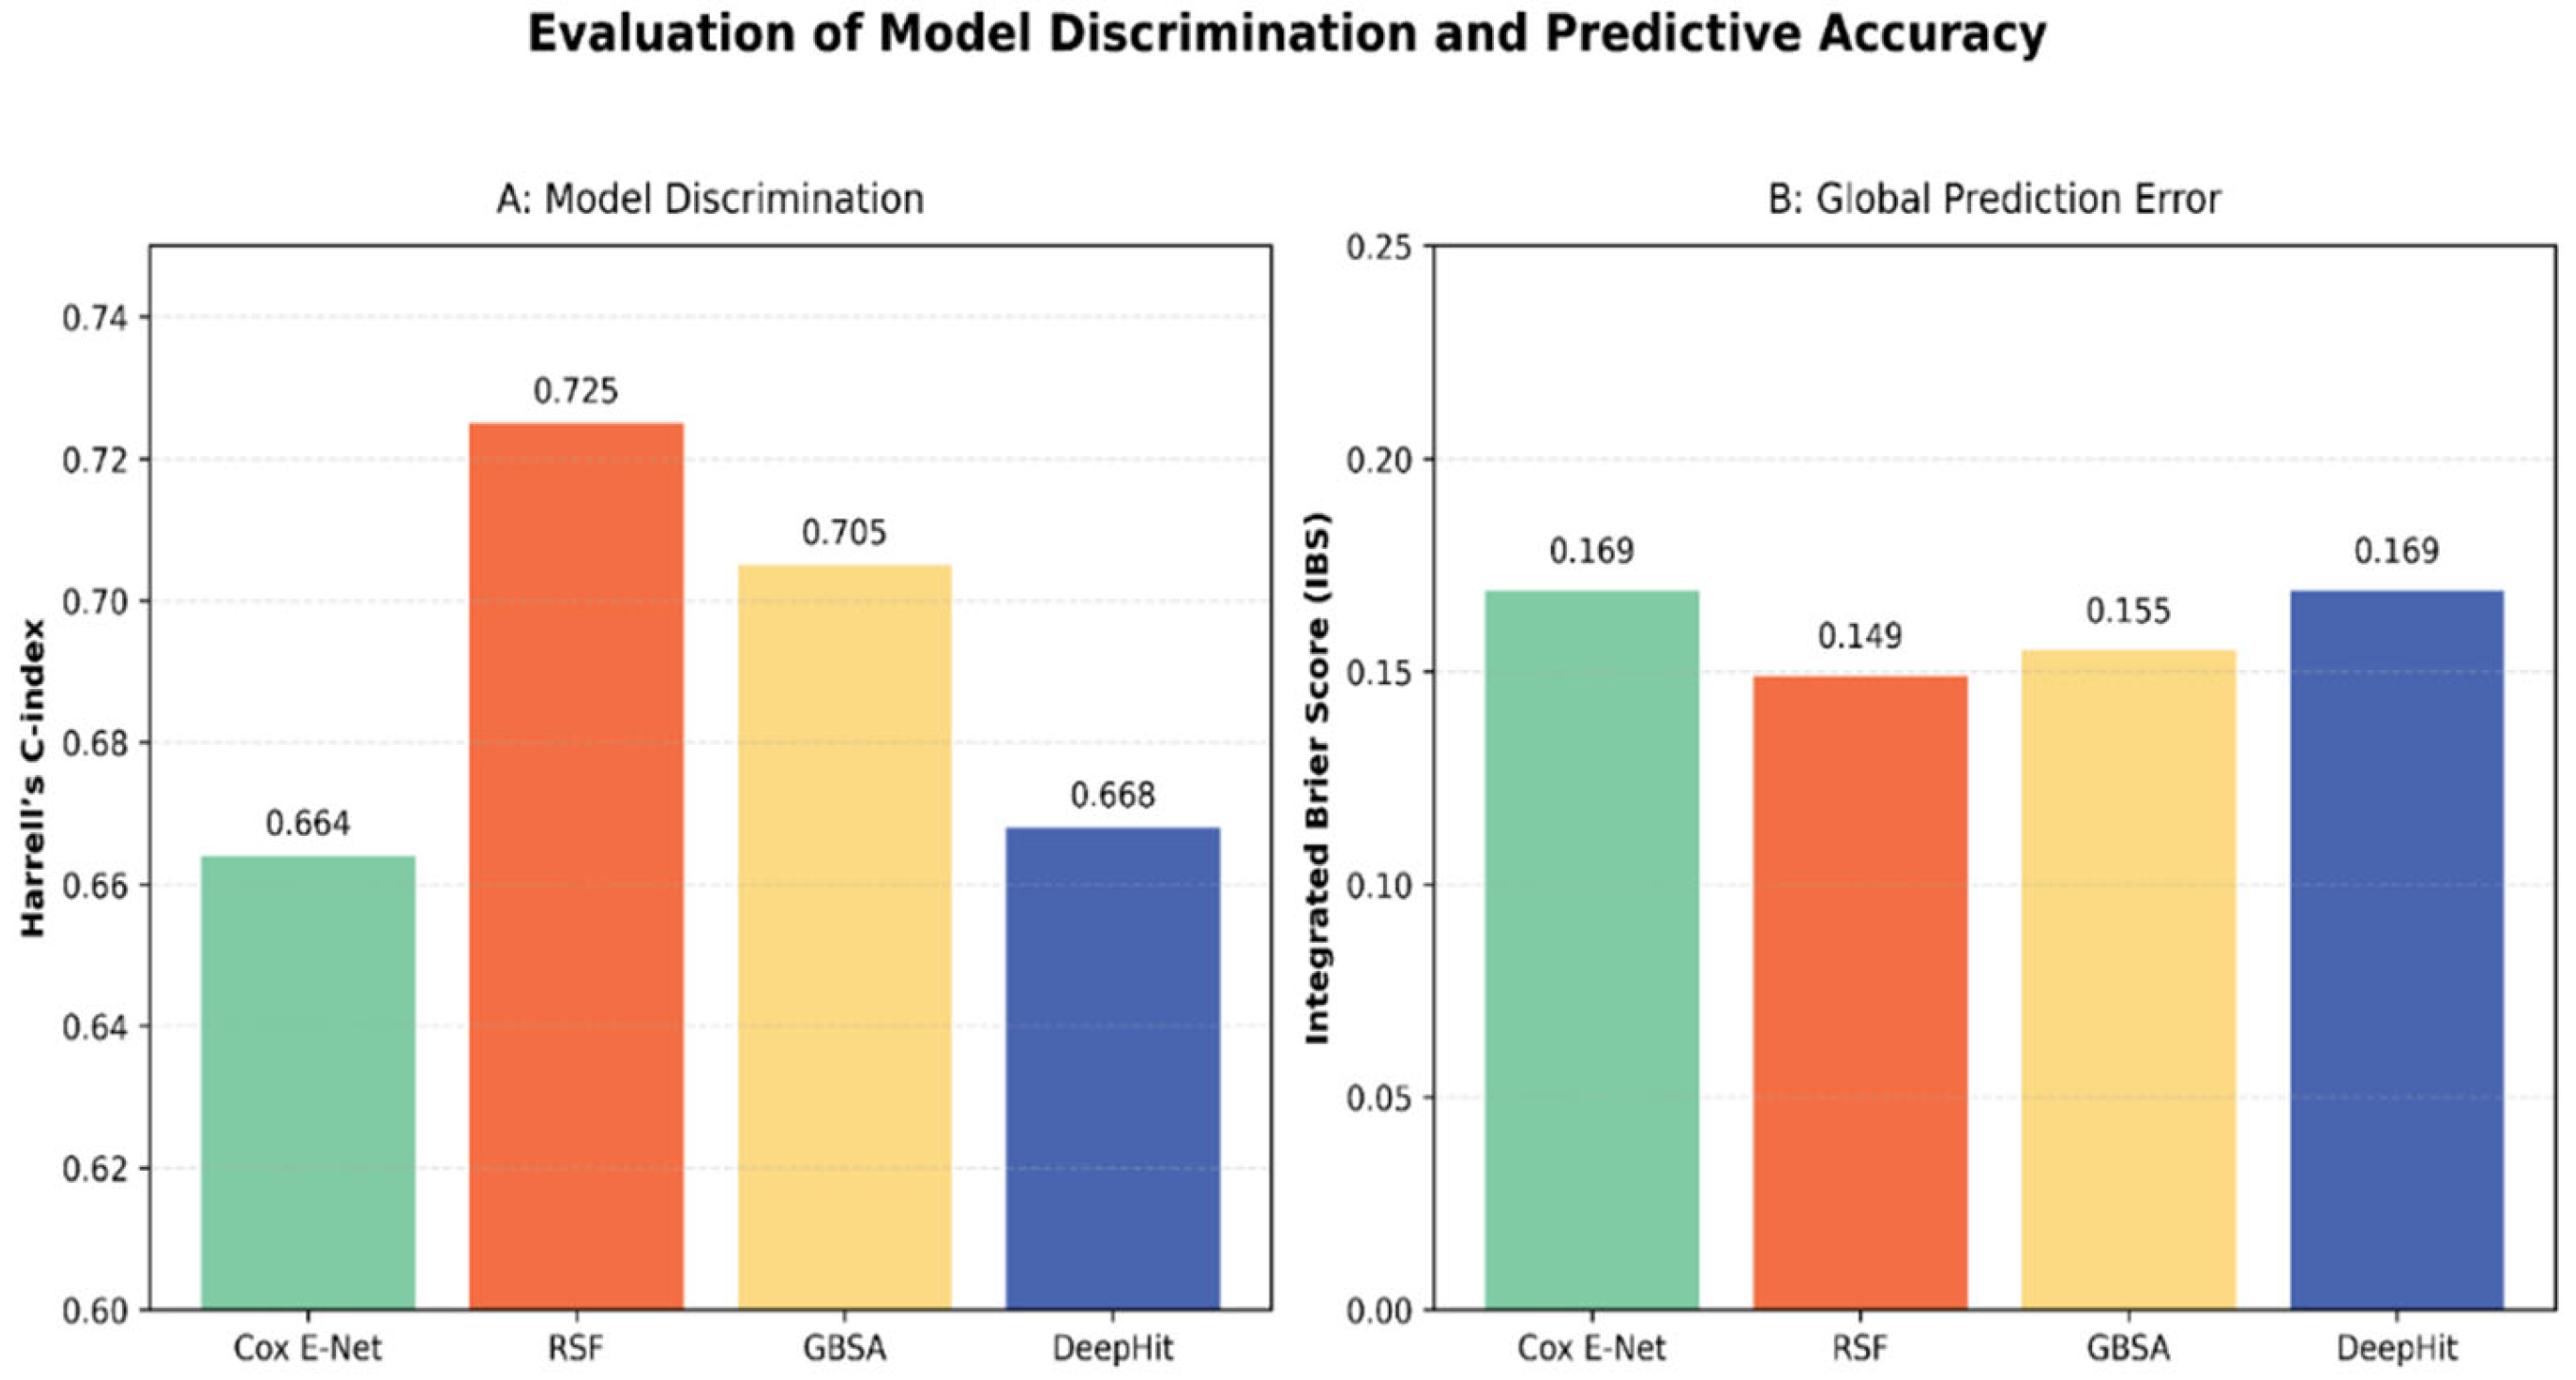
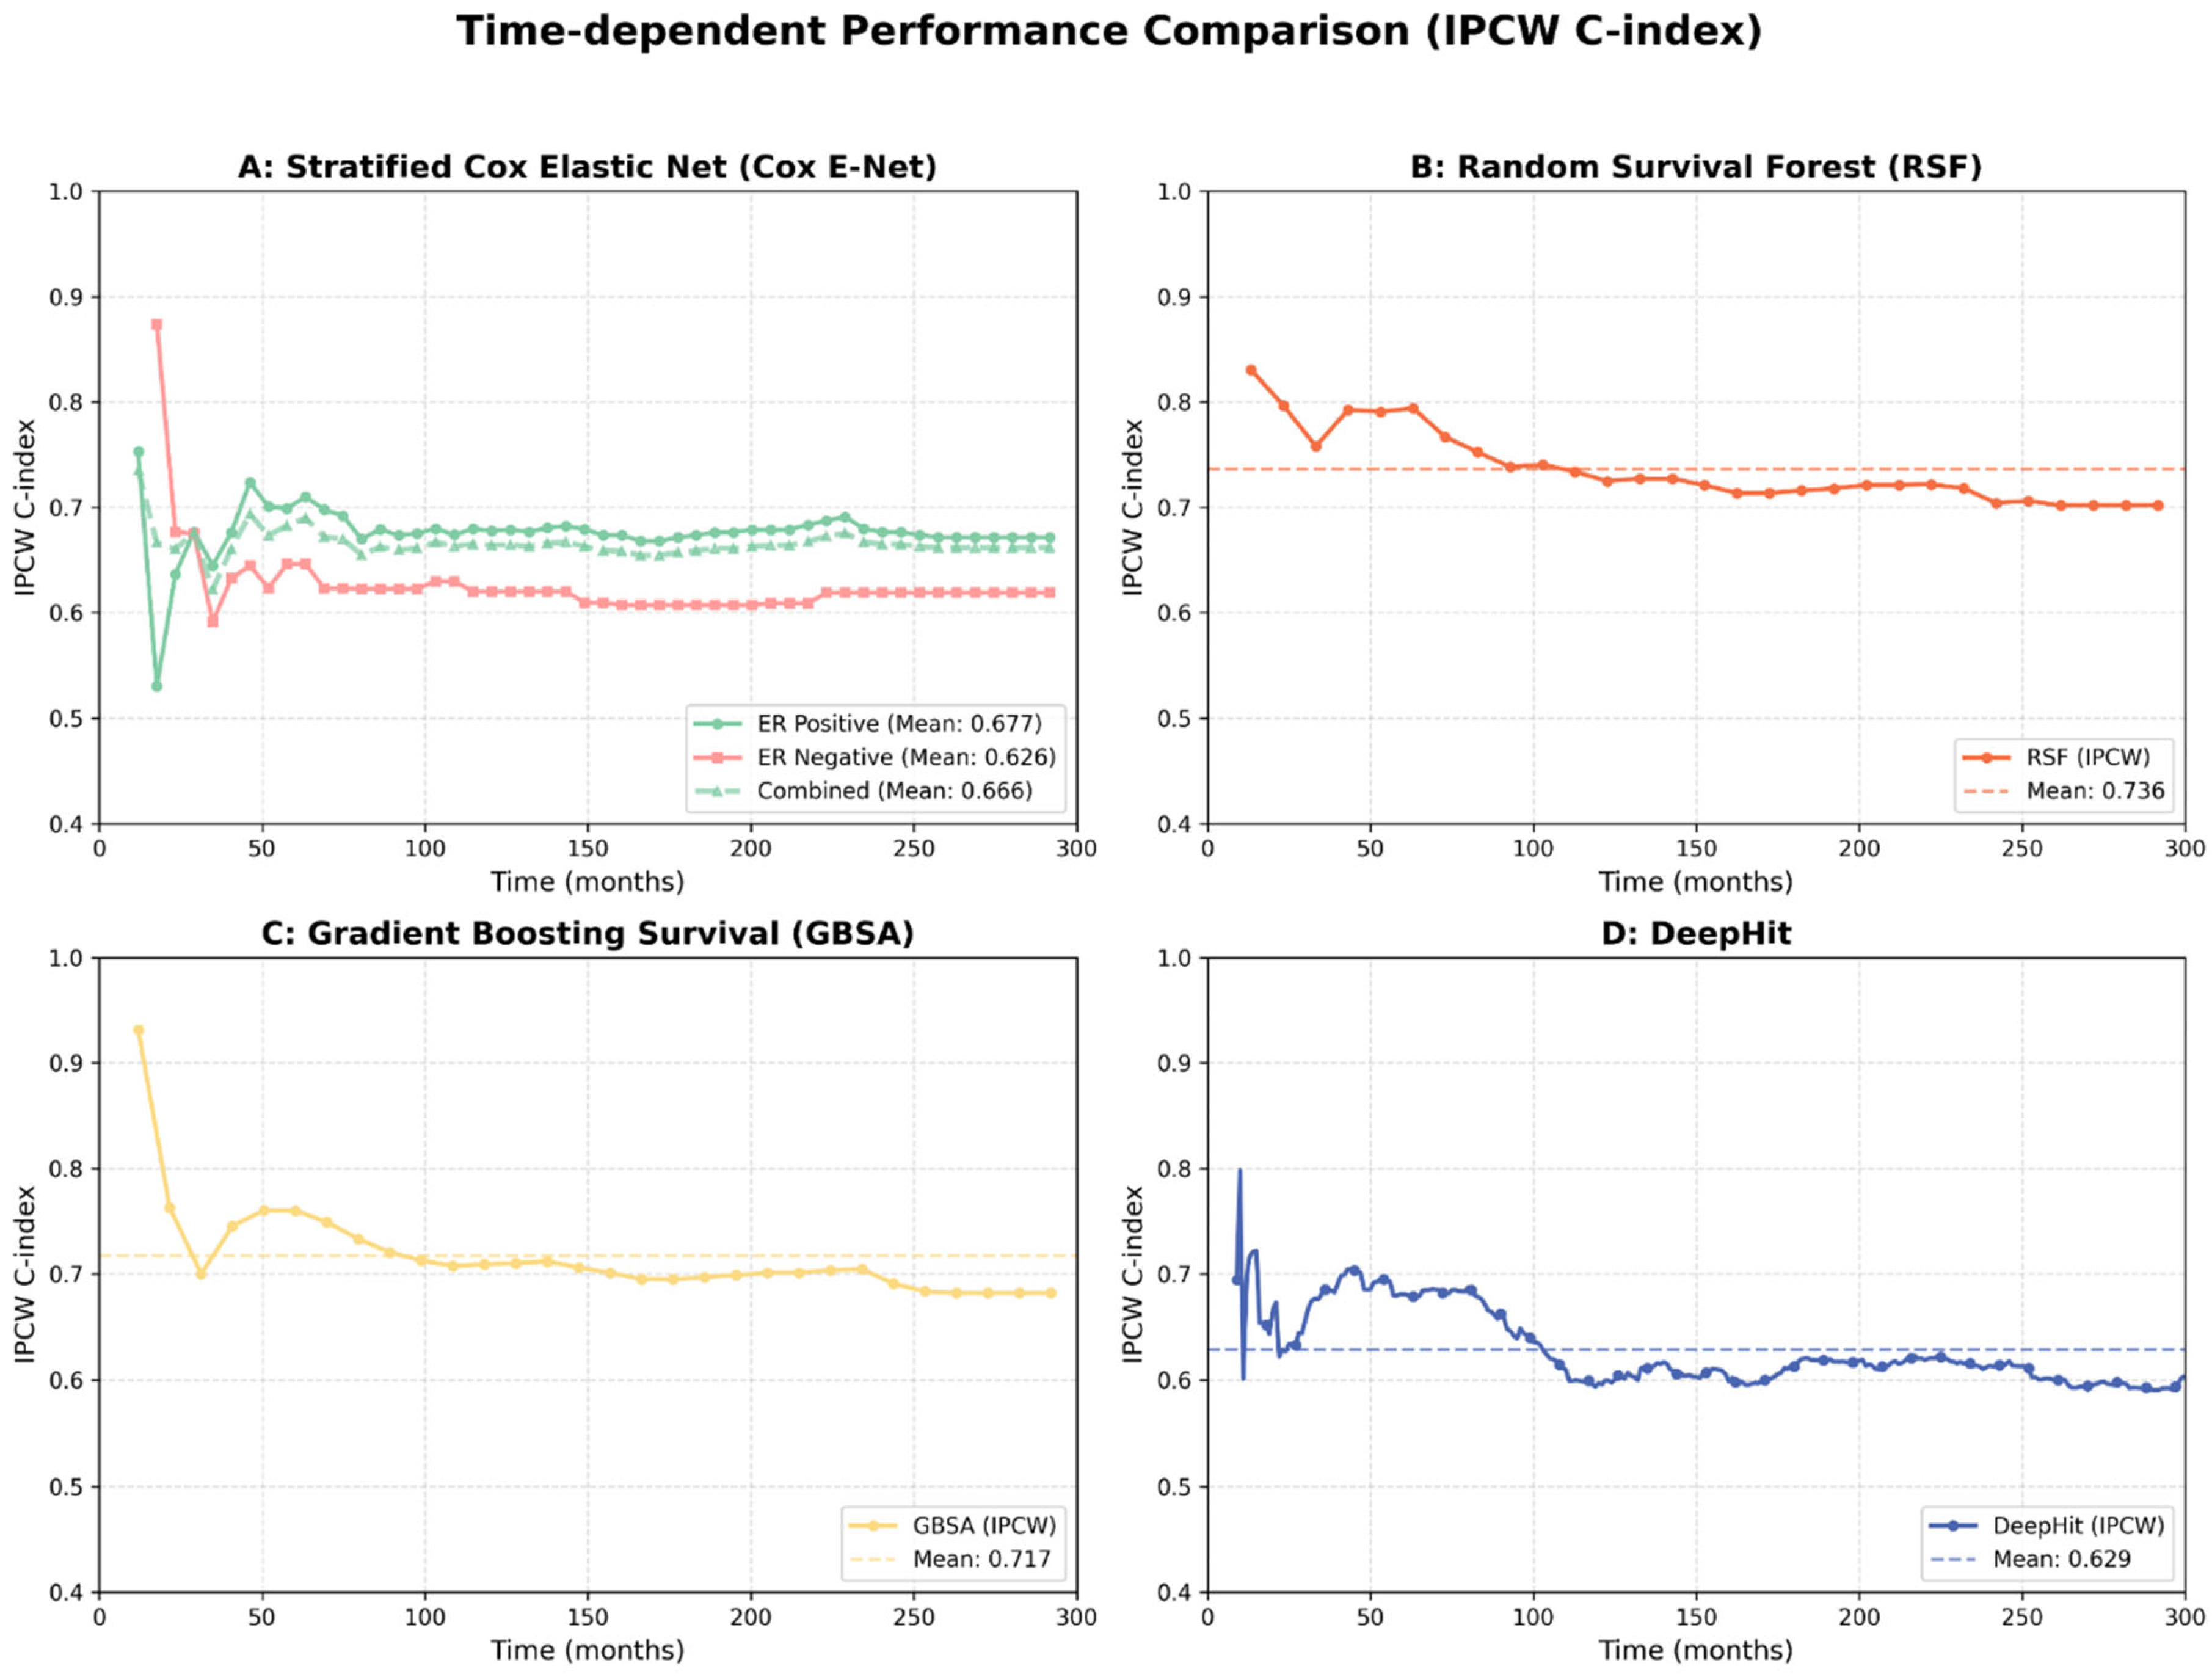
3.2. Predictive Model Performance
3.3. Restricted Mean Survival Time (RMST) Estimation
4. Discussion
5. Conclusions
Author Contributions
Funding
Data Availability Statement
Acknowledgments
Conflicts of Interest
References
- Singh, R.; Mukhopadhyay, K. Survival analysis in clinical trials: Basics and must know areas. Perspect. Clin. Res. 2011, 2, 145–148. [Google Scholar] [CrossRef] [Scilit] [PubMed]
- Motzer, R.J.; Escudier, B.; Tomczak, P.; Hutson, T.E.; Michaelson, M.D.; Negrier, S.; Oudard, S.; Gore, M.E.; Tarazi, J.; Hariharan, S.; et al. Axitinib versus sorafenib as second-line treatment for advanced renal cell carcinoma: Overall survival analysis and updated results from a randomised phase 3 trial. Lancet Oncol. 2013, 14, 552–562. [Google Scholar] [CrossRef] [Scilit] [PubMed]
- Kurian, A.W.; Sigal, B.M.; Plevritis, S.K. Survival analysis of cancer risk reduction strategies for BRCA1/2 mutation carriers. J. Clin. Oncol. 2010, 28, 222–231. [Google Scholar] [CrossRef] [Scilit] [PubMed]
- Ahmad, T.; Munir, A.; Bhatti, S.H.; Aftab, M.; Raza, M.A. Survival analysis of heart failure patients: A case study. PLoS ONE 2017, 12, e0181001. [Google Scholar] [CrossRef] [Scilit]
- Kelly, P.J.; Lim, L.L.Y. Survival analysis for recurrent event data: An application to childhood infectious diseases. Stat. Med. 2000, 19, 13–33. [Google Scholar] [CrossRef]
- Lin, D.Y.; Wei, L.J. The robust inference for the Cox proportional hazards model. J. Am. Stat. Assoc. 1989, 84, 1074–1078. [Google Scholar] [CrossRef]
- Van Dijk, P.C.; Jager, K.J.; Zwinderman, A.H.; Zoccali, C.; Dekker, F.W. The analysis of survival data in nephrology: Basic concepts and methods of Cox regression. Kidney Int. 2008, 74, 705–709. [Google Scholar] [CrossRef] [Scilit]
- Therneau, T.M.; Grambsch, P.M. Modeling Survival Data: Extending the Cox Model; Springer: New York, NY, USA, 2000. [Google Scholar]
- Bradburn, M.J.; Clark, T.G.; Love, S.B.; Altman, D.G. Survival analysis part II: Multivariate data analysis–an introduction to concepts and methods. Br. J. Cancer 2003, 89, 431–436. [Google Scholar] [CrossRef] [Scilit]
- Kleinbaum, D.G.; Klein, M. Survival Analysis a Self-Learning Text; Springer: Berlin/Heidelberg, Germany, 1996. [Google Scholar]
- Abd ElHafeez, S.; D’Arrigo, G.; Leonardis, D.; Fusaro, M.; Tripepi, G.; Roumeliotis, S. Methods to analyze time-to-event data: The Cox regression analysis. Oxidative Med. Cell. Longev. 2021, 2021, 1302811. [Google Scholar] [CrossRef] [Scilit]
- Collett, D. Modelling Survival Data in Medical Research; Chapman and Hall/CRC: Boca Raton, FL, USA, 2023. [Google Scholar]
- Blagoev, K.B.; Wilkerson, J.; Fojo, T. Hazard ratios in cancer clinical trials—A primer. Nat. Rev. Clin. Oncol. 2012, 9, 178–183. [Google Scholar] [CrossRef] [Scilit]
- Hilsenbeck, S.G.; Ravdin, P.M.; de Moor, C.A.; Chamness, G.C.; Osborne, C.K.; Clark, G.M. Time-dependence of hazard ratios for prognostic factors in primary breast cancer. Breast Cancer Res. Treat. 1998, 52, 227–237. [Google Scholar] [CrossRef] [Scilit] [PubMed]
- Gore, S.M.; Pocock, S.J.; Kerr, G.R. Regression models and non-proportional hazards in the analysis of breast cancer survival. J. R. Stat. Soc. Ser. C (Appl. Stat.) 1984, 33, 176–195. [Google Scholar] [CrossRef] [Scilit]
- Zhu, X.; Zhou, X.; Zhang, Y.; Sun, X.; Liu, H.; Zhang, Y. Reporting and methodological quality of survival analysis in articles published in Chinese oncology journals. Medicine 2017, 96, e9204. [Google Scholar] [CrossRef] [Scilit] [PubMed]
- Cox, D.R. Regression models and life-tables. J. R. Stat. Soc. Ser. B (Methodol.) 1972, 34, 187–220. [Google Scholar] [CrossRef] [Scilit]
- Stel, V.S.; Dekker, F.W.; Tripepi, G.; Zoccali, C.; Jager, K.J. Survival analysis I: The Kaplan-Meier method. Nephron Clin. Pract. 2011, 119, c83–c88. [Google Scholar] [CrossRef] [Scilit]
- In, J.; Lee, D.K. Survival analysis: Part I—Analysis of time-to-event. Korean J. Anesthesiol. 2018, 71, 182–191. [Google Scholar] [CrossRef] [Scilit]
- Rich, J.T.; Neely, J.G.; Paniello, R.C.; Voelker, C.C.; Nussenbaum, B.; Wang, E.W. A practical guide to understanding Kaplan-Meier curves. Otolaryngol.—Head Neck Surg. 2010, 143, 331–336. [Google Scholar] [CrossRef] [Scilit]
- Therneau, T.M. Extending the Cox model. In Proceedings of the First Seattle Symposium in Biostatistics: Survival Analysis; Springer: New York, NY, USA, 1997; pp. 51–84. [Google Scholar]
- Schoenfeld, D.A. Sample-size formula for the proportional-hazards regression model. Biometrics 1983, 39, 499–503. [Google Scholar] [CrossRef] [Scilit]
- Fisher, L.D.; Lin, D.Y. Time-dependent covariates in the Cox proportional-hazards regression model. Annu. Rev. Public Health 1999, 20, 145–157. [Google Scholar] [CrossRef] [Scilit]
- Durrleman, S.; Simon, R. Flexible regression models with cubic splines. Stat. Med. 1989, 8, 551–561. [Google Scholar] [CrossRef] [Scilit]
- Gelman, A.; Hill, J. Data Analysis Using Regression and Multilevel/Hierarchical Models; Cambridge University Press: Cambridge, UK, 2007. [Google Scholar]
- Royston, P.; Parmar, M.K. Restricted mean survival time: An alternative to the hazard ratio for the design and analysis of randomized trials with a time-to-event outcome. BMC Med. Res. Methodol. 2013, 13, 152. [Google Scholar] [CrossRef] [Scilit] [PubMed]
- Hua, K. Design and Analysis of Clinical Trials with Restricted Mean Survival Time. Doctoral Dissertation, Duke University, Durham, NC, USA, 2024. [Google Scholar]
- US Food and Drug Administration. Acute Myeloid Leukemia: Developing Drugs and Biological Products for Treatment-Guidance for Industry. Guidance for Industry. Final; US Food and Drug Administration: Silver Spring, MD, USA, 2022.
- Zhao, L.; Claggett, B.; Tian, L.; Uno, H.; Pfeffer, M.A.; Solomon, S.D.; Trippa, L.; Wei, L.J. On the restricted mean survival time curve in survival analysis. Biometrics 2016, 72, 215–221. [Google Scholar] [CrossRef] [Scilit] [PubMed]
- Calkins, K.L.; Canan, C.E.; Moore, R.D.; Lesko, C.R.; Lau, B. An application of restricted mean survival time in a competing risks setting: Comparing time to ART initiation by injection drug use. BMC Med. Res. Methodol. 2018, 18, 27. [Google Scholar] [CrossRef] [Scilit] [PubMed]
- Kim, D.H.; Uno, H.; Wei, L.J. Restricted mean survival time as a measure to interpret clinical trial results. JAMA Cardiol. 2017, 2, 1179–1180. [Google Scholar] [CrossRef] [Scilit]
- Han, K.; Jung, I. Restricted mean survival time for survival analysis: A quick guide for clinical researchers. Korean J. Radiol. 2022, 23, 495. [Google Scholar] [CrossRef] [Scilit]
- Huang, B.; Kuan, P.F. Comparison of the restricted mean survival time with the hazard ratio in superiority trials with a time-to-event end point. Pharm. Stat. 2018, 17, 202–213. [Google Scholar] [CrossRef] [Scilit]
- Andersen, P.K.; Hansen, M.G.; Klein, J.P. Regression analysis of restricted mean survival time based on pseudo-observations. Lifetime Data Anal. 2004, 10, 335–350. [Google Scholar] [CrossRef] [Scilit]
- Friedman, J.H. Greedy function approximation: A gradient boosting machine. Ann. Stat. 2001, 29, 1189–1232. [Google Scholar] [CrossRef] [Scilit]
- Imani, F.; Chen, R.; Tucker, C.; Yang, H. Random forest modeling for survival analysis of cancer recurrences. In Proceedings of the 2019 IEEE 15th International Conference on Automation Science and Engineering (CASE), Vancouver, BC, Canada, 22–26 August 2019; IEEE: New York, NY, USA, 2019; pp. 399–404. [Google Scholar]
- Chen, T.; Guestrin, C. Xgboost: A scalable tree boosting system. In Proceedings of the 22nd ACM SIGKDD International Conference on Knowledge Discovery and Data Mining, San Francisco, CA, USA, 13–17 August 2016; pp. 785–794. [Google Scholar]
- Hothorn, T.; Bühlmann, P.; Dudoit, S.; Molinaro, A.; Van Der Laan, M.J. Survival ensembles. Biostatistics 2006, 7, 355–373. [Google Scholar] [CrossRef] [Scilit]
- Katzman, J.L.; Shaham, U.; Cloninger, A.; Bates, J.; Jiang, T.; Kluger, Y. DeepSurv: Personalized treatment recommender system using a Cox proportional hazards deep neural network. BMC Med. Res. Methodol. 2018, 18, 24. [Google Scholar] [CrossRef] [Scilit]
- Lee, C.; Zame, W.; Yoon, J.; Van Der Schaar, M. Deephit: A deep learning approach to survival analysis with competing risks. In Proceedings of the AAAI Conference on Artificial Intelligence, New Orleans, LA, USA, 2–7 February 2018; Volume 32. [Google Scholar]
- Pencina, M.J.; D’agostino, R.B. Overall C as a measure of discrimination in survival analysis: Model specific population value and confidence interval estimation. Stat. Med. 2004, 23, 2109–2123. [Google Scholar] [CrossRef] [Scilit] [PubMed]
- Redelmeier, D.A.; Bloch, D.A.; Hickam, D.H. Assessing predictive accuracy: How to compare Brier scores. J. Clin. Epidemiol. 1991, 44, 1141–1146. [Google Scholar] [CrossRef] [Scilit] [PubMed]
- Ridgeway, G. Generalized Boosted Models: A Guide to the gbm Package; R Package Vignette: 2007; Volume 1. Available online: https://CRAN.R-project.org/package=gbm (accessed on 1 January 2026).
- Schenk, A.; Basten, V.; Schmid, M. Modeling the Restricted Mean Survival Time Using Pseudo-Value Random Forests. Stat. Med. 2025, 44, e70031. [Google Scholar] [CrossRef] [Scilit] [PubMed]
- Wang, P.; Li, Y.; Reddy, C.K. Machine learning for survival analysis: A survey. ACM Comput. Surv. (CSUR) 2019, 51, 1–36. [Google Scholar] [CrossRef] [Scilit]
- Wiegrebe, S.; Kopper, P.; Sonabend, R.; Bischl, B.; Bender, A. Deep learning for survival analysis: A review. Artif. Intell. Rev. 2024, 57, 65. [Google Scholar] [CrossRef] [Scilit]
- Zhao, L. Deep neural networks for predicting restricted mean survival times. Bioinformatics 2020, 36, 5672–5677. [Google Scholar] [CrossRef] [Scilit]
- Anderson, W.F.; Chatterjee, N.; Ershler, W.B.; Brawley, O.W. Estrogen receptor breast cancer phenotypes in the Surveillance, Epidemiology, and End Results database. Breast Cancer Res. Treat. 2002, 76, 27–36. [Google Scholar] [CrossRef] [Scilit]
- Duffy, M.J. Estrogen receptors: Role in breast cancer. Crit. Rev. Clin. Lab. Sci. 2006, 43, 325–347. [Google Scholar] [CrossRef] [Scilit]
- Sommer, S.; Fuqua, S.A. Estrogen receptor and breast cancer. In Seminars in Cancer Biology; Academic Press: San Diego, CA, USA, 2001; Volume 11, pp. 339–352. [Google Scholar]
- Bilal, E.; Dutkowski, J.; Guinney, J.; Jang, I.S.; Logsdon, B.A.; Pandey, G.; Sauerwine, B.A.; Shimoni, Y.; Moen Vollan, H.K.; Mecham, B.H.; et al. Improving breast cancer survival analysis through competition-based multidimensional modeling. PLoS Comput. Biol. 2013, 9, e1003047. [Google Scholar] [CrossRef] [Scilit]
- Curtis, C.; Shah, S.P.; Chin, S.F.; Turashvili, G.; Rueda, O.M.; Dunning, M.J.; Speed, D.; Lynch, A.G.; Samarajiwa, S.; Yuan, Y.; et al. The genomic and transcriptomic architecture of 2,000 breast tumours reveals novel subgroups. Nature 2012, 486, 346–352. [Google Scholar] [CrossRef] [Scilit]
- Mayor, S. Chemotherapy and hormonal treatments improve the 15 year survival rate for breast cancer. BMJ Br. Med. J. 2005, 330, 1167. [Google Scholar] [CrossRef] [Scilit]
- Zou, H.; Hastie, T. Regularization and variable selection via the elastic net. J. R. Stat. Soc. Ser. B Stat. Methodol. 2005, 67, 301–320. [Google Scholar] [CrossRef] [Scilit]
- Simon, N.; Friedman, J.H.; Hastie, T.; Tibshirani, R. Regularization paths for Cox’s proportional hazards model via coordinate descent. J. Stat. Softw. 2011, 39, 1–13. [Google Scholar] [CrossRef] [Scilit] [PubMed]
- Pölsterl, S. scikit-survival: A Library for Time-to-Event Analysis Built on Top of scikit-learn. J. Mach. Learn. Res. 2020, 21, 1–6. [Google Scholar]
- Pedregosa, F.; Varoquaux, G.; Gramfort, A.; Michel, V.; Thirion, B.; Grisel, O.; Blondel, M.; Prettenhofer, P.; Weiss, R.; Dubourg, V.; et al. Scikit-learn: Machine learning in Python. J. Mach. Learn. Res. 2011, 12, 2825–2830. [Google Scholar]
- Davidson-Pilon, C. lifelines: Survival analysis in Python. J. Open Source Softw. 2019, 4, 1317. [Google Scholar] [CrossRef] [Scilit]
- Moncada-Torres, A.; van Maaren, M.C.; Hendriks, M.P.; Siesling, S.; Geleijnse, G. Explainable machine learning can outperform Cox regression predictions and provide insights in breast cancer survival. Sci. Rep. 2021, 11, 6968. [Google Scholar] [CrossRef] [Scilit]
- Chen, Y.; Jia, Z.; Mercola, D.; Xie, X. A gradient boosting algorithm for survival analysis via direct optimization of concordance index. Comput. Math. Methods Med. 2013, 2013, 873595. [Google Scholar] [CrossRef] [Scilit]
- Wissel, D.; Janakarajan, N.; Grover, A.; Toniato, E.; Martínez, M.R.; Boeva, V. SurvBoard: Standardized benchmarking for multi-omics cancer survival models. Brief. Bioinform. 2025, 26, bbaf521. [Google Scholar] [CrossRef] [Scilit]



| Variable Type | Variables | Treatment |
|---|---|---|
| Continuous (4) | Age at Diagnosis, Lymph nodes examined positive, Mutation Count, Tumor Size | Standard normalize (fit on train only) |
| Binary (9) | ER Status, PR status, HER2 Status, Chemotherapy, Hormone Therapy, Radio Therapy, Type of Breast Surgery, Inferred Menopausal State, Primary Tumor Laterality | Map to 0/1 via BINARY_MAP |
| Categorical (7) | Cancer Type Detailed, Cellularity, Pam50+ Claudin-low subtype, Tumor Other Histologic Subtype, 3-Gene classifier subtype, Neoplasm Histologic Grade, Tumor Stage | One-hot encode |
| Model | ER Positive RMST (95% CI) (Months) | ER Negative RMST (95% CI) (Months) | ER Positive–ER Negative Difference (Months) |
|---|---|---|---|
| Observed KM (Test) | 130.4 [121.7–139.0] | 113.8 [94.4–133.2] | 16.6 |
| Cox E-Net | 131.1 [127.3–135.3] | 104.1 [85.6–107.5] | 27 |
| RSF | 130.9 [127.8–133.6] | 118.1 [113.1–123.5] | 12.8 |
| GBSA | 130.5 [126.0–135.1] | 116.7 [106.7–126.8] | 13.8 |
| DeepHit | 126.2 [125.3–127.2] | 125.2 [123.6–126.9] | 1 |
Disclaimer/Publisher’s Note: The statements, opinions and data contained in all publications are solely those of the individual author(s) and contributor(s) and not of MDPI and/or the editor(s). MDPI and/or the editor(s) disclaim responsibility for any injury to people or property resulting from any ideas, methods, instructions or products referred to in the content. |
© 2026 by the authors. Licensee MDPI, Basel, Switzerland. This article is an open access article distributed under the terms and conditions of the Creative Commons Attribution (CC BY) license.
Share and Cite
Tan, F.; Zhou, Y.; Li, S.; Jiang, C.; Zhou, J.-G.; Bellur, S. An RMST-Integrated Machine Learning Framework for Interpretable Survival Analysis Under Non-Proportional Hazards: Application to the METABRIC Cohort. Algorithms 2026, 19, 329. https://doi.org/10.3390/a19050329
Tan F, Zhou Y, Li S, Jiang C, Zhou J-G, Bellur S. An RMST-Integrated Machine Learning Framework for Interpretable Survival Analysis Under Non-Proportional Hazards: Application to the METABRIC Cohort. Algorithms. 2026; 19(5):329. https://doi.org/10.3390/a19050329
Chicago/Turabian StyleTan, Fangya, Yang Zhou, Shuqiao Li, Chun Jiang, Jian-Guo Zhou, and Srikar Bellur. 2026. "An RMST-Integrated Machine Learning Framework for Interpretable Survival Analysis Under Non-Proportional Hazards: Application to the METABRIC Cohort" Algorithms 19, no. 5: 329. https://doi.org/10.3390/a19050329
APA StyleTan, F., Zhou, Y., Li, S., Jiang, C., Zhou, J.-G., & Bellur, S. (2026). An RMST-Integrated Machine Learning Framework for Interpretable Survival Analysis Under Non-Proportional Hazards: Application to the METABRIC Cohort. Algorithms, 19(5), 329. https://doi.org/10.3390/a19050329