1. Introduction
Attitude information, a key component of spatial motion data, is critical for trajectory analysis, enabling accurate trajectory judgment and advancing target kinematics and dynamic tracking [
1,
2,
3]. As a core task in spatial motion analysis, object attitude estimation finds wide applications in AOCS [
4,
5], biomedical imaging [
6,
7], and industrial inspection [
8]. Existing methods can be categorized into four main approaches: non-visual sensing methods, geometric feature-based methods, template matching methods, and deep learning-based methods. These methods exhibit notable differences in accuracy, efficiency, and applicability across various scenarios.
Early non-visual methods rely heavily on specialized hardware or strict motion assumptions. For example, Aruga achieved spacecraft three-axis attitude determination with ±0.1° accuracy using ground-based laser polarization rotation, but this approach is confined to static medium-to-long-distance targets [
9]. Peck’s inertial coordinate system modeling method is sensitive to complex targets’ inertial parameters [
10], while Valpiani’s Bayesian nonlinear filtering algorithm suffers from O(N
3) computational complexity [
11], limiting their applicability in dynamic unstructured environments. Geometric feature-based methods, leveraging monocular/binocular vision, require strict target geometric prior knowledge and are vulnerable to environmental interference [
12,
13]. Template matching methods achieve high accuracy in structured scenarios but suffer from O(N
2) time complexity and excessive memory overhead, hindering real-time performance [
14,
15]. Recent deep learning advancements provide end-to-end solutions for attitude estimation [
16], with CNN architectures (e.g., ResNet, VGG) enabling automatic feature extraction [
17,
18,
19,
20,
21,
22,
23]. Neural networks can also be viewed as function approximators for learning complex nonlinear mappings, and recent studies have shown that task-specific architectural design can significantly improve approximation capability and optimization behavior in challenging approximation and inverse problems [
24]. This perspective is relevant to the present work, where the proposed architectural modifications are intended to better approximate the nonlinear mapping from image observations to continuous attitude parameters. More recently, regression-based vision methods have become increasingly prominent in pose/attitude estimation. Qiao et al. demonstrated monocular satellite relative pose estimation using deep learning with structural cues, further supporting the feasibility of vision-based regression in AOCS-related scenarios [
25]. In the broader 6D object pose literature, GDR-Net proposes a geometry-guided direct regression framework to estimate object pose from monocular images [
26], and SO-Pose further exploits self-occlusion cues to improve direct 6D pose regression under challenging visibility conditions [
27]. For attitude regression specifically represented by Euler angles, Herrera et al. reported deep-network-based attitude estimation for a rotating-object setting [
28]. However, these methods face critical challenges: limited generalization under unknown targets or drastic lighting changes [
29], and heavy dependence on large-scale, costly annotated datasets [
30]. In addition, real-time deployment often requires a favorable accuracy–efficiency trade-off under constrained computation and memory budgets; recent lightweight pose estimation studies also emphasize this practical requirement [
31].
Recent lightweight pose-estimation studies further emphasize the practical importance of balancing regression accuracy and deployment efficiency. For example, GADS introduced a super-lightweight architecture for head pose estimation and reported substantial gains in model compactness and inference speed, while LightNet proposed a lightweight head estimation framework for online scenarios with explicit consideration of real-time deployment constraints. These studies reinforce the view that lightweight regression models are increasingly important for resource-constrained pose-estimation applications [
32,
33]. In addition, recent survey work has highlighted that generalization, data scarcity, and model complexity remain central challenges in modern pose estimation, which is consistent with the motivation of the present study [
34].
To address these challenges, a lightweight multi-scale deep neural network based on MobileNetV1 is proposed. The network integrates Squeeze-and-Excitation (SE), Global Average Pooling (GAP), a dual-scale Pyramid Pooling Module (PPM), and a regression-oriented Multilayer Perceptron (MLP), enabling efficient feature extraction and direct attitude prediction. To alleviate the dependence on large-scale labeled datasets, a synthetic dataset is constructed using the VTK library, where spherical particles with distinct texture patterns are rendered and automatically annotated with Euler angles. Furthermore, various image augmentation techniques are employed to enhance the model’s generalization ability under varying illumination and visual conditions. This design not only simplifies data acquisition but also improves robustness and adaptability.
2. Materials and Methods
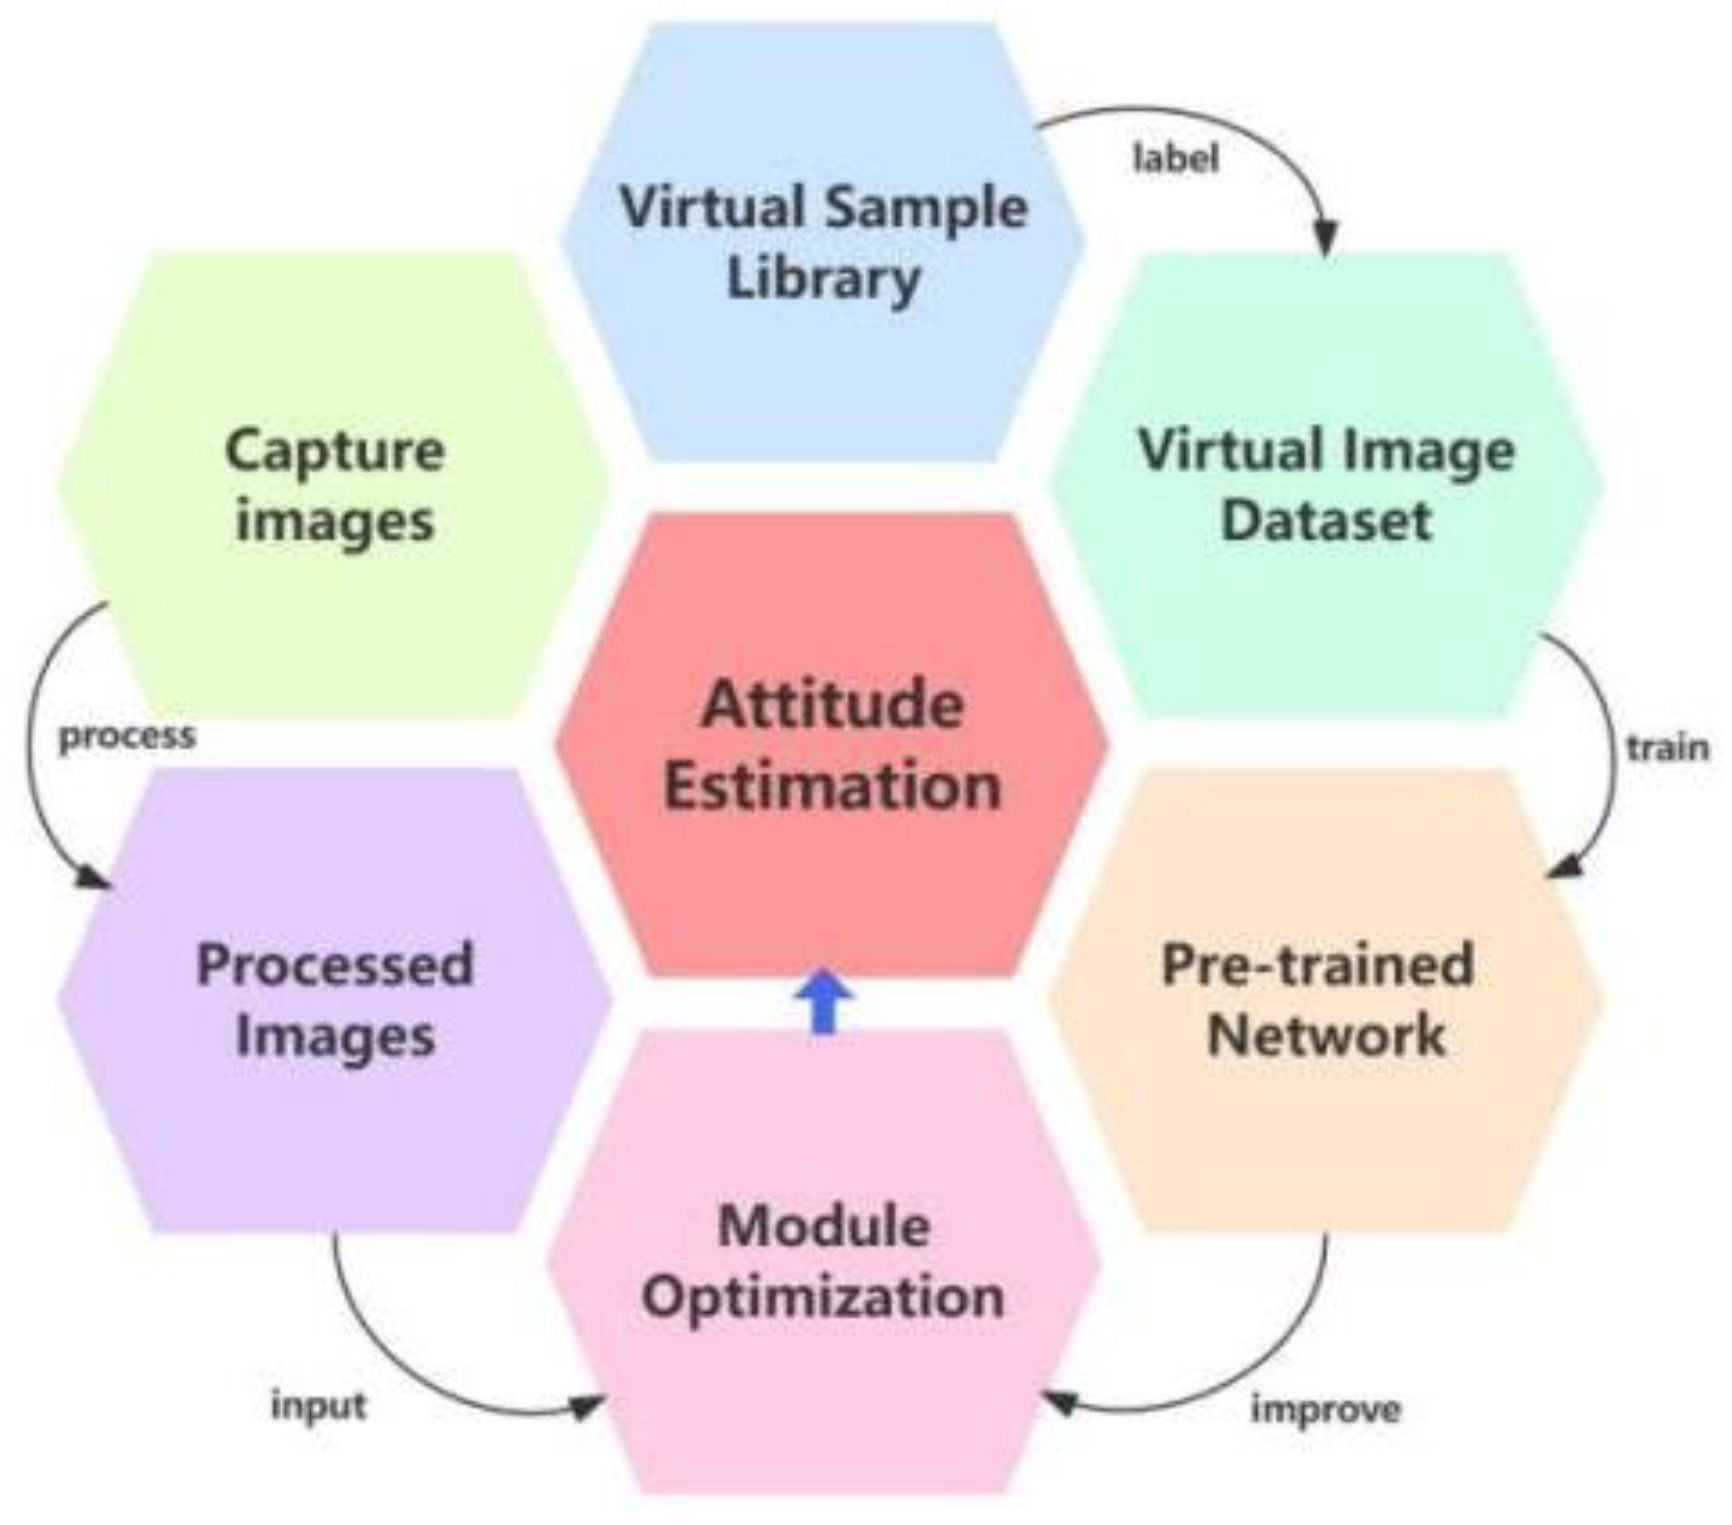
This study proposes a convolutional neural network-based method for visual attitude estimation of target objects, as shown in the overall framework in
Figure 1. First, a synthetic dataset is constructed using the VTK tool, with automatic annotation of the target’s attitude information during the process. Then, a pre-trained model is used for initial training, which is subsequently improved to obtain a high-performance network model. Following this, a 3D-printed spherical particle is used, and the captured images are processed and augmented to validate the method’s effectiveness and reliability in practical applications.
2.1. Dataset
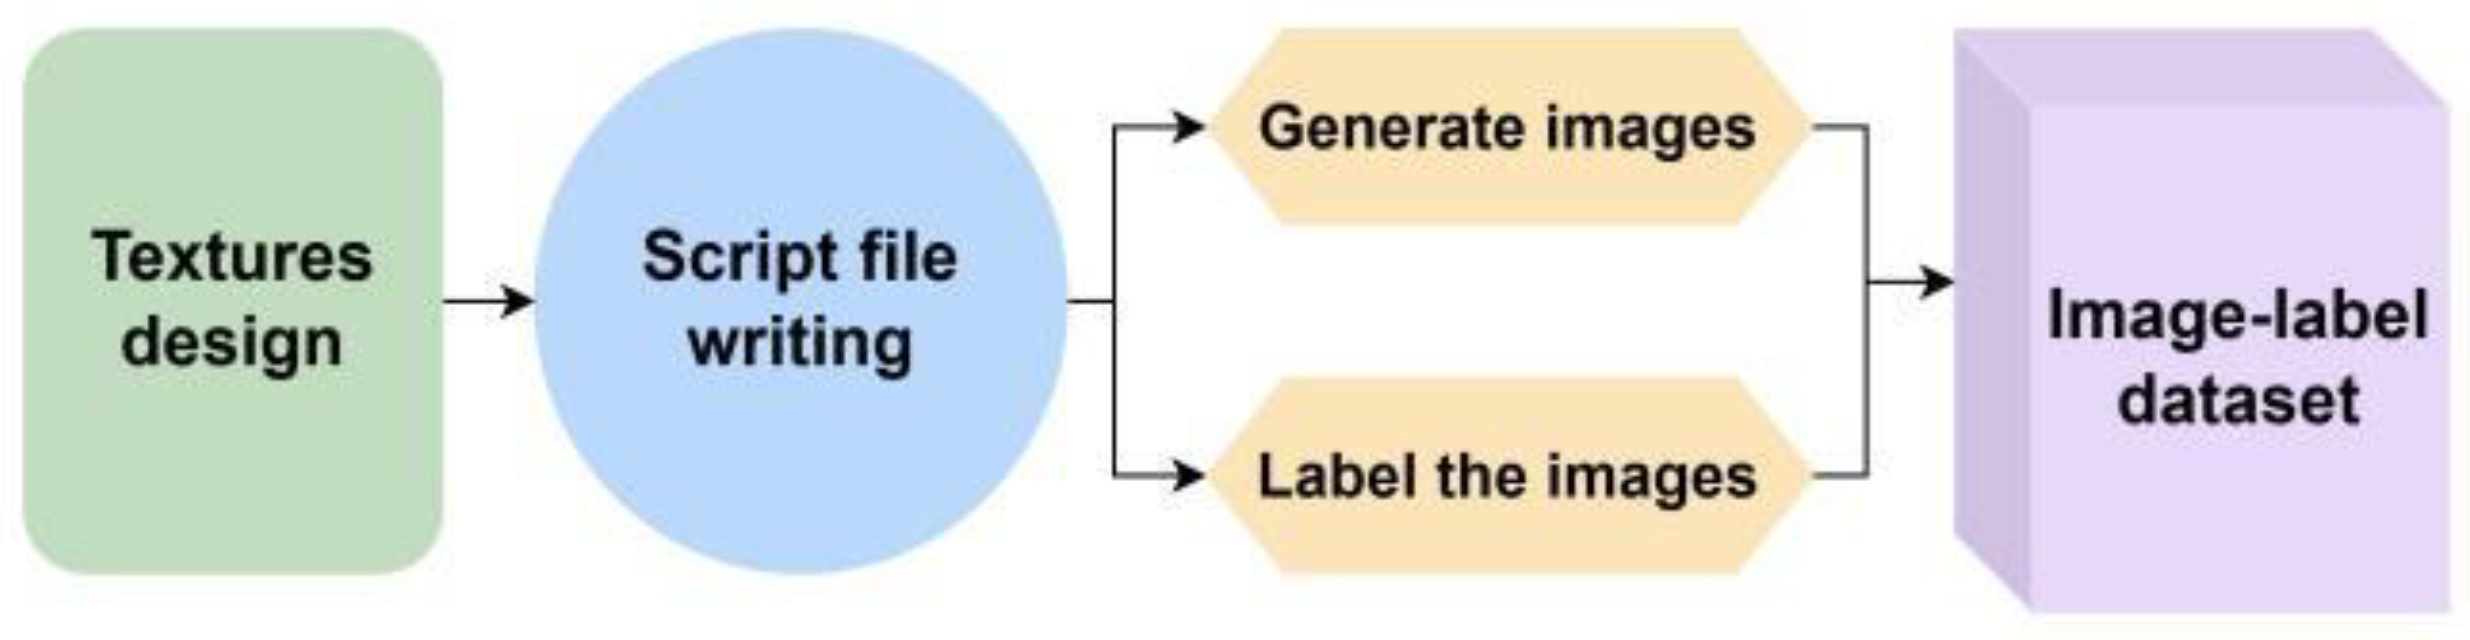
To eliminate the limitations associated with manual data acquisition and annotation, a virtual dataset was constructed for the automatic annotation of attitude information, with the detailed workflow illustrated in
Figure 2. Specifically, a simulated spherical particle was established first, and distinct color textures were designed on its surface to enable effective differentiation of images under varying poses. Subsequently, the directional rotation of the spherical particle was precisely controlled, and a virtual camera was employed to capture image frames corresponding to different pose states. Concurrently with the image acquisition process, a custom annotation script was utilized to automatically label the attitude information that matches each captured image frame, ensuring the synchronization and accuracy of data and annotations.
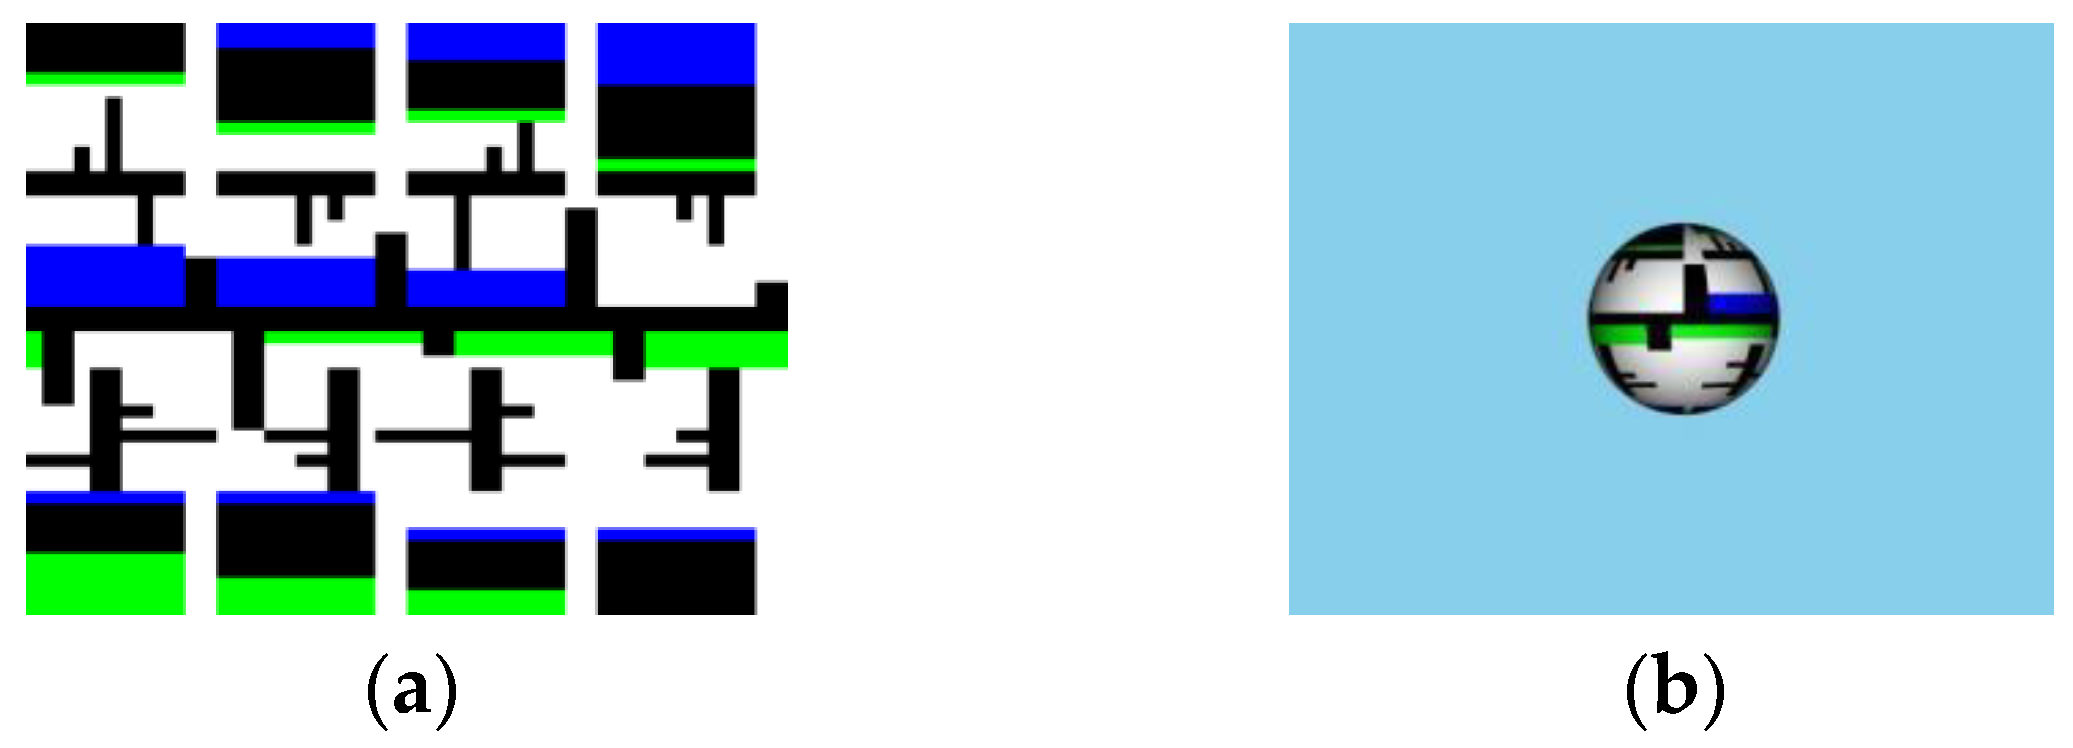
To effectively distinguish the states of target particles using texture patterns, a four-color texture composed of black, white, green, and blue color distributions was designed [
35].
Figure 3 illustrates this texture pattern and the visualization effect of the simulated particle covered with this texture pattern. Subsequently, the VTK simulation library was employed to generate a synthetic dataset containing 2197 virtual images, which were aligned with physical experimental conditions. The virtual camera was fixed in position, while the textured sphere was systematically rotated at 3° increments around three spatial axes (X, Y, Z), covering the full range of 0–36°. Specifically, each axis was sampled from {0°, 3°, …, 36°} (13 values), and the final pose set was constructed by taking the Cartesian product across the three axes, resulting in 13
3 = 2197 coupled three-axis pose combinations. During image generation, three-axis Euler angles were embedded into filenames for automatic annotation (e.g., “X15_Y3_Z27.png”), and a custom parsing function extracted these angles as regression labels.
It should be noted that limiting the pose range to 0–36° is a deliberate trade-off rather than an assumption that larger rotations are undesirable. In principle, broader angular coverage can improve robustness to pose variation; however, under the fixed-step, three-axis combinatorial sampling scheme, extending the range would rapidly increase the pose space and substantially raise the costs of rendering, storage, and training. For example, with the same 3° step size, expanding the range to 0–180° yields 61 sampled values per axis (0°, 3°, …, 180°), resulting in 613 (≈2.27 × 10⁵) multi-axis pose combinations. Since this study aims to validate the feasibility of a general attitude-estimation framework (rather than targeting a specific application scenario), we adopt a controlled and reproducible range for methodological verification. In future application-oriented studies, the rotation range can be determined according to task requirements and the expected pose distribution in the target environment.
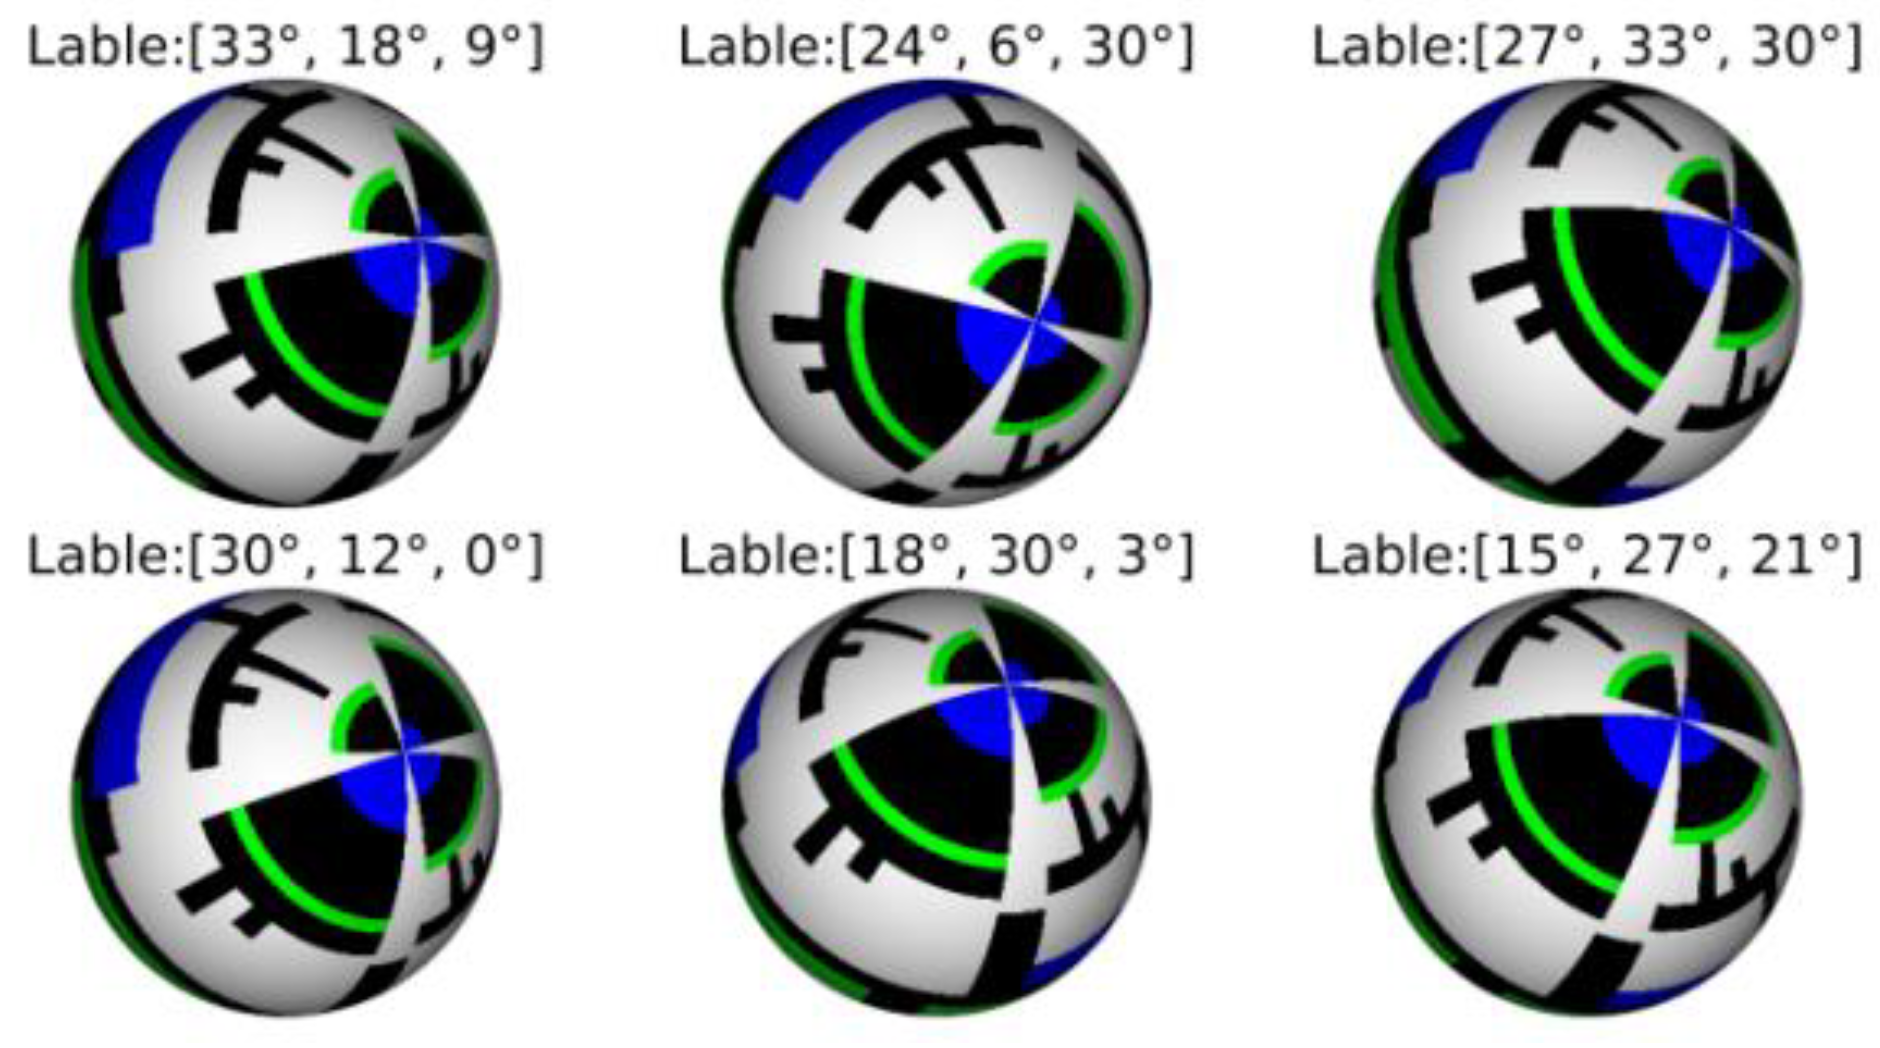
The dataset was partitioned into 1600 training and 597 validation samples, ensuring comprehensive coverage of attitude variations while maintaining computational efficiency. A portion of the processed labeled dataset is illustrated in
Figure 4.
2.2. Network Architecture
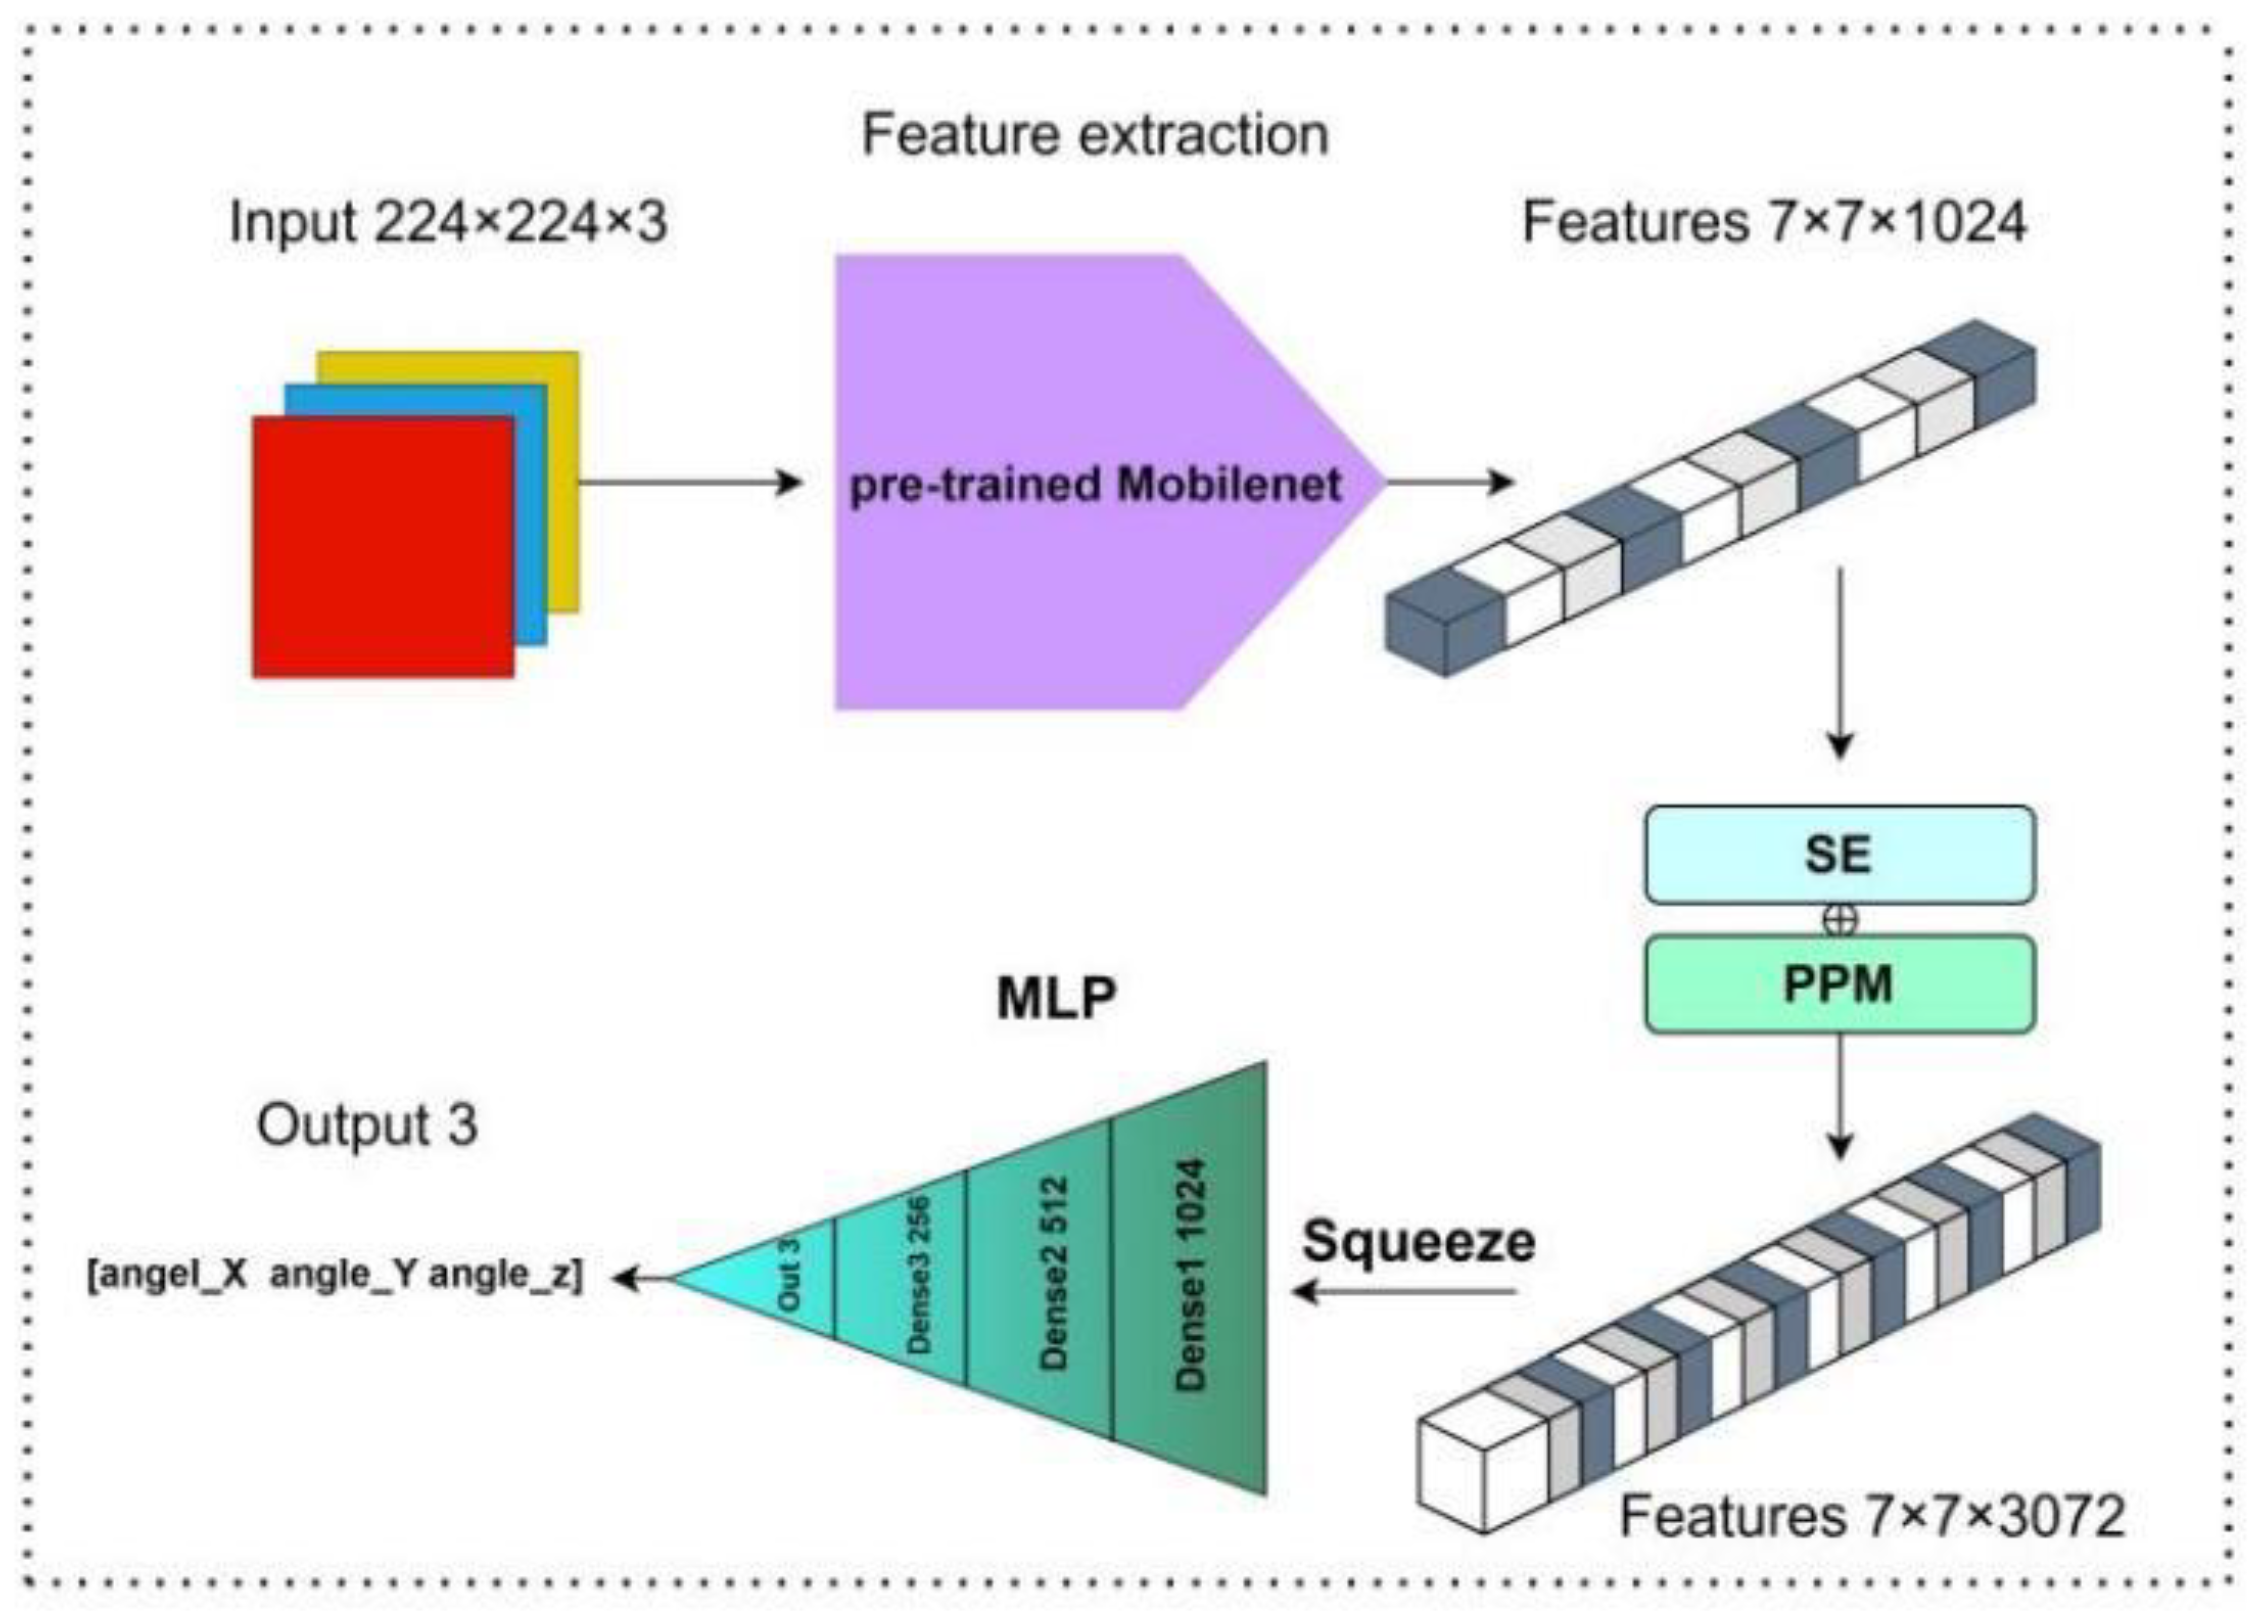
To achieve accurate and efficient pose regression for the particle, a novel multi-scale lightweight network architecture, as illustrated in
Figure 5, is proposed. The network takes a three-channel synthetic particle image as input and directly outputs the three pose angles of the particle. To balance computational cost and representation capability, MobileNetV1 [
36] is adopted as the backbone network. On top of the backbone, Squeeze-and-Excitation (SE) modules are incorporated to explicitly model inter-channel dependencies and to adaptively reweight feature channels. Furthermore, an improved Pyramid Pooling Module (PPM) is introduced to aggregate contextual information at multiple spatial scales.
After multi-scale feature enhancement, Global Average Pooling (GAP) is employed to compress the final feature maps into a compact feature vector. A Multi-Layer Perceptron (MLP) is adopted to replace the conventional network head, thereby enhancing the network’s nonlinear modeling capability in pose regression tasks. Ultimately, a linear fully connected layer is utilized to map the learned high-level feature representations to the three continuous pose angles, thus generating the final attitude prediction results.
2.2.1. MobileNet
Large neural networks require substantial computational resources, posing challenges for resource-constrained projects. Thus, the lightweight MobileNet is adopted. MobileNet significantly reduces model parameters and computational cost while maintaining high accuracy—exhibiting only a 0.9% accuracy drop but a 32-fold smaller size than VGG16 on ImageNet.
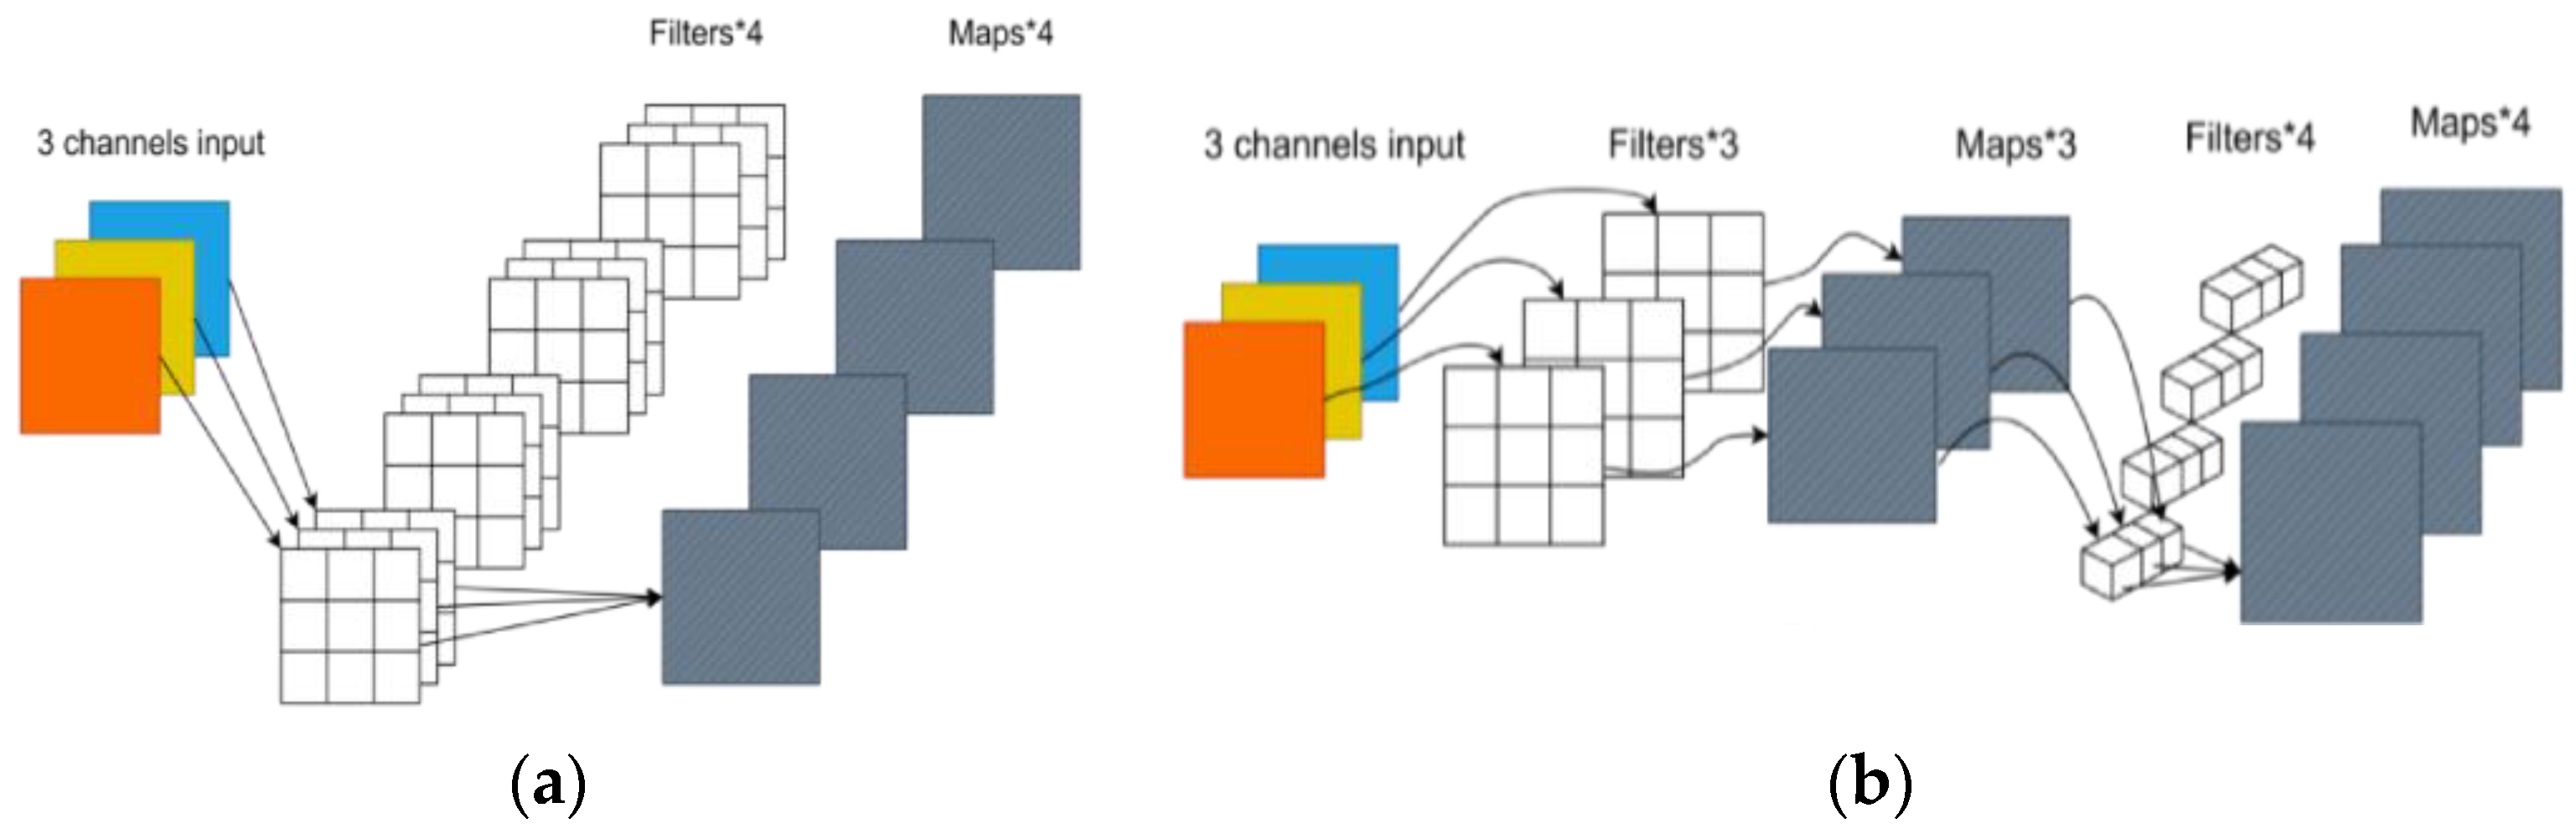
Depthwise convolution utilizes one dedicated kernel per input channel, reducing parameters to 1/N of standard convolutions (where N denotes the number of input channels) while retaining feature extraction ability. However, it cannot adjust channel counts or capture inter-channel feature correlations. Pointwise convolution with 1 × 1 kernels is therefore introduced to linearly combine feature maps across channels, enabling efficient cross-channel information fusion. This integrated depthwise separable convolution drastically cuts parameters and computational overhead while preserving performance, rendering MobileNet well-suited for mobile and embedded scenarios, as illustrated in
Figure 6.
Structurally, MobileNet is constructed with depthwise separable convolution blocks, which first extract features via depthwise convolution and then fuse them through pointwise convolution, normalization, and activation layers. In this work, each block is further improved: an SE module is incorporated after each pointwise convolution layer, and the standard ReLU is replaced with the GeLU activation function [
37], which features smoother negative-region responses and enhanced nonlinear expressiveness.
2.2.2. SE Module
To address the low-resolution and low-contrast characteristics of the grain images and to enable robust attitude regression under limited training data, the proposed architecture follows a lightweight yet task-oriented design logic: channel-wise reweighting is introduced to emphasize discriminative cues, multi-scale contextual aggregation is used to mitigate appearance variation, global pooling is employed to reduce overfitting, and a compact regression head is adopted to map features to continuous Euler angles. Therefore, an SE module [
38] was added after the last convolution block.
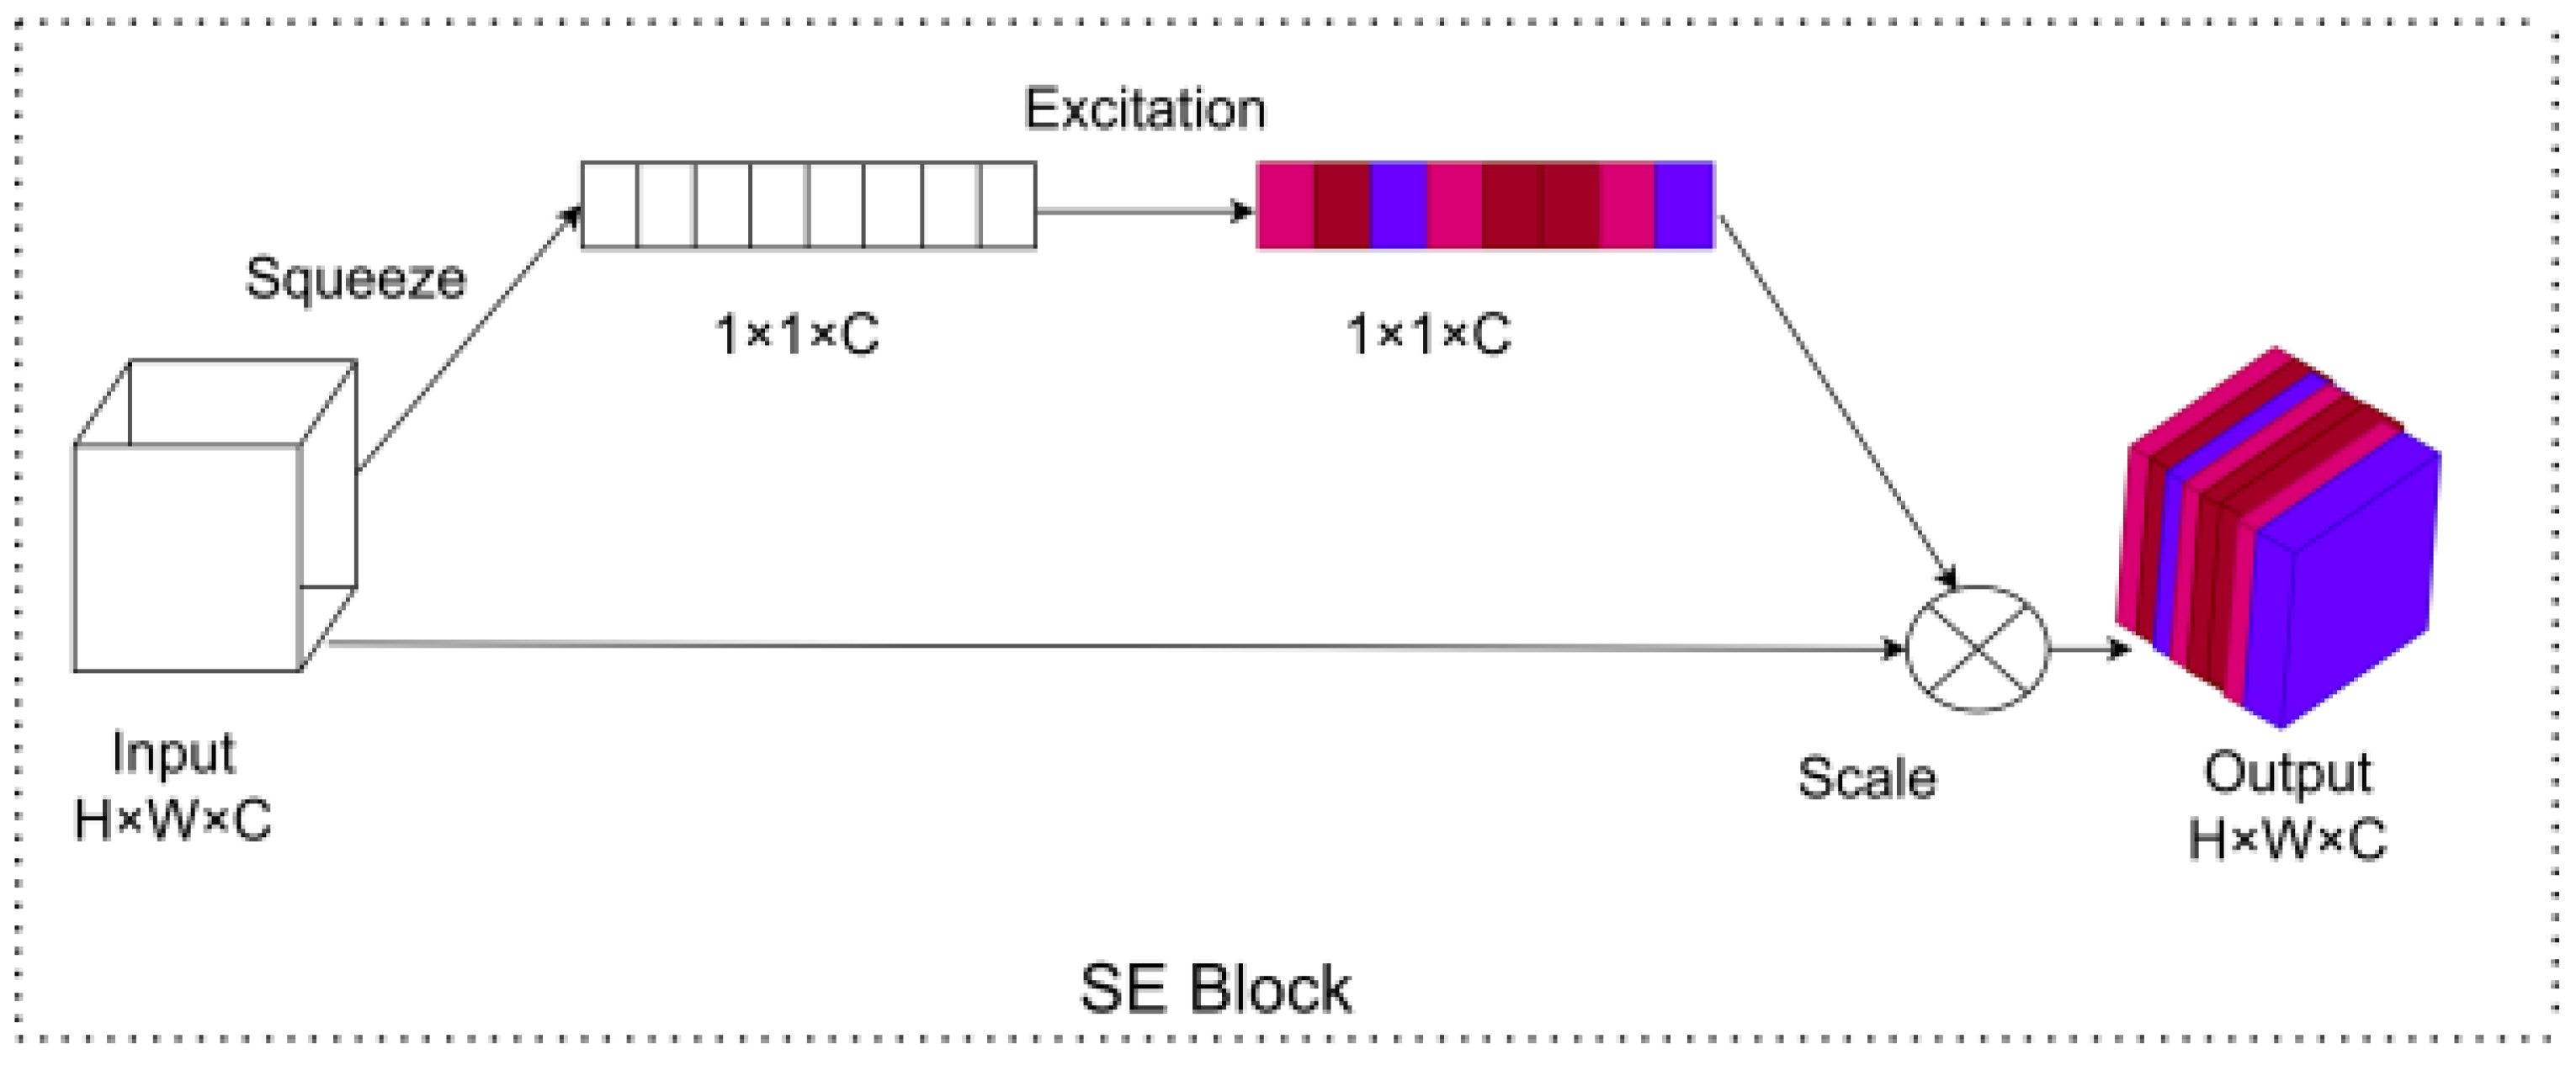
The SE module consists of three steps: squeeze, excitation, and scale transformation, as depicted in
Figure 7. First, the squeeze operation reduces the input feature from H × W × C to a 1 × 1 × C vector, which can be regarded as the statistical information of the global features. The excitation step uses two fully connected layers to process the squeezed features, whereas the first fully connected layer uses a scaling parameter ratio to reduce the number of feature channels, reducing the number of channels and thus the computational cost. The second fully connected layer restores the number of channels to C and uses the Sigmoid activation function to obtain the weight of each channel. Finally, the scale transform operation multiplies the weight values with the corresponding two-dimensional matrix of the original feature map channel to obtain the final output features after weight adjustment. In this way, after feature extraction, the data are separated from the mixing of spatial features and channel features, allowing the model to adaptively learn the importance of each channel feature and weight the features according to their importance, thereby improving the model’s representation capability. We place SE after the last convolution block because high-level features at this stage carry stronger semantics, and channel recalibration can be achieved with minimal additional overhead, which is suitable for a lightweight regression pipeline.
2.2.3. Enhanced PPM
To further enhance the model’s understanding of multi-scale information, the Pyramid Pooling Module (PPM) was incorporated after the SE module [
39]. This module comprises the following steps: (1) Multi-scale Division: The input feature map is equally divided into sub-regions of different scales, e.g., 1 × 1, 2 × 2, 3 × 3, and 6 × 6. (2) Dimensionality Reduction: Each sub-region is down-sampled using a 1 × 1 convolution to reduce the number of channels, lowering computational complexity and parameter count. (3) Up-sampling: The down-sampled sub-region feature maps are up-sampled to the same size as the original input feature map. (4) Feature Fusion: The original input feature map is concatenated with the up-sampled sub-region feature maps to form the final feature representation. Through the PPM, the input feature map undergoes information extraction at different scales. For attitude estimation, multi-scale aggregation is helpful because the regression may rely on both local texture cues and broader contextual patterns; however, overly complex multi-branch pooling (as used in dense prediction tasks) can introduce unnecessary computation for a compact regression model.
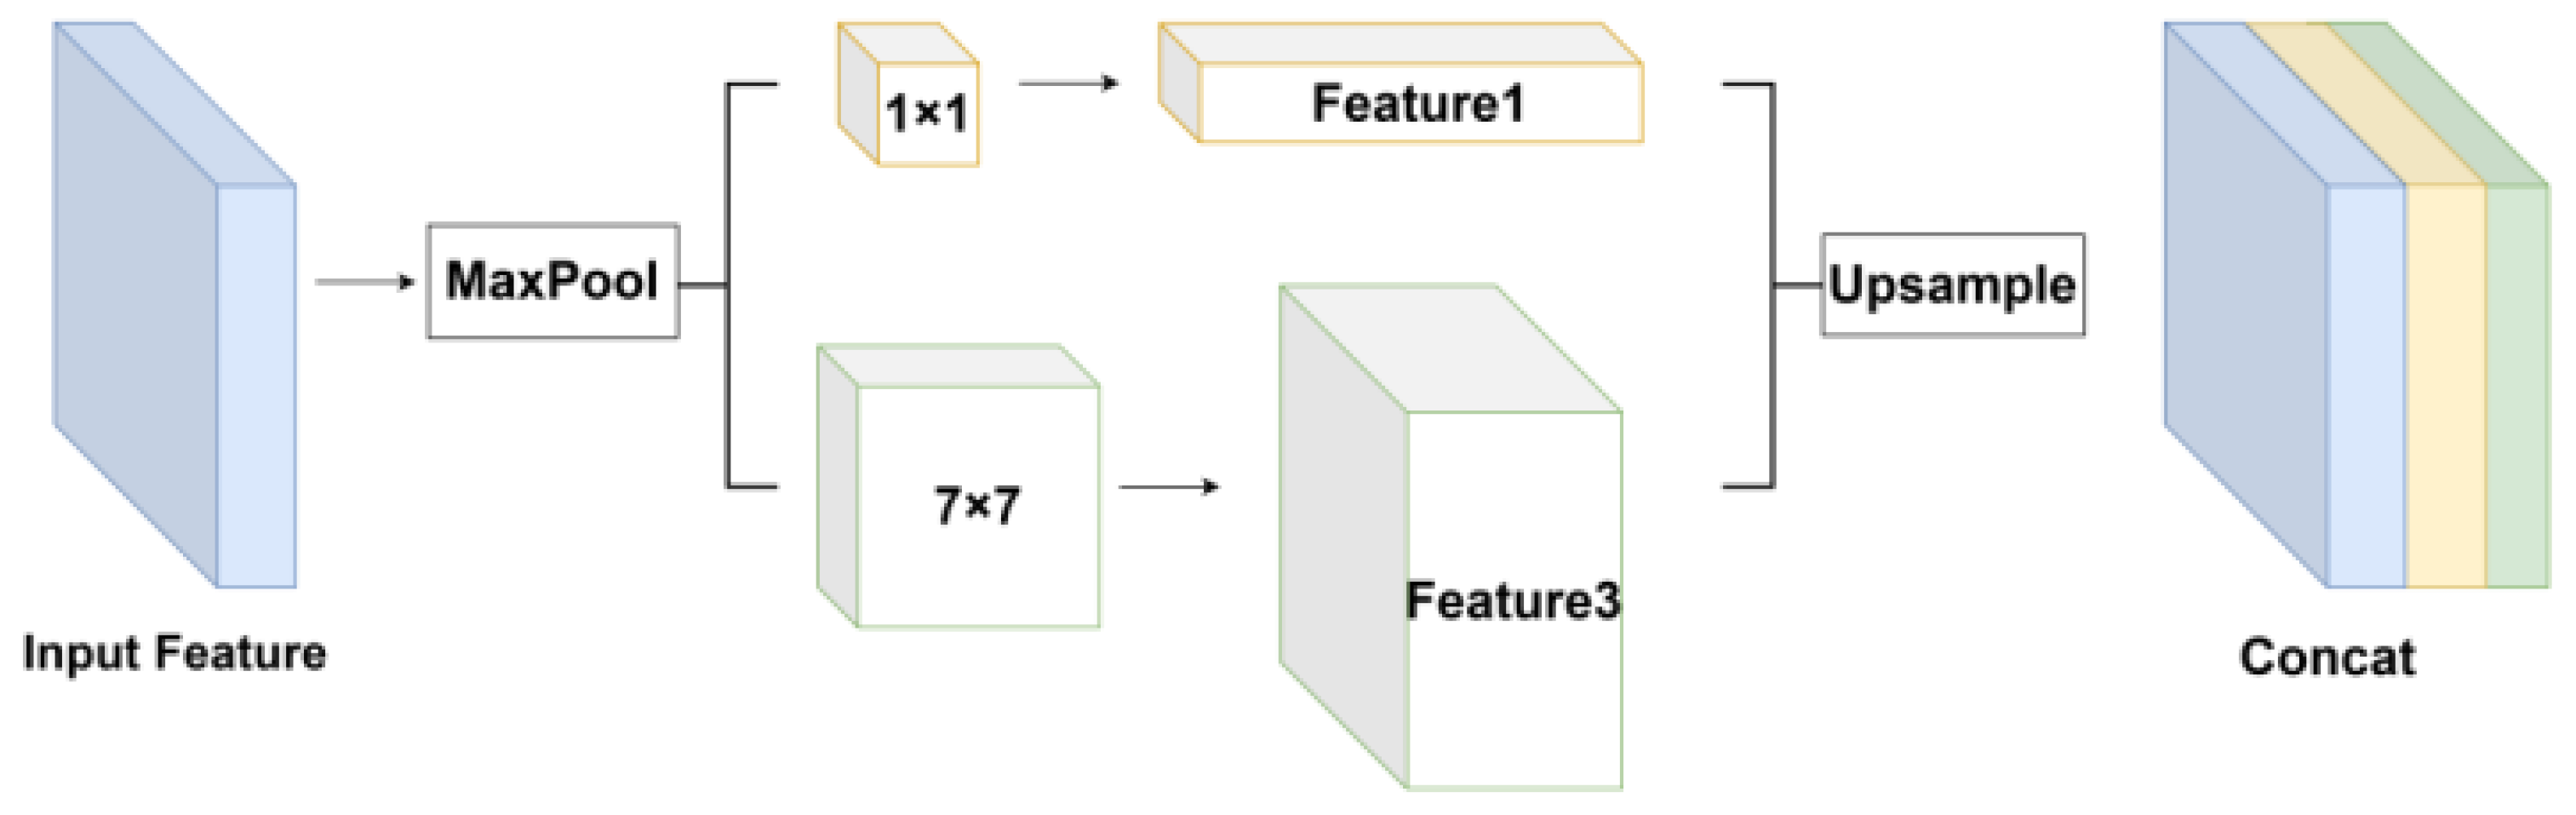
Building upon the established benefits of PPM for multi-scale feature understanding, an enhanced PPM is proposed to improve feature fusion. As shown in
Figure 8, the key innovation lies in the incorporation of a dual-scale pooling strategy (1 × 1 and 7 × 7) to establish differentiated receptive fields. Specifically, the 1 × 1 pooling branch provides a highly compressed global-context descriptor, while the 7 × 7 pooling branch preserves a larger spatial support and captures broader contextual information with relatively limited complexity. After pooling and feature transformation, the outputs of the two branches are up-sampled (if necessary) to match the spatial resolution of the original input feature map and concatenated with the original feature map along the channel dimension. Therefore, the final output is a three-branch fused feature representation with 3C channels (assuming the original input has C channels), rather than a feature map with only three channels.
The rationale for selecting the (1 × 1, 7 × 7) combination is to balance contextual coverage and computational efficiency. The 1 × 1 branch captures compact global information, whereas the 7 × 7 branch retains richer spatial structure than aggressively pooled smaller-grid branches. Compared with standard multi-scale configurations such as 1 × 1/2 × 2/3 × 3/6 × 6, this simplified dual-scale design reduces the number of branches and the corresponding fusion overhead, while still providing complementary global and spatial cues. This choice is more consistent with the lightweight and deployment-oriented objective of the proposed attitude regression framework.
2.2.4. GAP and MLP
Global Average Pooling (GAP) is employed to replace the conventional Flatten layer for feature mapping and compression. Specifically, GAP compresses multi-dimensional feature tensors into compact one-dimensional vectors by computing the mean value over the entire spatial dimension of each feature map. In contrast to the Flatten layer, which retains redundant spatial information and introduces a large number of high-dimensional fully connected parameters, GAP only requires parameters corresponding to the number of feature channels (e.g., for a 224 × 224 × 3 input, the Flatten layer requires 150,528 parameters while GAP avoids such high dimensionality), thereby significantly alleviating the risk of overfitting.
Unlike traditional classification tasks that adopt a Softmax layer to output class probability distributions, attitude estimation requires the regression of continuous attitude angles. To address this requirement, a Multilayer Perceptron (MLP) is utilized to replace the Softmax layer, enabling the network to map the extracted features directly to the attitude parameter space for accurate attitude estimation. The proposed MLP architecture consists of three fully connected layers with 1024, 512, and 256 neurons, respectively, where the GeLU activation function is uniformly adopted. The final output layer is a fully connected layer with linear activation, which is designed to generate a 3-dimensional vector corresponding to the predicted Euler angles that represent the 3D spatial attitude of the target. The 1024–512–256 design follows a gradual dimensionality reduction principle: it first preserves sufficient capacity to model the nonlinear mapping from the compact global descriptor to pose parameters, and then progressively compresses the representation to reduce overfitting risk and computation. In particular, the first layer aligns with the feature embedding dimension of the backbone output after GAP, while subsequent reductions provide a lightweight yet expressive regression head.
Furthermore, a MobileNet model pre-trained on the ImageNet dataset is adopted as the backbone network. The ImageNet dataset comprises over 14 million images categorized into 20,000 classes, and the model pre-trained on this dataset learns generalized parameters with excellent generalization capability, which is applicable to various visual tasks beyond specific domains. Employing this pre-trained backbone significantly enhances the model’s performance and generalization ability, especially for specific tasks with limited training data. Additionally, the pre-trained model has already learned abundant image features, which accelerates the convergence speed of the network on the target task and saves considerable computational resources and training time.
2.3. Experimental Setup
2.3.1. Training Details
A uniform training and optimization configuration is adopted for all four models throughout the training procedure, and a compound loss function incorporating angle correction terms is designed. All experiments are implemented on the Keras framework with TensorFlow as the backend, and model optimization is performed using the AdamW optimizer (the software optimizer implemented in PyTorch). The initial learning rate is set to 0.0005, and is dynamically adjusted via a cosine annealing learning rate scheduling strategy. The batch size is set to 4. For input preprocessing, all images are resized to a unified resolution (640 × 640) and normalized using the same scheme before training. For fine-tuning, all backbones are initialized with ImageNet-pre-trained weights and trained end-to-end using the same regression head and loss setting. Each model is trained for a total of 50 epochs. All experiments are conducted on a workstation equipped with an Intel Core i7-13700H CPU (Intel Corporation, Santa Clara, CA, USA), 32 GB RAM, and NVIDIA RTX 3060 GPU (NVIDIA Corporation, Santa Clara, CA, USA), with 512 GB + 1024 GB SSD storage.
Considering the special nature of attitude-angle regression, the direct difference
represents an angular deviation, which may not correspond to the true smallest rotation error because of angular periodicity. For example, when the predicted value is 0° and the ground truth is 360°, the prediction is semantically correct, but the direct numerical difference is 360°. If standard loss functions are used directly, such a case would be treated as a large error during gradient-based optimization, causing the optimizer to push the prediction away from the correct periodic equivalent and thereby degrading the actual prediction accuracy. To address this issue, an angular-difference correction is introduced by defining the effective angle error as
. In this way, the periodicity of angular variables is taken into account, and the training loss is computed using the corrected angular deviation rather than the raw numerical difference. The final training loss function is therefore formulated as follows:
where
,
= 1°.
2.3.2. Evaluation Metrics
Given that our evaluation centers on the predicted Euler angles, both direct angular error metrics and statistical error metrics are adopted. These metrics encompass the Mean Absolute Error (MAE), Mean Squared Error (MSE), and the Standard Deviation of Errors (Std). Their specific mathematical formulations are presented as follows:
Furthermore, practical application-oriented evaluation metrics are adopted, including model parameter count and training time.
3. Simulation Results
This section presents a series of simulation experiments to comprehensively validate the effectiveness and reliability of the proposed model. To ensure a fair comparison, all comparative methods are implemented under a unified training protocol, with evaluations performed on a synthetic dataset generated via the VTK library.
3.1. Model Performance Comparison
To verify the effectiveness of the designed model, the proposed improved model is benchmarked against several representative convolutional neural network architectures, including MobileNet, ResNet50, DenseNet, VGG16, and Convnext, all of which have attained outstanding performance in the ImageNet competition. All models are initialized with ImageNet pre-trained weights, and their final fully connected layers are modified to accommodate the target dataset. A consistent hyperparameter configuration, encompassing batch size, epoch count, and learning rate, is adopted for training. Evaluation is performed using MSE, MAE, per-axis mean errors (Err_X, Err_Y, Err_Z), model parameter count, and training time.
Table 1 presents the performance metrics of the different models. MobileNetPlus achieved an MSE of 0.041, which is slightly higher than ResNet50 (0.022) and VGG16 (0.010), but significantly lower than DenseNet (0.239) and ConvNext (0.225), despite having a similar number of model parameters. Similarly, MobileNetPlus’s MAE (0.169) also falls between ResNet50 and VGG16 and is significantly lower than DenseNet and ConvNext. In terms of errors across the three dimensions, MobileNetPlus exhibited relatively balanced performance, without any significant weakness, and performed relatively well on Err_Y and Err_Z. Despite having a slightly higher number of parameters than MobileNet, MobileNetPlus’s training time was only 8 min 12 s, significantly less than other models, taking less than half or even one-third of the training time of ResNet50, DenseNet, and VGG16. Compared to the original MobileNet, MobileNetPlus showed superior performance in terms of MSE, MAE, Err_X, Err_Y, and Err_Z, with errors reduced by nearly half. Although the number of parameters increased slightly, the training time was comparable to the original MobileNet. Through comparative analysis, MobileNetPlus demonstrated competitive performance on multiple error metrics. It achieved good prediction performance and training efficiency while maintaining relatively low model complexity, making it competitive in various application scenarios.
3.2. Ablation Experiments
To quantitatively assess the contribution of each proposed module to the overall model performance, a set of controlled ablation experiments is conducted. To ensure comparability and exclude confounding factors, all model variants are trained on the same dataset with identical hyperparameters, optimization schemes and training protocols, where only the target module under analysis is varied. Performance is evaluated using Mean Squared Error (MSE) and Mean Absolute Error (MAE).
As summarized in
Table 2, the results exhibit a clear and consistent trend: the overall accuracy improves progressively as each module is added to the baseline network in a sequential manner. Specifically, introducing the SE module decreases the MSE from 0.079 to 0.067 and the MAE from 0.239 to 0.198. This improvement indicates that channel-wise attention can effectively recalibrate feature responses and refine the extracted representations. Building upon this, adding the PPM module further reduces the MSE from 0.067 to 0.055 and the MAE from 0.198 to 0.184, demonstrating that multi-scale contextual aggregation provides additional discriminative cues for the regression task. Subsequently, the inclusion of the GAP module leads to another decrease in error (MSE: 0.055 → 0.048; MAE: 0.184 → 0.177), highlighting the importance of compact global feature summarization and its potential role in improving robustness and mitigating overfitting. Finally, the introduction of the MLP head reduces the MSE from 0.048 to 0.041 and the MAE from 0.177 to 0.169. This result suggests that a deeper nonlinear regression head can enhance function approximation capability and ultimately improve pose angle prediction accuracy. Overall, these ablation results validate that each proposed module makes a positive contribution, and their combination leads to the best performance.
3.3. Generalization Performance Comparison
A further simulation experiment is conducted to evaluate the model’s in-domain robustness on previously unseen synthetic samples and to eliminate the possibility of overfitting to a specific dataset. In this experiment, a new image dataset is generated using the VTK library. This dataset shares the same angle range as the dataset used in the previous section but with randomly generated specific spatial attitude angles, ensuring no regularity. Importantly, this newly generated dataset is used only as an independent test set and is not involved in training or validation. A total of 100 simulated images are generated. Although limited in size, this set serves as a sanity-check to verify that the trained model performs consistently on randomly sampled poses within the same synthetic domain.
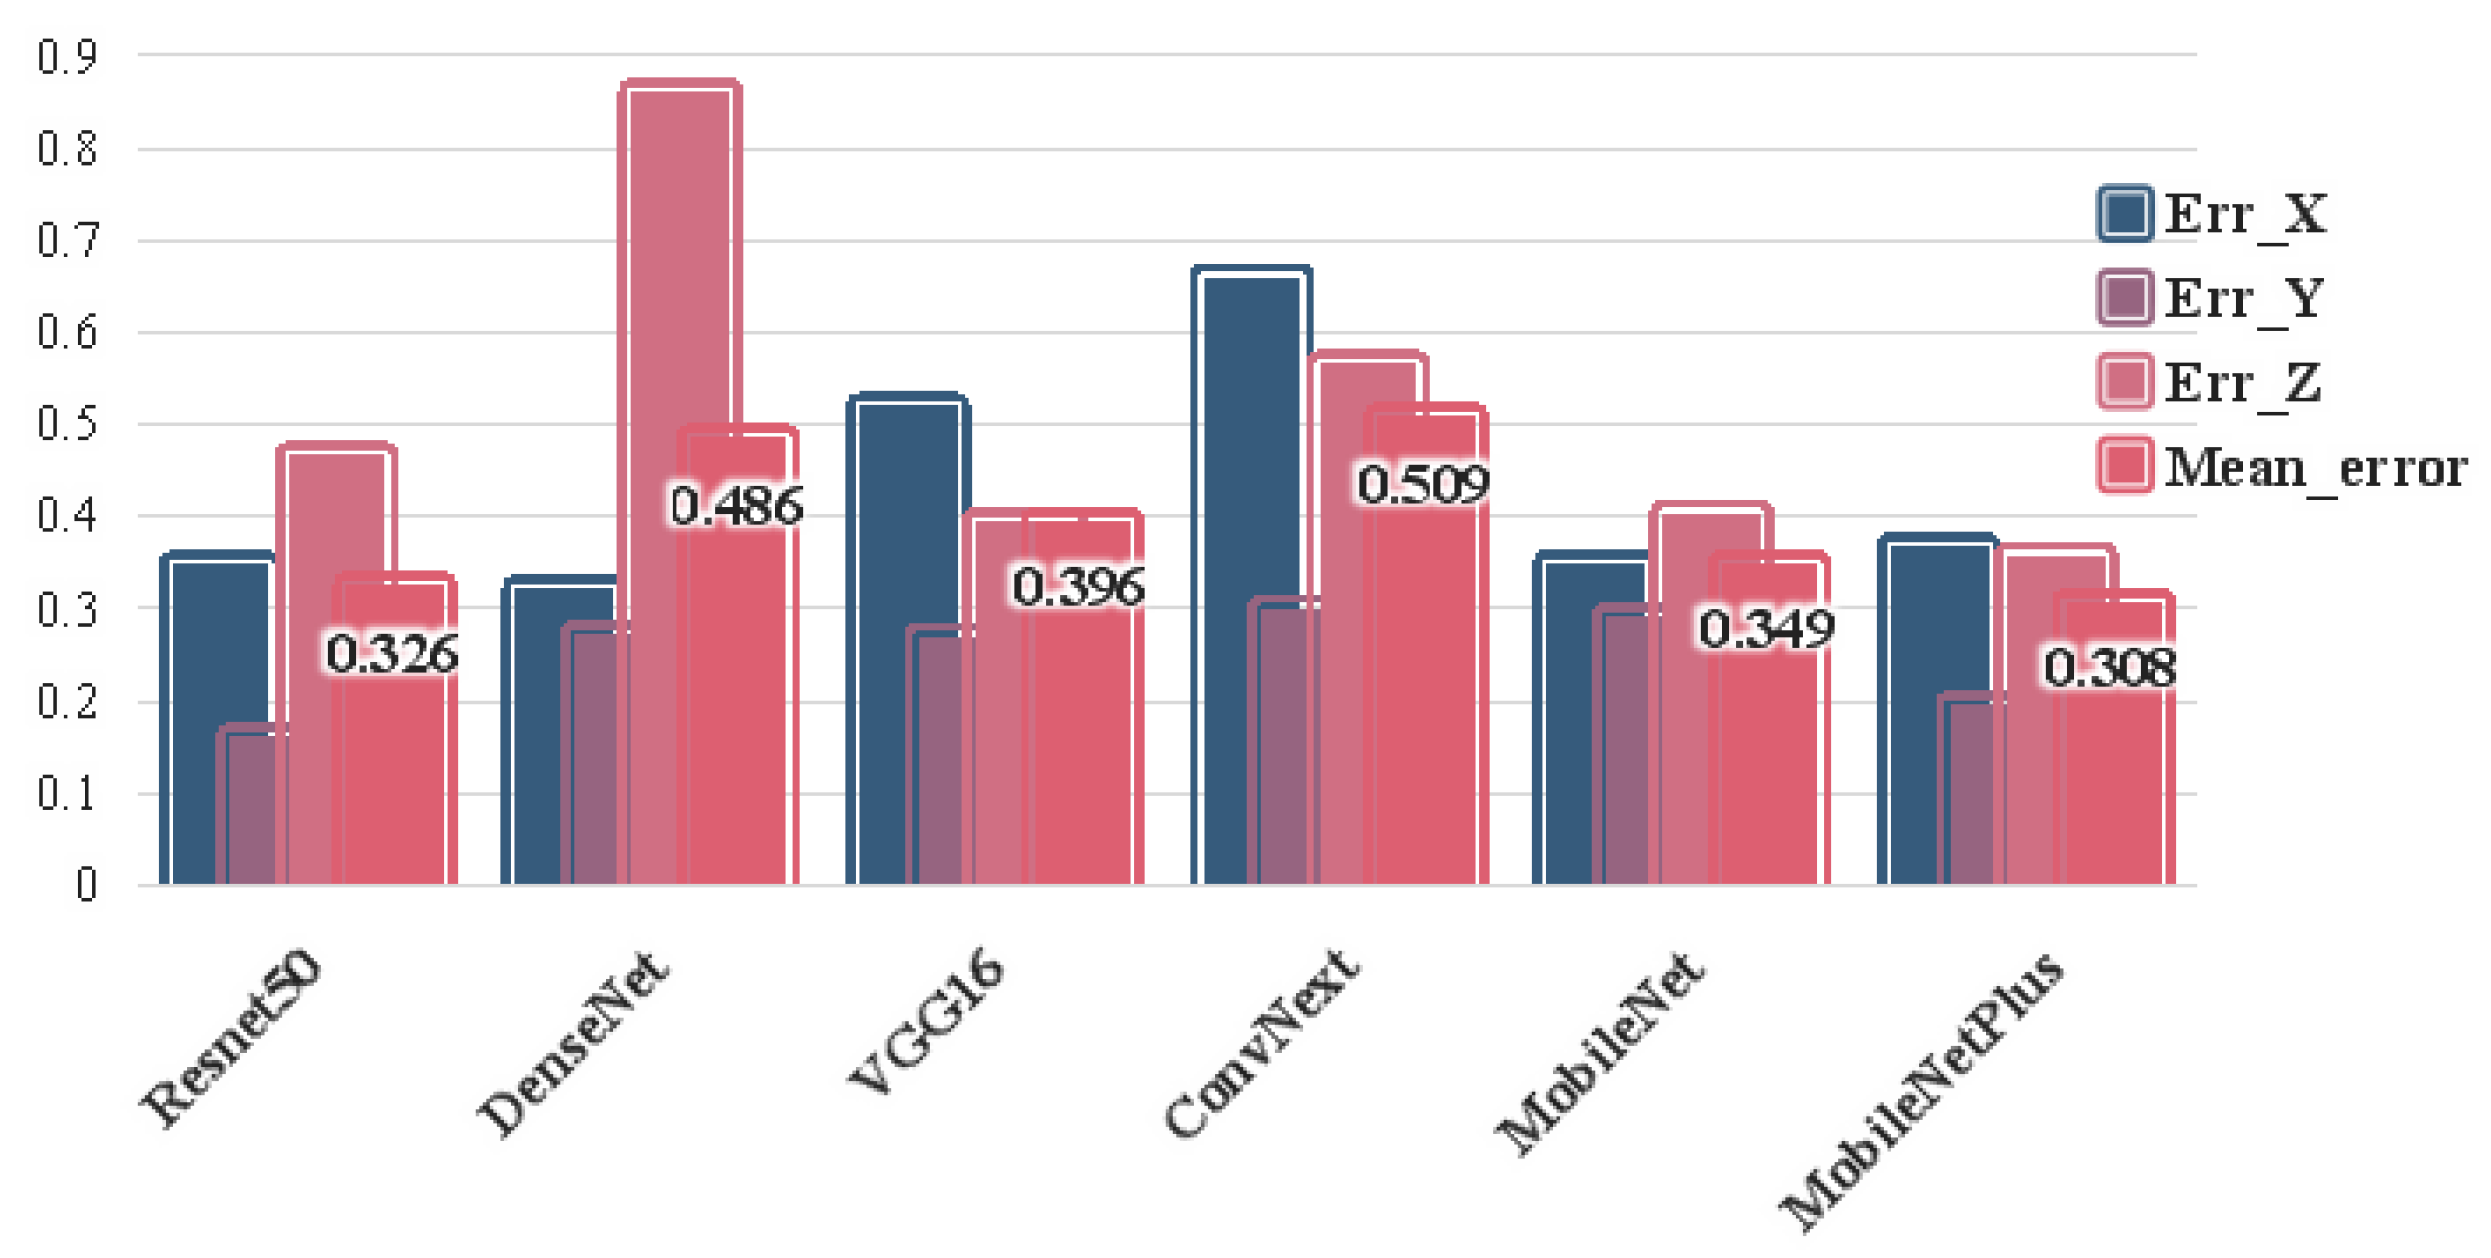
The proposed model is evaluated on the simulated image dataset to assess its in-domain generalization capability. As illustrated in
Figure 9, MobileNet-based architectures—particularly the enhanced MobileNetPlus—achieved superior performance compared to ResNet and VGG variants. Despite marginally lower training accuracy, MobileNetPlus demonstrated the lowest average prediction error (0.308°) across all axes (Err_X = 0.31°, Err_Y = 0.29°, Err_Z = 0.33°), outperforming both the baseline MobileNet (0.349°) and conventional CNNs. Crucially, the balanced error distribution (standard deviation < 0.02° per axis) and minimal generalization gap (<0.05° between training and test errors) suggest its robustness against overfitting. The integration of SE attention and PPM modules reduced the baseline error by 23.7%, validating their efficacy in enhancing multi-scale feature discrimination. These results confirm the model’s adaptability to synthetic imagery. We note that, since this test set is generated using the same simulation pipeline, it evaluates robustness within the synthetic domain rather than cross-domain (synthetic-to-real) generalization; the latter is discussed using real-image experiments in
Section 4.
4. Experimental Validation with a 3D-Printed Prototype
This section presents physical experiments to validate the effectiveness of the proposed attitude estimation method on real objects. Distinct from the preceding synthetic data-based experiments, these tests employ actual physical particles, where captured images are preprocessed and normalized prior to input into the trained model. A total of 40 real images are collected and used only for testing to evaluate the model’s generalization under real imaging conditions. The experimental results demonstrate the model’s performance in practical scenarios, including both prediction accuracy and robustness.
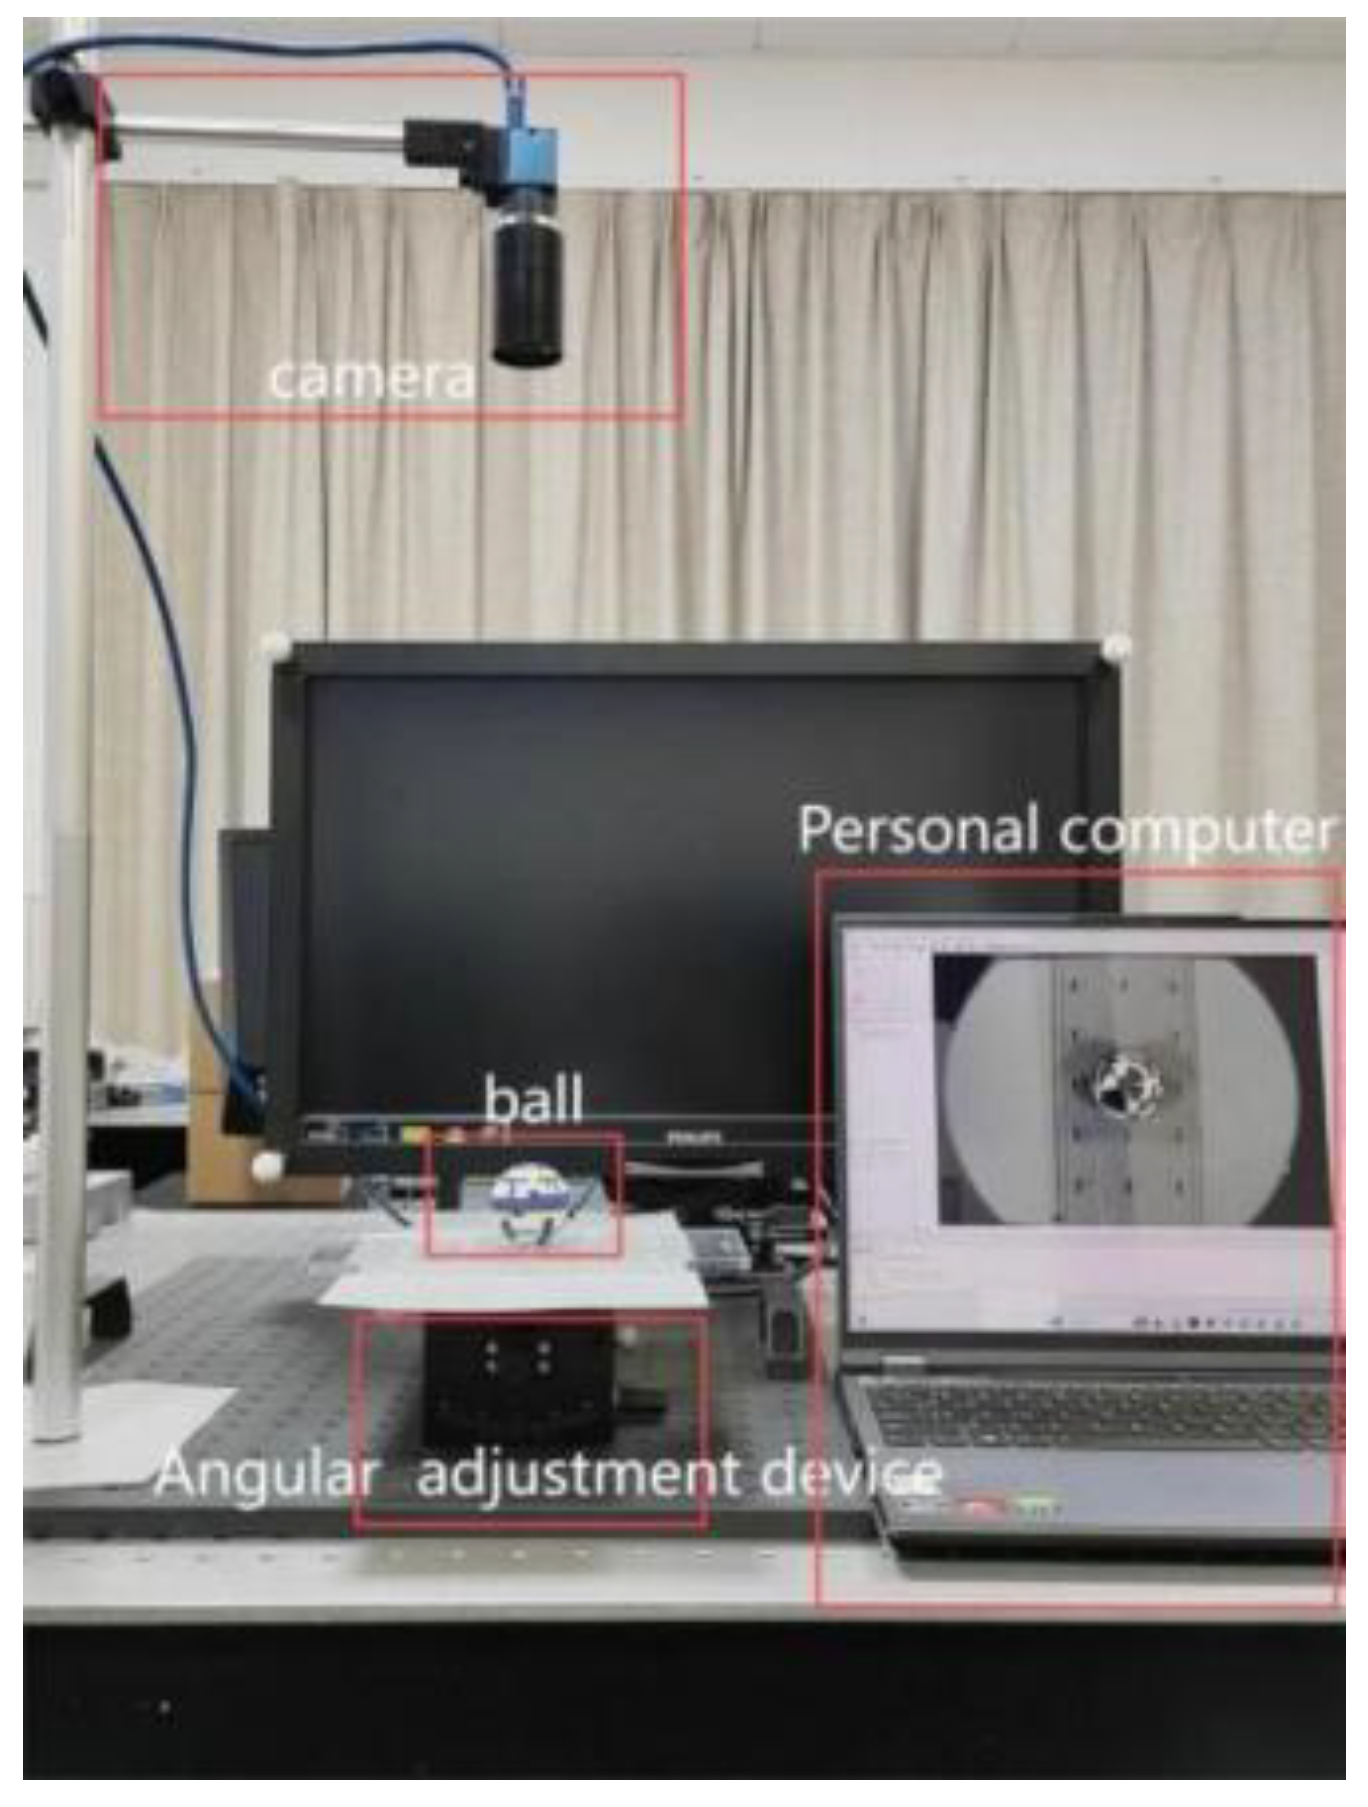
All experiments are conducted in a controlled environment. A real spherical particle is 3D-printed in accordance with the designed simulation model and texture pattern. Images are captured by fixing the particle on a three-axis (X-Y-Z) angular displacement stage and utilizing an industrial CMOS camera connected to a personal computer. Illumination is provided by indoor fluorescent ceiling lights. The camera-to-object distance is adjusted such that the particle occupies an appropriate size in the captured images, and the distance is then kept fixed during data acquisition to ensure consistency. The PC is used for image processing and for running the proposed attitude estimation pipeline. To avoid background color interference on image quality, a white PVC sheet is placed between the particle and the angular displacement stage, with a structured perforated acrylic plate added for additional particle fixation. The overall system setup is illustrated in
Figure 10.
Before image acquisition, a pose calibration step is performed to align the physical particle with the reference pose used in the synthetic dataset. Specifically, the particle is adjusted until its pose in the camera view matches the 0–0–0° reference in the sample library, thereby establishing a consistent relationship between the observation coordinate system and the Euler-angle coordinate system. After calibration, the particle is rotated using the angular displacement stage to capture images at different poses.
4.1. Image Preprocessing and Augmentation
To prepare the real-world images for the trained model, a comprehensive preprocessing and enhancement pipeline is applied [
40,
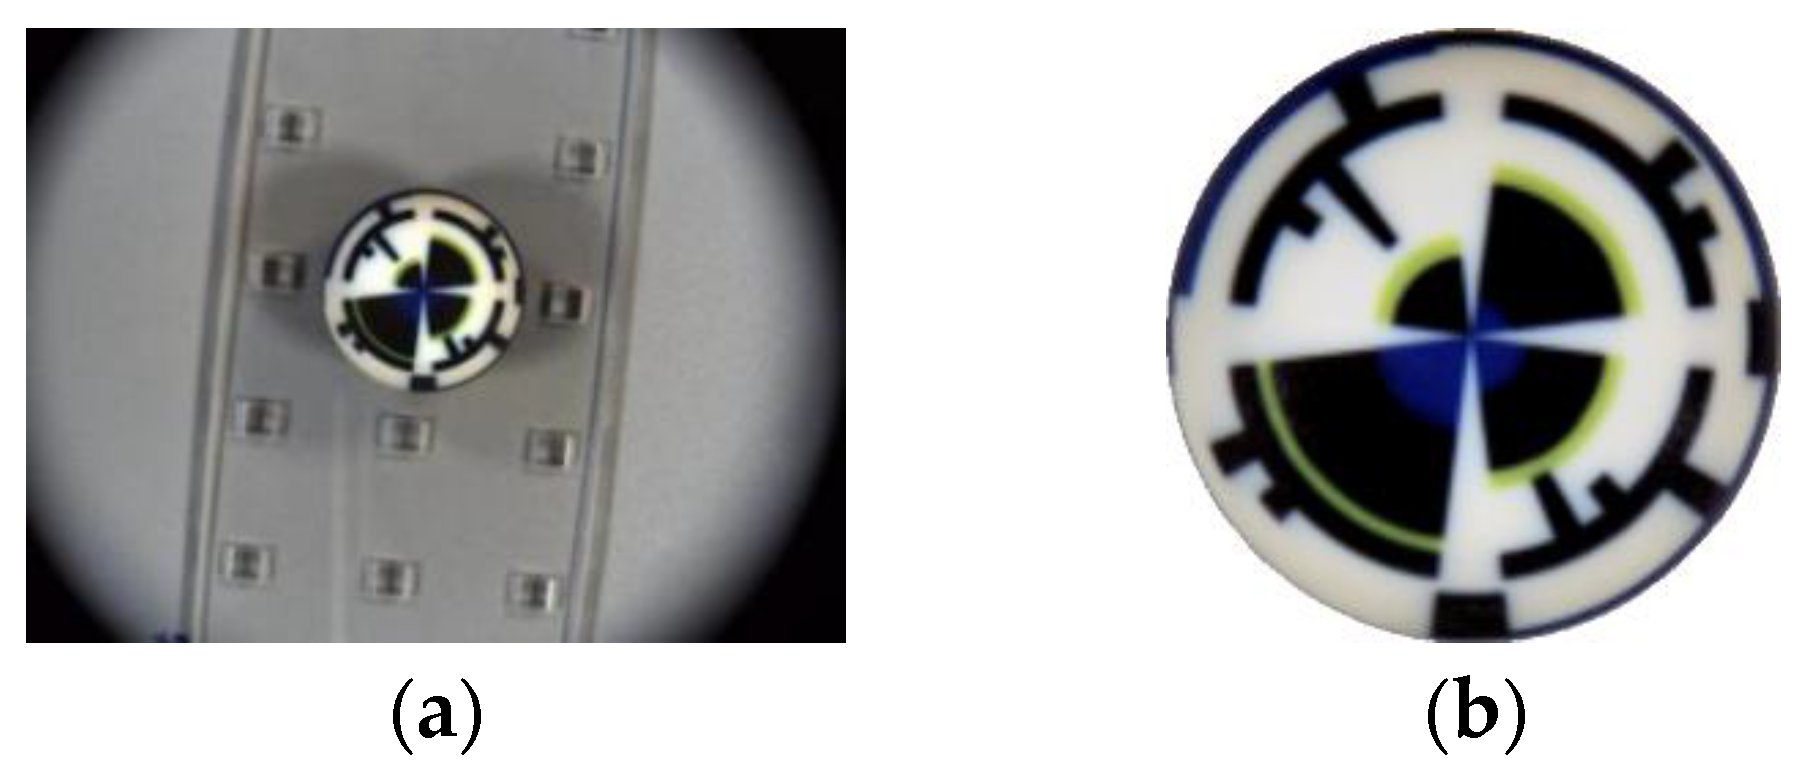
41]. Real images are often much larger than the model’s 224 × 224 input requirement (e.g., 2048 × 1536 pixels), and the target particle sizes and proportions may differ from the training data, as illustrated in
Figure 11a. The pipeline consists of the following steps. First, image enhancement is performed using multi-scale retinex with color restoration (MSRCR) to improve local contrast and brightness, mitigating color distortion and providing a more realistic visual representation. Second, target localization is carried out using the Hough Circle Transform algorithm to identify the particle’s circular position within the image. Third, the target region extraction is achieved by contour detection, ellipse fitting, and masking, which isolates the particle from the background. Finally, the extracted target region is resized to 224 × 224 pixels to match the model input, as shown in
Figure 11b.
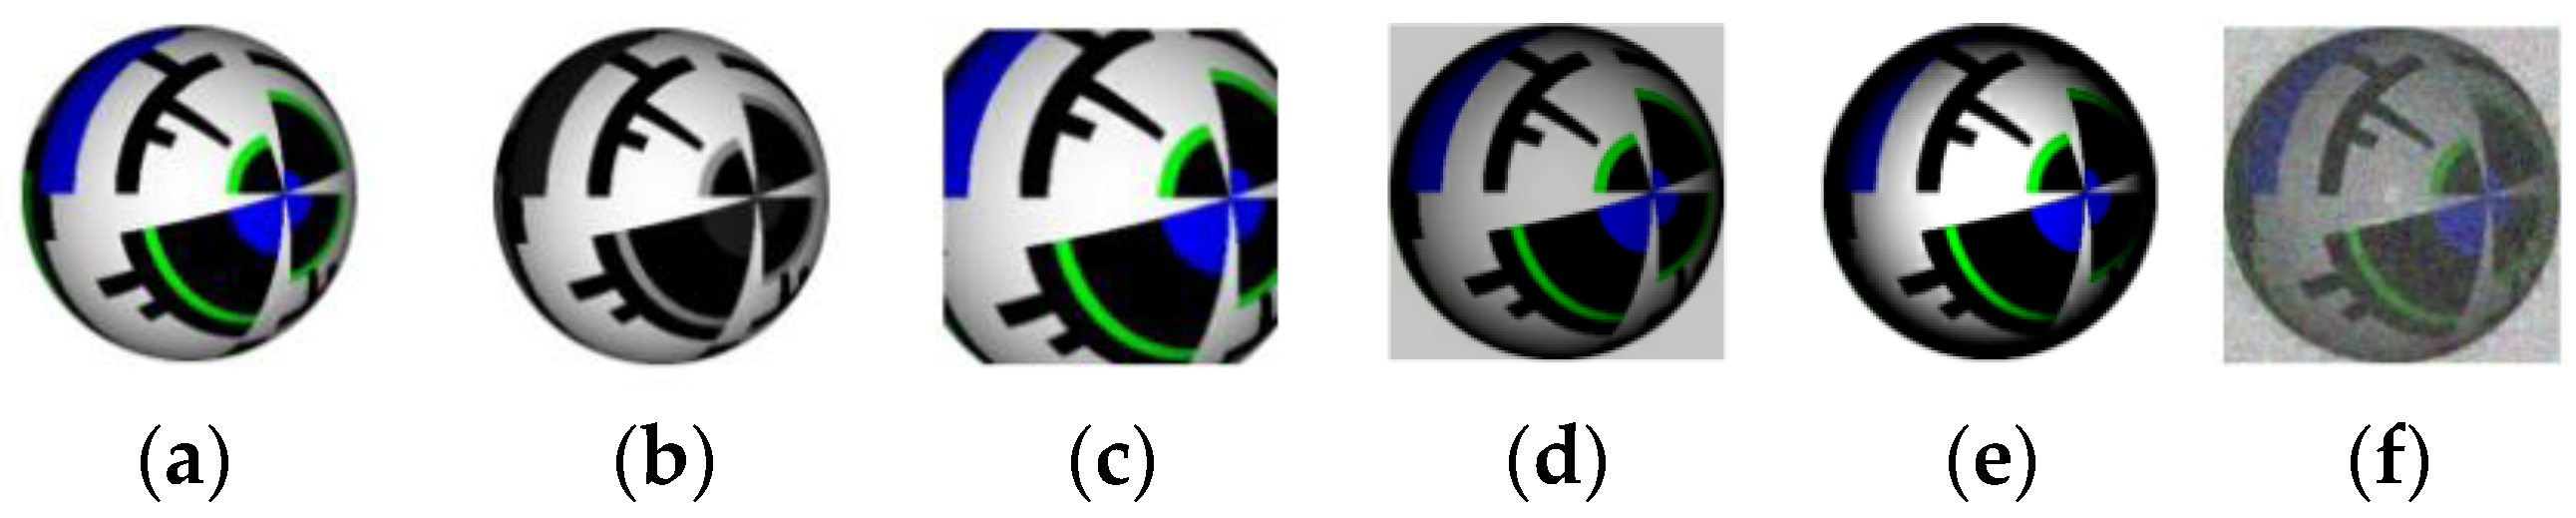
Subsequent to preprocessing, image augmentation is further implemented to enhance the model’s generalization capability and enrich training sample diversity. As summarized in
Figure 12, the adopted augmentation pipeline comprises grayscale conversion, 20% edge cropping, random saturation/brightness adjustments, image standardization, and random noise injection. These operations are designed to simulate common practical imaging variations (e.g., illumination changes, contrast fluctuations, partial boundary truncation, and sensor noise) while preserving the particle’s essential geometric layout. Specifically, grayscale conversion reduces the network’s reliance on color cues and emphasizes shape-related features; edge cropping introduces mild boundary spatial perturbations to improve robustness against imperfect localization; photometric adjustments (saturation and brightness) emulate diverse lighting conditions; standardization stabilizes input distribution; and random noise enhances tolerance to measurement noise. Overall, this augmentation strategy expands the effective training set by approximately sixfold, substantially enriching sample diversity while retaining key positional and texture information critical for accurate pose estimation.
4.2. Experimental Results
Real photographs of the 3D-printed spherical particle are collected under laboratory imaging conditions and organized into a real-image dataset. Due to the inevitable domain gap between rendered images and real camera captures (illumination non-uniformity, sensor noise, and reflection effects), all images are processed using the same preprocessing pipeline described above to ensure a consistent input format. For a controlled analysis of the domain-bridging effect, we evaluate the model on both raw real images (without preprocessing) and preprocessed real images.
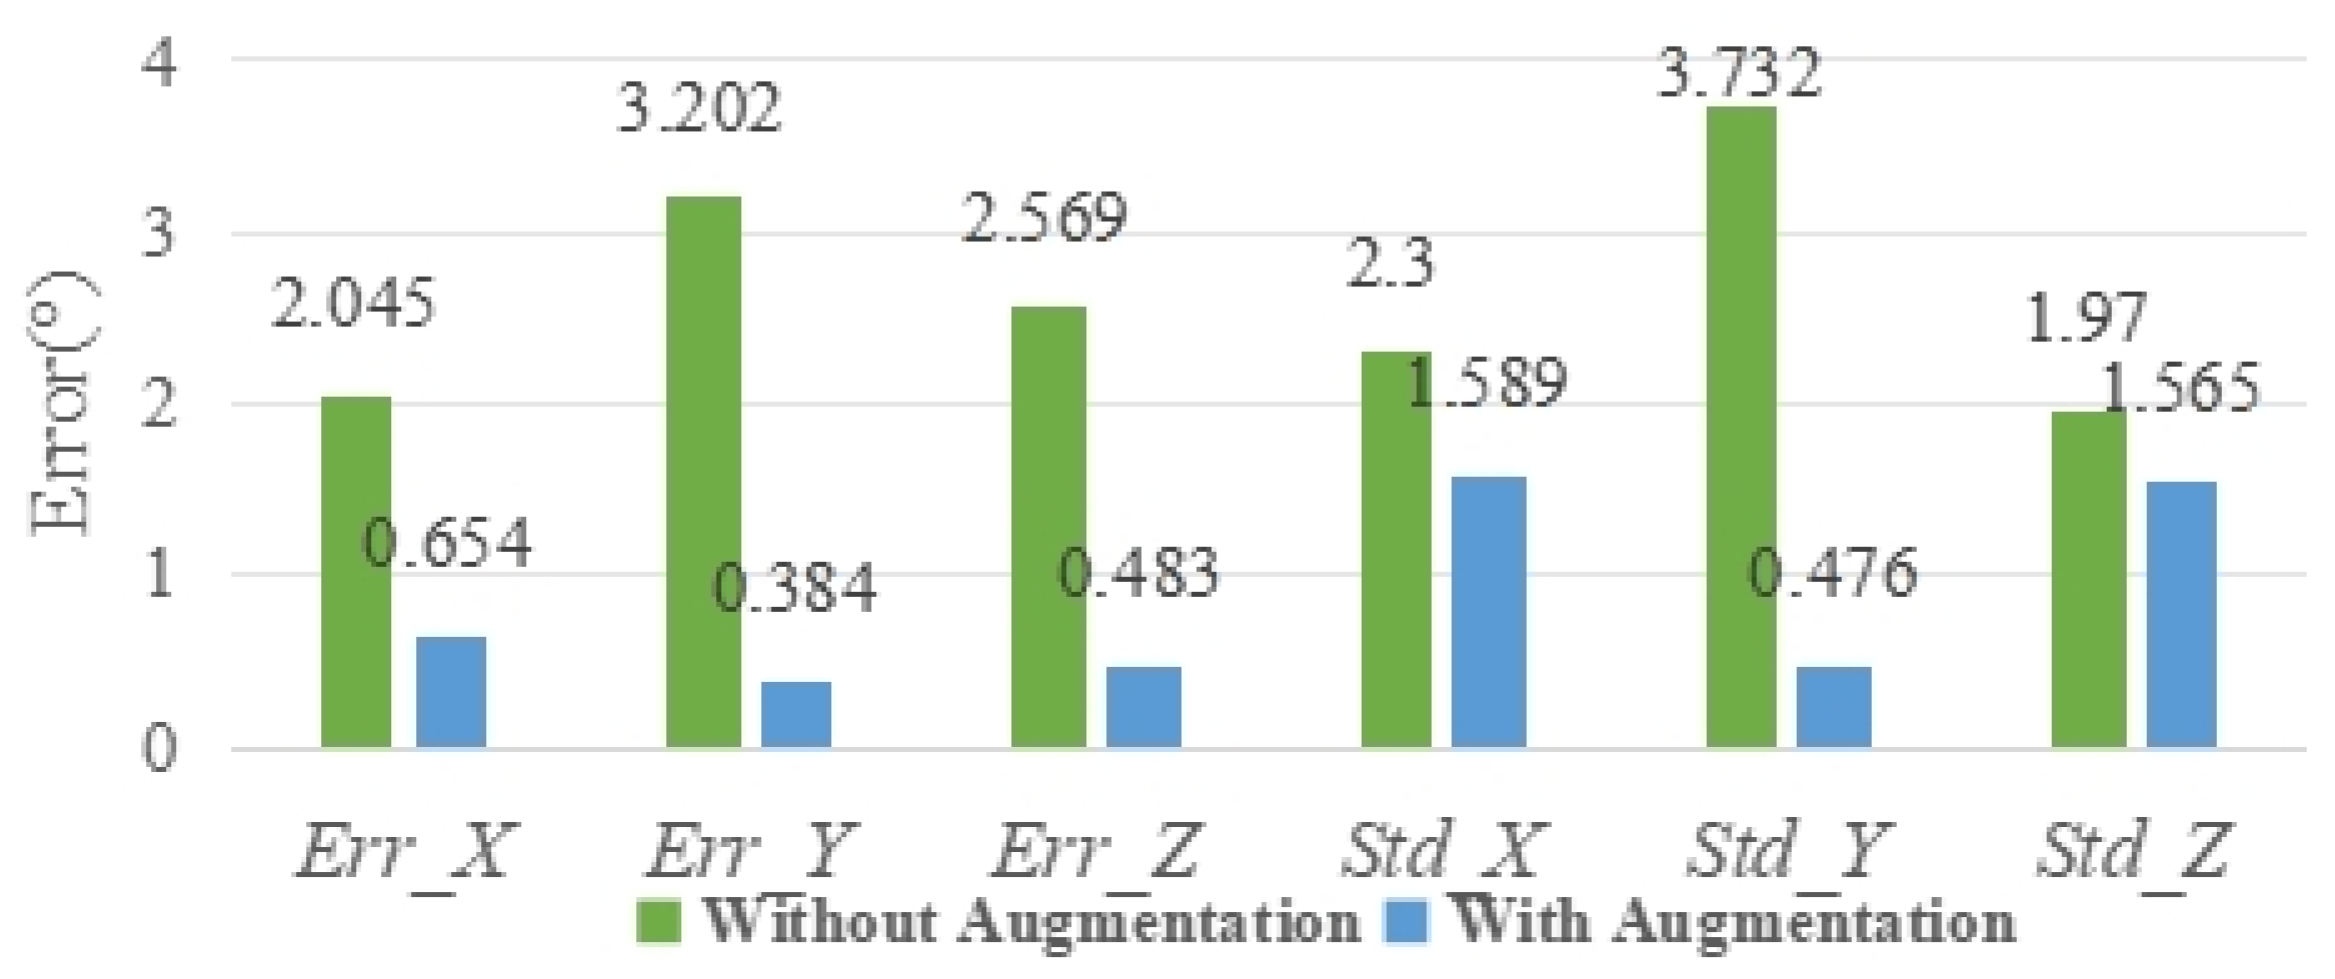
Figure 13 summarizes the prediction error statistics for the three pose angles before and after preprocessing. As shown in
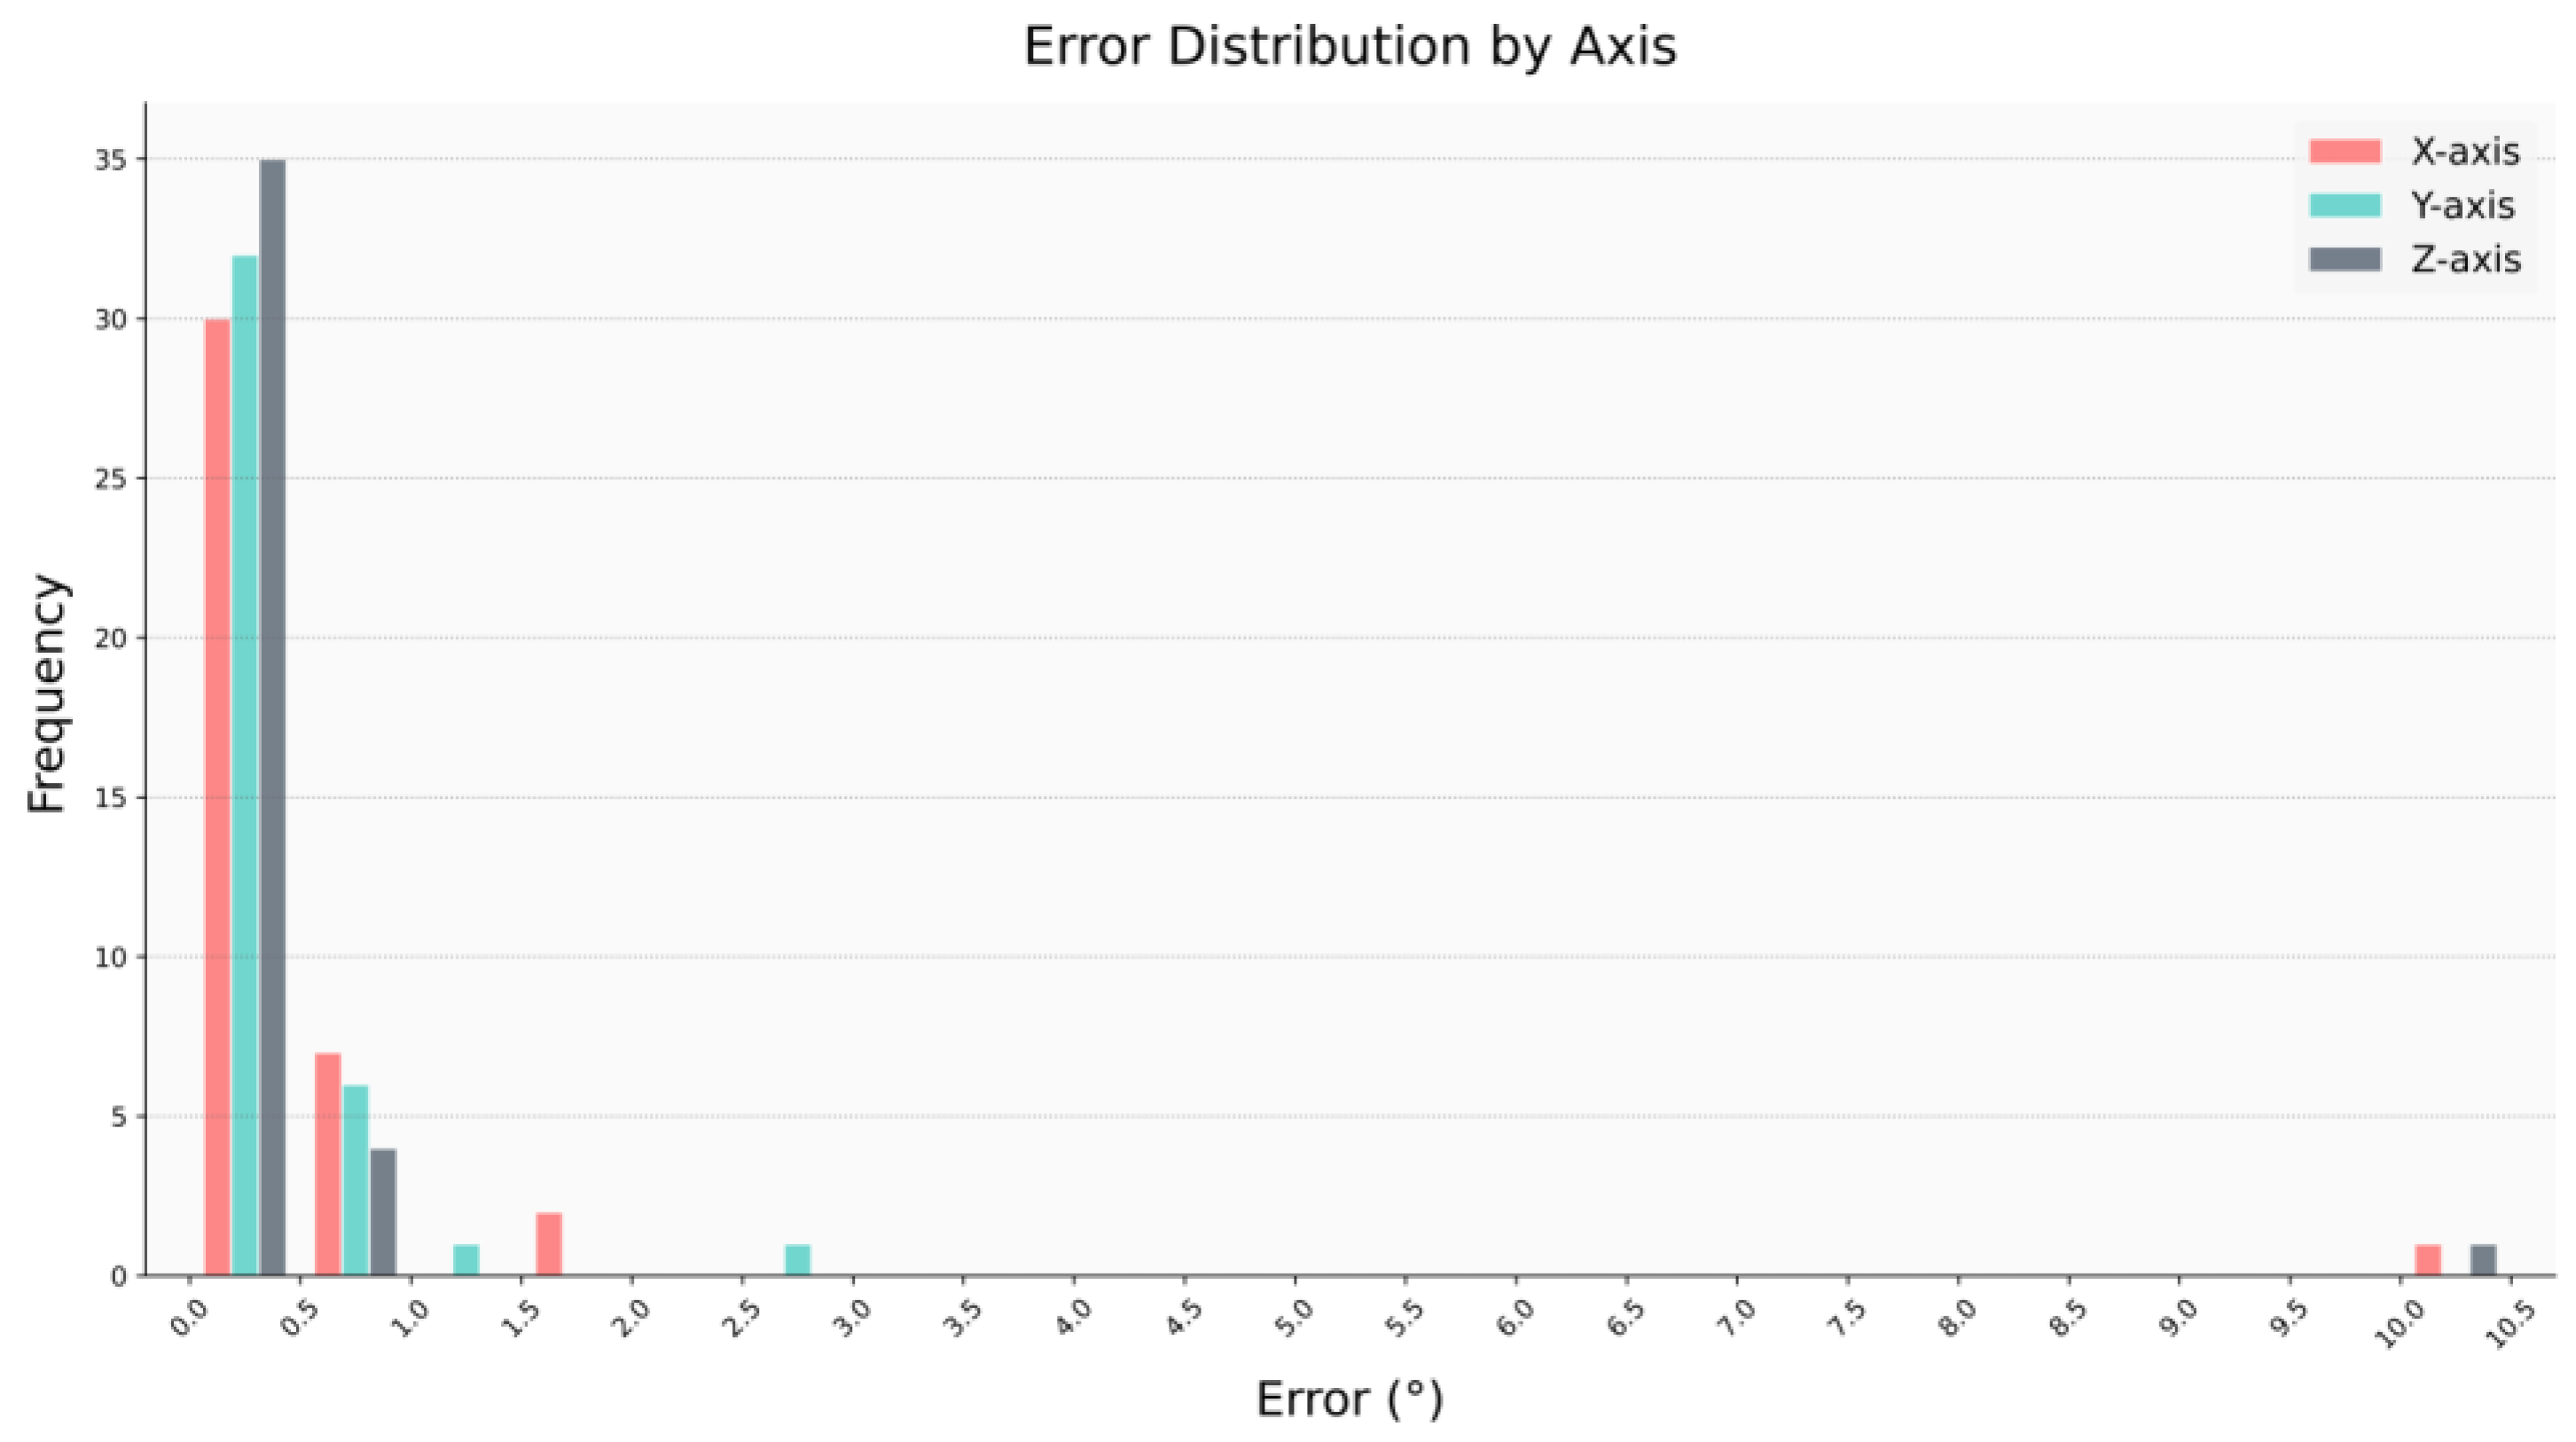
Figure 13, the three-axis mean error decreases from 2.605° (raw) to 0.474° (preprocessed), a reduction of 2.132°. As illustrated, the proposed method achieves a three-axis mean error of approximately 0.5° with relatively small standard deviations. Additionally, the error distributions are well balanced across the X/Y/Z axes, with no noticeable instability or abnormal error amplification on any axis. To provide a more comprehensive statistical view beyond mean values,
Figure 14 further visualizes the error distribution (frequency histogram) for the X/Y/Z axes on the real test set. The histogram shows that the majority of samples fall within a low-error range, with only a small number of outliers, which further supports the stability of the proposed method under real imaging conditions. These results confirm that the proposed preprocessing and learning framework can be effectively transferred to real captured images, maintaining high accuracy and stability in practical measurements and thus verifying its feasibility for real-world deployment.
5. Discussion
This study is developed under the working hypothesis that a lightweight network can achieve accurate visual attitude regression, while synthetic data and augmentation can reduce the reliance on manual annotations. The experimental results demonstrate that the proposed MobileNetPlus attains competitive regression accuracy with low model complexity and a short training time. In the backbone comparison, MobileNetPlus achieves MSE = 0.041 and MAE = 0.169 with only 7.2 M parameters and an 8 min 12 s training time, nearly halving the error metrics compared with the original MobileNet, thereby showing a favorable efficiency–accuracy trade-off. Moreover, the ablation study provides a module-wise explanation of the performance gains, consistent with the hypothesis. Specifically, introducing the SE block reduces MSE from 0.079 to 0.067 and MAE from 0.239 to 0.198, suggesting that channel recalibration enhances attitude-relevant texture and edge responses. Adding PPM further improves the performance (MSE 0.067→0.055), indicating that multi-scale contextual information is beneficial for attitude regression, especially when texture contrast is weak or local cues are unstable. GAP brings additional gains (MSE 0.055→0.048), implying that a more compact global representation may help suppress overfitting and improve generalization. Finally, the MLP regression head yields a notable improvement (MSE 0.048→0.041), highlighting the importance of stronger nonlinear mapping for continuous angle regression. Overall, these results support MobileNetPlus as a lightweight and deployment-friendly attitude regression framework that balances accuracy and efficiency under constrained resources.
Beyond synthetic evaluation, we further validate the method on real captured images of a 3D-printed particle.
Figure 13 shows that the three-axis mean error decreases from 2.605° on raw real images to 0.474° after preprocessing, and the per-axis errors remain balanced without abnormal amplification. To provide a more informative statistical view beyond mean values,
Figure 14 visualizes the error distribution on the real test set, indicating that most samples fall within a small-error range with only a limited number of outliers. These results suggest that, although real images differ from synthetic renderings, the proposed preprocessing and learning framework can be transferred to real measurements with stable performance under the tested laboratory conditions.
Despite these results validating the effectiveness of the proposed method, several boundary conditions should be considered. First, the current task focuses on a textured sphere, where texture observability plays a central role in pose identifiability. Therefore, the approach is currently validated on a relatively simple geometry with a deliberately designed texture pattern, and its performance may degrade when the target exhibits weaker or ambiguous textures, more complex shapes/topologies, or partial occlusions and truncations that reduce the visibility of informative surface cues. In such cases, the pose regression problem can become less well-conditioned, and additional mechanisms (more diverse training perturbations, occlusion-aware augmentation, or stronger feature modeling) may be required.
Second, the angle range and sampling strategy of the synthetic data (0–36° with a 3° step using three-axis combinatorial pose sampling) constrain the training distribution. Importantly, the dataset is generated by sampling (θx, θy, θz) and forming coupled multi-axis pose combinations, rather than rotating one axis at a time. As a result, systematic evaluation is still required under conditions closer to practical scenarios, such as larger angle ranges, continuous pose transitions, and coupled multi-axis rotations. Nevertheless, limiting the pose range remains a deliberate trade-off for a controlled feasibility study: extending the same 3° step to 0–180° would yield 613 (≈2.27 × 10⁵) pose combinations, and extending to 0–360° would yield 1213 (≈1.77 × 10⁶) combinations, substantially increasing rendering, storage, and training costs. Accordingly, the current results should be interpreted as validating the method within a bounded pose range rather than fully characterizing performance over the entire orientation space.
Third, the use of Euler angles as regression targets warrants careful discussion. Euler-angle regression can be sensitive to angular periodicity and discontinuities in broader ranges (e.g., wrap-around near ±180°). In this study, Euler angles are adopted because they align naturally with the three-axis displacement stage settings and provide a direct and interpretable parameterization for the controlled experimental setup. Moreover, the restricted angular range (0–36°) avoids periodic discontinuities, making Euler-angle regression stable under the current conditions. For broader orientation coverage, alternative representations (e.g., quaternions, rotation matrices, or sine–cosine encoding of angles) may be preferable and will be considered in future extensions.
Accordingly, future improvements should focus on expanding pose coverage and enhancing robustness to distribution shifts, for example by generating synthetic datasets with wider ranges and denser sampling, incorporating more challenging perturbations (illumination variation, texture degradation, and occlusion), and integrating a small amount of real data via domain adaptation or semi-supervised joint training to further improve stability and usability in real-world applications. Finally, we note that standardized runtime benchmarking (per-image latency/FPS on specified hardware) and repeated-seed experiments would further strengthen the statistical and deployment-oriented evaluation, especially when performance gaps are small and datasets are limited; these aspects are therefore identified as important future work directions.
6. Conclusions
In this study, a deep learning-based visual attitude estimation method is proposed and validated using spherical particles. The approach first utilizes a virtual dataset generation pipeline to create synthetic images with accurately labeled Euler angles, providing a high-quality and efficient training foundation. Subsequently, the model is applied to physical spherical particles, where preprocessing and image augmentation ensured robust and accurate predictions. Experimental results demonstrate that the proposed method achieves high precision, with an average three-axis error of approximately 0.5° and stable performance across individual images. These results confirm the effectiveness of the method in both simulated and real-world scenarios. The lightweight and efficient characteristics of the network, combined with its demonstrated accuracy, indicate that this approach can be extended to a wide range of applications, including industrial inspection, motion tracking, and fluid dynamics, where rapid and reliable attitude estimation is essential.





 ,
,