1. Introduction
The widespread adoption of the Internet has driven digital transformations across various aspects of human activities, particularly in education and research [
1]. Along this trend, academic discussions have gradually shifted from traditional face-to-face interactions to virtual communications, as online meeting platforms and video presentations have become widely used [
2,
3]. As a result, it has become common to record academic presentations for later review, allowing students and researchers to take time focusing on specific slides or sections of interest when they have the time [
4].
Recorded lessons have emerged as a durable feature of the post-COVID hybrid ecology, simultaneously delivering flexibility for students while surfacing unresolved tensions regarding engagement, instructor workload, and quality assurance [
5]. Existing literature has largely privileged student outcomes. Comparatively little research has centered on the instructors’ design–delivery–workload experiences in this hybrid scheme. Consequently, the manual transformation of these raw recordings into navigable resources remains inefficient [
6,
7]. Meanwhile, automated methods typically process the entire recording as a single sequence, merging different topics across different slides into one [
8,
9,
10]. As a result, these approaches often miss contextual relationships between narrations and visual elements, reducing the contextual completeness and clarity of the extracted information.
To overcome the limitations of existing approaches, this paper propose a Slide Annotation System that performs robust multimodal analysis by integrating visual, auditory, and textual information from recorded presentation videos. The technical novelty of this work lies in its end-to-end integration of spatially anchored annotations that are inserted into the PowerPoint as comments. Unlike prior extraction-based pipelines that generate detached summaries, this approach ensures that generated annotations remains attached to the specific visual elements, such as texts or figures. To support this integration, this study introduce a hybrid two-stage segmentation strategy that prioritizes OCR for precision while employing a visual change fallback using Structural Similarity Index Measure (SSIM) to ensure robustness against occlusions. Furthermore, the system incorporates a alignment framework combining semantic similarity with spatial and symbolic cues, achieving 90.0% accuracy in anchoring annotations to their correct visual context. This integration enables users to navigate the presentation video efficiently and focus on key information when revisiting it.
We evaluated the proposed system through both quantitative measurements and qualitative feedback from 37 participants who used the system to review three recorded presentation videos. The evaluation included investigations of segmentation accuracy, annotation validity, and user task performance based on success rates and interaction patterns. For qualitative evaluation, open-ended feedback were collected and usability were assessed using the System Usability Scale (SUS) questionnaire. The results show that participants achieved a high rate of task success, with feedback consistently highlighting the system’s ability to streamline the information retrieval process. The system also achieved a high SUS score of 80.5 (Standard Deviation , 95% Confidence Intervals ), confirming its effectiveness in supporting clear and slide-specific annotations for efficient review.
The remainder of this paper is structured as follows:
Section 2 reviews related work in video annotation and multimodal analysis.
Section 3 introduces the proposed system for automatic slide annotation.
Section 4 describes the experimental design, evaluation methods, and results of both quantitative and qualitative analyses. Finally,
Section 5 concludes the paper and outlines directions for future work.
2. Related Work
This section establishes the pedagogical and theoretical foundations for the study, reviews existing technical methodologies in video processing and multimodal analysis, and identifies critical ethical considerations for AI-enhanced learning systems.
2.1. Theoretical Framework and Educational Context
To transition from raw recorded lectures to designed learning objects, this study ground the approach in the
Cognitive Theory of Multimedia Learning (CTML) [
11] and
Universal Design for Learning (UDL) [
12].
CTML posits that effective learning requires reducing extraneous cognitive load by chunking continuous information into manageable segments. Simultaneously,
UDL principles advocate for multiple means of representation, such as searchable transcripts and visual signaling, to support diverse learner needs.
In high-density academic contexts like Hong Kong, where large class sizes and tight timetabling constrain active learning, recorded video provides essential flexibility [
5]. However, access alone is insufficient; the
Community of Inquiry (CoI) framework suggests that video only enhances cognitive presence when teaching presence is intentionally designed around it [
13]. In spite of that, the effort expectancy of manually creating such resources remains a barrier. By addressing instructor workload through automation, our system aligns with
Technology Acceptance Models (UTAUT), aiming to support instructor identity as learning designers without imposing unsustainable labor demands [
14].
2.2. Fragmentation Methods in Recorded Videos
While
CTML emphasizes the pedagogical necessity of segmentation for cognitive offloading, automating this process remains technically challenging. Slide segmentation is a specialized subset of video shot boundary detection. Fundamental methods for fragmenting a video involve identifying visual information when there are significant differences in movement, color, or pixel information between frames [
15]. Classic global approaches typically rely on low-level visual features. For instance, pixel-level metrics like the
SSIM and
Color Histogram comparisons are widely used baselines that detect transitions when the global visual structure shifts significantly [
16]. Edge-based methods further refine this by tracking the stability of edge maps such as the Canny edge detection, to distinguish meaningful scene changes from minor lighting variations [
17].
More recently, deep learning approaches have attempted to learn semantic transition features directly from video frames. In [
18], Sindel et al. employed
Convolutional Neural Networks (CNNs), to address the limitations of earlier text matching methods for detecting slide transitions. However, this approach still produced relatively low
scores, highlighting the weakness of purely supervised learning in this domain; models trained on specific lecture styles often fail to generalize to unseen scenarios or variable layouts. Similarly, Yuan and Zhang [
19] proposed focusing on
color clustering changes in small regions (CCSR), which is computationally efficient but highly sensitive to localized color shifts caused by animations or pointer movements.
In the specific domain of educational lecture videos, these visual-only methods face significant challenges. “Talking head” presenters often occlude parts of the slide, and pointer movements or minor animations can trigger false positives in
SSIM or
Histogram–based detectors. Conversely, static slides with long audio explanations may result in false negatives. Early research by Che et al. [
20] attempted to solve this using
OCR, but achieved low video fragmentation accuracy (<50%) due to text extraction difficulties. To overcome these limitations, this study utilize a domain-specific
ROI-based
OCR strategy to track explicit slide numbers as a semantic ground truth, while employing a
visual fallback once primary
OCR approach fails.
2.3. Speech Recognition and LLM-Based Analysis
Research involving audio generally relies on speech recognition to extract information from audio signals. Recent works have shifted toward transformer-based models and
Large Language Model (LLMs) to enhance the usefulness and context-awareness of the extracted information. In [
21], LeFevre et al. proposed using
LLM, as an additional processing layer to correct transcription errors by considering conversational context. However, it introduces significant computational overhead, as
LLM is not lightweight enough for real-time execution.
In addition, Sapena and Onaindia [
22] proposed another approach for improving transcription accuracy by combining embeddings from audio and text features with the XLM-RoBERTa model to classify teacher actions from their speech. This multimodal approach leverages the transformer architecture to better capture textual context. However, some action classes achieved low
scores. Accuracy could be improved by increasing the dataset size or by using a more advanced transcription model, such as Whisper, which has been shown to achieve accuracy comparable to that of professional transcribers [
23].
Chen et al. [
24] also applied an
LLM to filter noise in instructional video narratives, which contain irrelevant narration and unreliable timestamps. The narration was summarized by the
LLM and matched with video segments through pseudo-matching. This process successfully improved performance compared to previous state-of-the-art methods. However, due to the non-deterministic nature of
LLMs, it can produce different filter outputs across experiments, making the results less consistent. Therefore, these limitations highlight the need for robust transcription and for selectively applying
LLMs only when necessary.
2.4. Summarization and Keywords Extraction for Slide Annotation
Summarization and keyword extraction are core tasks in
Information and Communication Technology (ICT) that traditionally rely on specialized models to generate condensed representations of a text’s key ideas [
25]. However, recent advances in
LLMs provide an alternative approach [
26]. By using a single model, these systems can generate both compact summaries and reflective keywords, which can be viewed as annotations [
27]. When these annotations are aligned with the corresponding visual elements, their comprehension value is enhanced [
28].
Several studies have explored applying these models to lecture videos. Haz et al. [
29] applied abstractive summarization to automatically produce localized meeting minutes for each slide, capturing detailed information. Similarly, Gonzalez et al. [
30] employed GPT-3 large language model (OpenAI, San Francisco, CA, USA) to summarize lecture videos, reporting that participants who accessed these summaries achieved better learning experiences. More recently, multimodal pipelines like
SlideSpecs [
31] and
RAG-based frameworks have been proposed to extract text and visual elements to generate comprehensive lecture notes or searchable indices [
32].
While these systems effectively generate summaries, they predominantly function as extraction pipelines, outputting results as detached text reports, separate web pages, or side-by-side video interfaces. They lack in situ integration, which is the ability to write the generated insights back into the original working document. This disconnect forces users to switch contexts between the summary and the source material. Our work addresses this gap by generating the annotation and specifically anchor it spatially within the original PowerPoint file as comments, transforming the static presentation into a self-contained, interactive learning artifact.
2.5. Multimodal Understanding
The integration of visual, auditory, and textual information to obtain richer context is the core of multimodal understanding [
33]. Its application in education has grown considerably with the shift toward online learning, increasing availability of digital learning materials and the emergence of
LLMs [
34].
In this context, Singh et al. [
35] proposed leveraging multimodal data to better interpret instructional content, enabling more accurate segmentation of lecture recordings and thereby improving students review experiences. A related effort by Lee et al. [
36] introduced PolyViLT, a model for cross-modal retrieval between text and visual elements, which demonstrated superior performance compared to earlier approaches.
Building on these trends, Wright et al. [
37] applied multimodal
Retrieval-Augmented Generation (RAG) to a large amount of digital textbooks and classroom data, developing an intelligent assistant capable of providing more accurate context. Their findings confirm that multimodal
RAG can improve the quality of
LLM-generated responses. However, Li et al. [
38] reported that when the quantity of context is less than the model’s context window, introducing
RAG may add unnecessary complexity and even degrade output quality. Therefore, in scenarios where the available context fits within the context window, full-context or long-text prompting proves to be more effective [
39]. Additionally, as these multimodal systems become more autonomous in generating educational content, they inevitably surface critical questions regarding the transparency, ownership, and integrity of the synthesized material.
2.6. Ethics, Privacy, and Academic Integrity
The automation of educational content creation introduces specific challenges regarding data privacy and academic integrity. As highlighted by recent studies on Generative
AI in education, the black box nature of
AI summaries raises significant concerns regarding transparency and hallucination [
40]. Ensuring that
LLM-generated annotations are auditable by instructors is essential for maintaining institutional trust and preventing the propagation of misinformation. Furthermore, local policies regarding
Intellectual Property (IP) and student data consent must guide the deployment of such analytics. It is critical that video feedback loops are used to improve course design and personalize learning, rather than serving as tools for intrusive surveillance [
41].
3. Multimodal Analysis for Slide AnNotation System
This section presents the proposed system and its workflow, integrating insights from related work and outlining the implementation.
3.1. System Overview
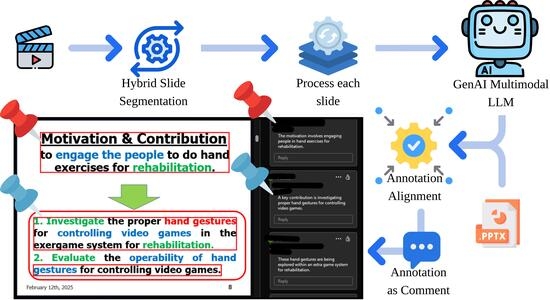
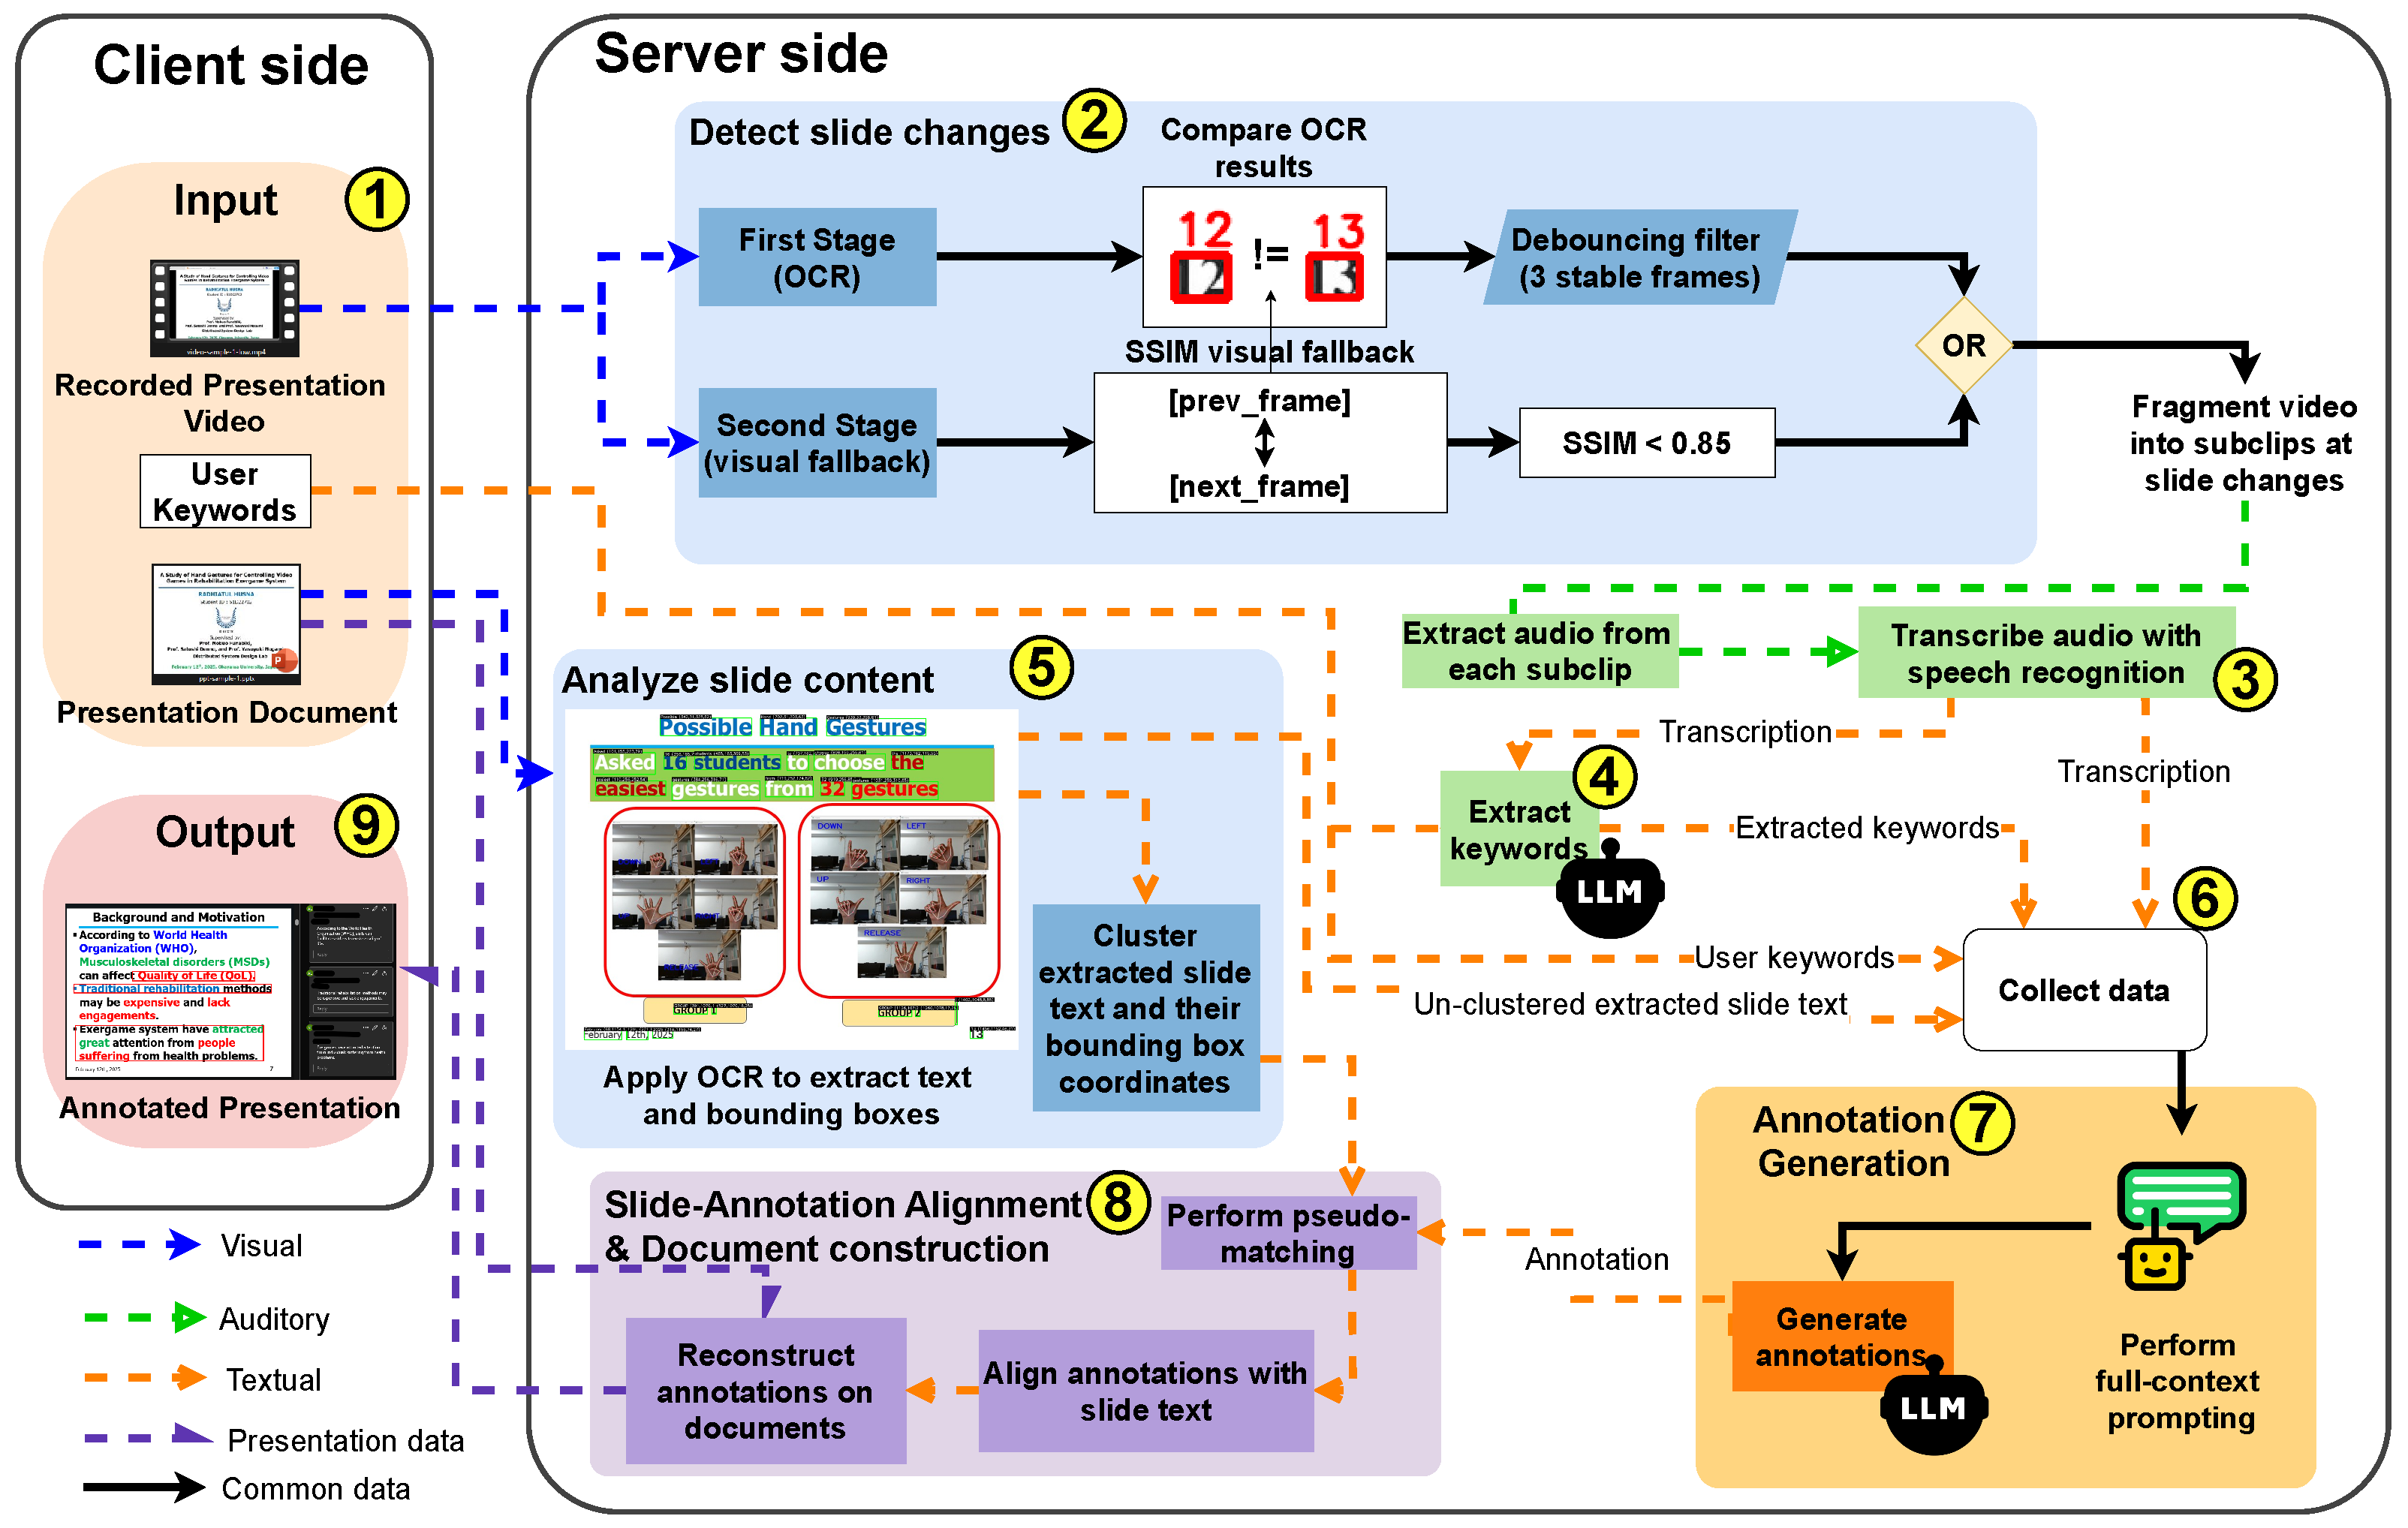
This study applies multimodal analysis to support the automatic generation of slide annotations. The proposed system is implemented as a web-based application consisting of a client side for user interaction and a server side for the core processing. An overview of the proposed
Slide Annotation System is shown in
Figure 1.
On the client side, the system provides a user interface that allows users to upload presentation video and documents, specify keywords of interest, and retrieve the final annotated output. On the server side, the system first segments the video by detecting slide transitions using the Two-Stage detection, where if the OCR fails to detect slide change the visual fallback mechanism using SSIM operates. For each segmented clip, the corresponding audio is transcribed using speech recognition. Keywords are extracted from the transcription according to the user-defined keywords of interest. Meanwhile, the presentation slides are processed using OCR to obtain slide text and bounding box information. These multimodal data are then fused and used as input for an LLM-based annotation generation process. The generated annotations are aligned with the extracted slide text through an approximate text-matching step. Finally, the aligned annotations are reconstructed within the presentation document and provided to the user.
3.2. Input
The proposed system relies on three primary inputs, the recorded presentation video, the presentation document, and user-defined keywords. The User Interface (UI) is implemented as a web-based application using Streamlit.
The uploaded presentation video serves as the primary source of visual and auditory information, with a resolution of
at 30 frames per second and an audio sampling rate of 48 kHz. The system supports common video formats such as
.AVI and
.MP4. After the video is uploaded, the user is prompted to define a
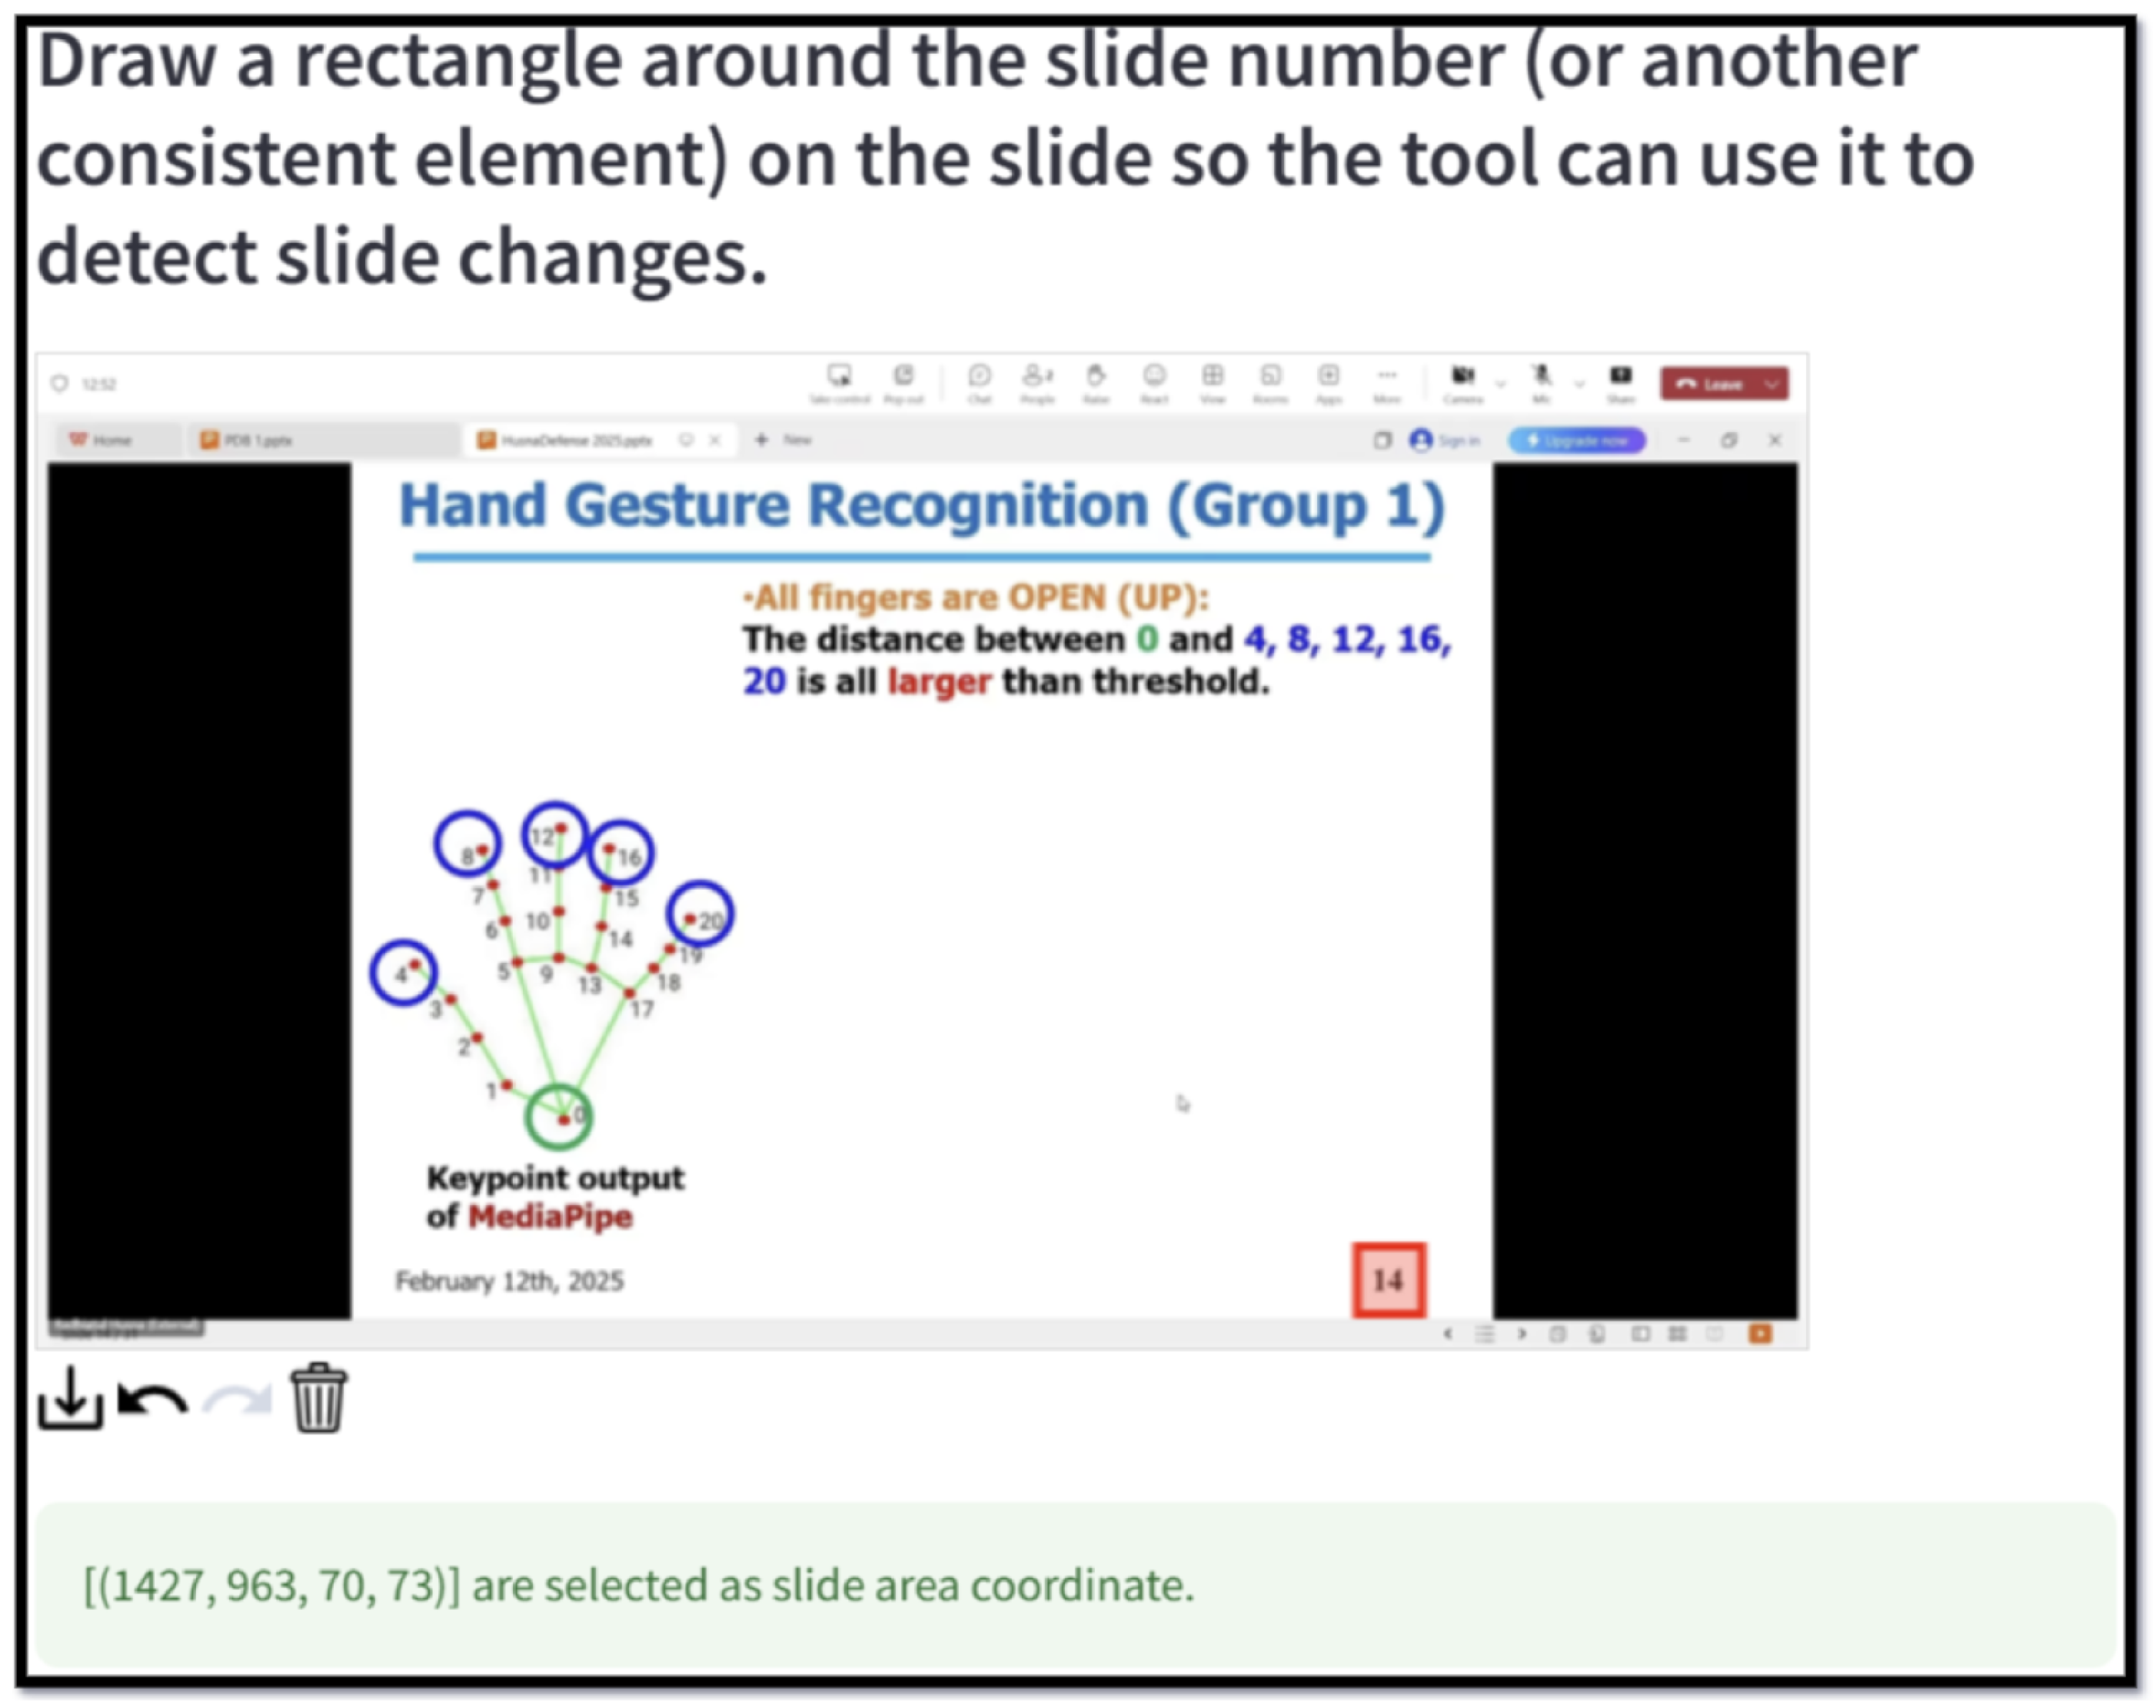
Region of Interest (ROI) by drawing a rectangle around a consistent visual element, typically the slide number or a fixed footer, within a sampled reference frame. This
ROI is displayed in the interface, as shown in
Figure 2, to enable digit recognition by
OCR and visual stability checks.
The uploaded presentation document serves as a basis for reconstructing the final annotated presentation and contributes additional textual information extracted through Optical Character Recognition (OCR). OCR processing extracts both the text content and the corresponding bounding box coordinates from each slide. Additionally, user-defined keywords guide the annotation generation process by emphasizing terms of interest, helping to generate more focused and contextually relevant annotations.
3.3. Processing
This subsection describes the processing pipeline, outlining the main automated operations running in the background to minimize user involvement.
3.3.1. Slide Change Detection
In this paper, segmentation refers to the temporal partitioning of presentation videos into slide-level clips, while prior works often rely solely on detecting slide numbers via
OCR [
19,
20], such methods can be prone to failure when numbers are obscured, absent, or decorative. The complete proposed hybrid workflow is summarized in Algorithm 1.
| Algorithm 1 Hybrid slide segmentation (OCR with visual fallback). |
- Require:
V (VideoClip), (Coordinates), (SSIM Threshold: 0.85) - Ensure:
Clips: list of records
- 1:
; - 2:
- 3:
for to step do ▹ Sampling interval (3s) - 4:
- 5:
- 6:
- 7:
if is valid number then ▹ Stage 1: OCR Check - 8:
if and then ▹ Debouncing - 9:
- 10:
▹ Update reference number - 11:
end if - 12:
else ▹ Stage 2: visual fallback - 13:
- 14:
if then - 15:
- 16:
end if - 17:
end if - 18:
if then - 19:
▹ Record timestamp - 20:
▹ Update reference frame - 21:
end if - 22:
end for - 23:
; WriteToFile(B, “boundaries.txt”) - 24:
Clips ← ExtractAudioSegments() - 25:
return Clips
|
First,
Tesseract OCR extracts numeric indicators from the
ROI. A temporal debouncing filter is applied to mitigate flickering noise; a transition is recorded only if the digit sequence changes and remains stable for a 3-frame window. This duration was optimized to eliminate noise without latency, as seen in
Section 4.4.
Second, as a fallback for low-confidence
OCR, the system computes the
SSIM between frames. A boundary is triggered if the score drops below
, indicating significant visual change. This threshold was empirically tuned to maximize recall while minimizing false positives, as detailed in
Section 4.4.
3.3.2. Speech Recognition
As most semantic content in presentations is conveyed through speech, this component transcribed each segmented clip’s audio into text. Whisper, an open-source
Automatic Speech Recognition (ASR) model from OpenAI known for its robustness and high accuracy under diverse conditions, is employed [
22,
24]. The
small.en variant is chosen for its balance of accuracy and computational efficiency for English speech [
42]. The raw audio stream was processed directly without external
Voice Activity Detection (VAD) or additional
DSP noise suppression, relying on the model’s architecture to robustly handle the ambient acoustic conditions typical of lecture recordings.
To reduce noise, raw transcripts are cleaned by removing filler words such as “um”, “yeah”, and “uh” without altering the meaning. Cleaned transcripts are paired with file names and stored in structured JSON format for data exchange. The workflow is summarized in Algorithm 2.
| Algorithm 2 Whisper-based transcription pipeline with filler removal and JSON storage. |
- Require:
W: Whisper ASR model (preloaded); Clips: list of records ; F: predefined filler-word set - Ensure:
segments.json: JSON file with cleaned transcripts and filenames
- 1:
Segments - 2:
for each Clips do - 3:
- 4:
- 5:
- 6:
▹ remove filler words - 7:
- 8:
Record - 9:
Segments.append(Record) - 10:
end for - 11:
WriteJSON(Segments, “segments.json”) ▹ export structured transcripts - 12:
return Segments
|
3.3.3. Keyword Extraction
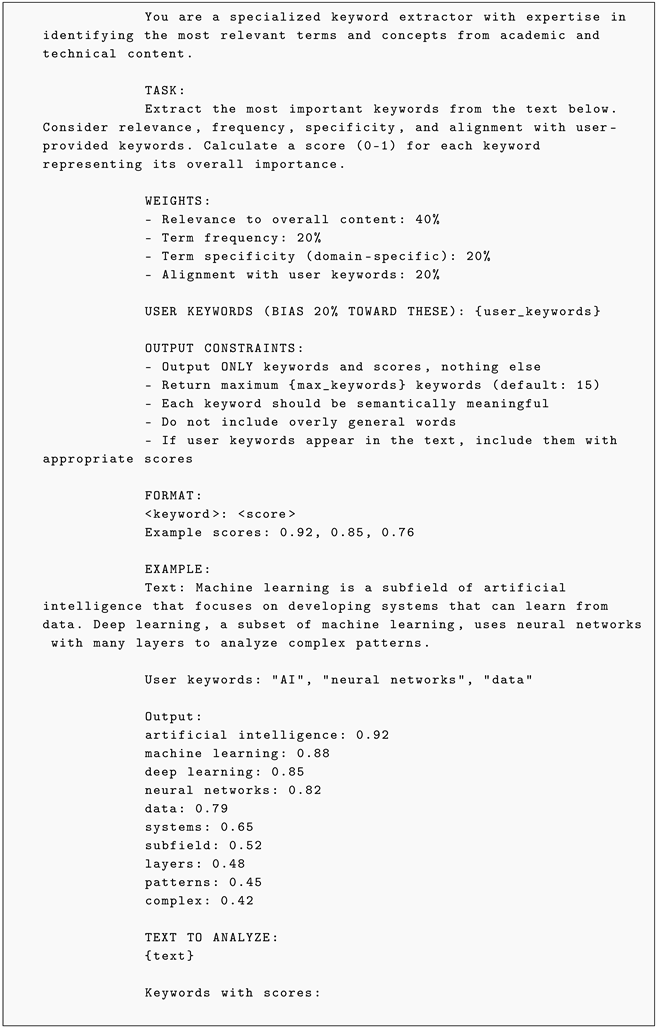
This component extracts key terms from transcripts using both speech content and user-defined keywords to emphasize topics of interest. Extraction is performed with an
LLM using a few-shot prompting strategy, where prompts include task instructions, output constraints, and examples to guide the model [
43].
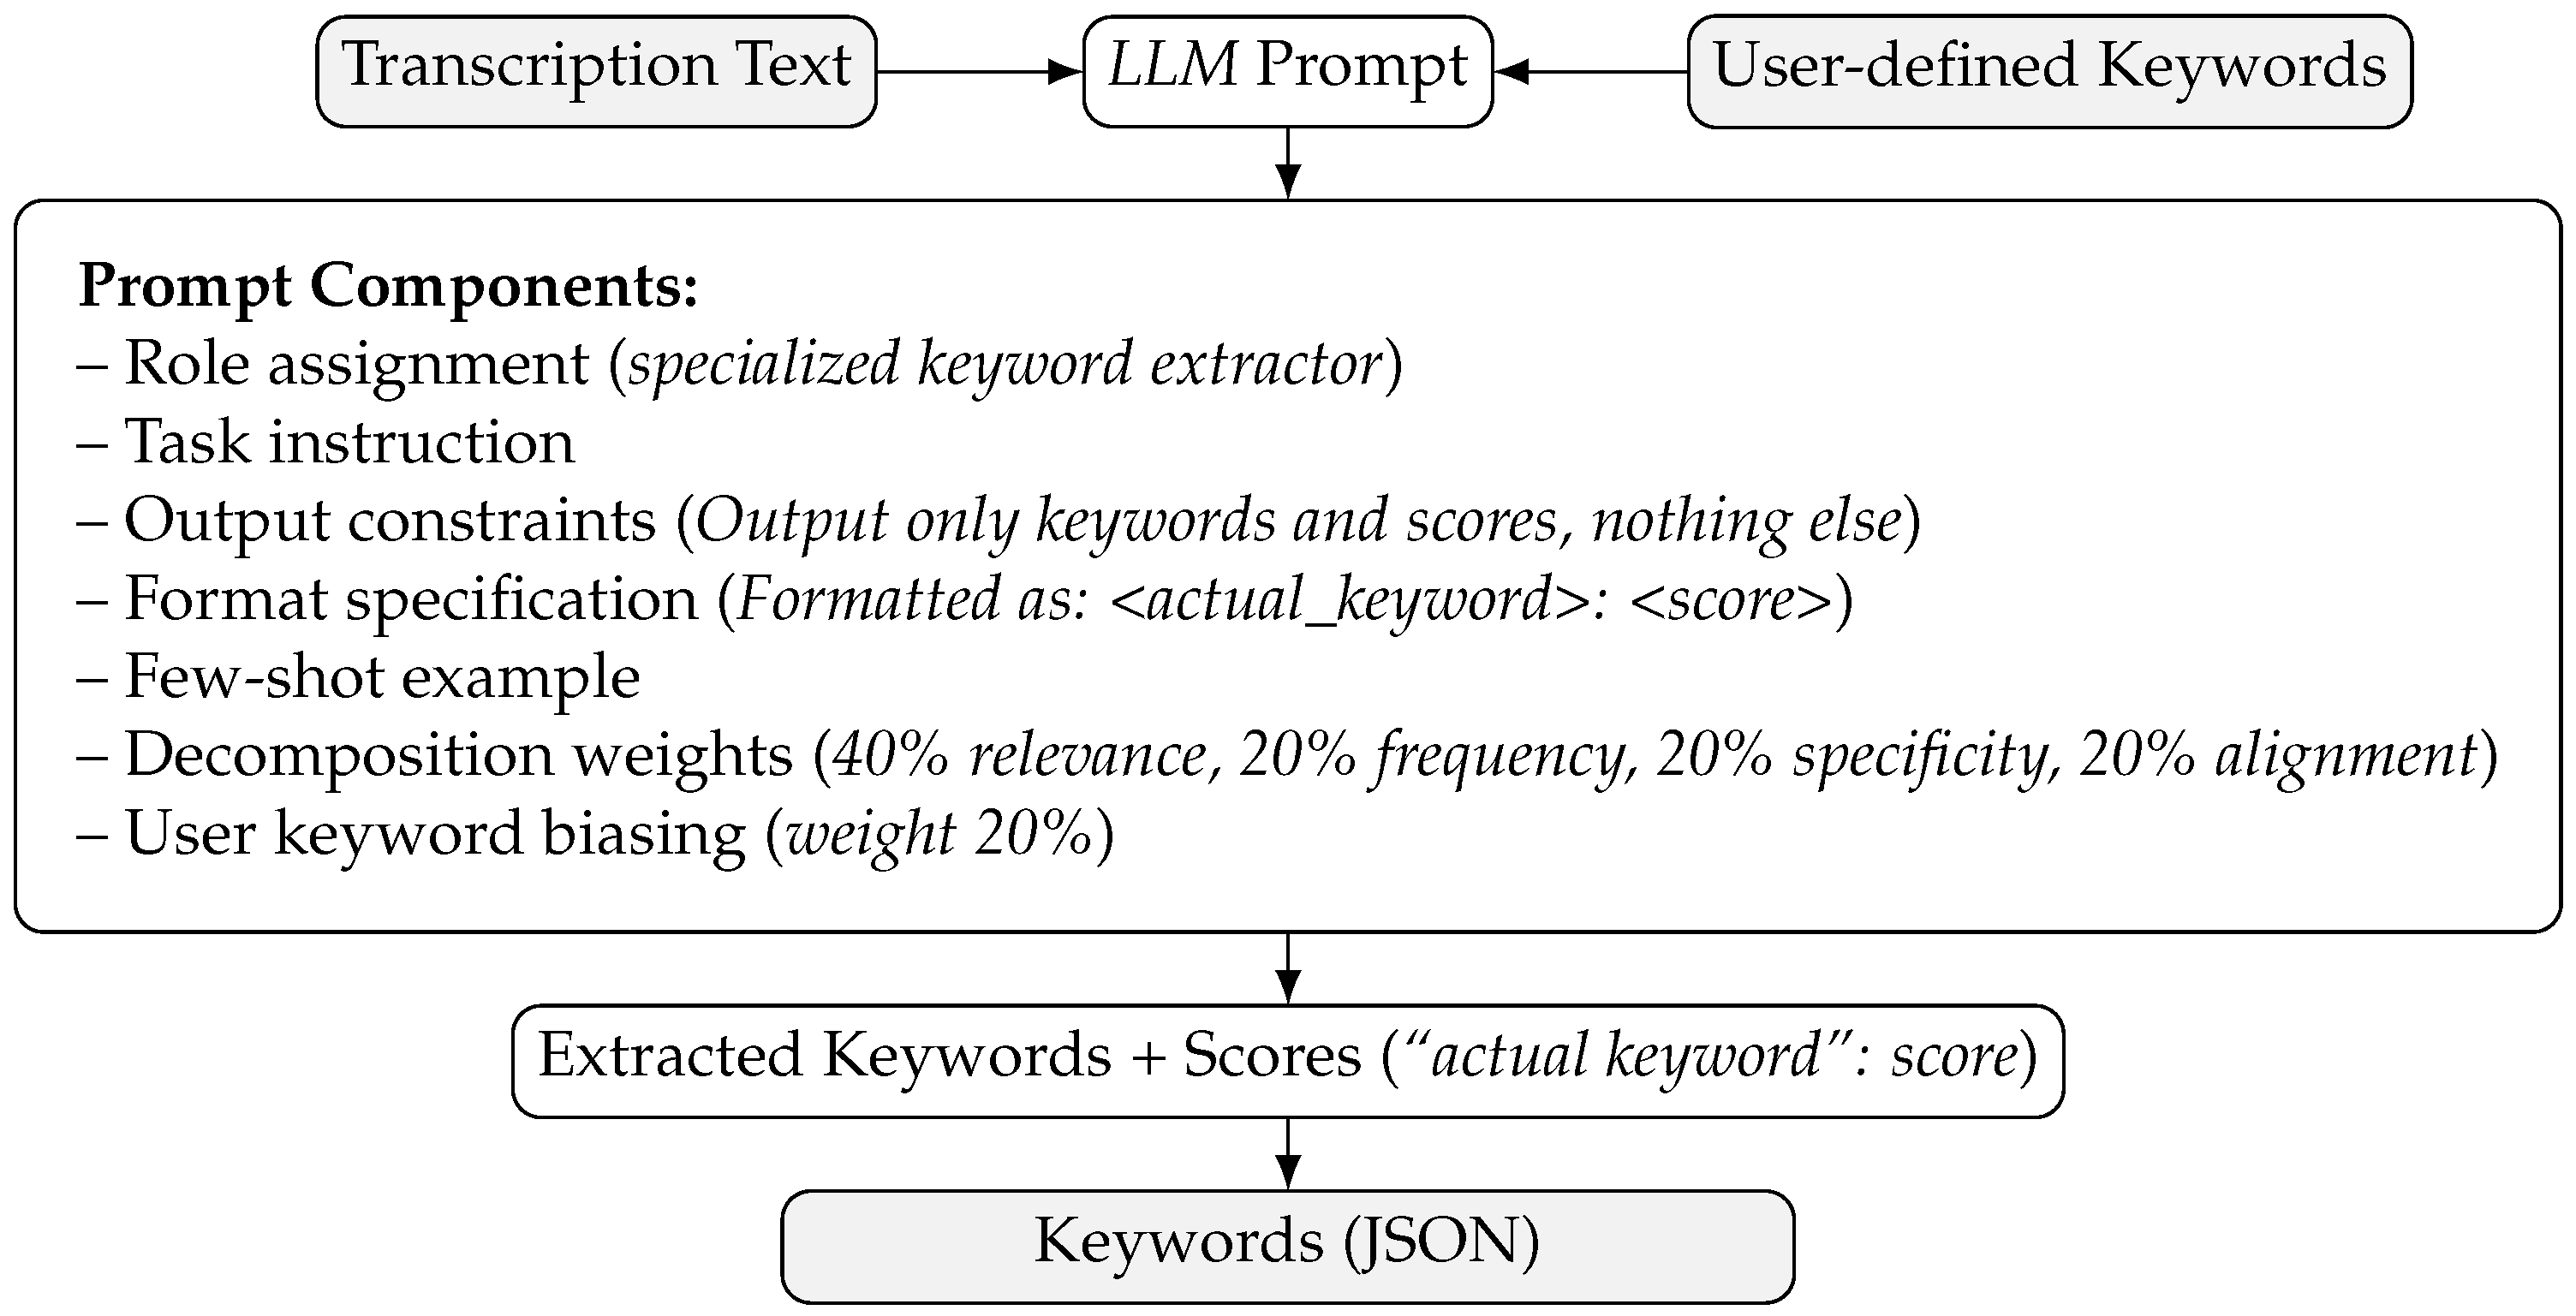
The prompt design assigns the
LLM the role of a keyword extractor and applies a weighted scoring scheme based on relevance, frequency, specificity, and contextual alignment, with additional weight for user-defined keywords [
44]. This approach improves semantic quality compared to traditional frequency-based methods [
45].
Implementation uses gemma3:4b with Q4_K_M quantization via Ollama and LangChain, leveraging its 128k-token context window to process long transcripts without
Retrieval-Augmented Generation (RAG). Extracted keywords and relevance scores are stored in JSON for downstream annotation. The prompt structure is shown in
Figure 3. The full prompt template and parameters used for keyword generation are provided in
Appendix A.
3.3.4. Slide Content Analysis
This component extracts text and bounding boxes from slides using
OCR, which can detect text embedded in visual elements such as figures and charts [
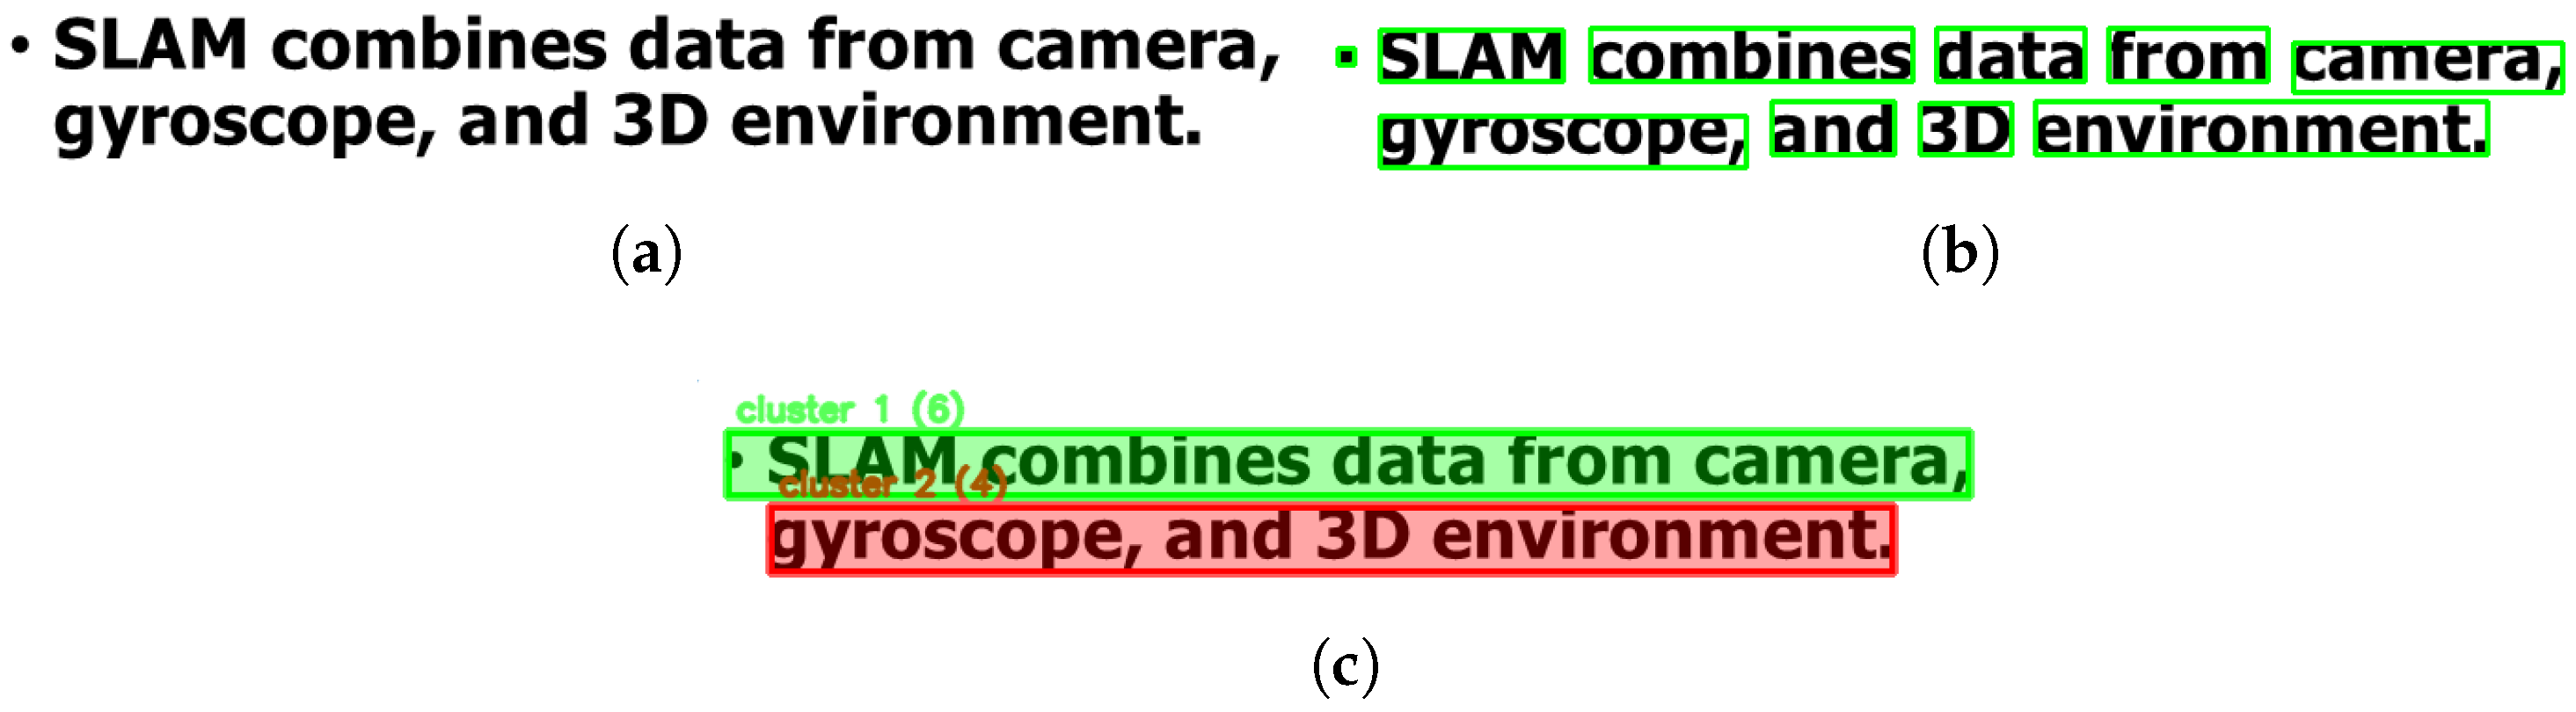
46]. For Latin-script documents, Tesseract processes text in a top-to-bottom, left-to-right order, often producing word-level bounding boxes as illustrated in
Figure 4.
To reconstruct meaningful text regions, bounding boxes are grouped by spatial proximity using DBSCAN along the vertical axis. We configured the clustering algorithm with a vertical epsilon (
) of 10 pixels, which is based on a standard 1080 p frame height, to effectively bridge the gap between adjacent text lines, and a minimum points (
) threshold of 1, ensuring that isolated text elements such as labels or page numbers are preserved. This simplified approach clusters words with similar
y coordinates, merging fragmented tokens into coherent text blocks as shown in
Figure 4c. Each block, along with its bounding box, is stored in JSON for annotation alignment. Raw OCR tokens are also preserved for contextual completeness. The workflow is summarized in Algorithm 3.
| Algorithm 3 Per-slide OCR token clustering with DBSCAN and JSON export. |
- Require:
Slides: list of ; parameters , - Ensure:
raw_tokens.json, clustered_blocks.json
- 1:
Raw ; Clusters - 2:
for each in Slides do - 3:
Raw.append() - 4:
Tokens] - 5:
labels ← DBSCAN(Y, , ) - 6:
Blocks - 7:
for each cluster c in labels do - 8:
tokens with label c, sorted by x - 9:
Blocks.append() - 10:
end for - 11:
Sort(Blocks, by then ) - 12:
Clusters.append() - 13:
end for - 14:
WriteJSON(Raw, “raw_tokens.json”); WriteJSON(Clusters, “clustered.json”) - 15:
return Clusters
|
3.3.5. Annotation Generation
This component generates slide-level annotations using contextual information from multiple sources, following the approach of List and Lin [
27]. It integrates multimodal outputs including transcriptions, extracted keywords, and raw
OCR text into unified data for each video sub-clip. Transcriptions provide narrative content, keywords guide the
LLM toward key topics, and
OCR text offers slide-specific cues such as section titles.
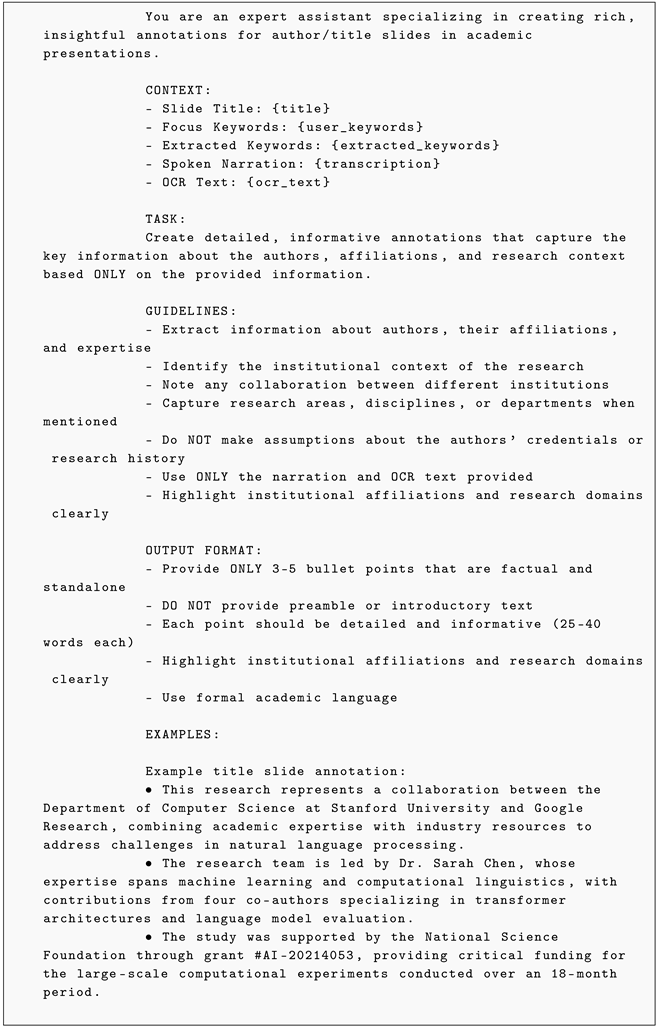
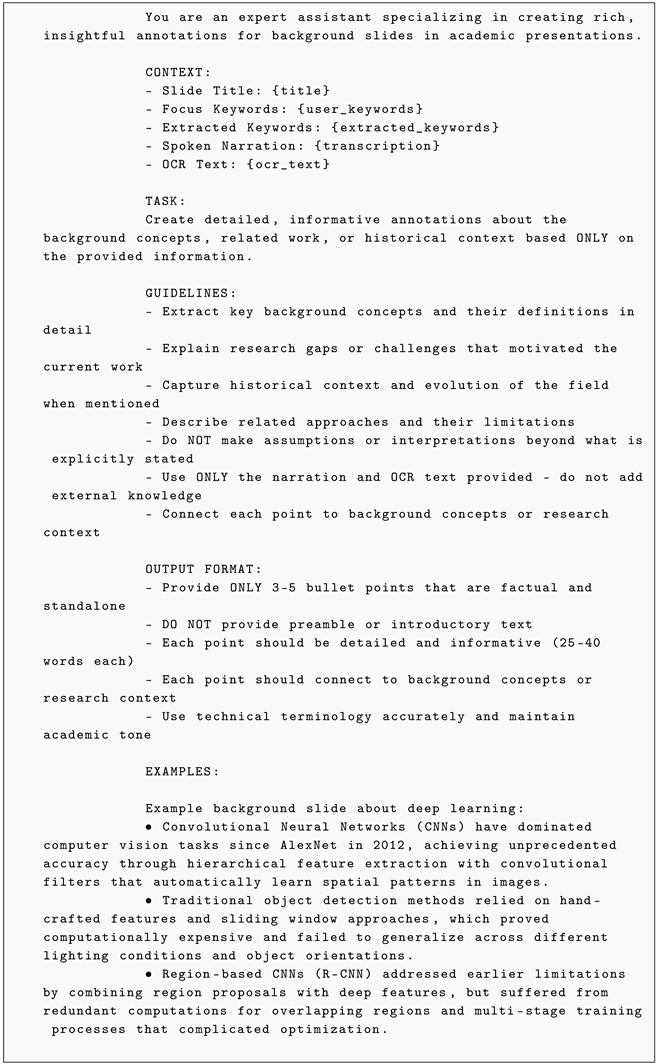
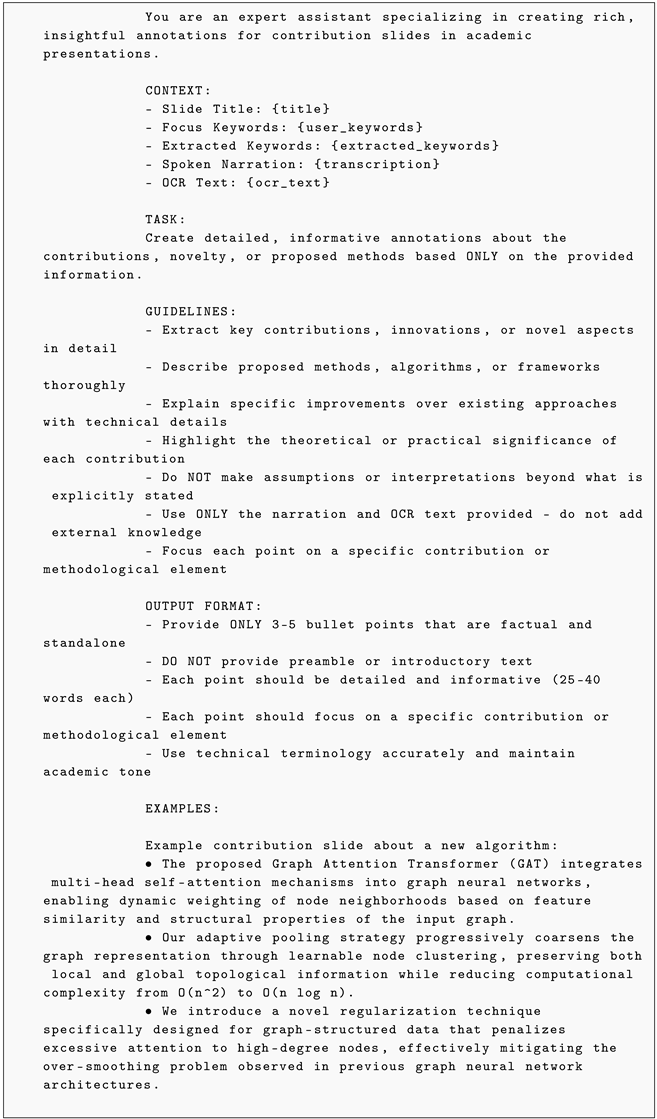
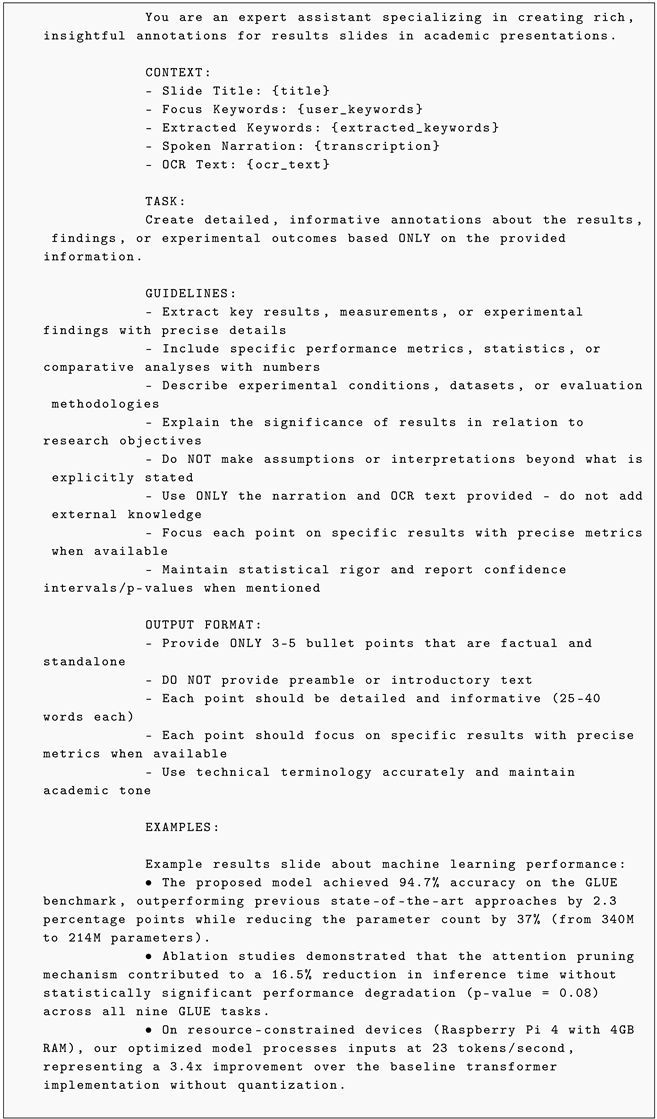
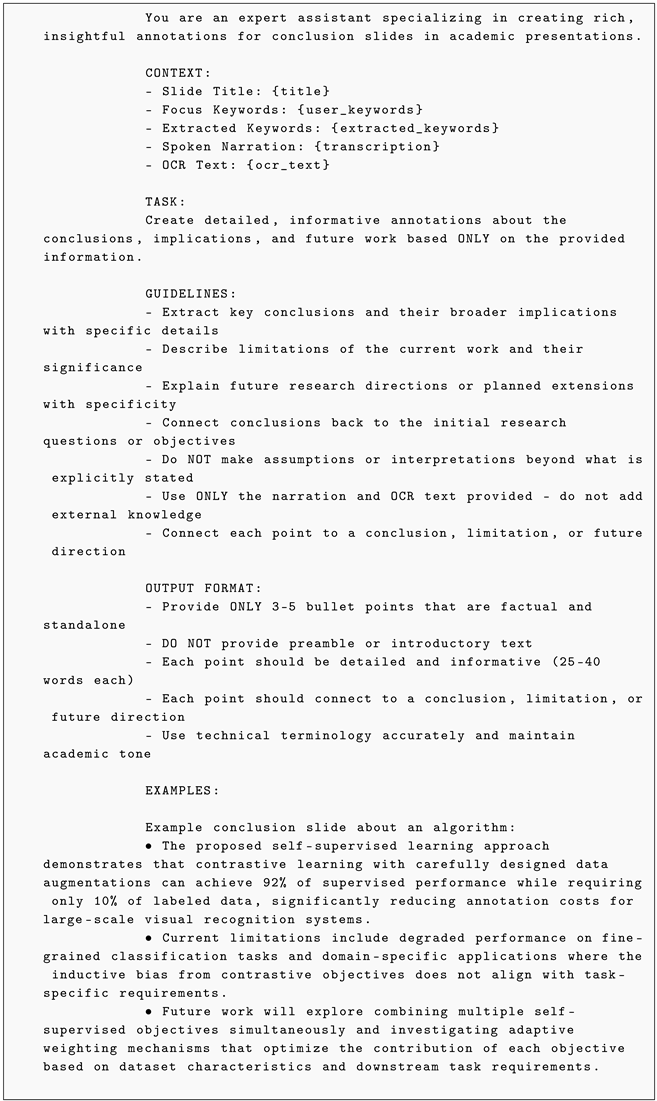
Leveraging Tesseract’s reading order, the system identifies slide titles, typically from top-left, and uses them for prompt selection. If a title matches common academic sections such as
Introduction,
Background, or
Results, a specialized prompt is applied. Otherwise, a default system prompt is used. This design follows the principles in [
43], enabling the same
LLM to act as multiple task-specific extractors without fine-tuning.
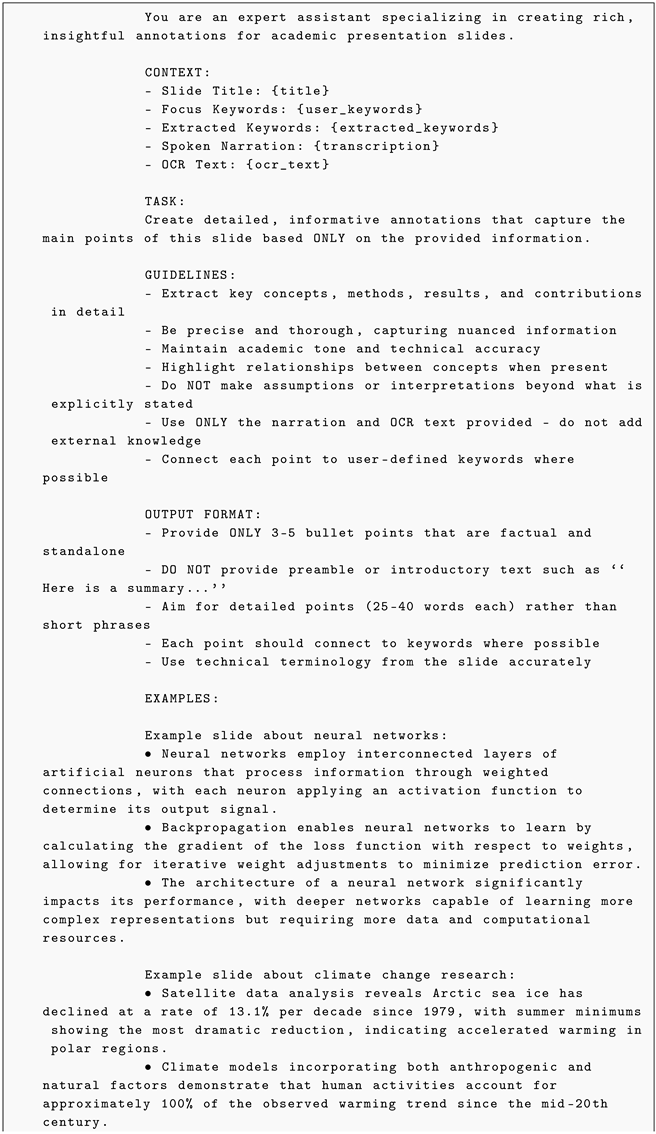
Annotation generation is powered by the gemma3:4b Q4_K_M quantization model, accessed via Ollama and LangChain. To ensure reproducibility, this study adhered to strict inference settings: the
temperature was set to
0.2 to minimize hallucination and maintain factual consistency, and the
random seed was fixed to
42 for deterministic outputs. The full system instructions and specialized prompt templates used for annotation generation are provided in
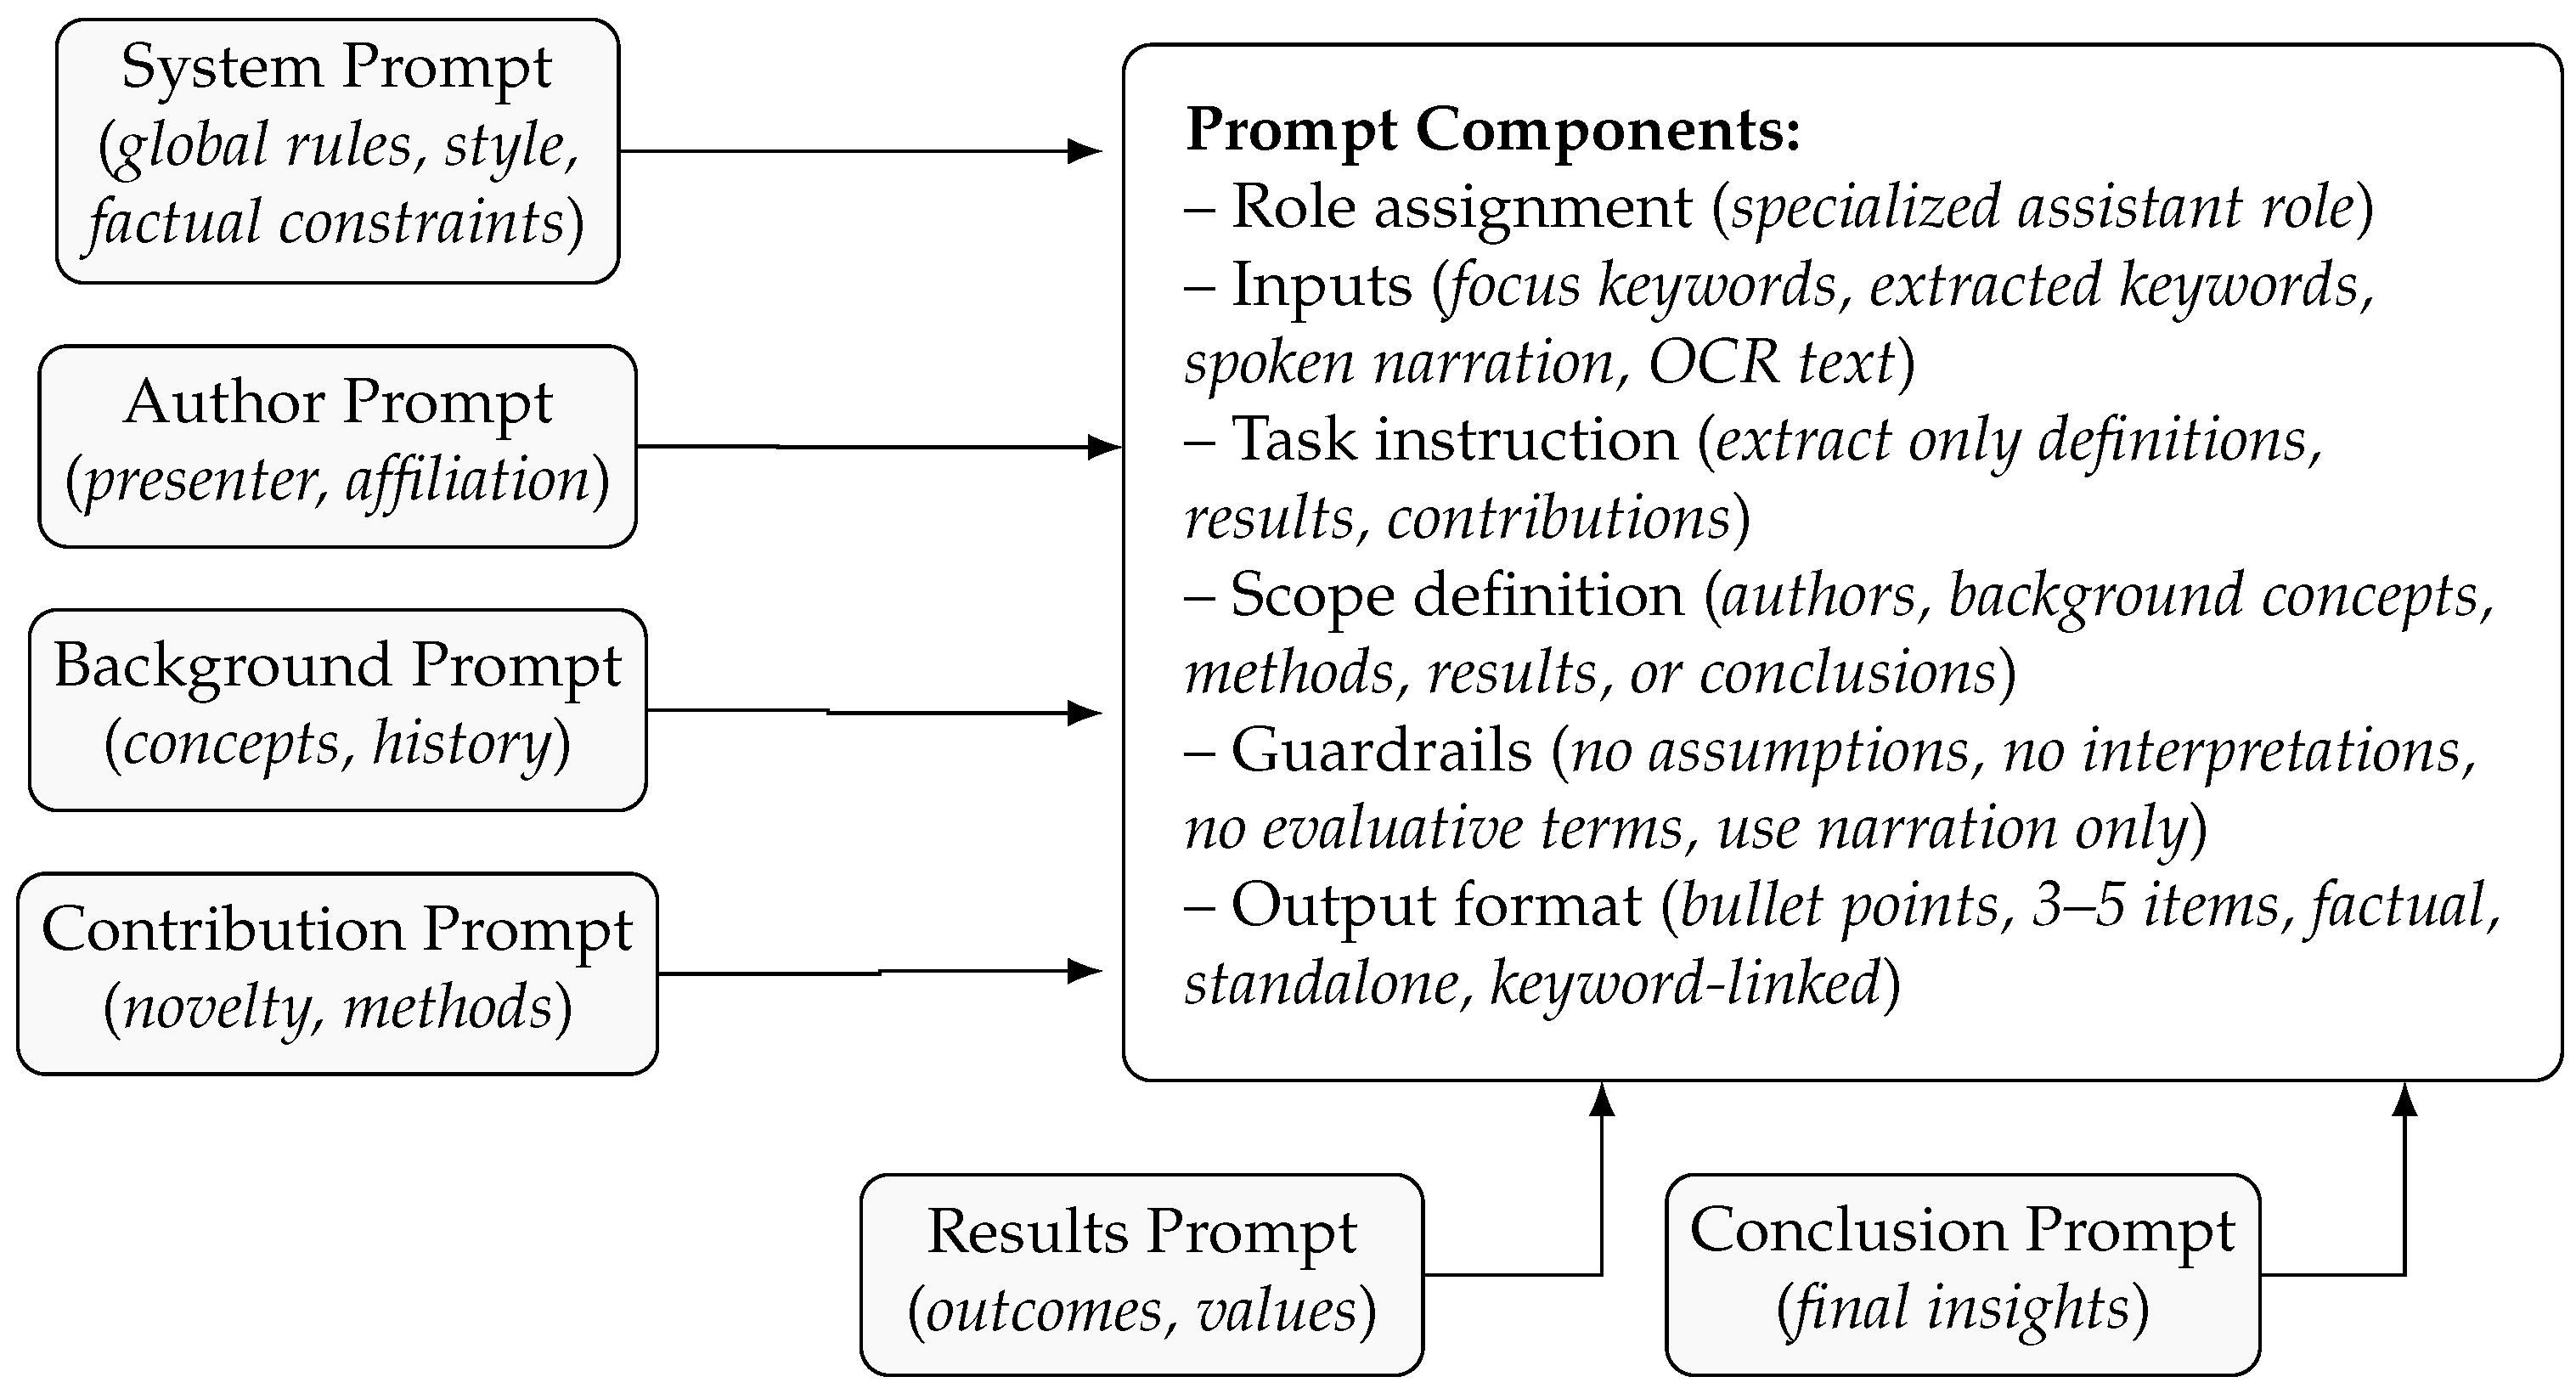
Appendix B. The conceptual prompt structure is illustrated in
Figure 5.
The prompt design includes a system prompt for global rules such as factual accuracy, conciseness, style and specialized prompts for specific content types including background, methods, results, conclusions. This enables context-aware annotation generation without fine-tuning. Each annotation is stored as a structured JSON record along with its context, such as transcription snippet, keywords, and
OCR text. The end-to-end workflow, from context aggregation to prompt-based inference and JSON storage, is shown in Algorithm 4.
| Algorithm 4 Annotation generation with context aggregation and prompt selection. |
- Require:
D: JSON record with - Ensure:
annotations.json
- 1:
function AggregateContext() - 2:
Clean(T) ▹ remove ASR glitches, filler remnants - 3:
Deduplicate(K) - 4:
Normalize(O) ▹ retain early tokens for titles - 5:
return - 6:
end function - 7:
procedure GenerateAnnotation(D) - 8:
- 9:
AggregateContext() - 10:
FirstOr() - 11:
if IsTitleMatch() then - 12:
SelectPrompt() ▹ specialized prompt - 13:
else - 14:
SystemPrompt() - 15:
end if - 16:
LLM_Inference() - 17:
Record - 18:
AppendJSON(Record, “annotations.json”) - 19:
return Record - 20:
end procedure
|
3.3.6. Annotation Alignment and Slide Reconstruction
This component represents the final stage of the backend pipeline, aligning generated annotations with corresponding slide content and reconstructing them into an enriched presentation format. It integrates textual annotations produced by the LLM with spatial/visual information extracted from slides to ensure contextual accuracy and spatial consistency. First, annotations are mapped to relevant slide regions based on semantic similarity. Then, aligned annotations are embedded back into the presentation as comments anchored to corresponding visual elements. The resulting annotated presentation is provided as a downloadable file via the UI.
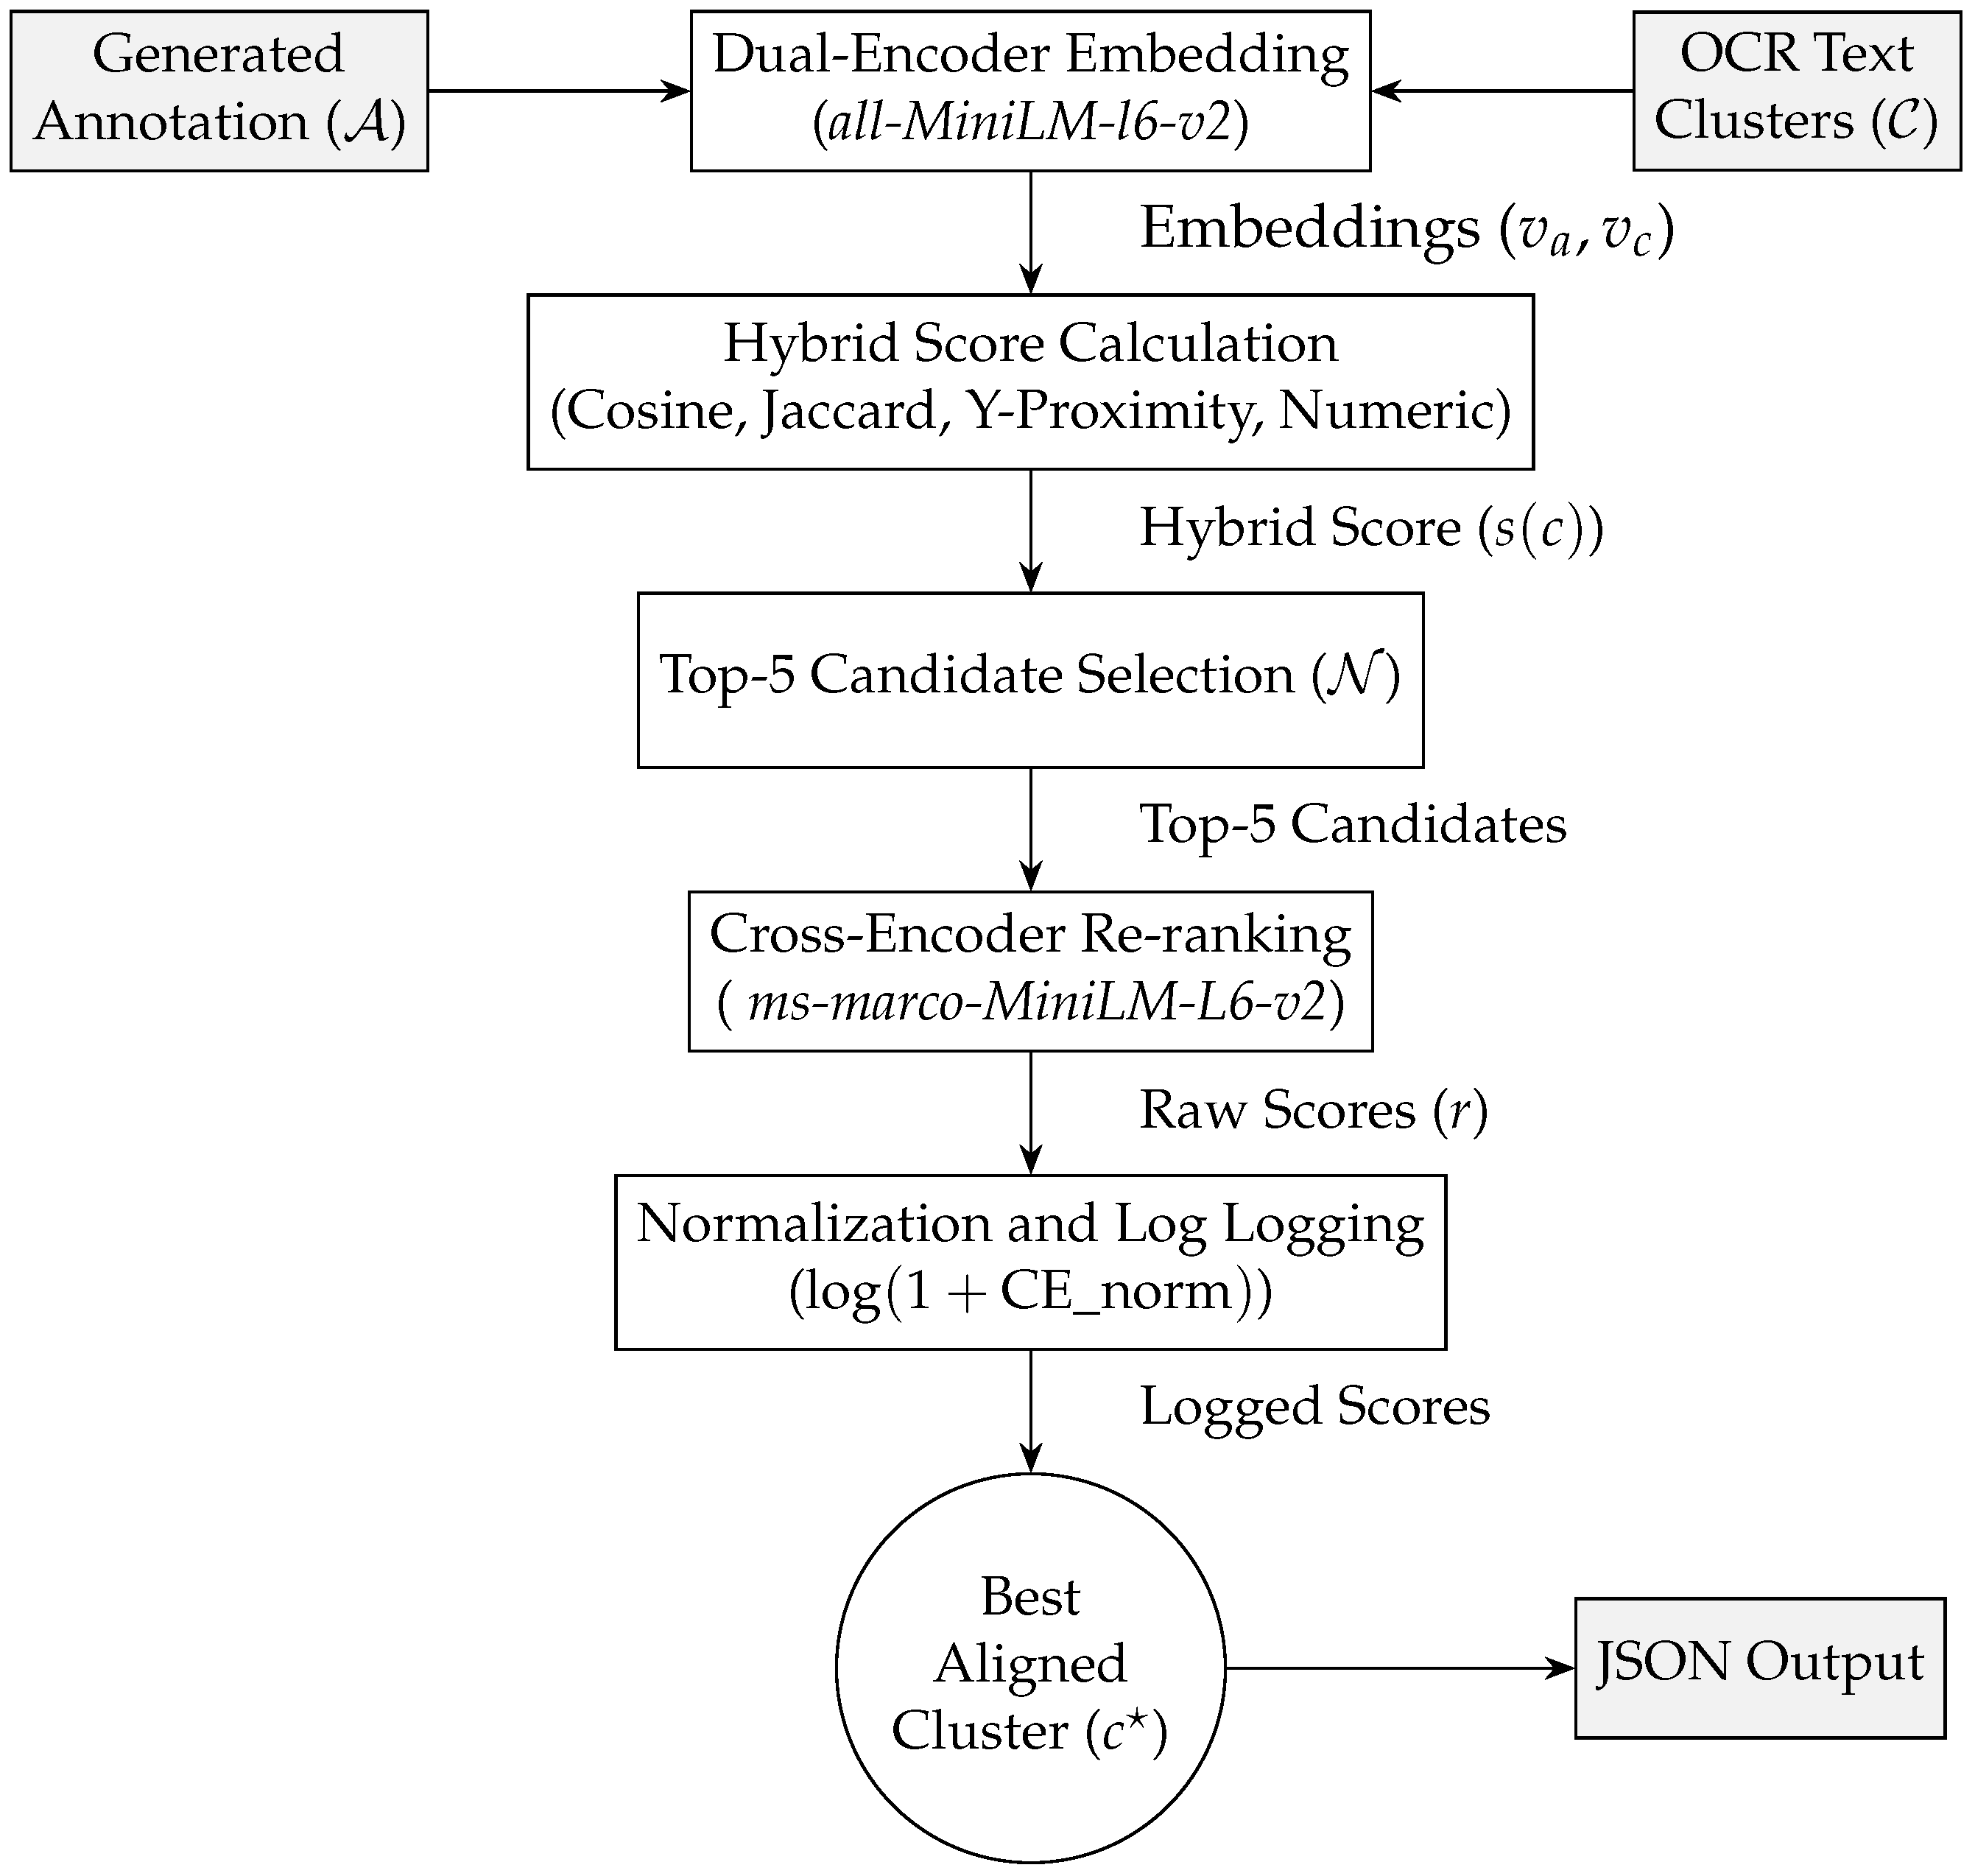
Annotation alignment. The process of aligning the generated annotation text to the precise region of the OCR slide text is a multi-stage retrieval pipeline. This alignment is crucial for visual grounding and is summarized conceptually in
Figure 6. It operates by first selecting initial candidates using a composite scoring mechanism, followed by precise re-ranking via a deep cross-encoder model.
Hybrid alignment score is computed from four equally weighted metrics to map annotations to slide regions. The first component is cosine similarity between L2-normalized embeddings using all-MiniLM-l6-v2. The second is Jaccard token similarity, computed case-sensitively and restricted to alphanumeric tokens from the annotation and the OCR text. The third is Y-proximity, defined as the vertical center distance of the OCR text relative to the annotation. The fourth is numeric matching, such as overlap of numbers appearing in the annotation and the OCR text. The combined score is the mean of these four components. Then, the top-5 candidates are selected and re-ranked using a cross-encoder ms-marco-MiniLM-L6-v2 model by taking the argmax of the cross-encoder score. The cross-encoder raw scores are logged and normalized to the range from 0 to 1. The complete workflow, from text embedding to cross-encoder re-ranking and JSON storage, is summarized in Algorithm 5.
Slide reconstruction. Aligned JSON records are used to reintegrate annotations into the presentation, producing an enriched version of each slide. Bounding boxes from the OCR process are converted into PowerPoint coordinates using a calibration function that scales and translates positions to the target slide dimensions. For each matched annotation, a transparent rectangle shape with a visible border is drawn at the calibrated location, and the annotation text is attached as a comment anchored to that shape.
This design preserves the visibility of the original slide content while keeping each annotation contextually linked to its visual element. By anchoring comments to shapes rather than overlaying text directly on the slide, the system avoids occlusion and maintains clarity. To ensure spatial accuracy, bounding box coordinates are mapped from the video frame resolution to the presentation slide dimensions using a uniform scaling function (
), as detailed in Algorithm 6. This factor represents the conversion from screen pixels (96 DPI) to PowerPoint points (72 DPI), ensuring that the aspect ratio of the annotated regions is preserved without distortion during the import process.
| Algorithm 5 Hybrid Top-5 with cross-encoder re-ranking for annotation alignment. |
- Require:
Annotations with fields ; OCR clusters with ; embedder ; cross-encoder - Ensure:
JSON with aligned pairs
- 1:
for all do - 2:
- 3:
end for - 4:
for all do - 5:
- 6:
- 7:
for all do - 8:
- 9:
- 10:
- 11:
- 12:
- 13:
end for - 14:
- 15:
- 16:
for all do - 17:
- 18:
- 19:
end for - 20:
- 21:
- 22:
- 23:
Record - 24:
AppendJSON(Record, “aligned.json”) - 25:
end for
|
| Algorithm 6 Slide reconstruction with bounding-box anchored comments |
- Require:
Aligned JSON ; OCR canvas ; PowerPoint path - Ensure:
PowerPoint updated with shapes and anchored comments
- 1:
OpenPresentation() - 2:
▹ 72 pt/in ÷ 96 px/in - 3:
- 4:
- 5:
for all do - 6:
SelectSlide() - 7:
- 8:
DrawRectangle - 9:
- 10:
AddComment - 11:
Tag(shape, {comment_id: comment.id}) - 12:
Tag(comment, {shape_id: shape.id}) - 13:
end for - 14:
SaveAndClose()
|
3.4. Output
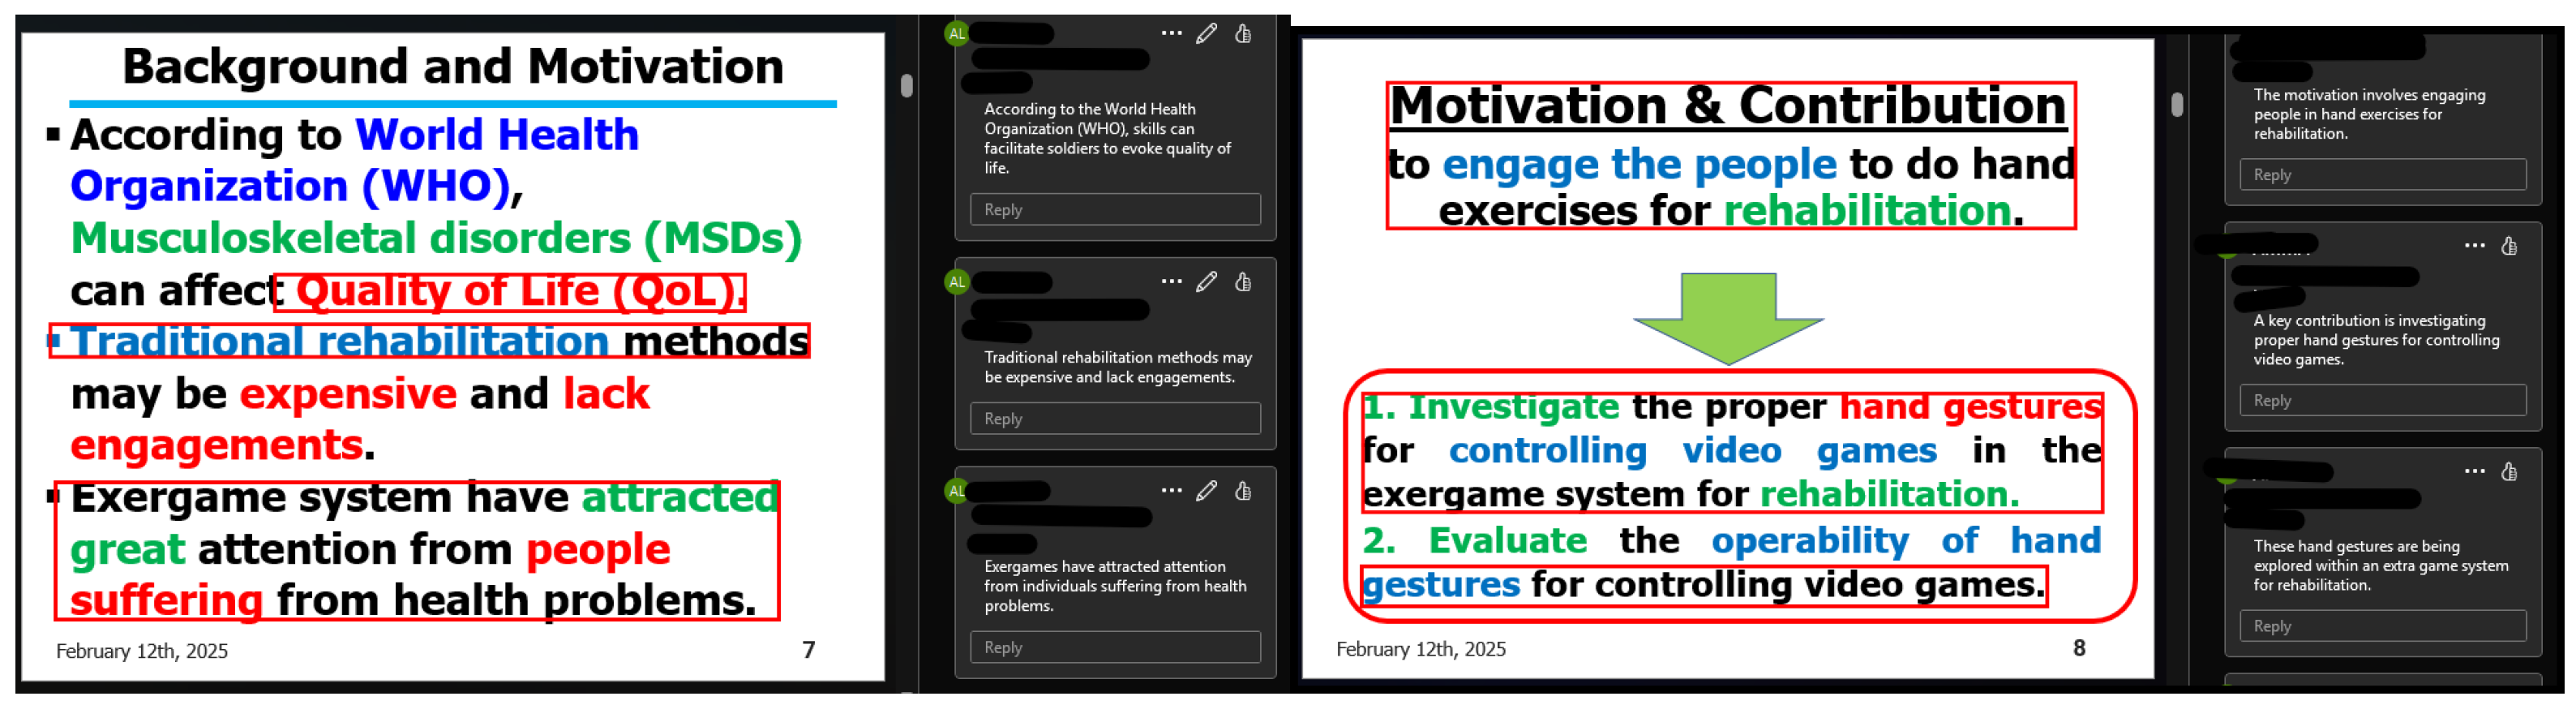
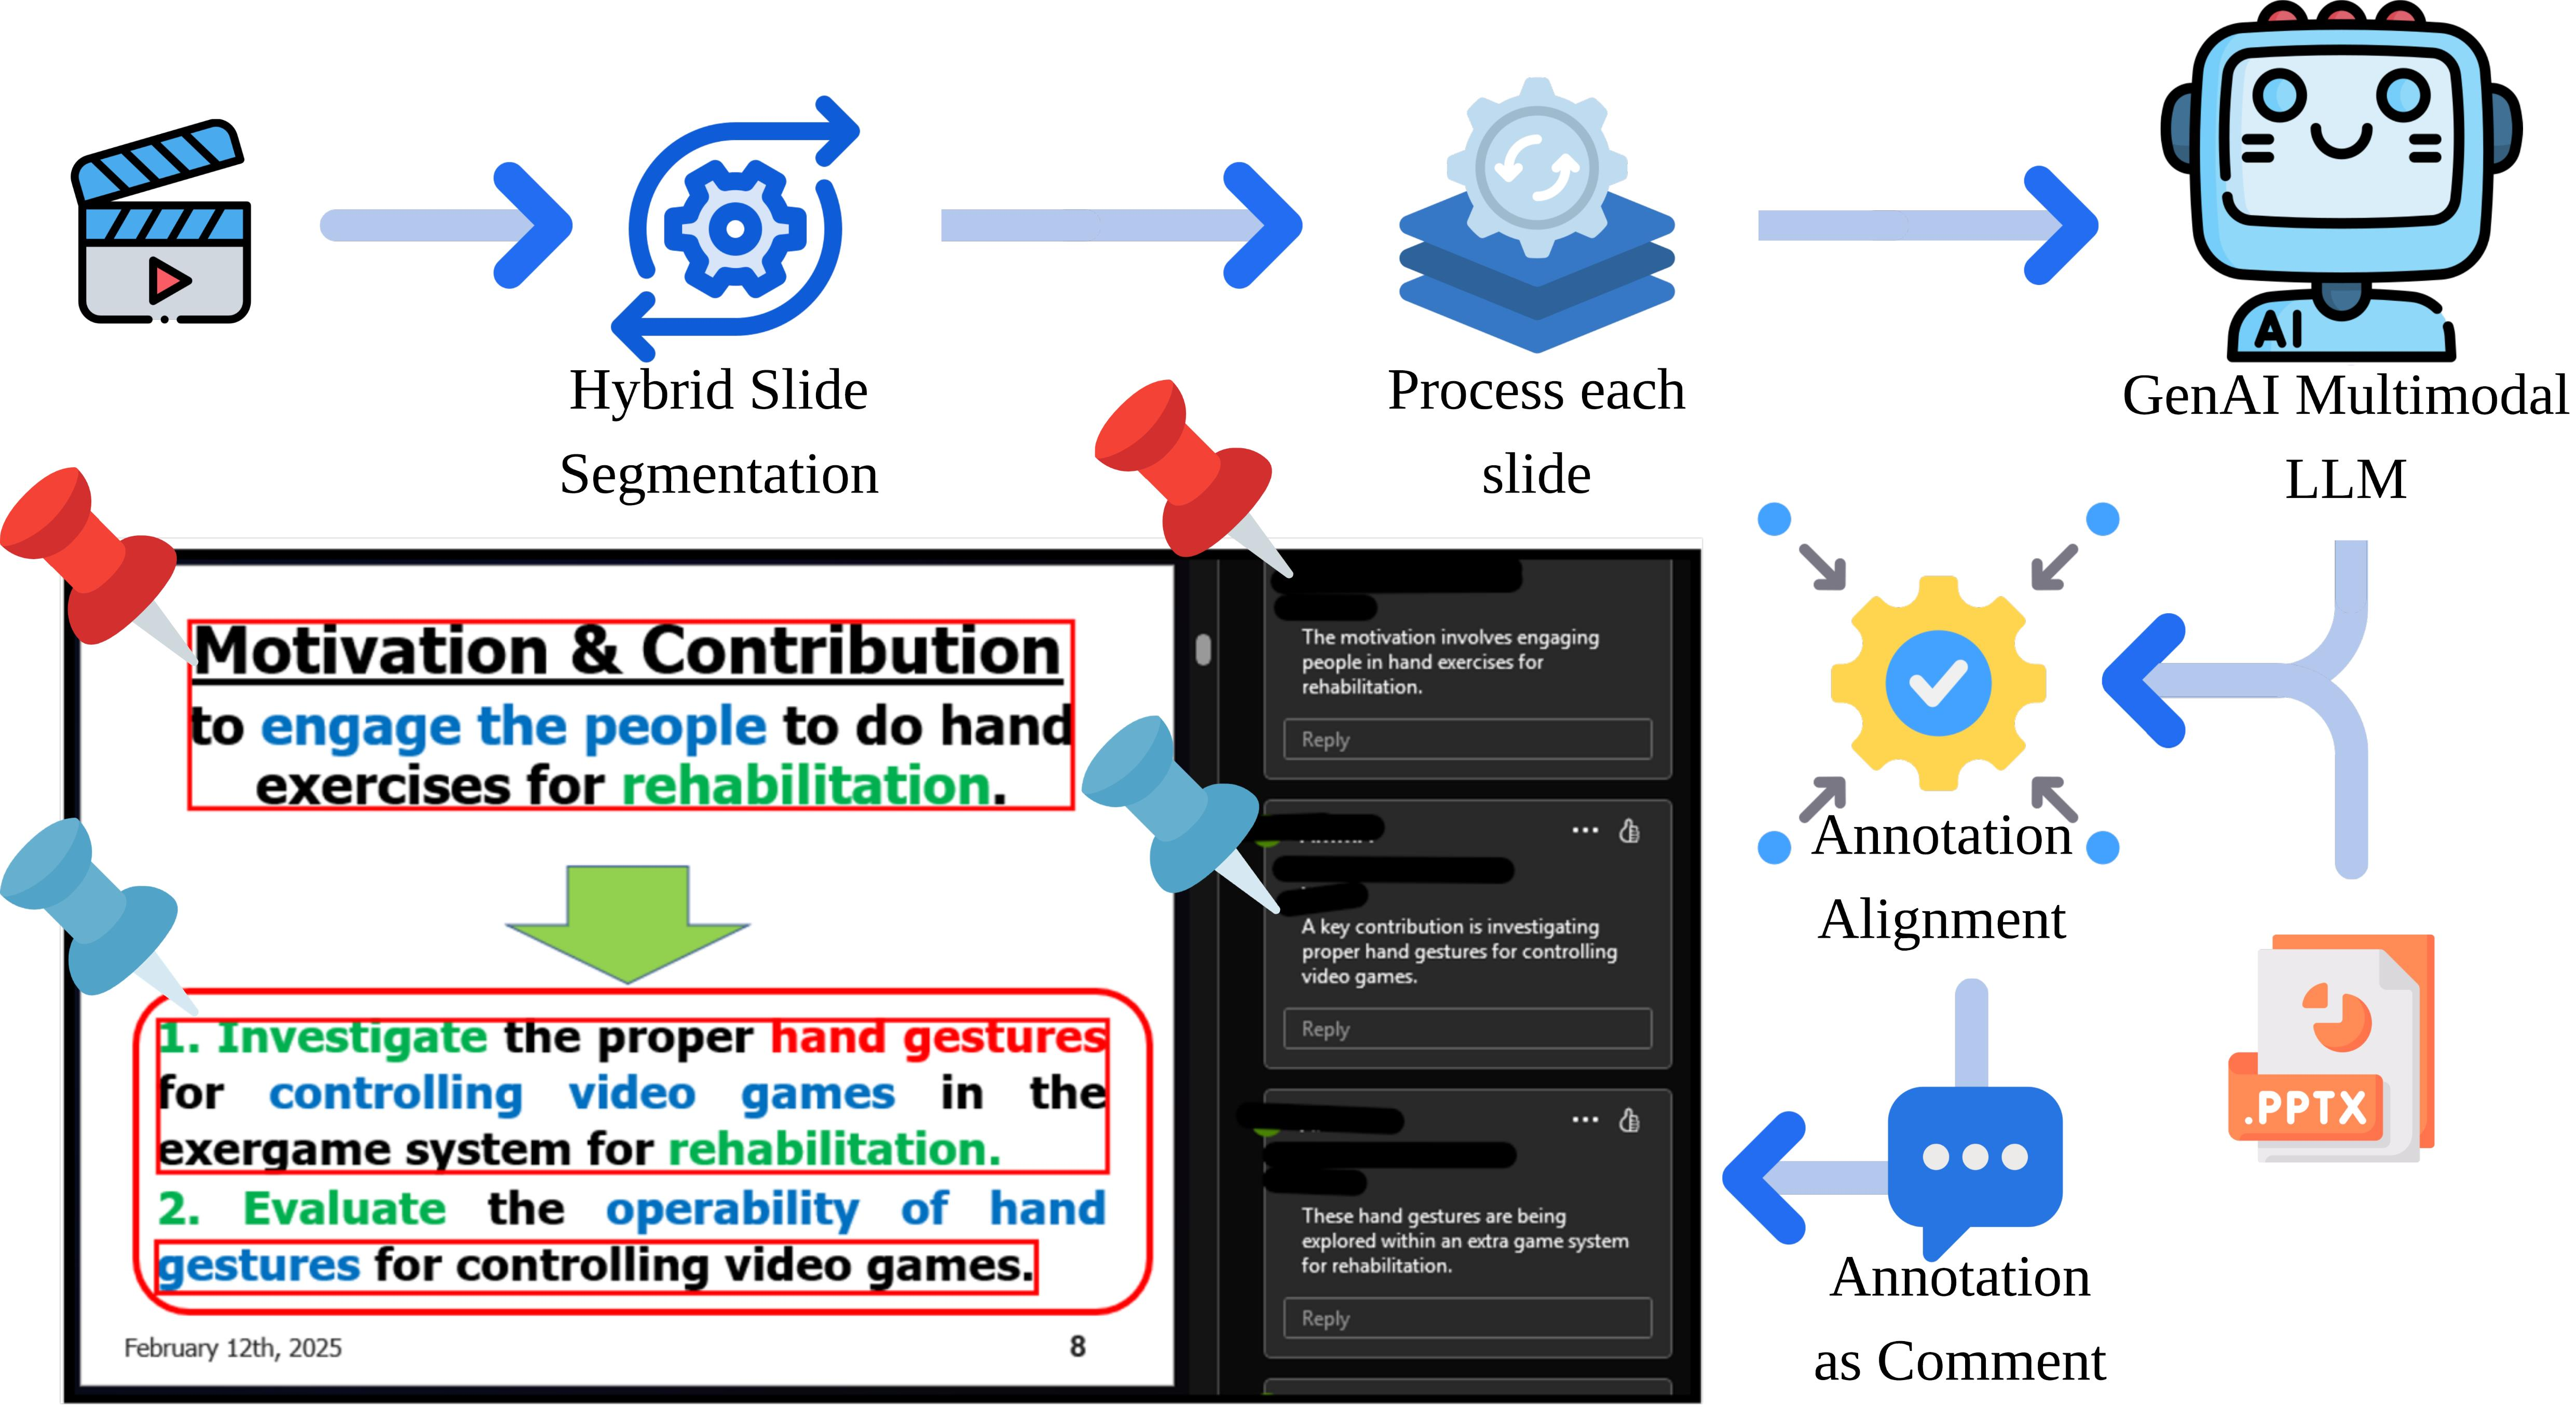
The final output of the system is an annotated PowerPoint presentation file that integrates the generated annotations with the original slides. Each slide contains context-aware annotations provided as comments aligned with the corresponding content, enabling users to review or study the material with additional contextual information. After all processing steps have been completed, the annotated presentation is made available for download through the
UI. Sample slides from the annotated output are shown in
Figure 7.
4. Evaluation
This section presents the experimental design and evaluation procedures conducted to assess the feasibility and performance of the proposed Slide Annotation System. It describes the participant selection criteria, data collection process, and analysis methods used in the study. Both quantitative and qualitative evaluations were carried out, consisting of participant-based testing to examine segmentation accuracy, annotation coherence, task performance, and overall usability, and presentation-owner testing to assess the validity and usefulness of the embedded annotations.
4.1. Experimental Design
The evaluation used a multi-stage measurement comprising three integrated components. This measurement began with a technical benchmark of algorithmic performance, followed by an expert-based validation involving presentation owners, and concluded with a participant-based usability study. Controlled conditions governed both the expert and participant components to ensure consistency across evaluations. The technical benchmark focused on assessing the segmentation robustness and alignment precision of the system. The expert validation examined the contextual accuracy and usefulness of the generated content, whereas the participant study evaluated task efficiency and overall system usability.
Algorithm Performance Evaluation. Distinct from the user study, a controlled benchmark evaluated the system’s core algorithms. First, the study assessed Segmentation Robustness by testing the algorithm under the Standard Condition (original videos with visible slide numbers) serving as the primary benchmark, and the Obscured Condition (digitally masked regions) acting as a stress test to force reliance on the visual fallback mechanism.
Second, an ablation study evaluated Alignment Accuracy on a stratified subset of slides. This component tested the system’s ability to correctly identify the specific visual anchor (such as a text block or figure) for each annotation against a human-verified ground truth, validating the spatial precision of the hybrid scoring module.
Presentation-Owner-Based Validation. This phase engaged five presentation owners whose recorded presentations served as the main dataset. Each presenter reviewed the automatically generated annotations corresponding to their own slides and evaluated whether the annotations were contextually accurate, factually correct, and practically useful. A structured evaluation form gathered their feedback through five-point Likert scale questions and optional written comments. This phase verified that the generated annotations were valid and meaningful before the study proceeded to the user testing phase.
Participant-Based Usability Study. The second phase recruited 37 participants, a sample size sufficient to identify usability issues [
47]. The cohort comprised 15 undergraduate and graduate students majoring in Computer Science and 22 students from Multimedia Broadcasting, ensuring a diverse representation of users who frequently engage with technical presentation materials.
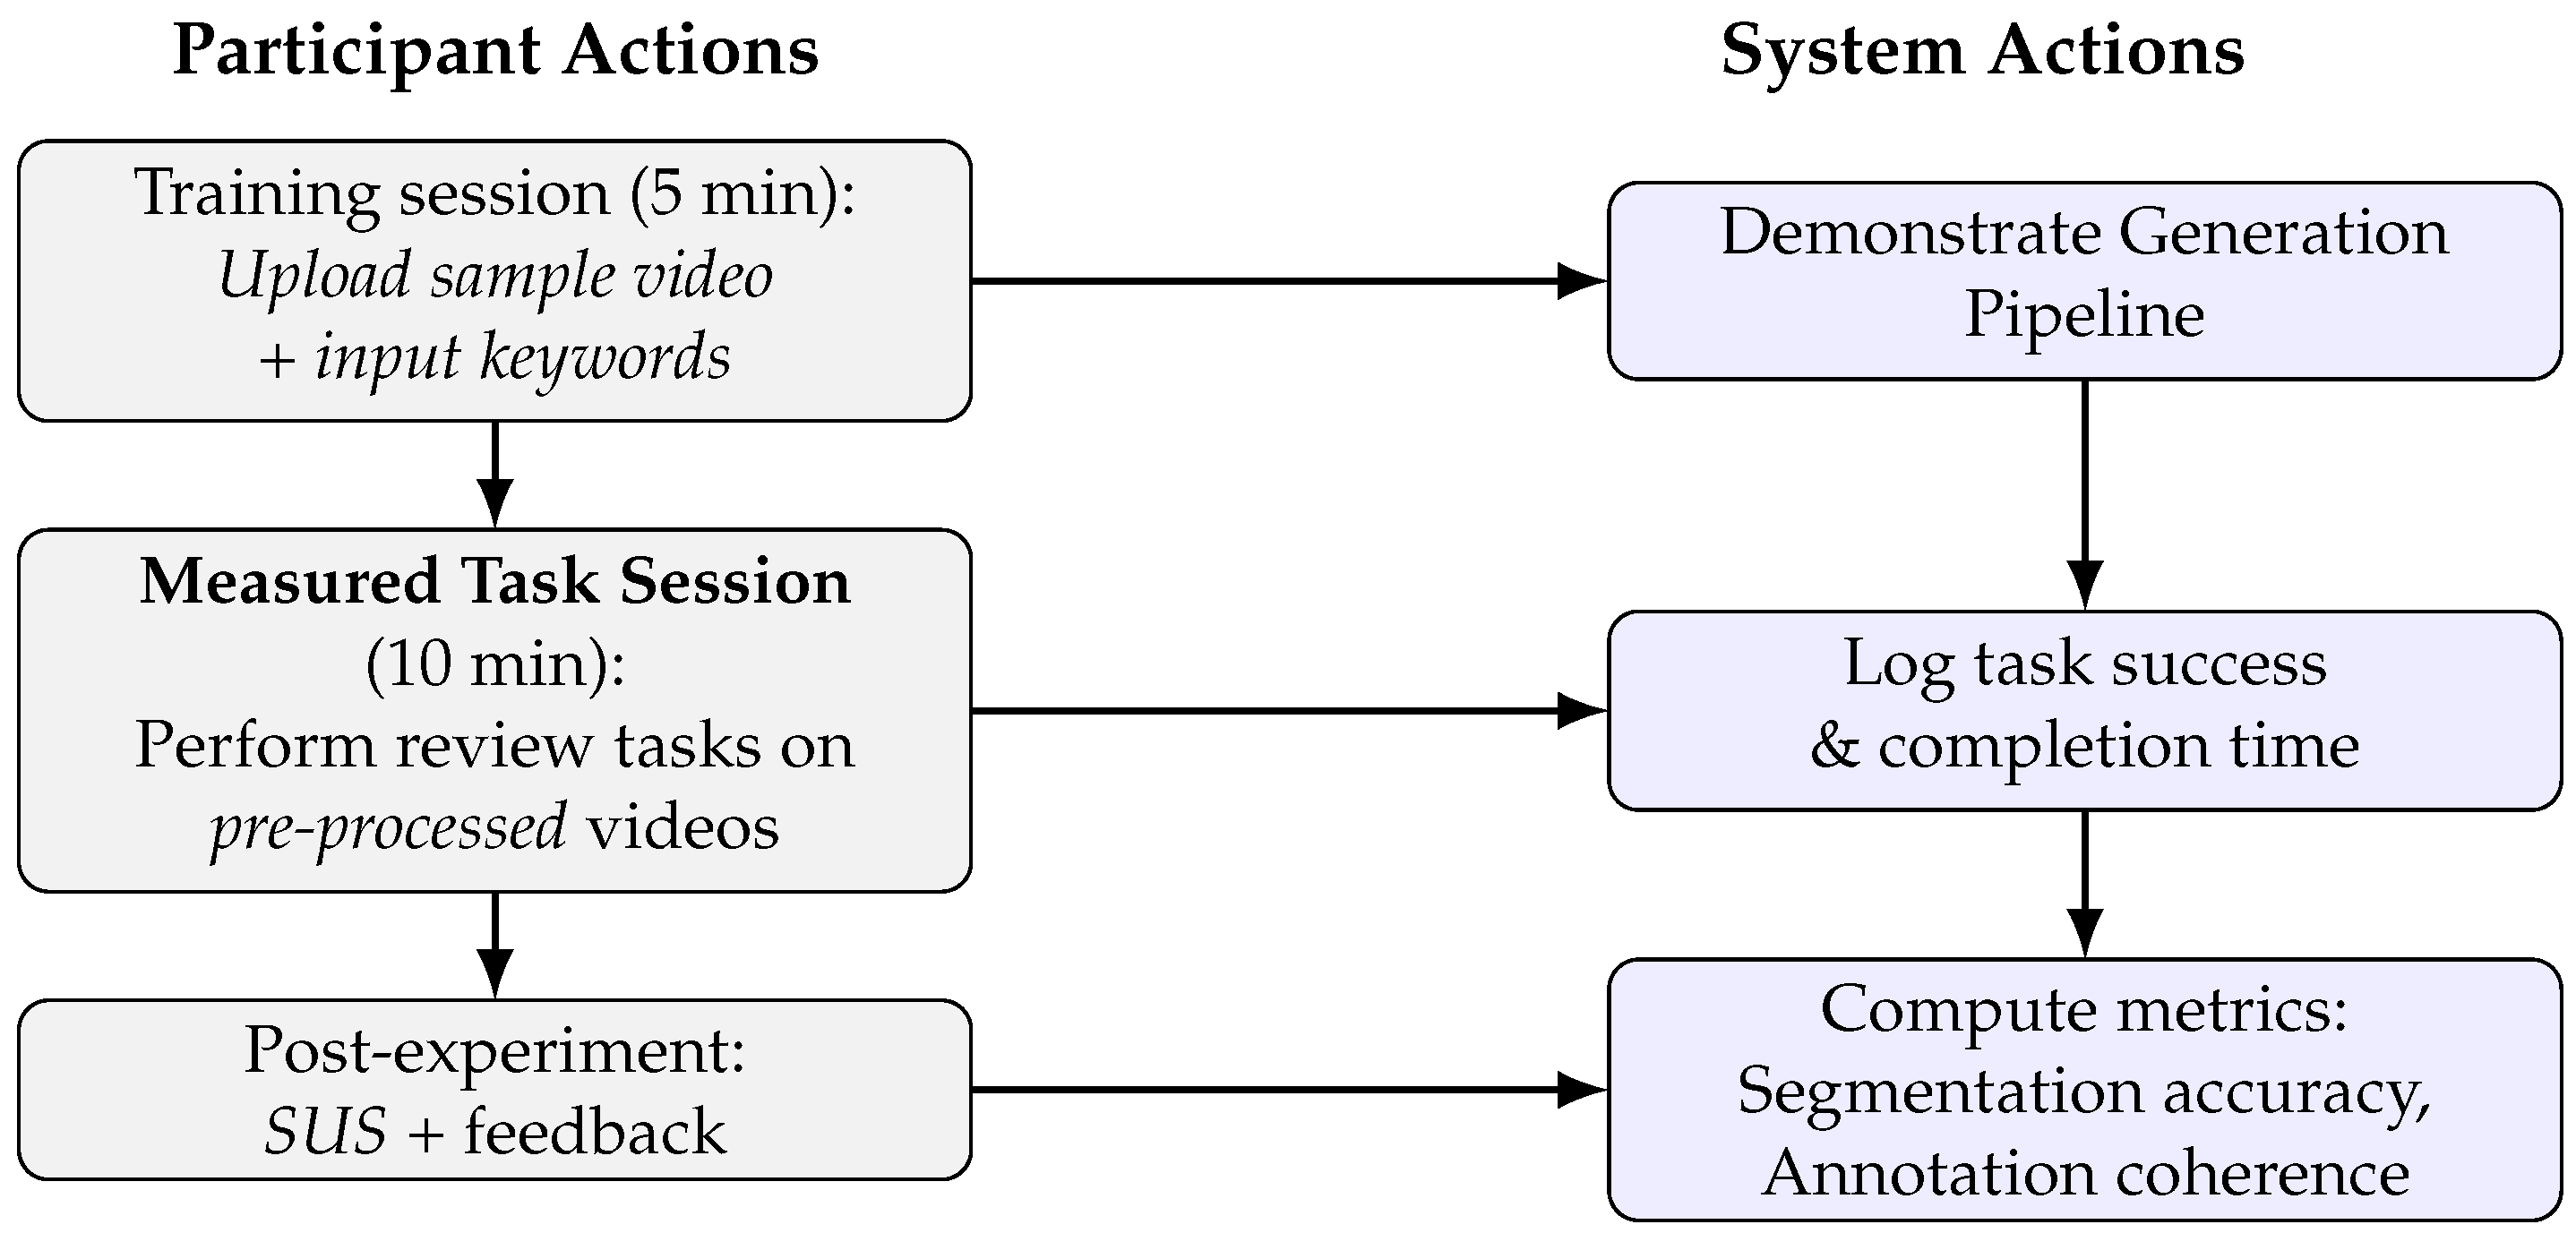
Each participant browsed the Slide Annotation System through the client-side web interface. A 5 min training session familiarized participants with the full pipeline. During this training phase, the protocol directed participants to upload a sample presentation video, specify keywords, and observe the annotation generation process.
Following the training, participants advanced to the 10 min measured task session. To ensure experimental consistency, the study assigned the same set of pre-processed annotated presentations to all participants rather than allowing personal file uploads. These videos represented the Standard Condition where slide numbers were visible. This controlled approach allowed for direct comparison of task completion times and success rates across the cohort. Strict time limits encouraged efficient review behavior.
During each session, task success rates and interaction logs were automatically recorded. Segmentation accuracy was validated against manually annotated slide boundaries or the
Ground Truth. Annotation coherence was evaluated separately using an
LLM-as-Judge approach, and user experience was assessed through the
System Usability Scale (SUS) and a post-experiment feedback questionnaire. The summarized experimental procedure is shown in
Figure 8.
Following prior studies on slide summarization and multimodal interaction [
31,
48,
49], four representative tasks were adopted to emulate typical reviewer behaviors. These tasks cover key aspects of the review process, including information retrieval, summarization, cross-checking, and slide browsing.
Table 1 summarizes these tasks along with their corresponding evaluation purposes and example activities.
4.2. Evaluation Criteria
To comprehensively assess the system, this study adopted a multi-dimensional framework covering three core areas. Algorithmic performance was evaluated through two metrics. Segmentation accuracy measured using Precision, Recall, and Score under both standard (visible slide numbers) and obscured (masked ROI) conditions. And Alignment Accuracy assessed via an ablation study measuring the correct anchoring of annotations to visual content against a human-verified ground truth. Content quality was assessed via a dual approach, an automated LLM-as-Judge metric scoring factual consistency, coverage, specificity, and clarity (validated against human consensus using Weighted Cohen’s and Spearman’s ), and a qualitative expert review by presentation owners rating contextual validity and usefulness. Finally, User Experience was quantified through task performance metrics (success rate and completion time) and the standardized System Usability Scale (SUS).
4.3. Experiment Materials
The experimental materials comprised pre-recorded academic presentation videos and their corresponding presentation documents. A workspace equipped with a GPU supported the multimodal processing and LLM inference throughout the evaluation.
4.3.1. Presentation Videos and Documents
The dataset includes five pre-recorded academic presentation videos and their corresponding documents, ranging from 8 to 27 min with an average of 30.4 slides per presentation. Sourced from natural online settings to ensure ecological validity, the recordings feature non-native speakers (average B2 proficiency) with Indonesian accents. These materials introduce specific technical challenges. Visually, the slides contain figures and mathematical formulas that strain standard OCR engines. Acoustically, the accented delivery and residual noise complicate transcription. Following segmentation, the sub-clips average 37.8 s in duration, ranging from 3 to 149 s.
To support the robustness ablation study, digital masking of the slide number
ROI in all five videos generated a derivative called the
Obscured Dataset. These dataset simulates presentation styles lacking visible numbering, forcing the system to rely on the
visual fallback mechanism.
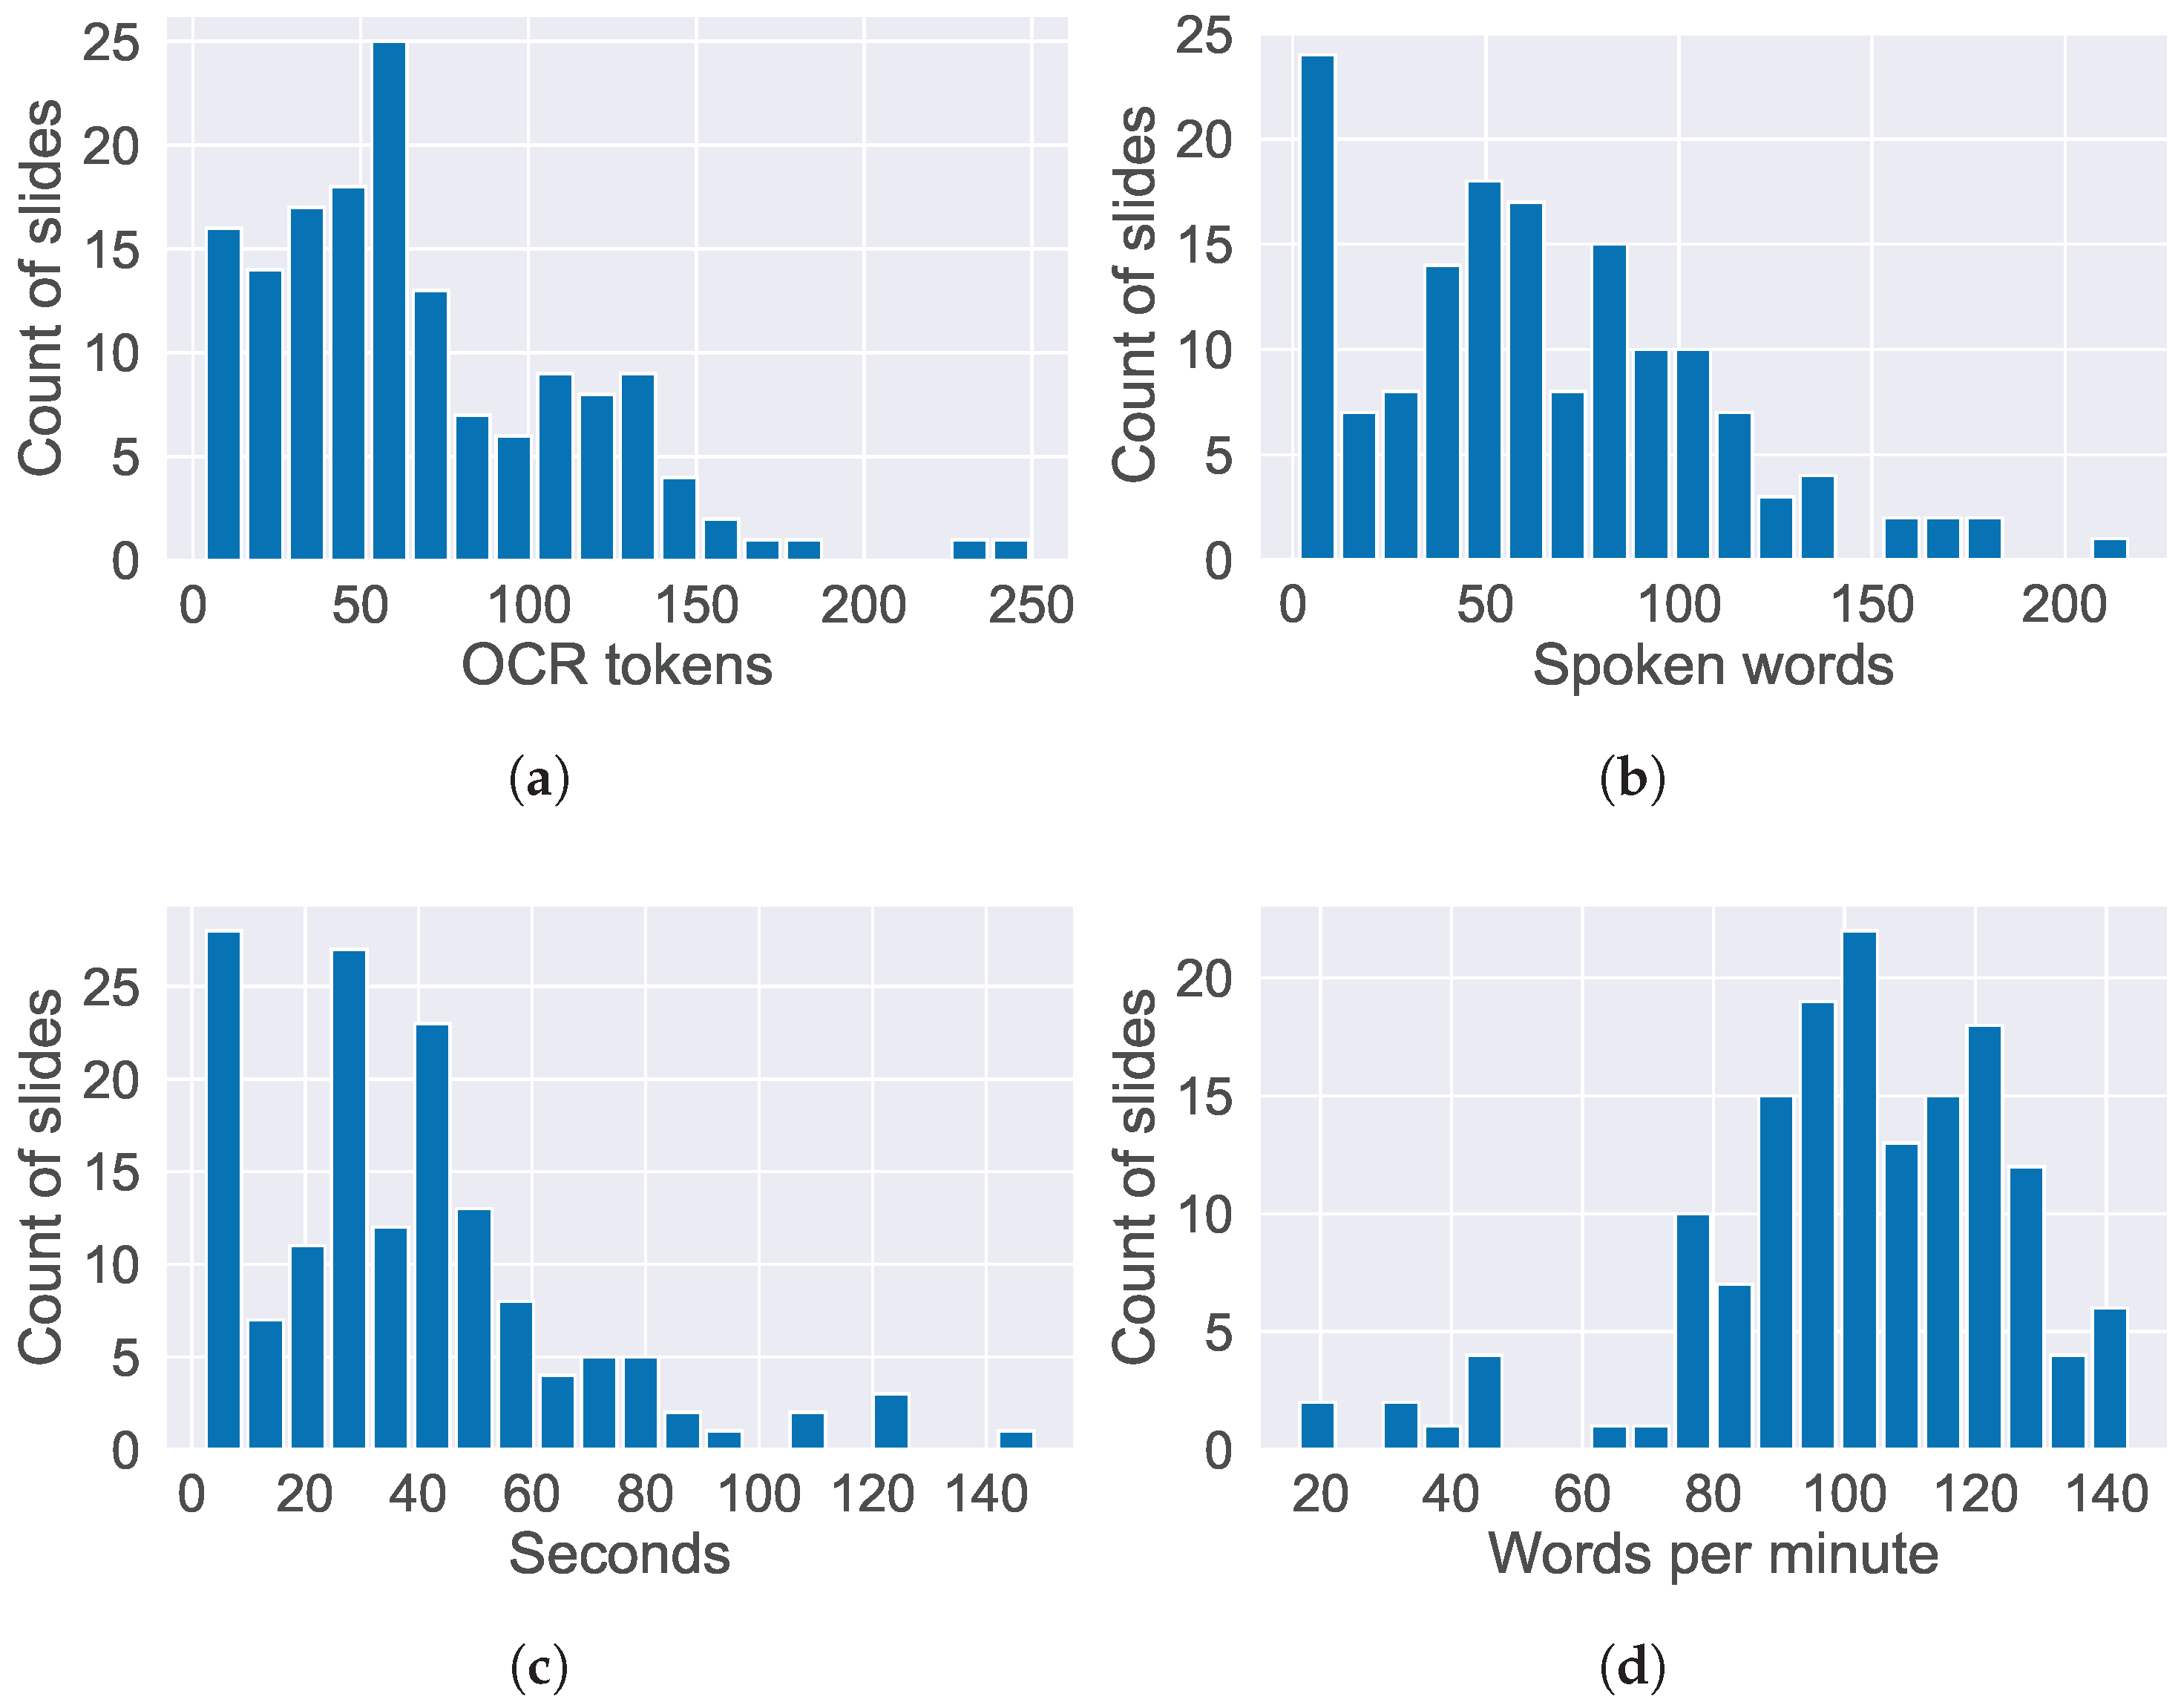
Figure 9 summarizes the detailed statistics for the videos and slides.
4.3.2. Hardware and Runtime Setup
The system was executed on the following configurations. It was equipped with an NVIDIA RTX 3070 Ti GPU with 8 GB of VRAM, an AMD Ryzen 9 CPU, and 32 GB of RAM, running Windows 11. The client interface was implemented in Streamlit v1.40, while the backend modules were developed using Python v3.10.16 with CUDA support.
4.3.3. Data Collection Procedure
The system backend automated the data collection by logging user interaction events, including task initiation and completion times. To establish reliable baselines for the algorithmic evaluation, the study employed two manual annotation efforts. Two independent raters manually annotated the slide transition timestamps for all five videos using the VLC media player’s next frame feature. These timestamps served as the universal ground truth for both the Standard and Obscured condition evaluations. To validate the
LLM-as-Judge, the same two raters independently scored a random subset of 30 generated annotations using the 5-point coherence rubric. Consensus discussions resolved any discrepancies between raters to ensure the high quality of the reference data [
50].
Presenter Validation and User Feedback provided the subjective evaluation data. Prior to user testing, five original presentation owners reviewed their corresponding enriched presentations. Structured evaluation forms assessed the contextual validity and practical usefulness of the generated annotations via a 5-point Likert scale. Regarding User Feedback, upon completing the task session, participants responded to the System Usability Scale (SUS) questionnaire and provided open-ended feedback regarding their experience. Structured JSON files stored all outputs, including segmentation logs, annotations, and survey responses, for subsequent analysis.
4.4. Parameter Selection Analysis
Before evaluating the proposed method against state-of-the-art baselines, this section justifies the choice of two critical hyperparameters, the debouncing window size and the SSIM threshold (). The study calibrated these parameters on a pilot dataset to maximize system robustness.
4.4.1. Impact of Debouncing Window (Stage 1)
To handle transient
OCR errors such as flickering cursors, the study conducted a controlled stress test using
frames with simulated cursor noise. As detailed in
Table 2, a 3-frame window (approx. 100 ms) proves sufficient to eliminate all stochastic noise. The analysis confirms a
False Positive Rate (FPR) of 0.0% with a tight 95% confidence interval of [0.0, 0.4], indicating high reliability. Increasing the window to 5 frames provides no additional accuracy benefit but increases system latency without statistical justification.
4.4.2. Impact of SSIM Threshold (Stage 2)
Following the primary detection, the visual fallback mechanism was calibrated on a dataset containing
annotated slide transitions and
static sequences. The analysis examines the trade-off between
True Positive Rate (TPR) and
False Positive Rate (FPR) by sweeping
from 0.75 to 0.95. As shown in
Table 3, lower thresholds at 0.75 result in excessive false alarms with
FPR value of 3.1%,
CI [2.0, 4.4]). Conversely, overly strict thresholds at 0.95 significantly degrade the
score to 0.92. Consequently, the system employs
as the optimal operating point. This configuration achieves a near-perfect F1 score of 1.00 (95%
CI [0.99, 1.00]) and maintains a statistically robust 0.0%
FPR.
4.5. Slide Segmentation Accuracy
To evaluate the segmentation accuracy, the system-generated slide boundaries were compared against manually annotated ground-truth (GT) data across five presentation videos. Each boundary represents a timestamp (in seconds) marking the transition between two consecutive slides within the presentation video. The segmentation performance was measured using precision, recall, and score.
Several baseline methods were included for comparison.
Uniform Segmentation divides the video into equal-length sub-clips regardless of content,
Text Tiling [
51,
52] applies the topic-based text segmentation to the presentation transcripts. For visual baselines, this study compared it against
Structural Similarity Index (SSIM)-based frame differencing and
Histogram–based detection. Additionally,
PySceneDetect v0.6.7 [
53], as a popular open-source scene detection library, was also evaluated. To determine the optimal sampling rate for the proposed hybrid two-stage detector, this study evaluated its performance under two configurations, a high-precision 1 s interval and the efficiency-focused 3 s interval.
Table 4 presents the aggregated quantitative results. While the
uniform segmentation,
Text-Tiling, and
Histogram baselines proved ineffective (
), the visual
SSIM baseline achieved a high accuracy (
) but incurred a substantial processing overhead. Conversely, PySceneDetect offered the fastest execution (58 s) but suffered from significant under-segmentation (
). The proposed 1 s configuration achieved the highest performance (
), yet required the longest processing time. Consequently, the 3 s configuration emerges as the optimal trade-off. It leverages the
OCR precision to maintain a macro-averaged
score (
) comparable to
SSIM, while significantly reducing computation time to 1:49.
Further analysis reveals that the performance gap between the 1 s and 3 s configurations stems primarily from timestamp granularity rather than missed detections. Both configurations identified identical structural changes. However, the wider sampling interval introduces a slight temporal offset. For example, the transition marking at 15 s produced by the 3 s configuration versus the ground truth of 13.5 s. Consequently, the lower score reflects alignment precision rather than segmentation failure.
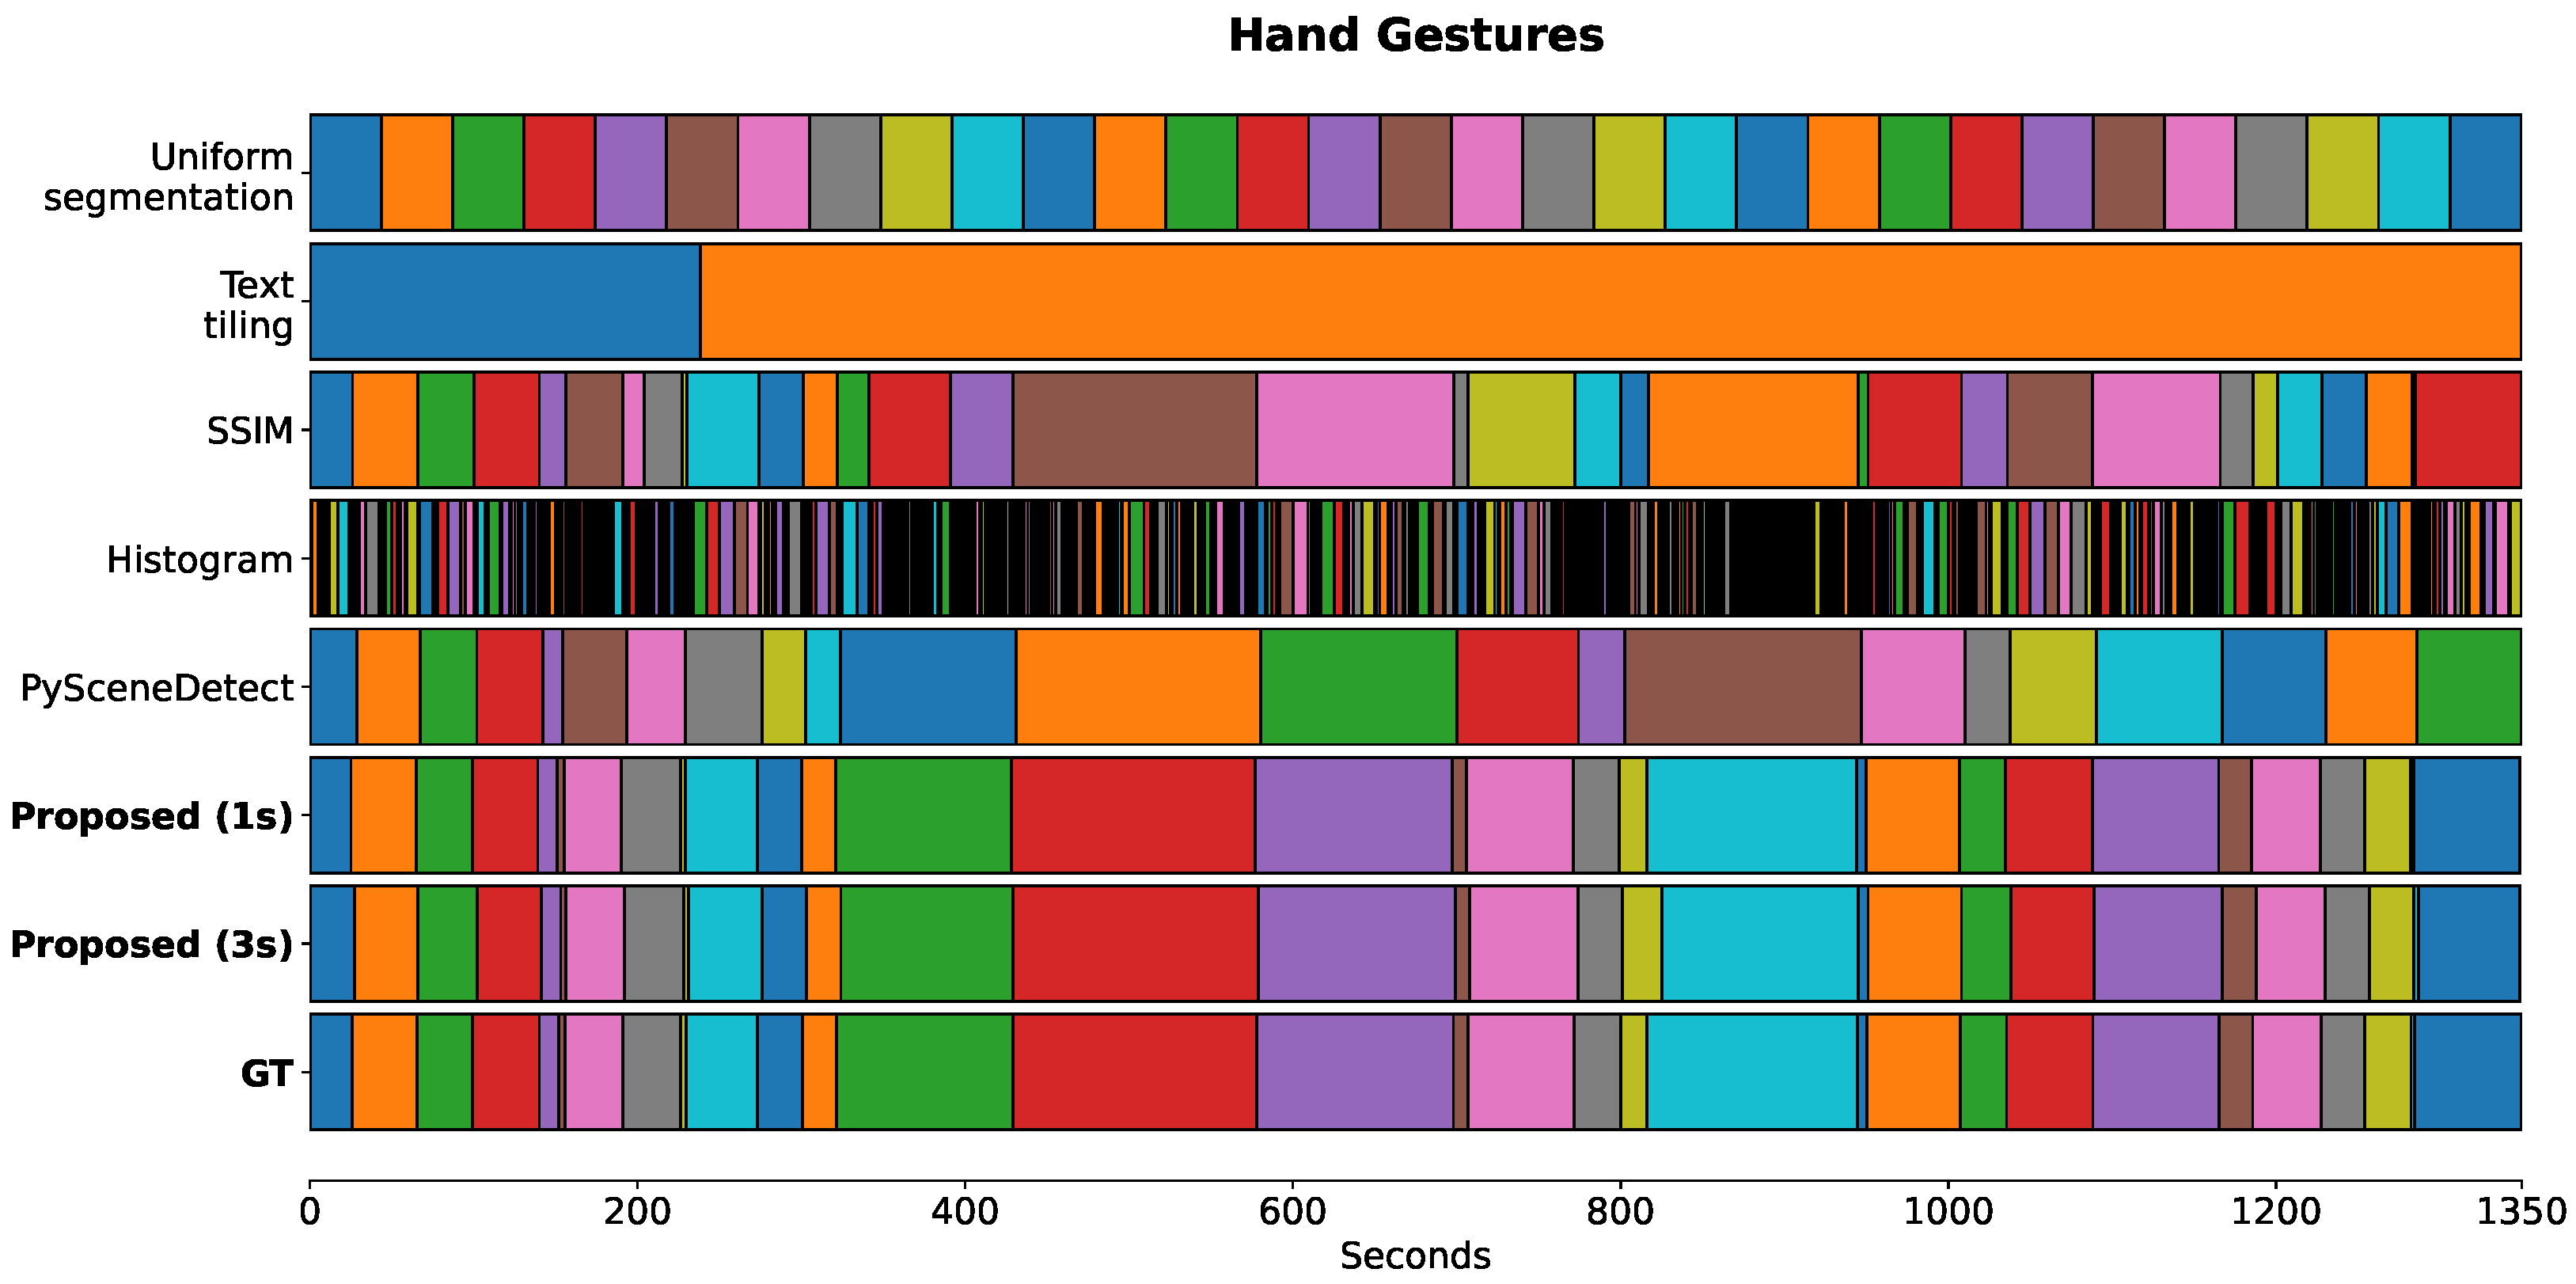
To provide a qualitative assessment,
Figure 10 visualizes and compares the segmentation outputs across different methods. As illustrated, the
Proposed (3 s) configuration generates segment boundaries that align closely with the ground truth timestamps. In contrast, while
PySceneDetect offers rapid processing, it misses several key transitions, resulting in merged slides. Balancing segmentation accuracy with runtime efficiency, the 3 s configuration serves as the default parameter for the final implementation of the
Slide Annotation System.
To analyze the stability of the primary OCR component, this study examined 2229 sampled frames across the five presentation videos. The analysis revealed that raw OCR readouts were empty or unstable in 4.2% of processed frames, primarily attributed to title slides, visual transition effects, or cursor occlusions. While the temporal debouncing filter effectively mitigates these transient artifacts, it remains insufficient for scenarios where slide numbers are entirely absent.
To evaluate system resilience under such conditions, the
Obscured Dataset, where slide numbers were digitally masked facilitated an ablation study. As
Table 5 shows, the
OCR-only baseline yielded no valid detections (
) under this condition, as it relies heavily on explicit digit recognition. In contrast, the proposed hybrid system successfully triggered the
visual fallback mechanism, achieving a robust mean
score of 0.885 (
, 95%
CI ). Notably, this performance rivals the
SSIM baseline reported in
Table 4 (
), yet operates within the more computationally efficient hybrid architecture. This statistical consistency demonstrates that the two-stage design enables the system to remain functional and reliable, even in scenarios where slide numbers are absent or occluded.
4.6. LLM-as-Judge for Annotation Coherence
Annotation coherence refers to the logical consistency and contextual alignment of the generated annotations in relation to both the slide text and the spoken narration. To enable objective and scalable assessment of this quality, this study adopted an
AI-assisted evaluation approach based on the
LLM-as-Judge framework [
54]. Specifically,
DeepSeek v3 was employed to evaluate annotations generated by gemma3:4b Q4_K_M quantization, selected for its demonstrated reasoning capability [
55]. This subsection presents the configuration and validation of the
LLM-as-Judge framework used to assess annotation coherence.
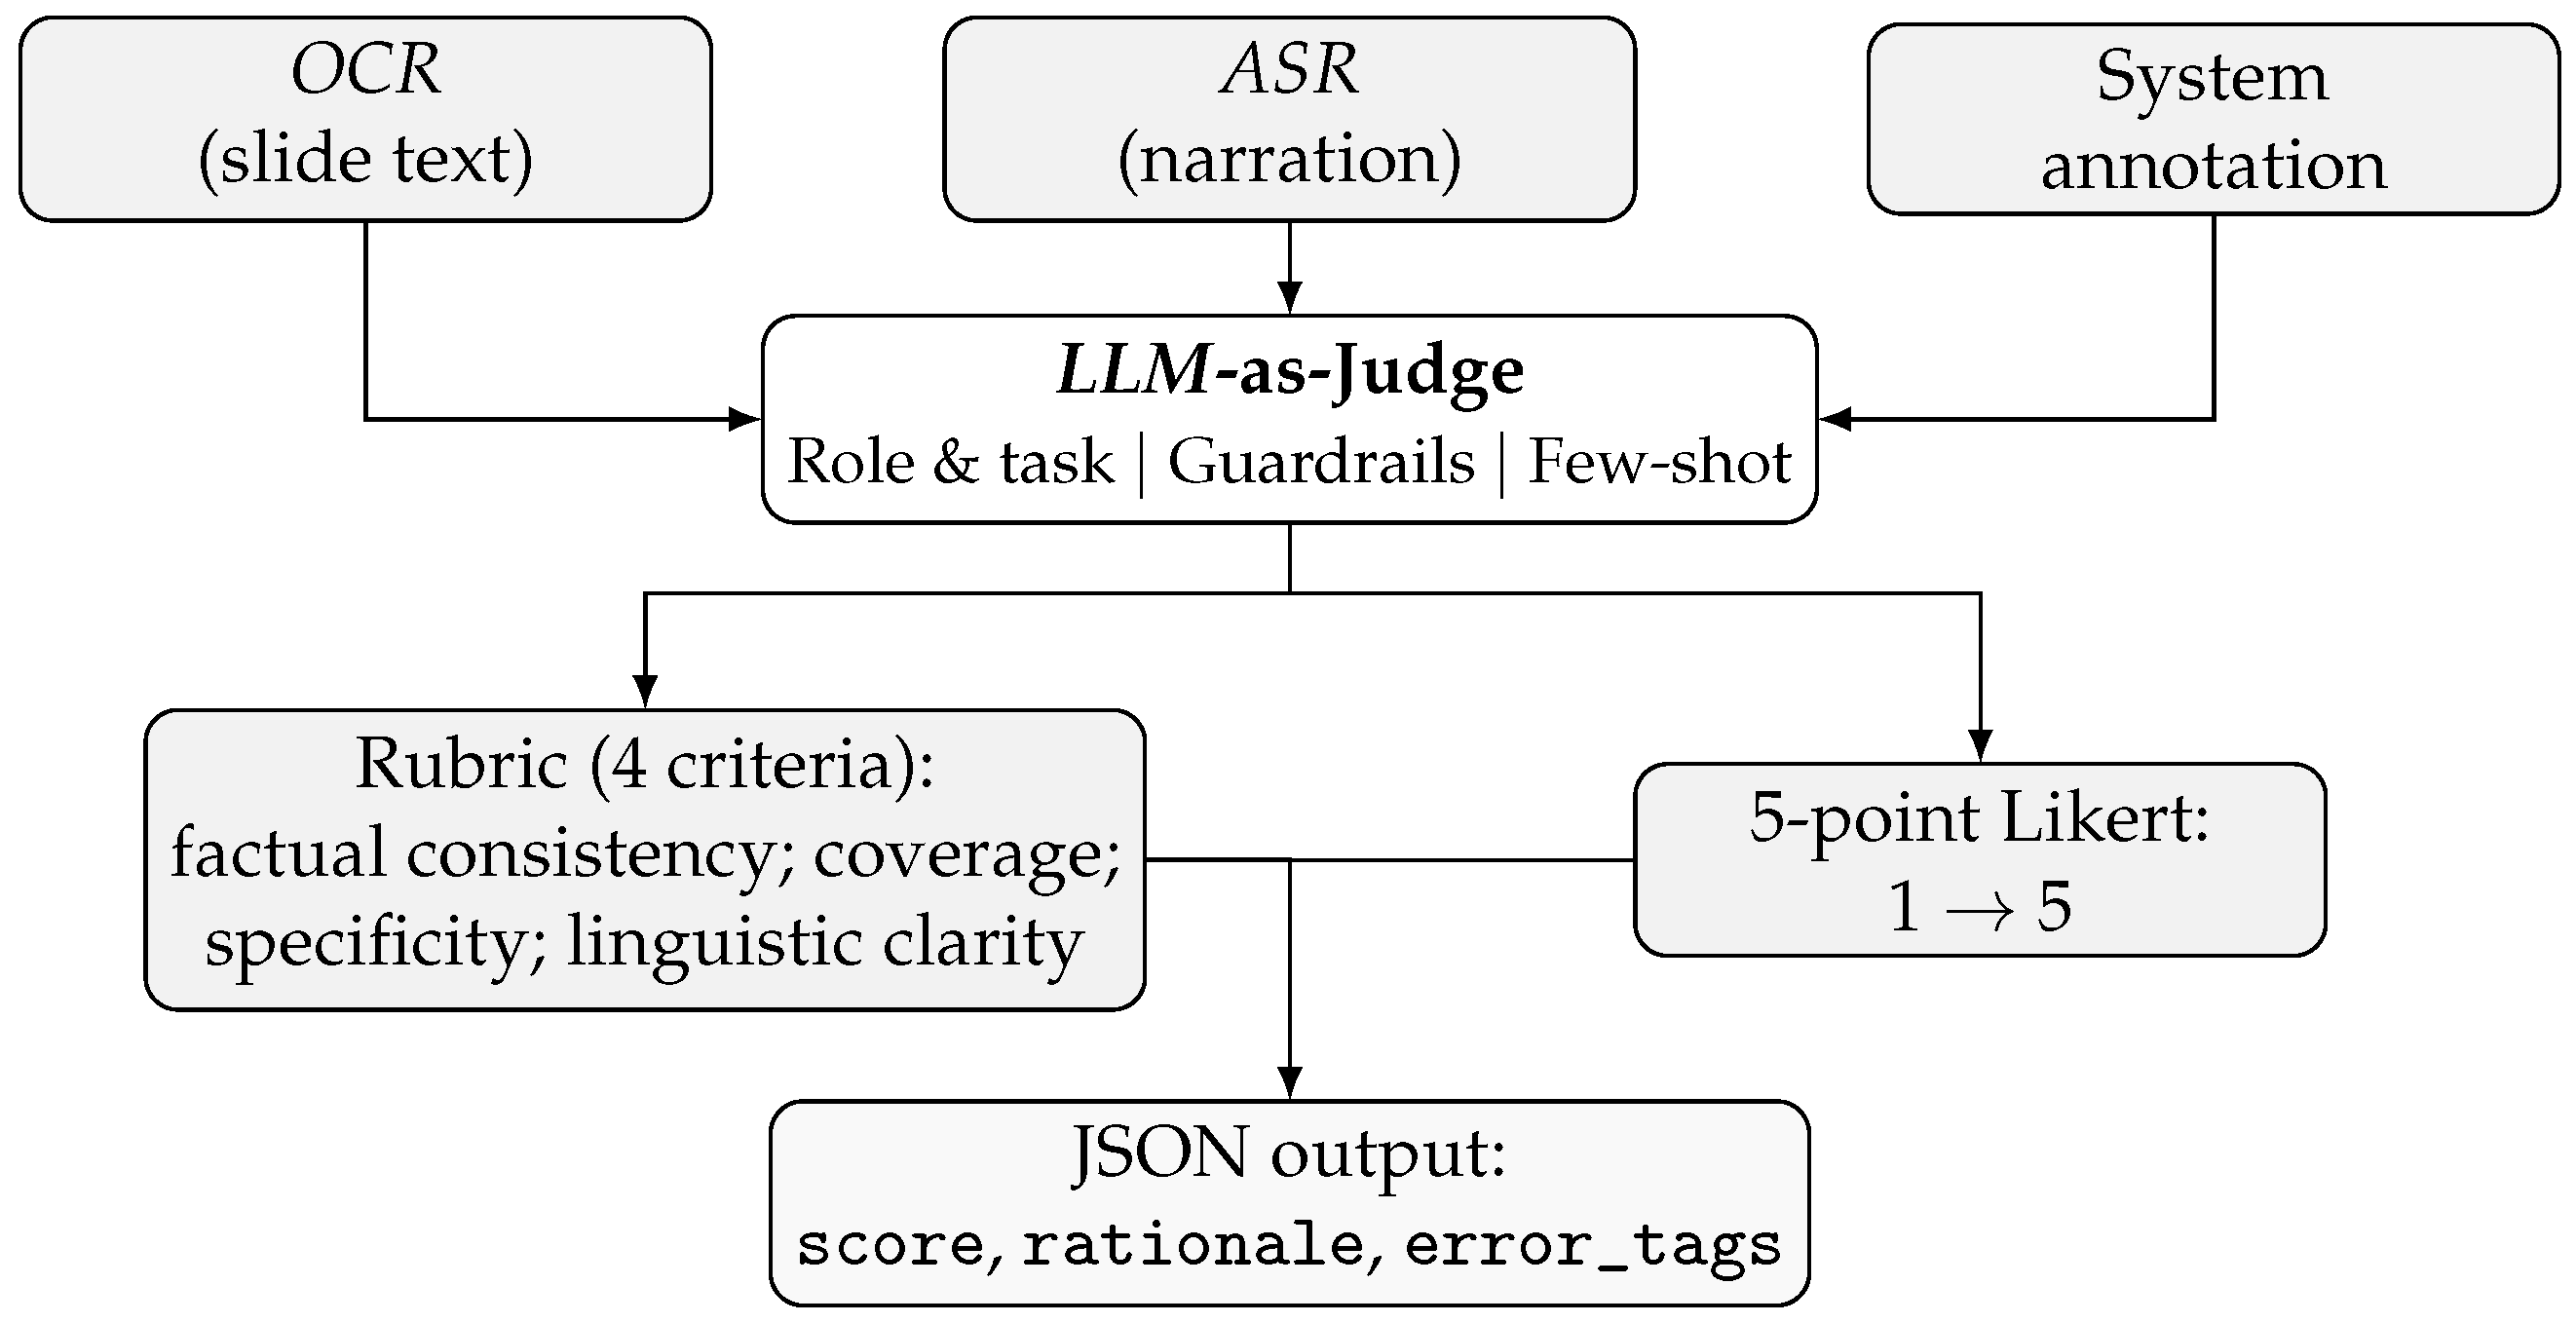
To ensure consistency and reproducibility, the judge
LLM was assigned the role of evaluating the coherence and faithfulness of generated slide annotations. It processed three aligned inputs consisting of the slide text extracted through
OCR, the spoken transcription from
ASR, and the generated annotation. Coherence was rated on a structured rubric covering four criteria using a five-point Likert scale, with 1 indicating incoherent and 5 indicating fully coherent. The criteria included factual consistency, coverage of key ideas, specificity, and linguistic clarity. The verbatim definitions for each score level are provided in
Appendix C. The results were stored in a standardized JSON format containing the fields
score,
rationale, and
error_tags. An overview of the
LLM-as-Judge configuration is illustrated in
Figure 11.
A comparison between the
LLM-based evaluation and human judgments was conducted to verify the reliability of this approach. A representative subset of 30 annotation samples, spanning the full 1–5 rating scale, was evaluated by two human judges using the same rubric. First, to validate the human ground truth, the inter-rater reliability between the two human judges were calculated. They achieved a Weighted Cohen’s
of 0.655 (95%
CI ) and Spearman’s
of 0.745 (95%
CI ), indicating substantial agreement. Human scores were then averaged to obtain a consensus rating [
56]. To measure the agreement between the
LLM and this consensus using Cohen’s
, the averaged human scores were rounded to the nearest integer to produce the necessary discrete categories.
As shown in
Table 6, the
LLM’s scores demonstrated strong alignment with the human consensus. The system achieved a Weighted
of 0.705 (95%
CI ), slightly exceeding the human–human agreement, and a strong rank correlation (
, 95%
CI ). Although the
LLM exhibited a slightly more conservative scoring tendency (average score = 3.09) compared to human ratings (average score = 3.25), it maintained consistent alignment with human quality rankings. Given the limited sample size (
) and the non-parametric nature of Likert scale data, bootstrap resampling with
iterations were employed to estimate the 95%
Confidence Intervals (CI). This method was chosen to ensure the stability of the inter-rater reliability metrics without relying on assumptions of normality. These results validate the reliability of the
LLM-as-Judge framework for large-scale annotation coherence evaluation.
4.7. Annotation Alignment Accuracy
To evaluate alignment accuracy, an ablation study on a diverse subset of 30 slides assessed the system’s performance. For each generated annotation, presentation owners identified the most specific visual content in the slide to serve as the ground truth. The analysis compared three configurations, the Cosine-only baseline, the Proposed Hybrid Score, and the Full Pipeline with Cross-Encoder re-ranking.
As
Table 7 summarizes, the Cosine-only baseline encountered difficulties with dense academic content, achieving an accuracy of only 53.3% (95%
CI ) due to semantic ambiguity between visually similar elements. The integration of spatial and numeric cues in the Hybrid Score improved accuracy to 76.7% (95%
CI ), confirming the critical role of non-semantic signals in filtering irrelevant candidates. Finally, the Full Pipeline achieved 90.0% accuracy (95%
CI ), demonstrating that cross-encoder re-ranking robustly resolves remaining subtle ambiguities.
4.8. System Latency and Deployability
To assess the feasibility of real-world deployment, this study measured the end-to-end pipeline latency averaged across the five test videos. As detailed in
Table 8, the full pipeline required an average processing time of 7 min and 13 s (
s). The computational load was distributed primarily across the video processing and
LLM inference stages. Notably, the use of gemma3:4b Q4_K_M quantization for both keyword extraction and annotation generation contributed equally to the inference latency. Despite these multiple distinct processing passes, the system maintained a real-time factor of 0.35× and an average throughput of 18.0 s per slide. This confirms that the pipeline operates efficiently within the latency constraints required for offline lecture archiving.
4.9. Validity and Usefulness of Embedded Annotations
The validity of embedded annotations refers to the degree to which the generated annotations accurately and faithfully reflect the intended meaning of the original presentation content. Usefulness reflects the practical value of these annotations in supporting comprehension of the content. Since the original presenters possess the most comprehensive understanding of their materials, they were assigned as expert evaluators to assess both the validity and usefulness of the embedded annotations.
The assessment employed a ten-item questionnaire using a five-point Likert scale, ranging from 1 for Strongly Disagree to 5 as Strongly Agree. The questionnaire was divided into two categories, validity that covers factual accuracy, relevance, alignment with the slide content and usefulness, which covers clarity, time efficiency, and potential for reuse during review sessions. Each presenter reviewed the annotated version of their own presentation and rated each item accordingly.
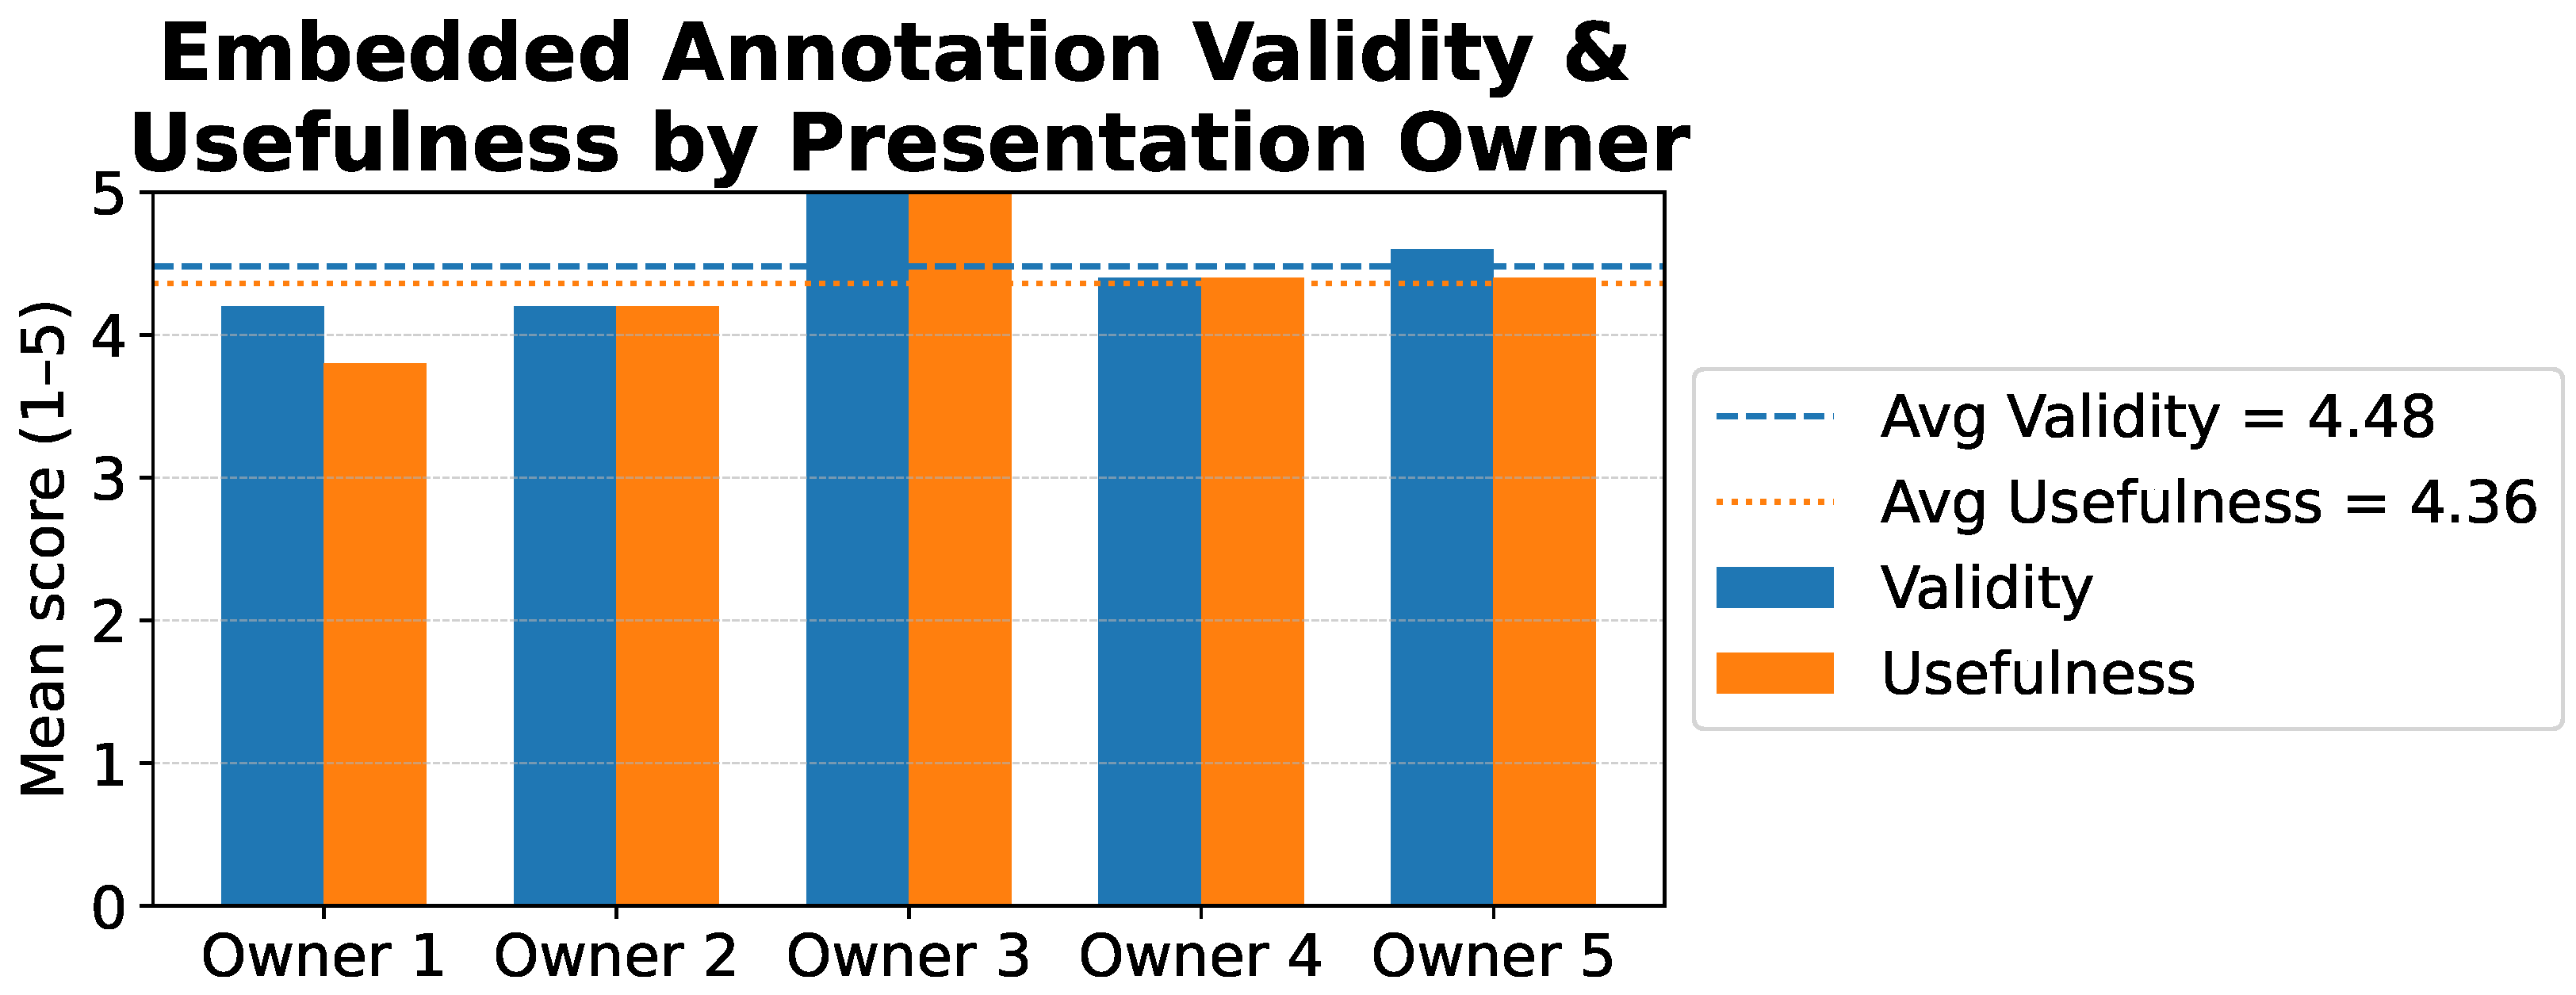
The results yielded a high mean validity score of 4.48 (, 95% CI ) and a mean usefulness score of 4.36 (, 95% CI ). The overall average across all items was 4.42 (). Notably, 94% of the questionnaire items were rated 4 or higher, indicating that the presenters perceived the annotations as both factually accurate and contextually appropriate. Minor qualitative issues were noted, including occasional abbreviation mismatches such as “FPLAS” recognized as “f+” and suggestions to allow multiple annotations within a single paragraph to better capture complex explanations.
These findings confirm that the generated annotations effectively preserve the intended meaning of the original materials while providing additional value for later review. They also ensure that the annotated slides used in the subsequent usability testing accurately reflected real-world system performance. A summary of the validity and usefulness ratings across all presenters is shown in
Figure 12.
4.10. Task Performance for Success Rate and Completion Time
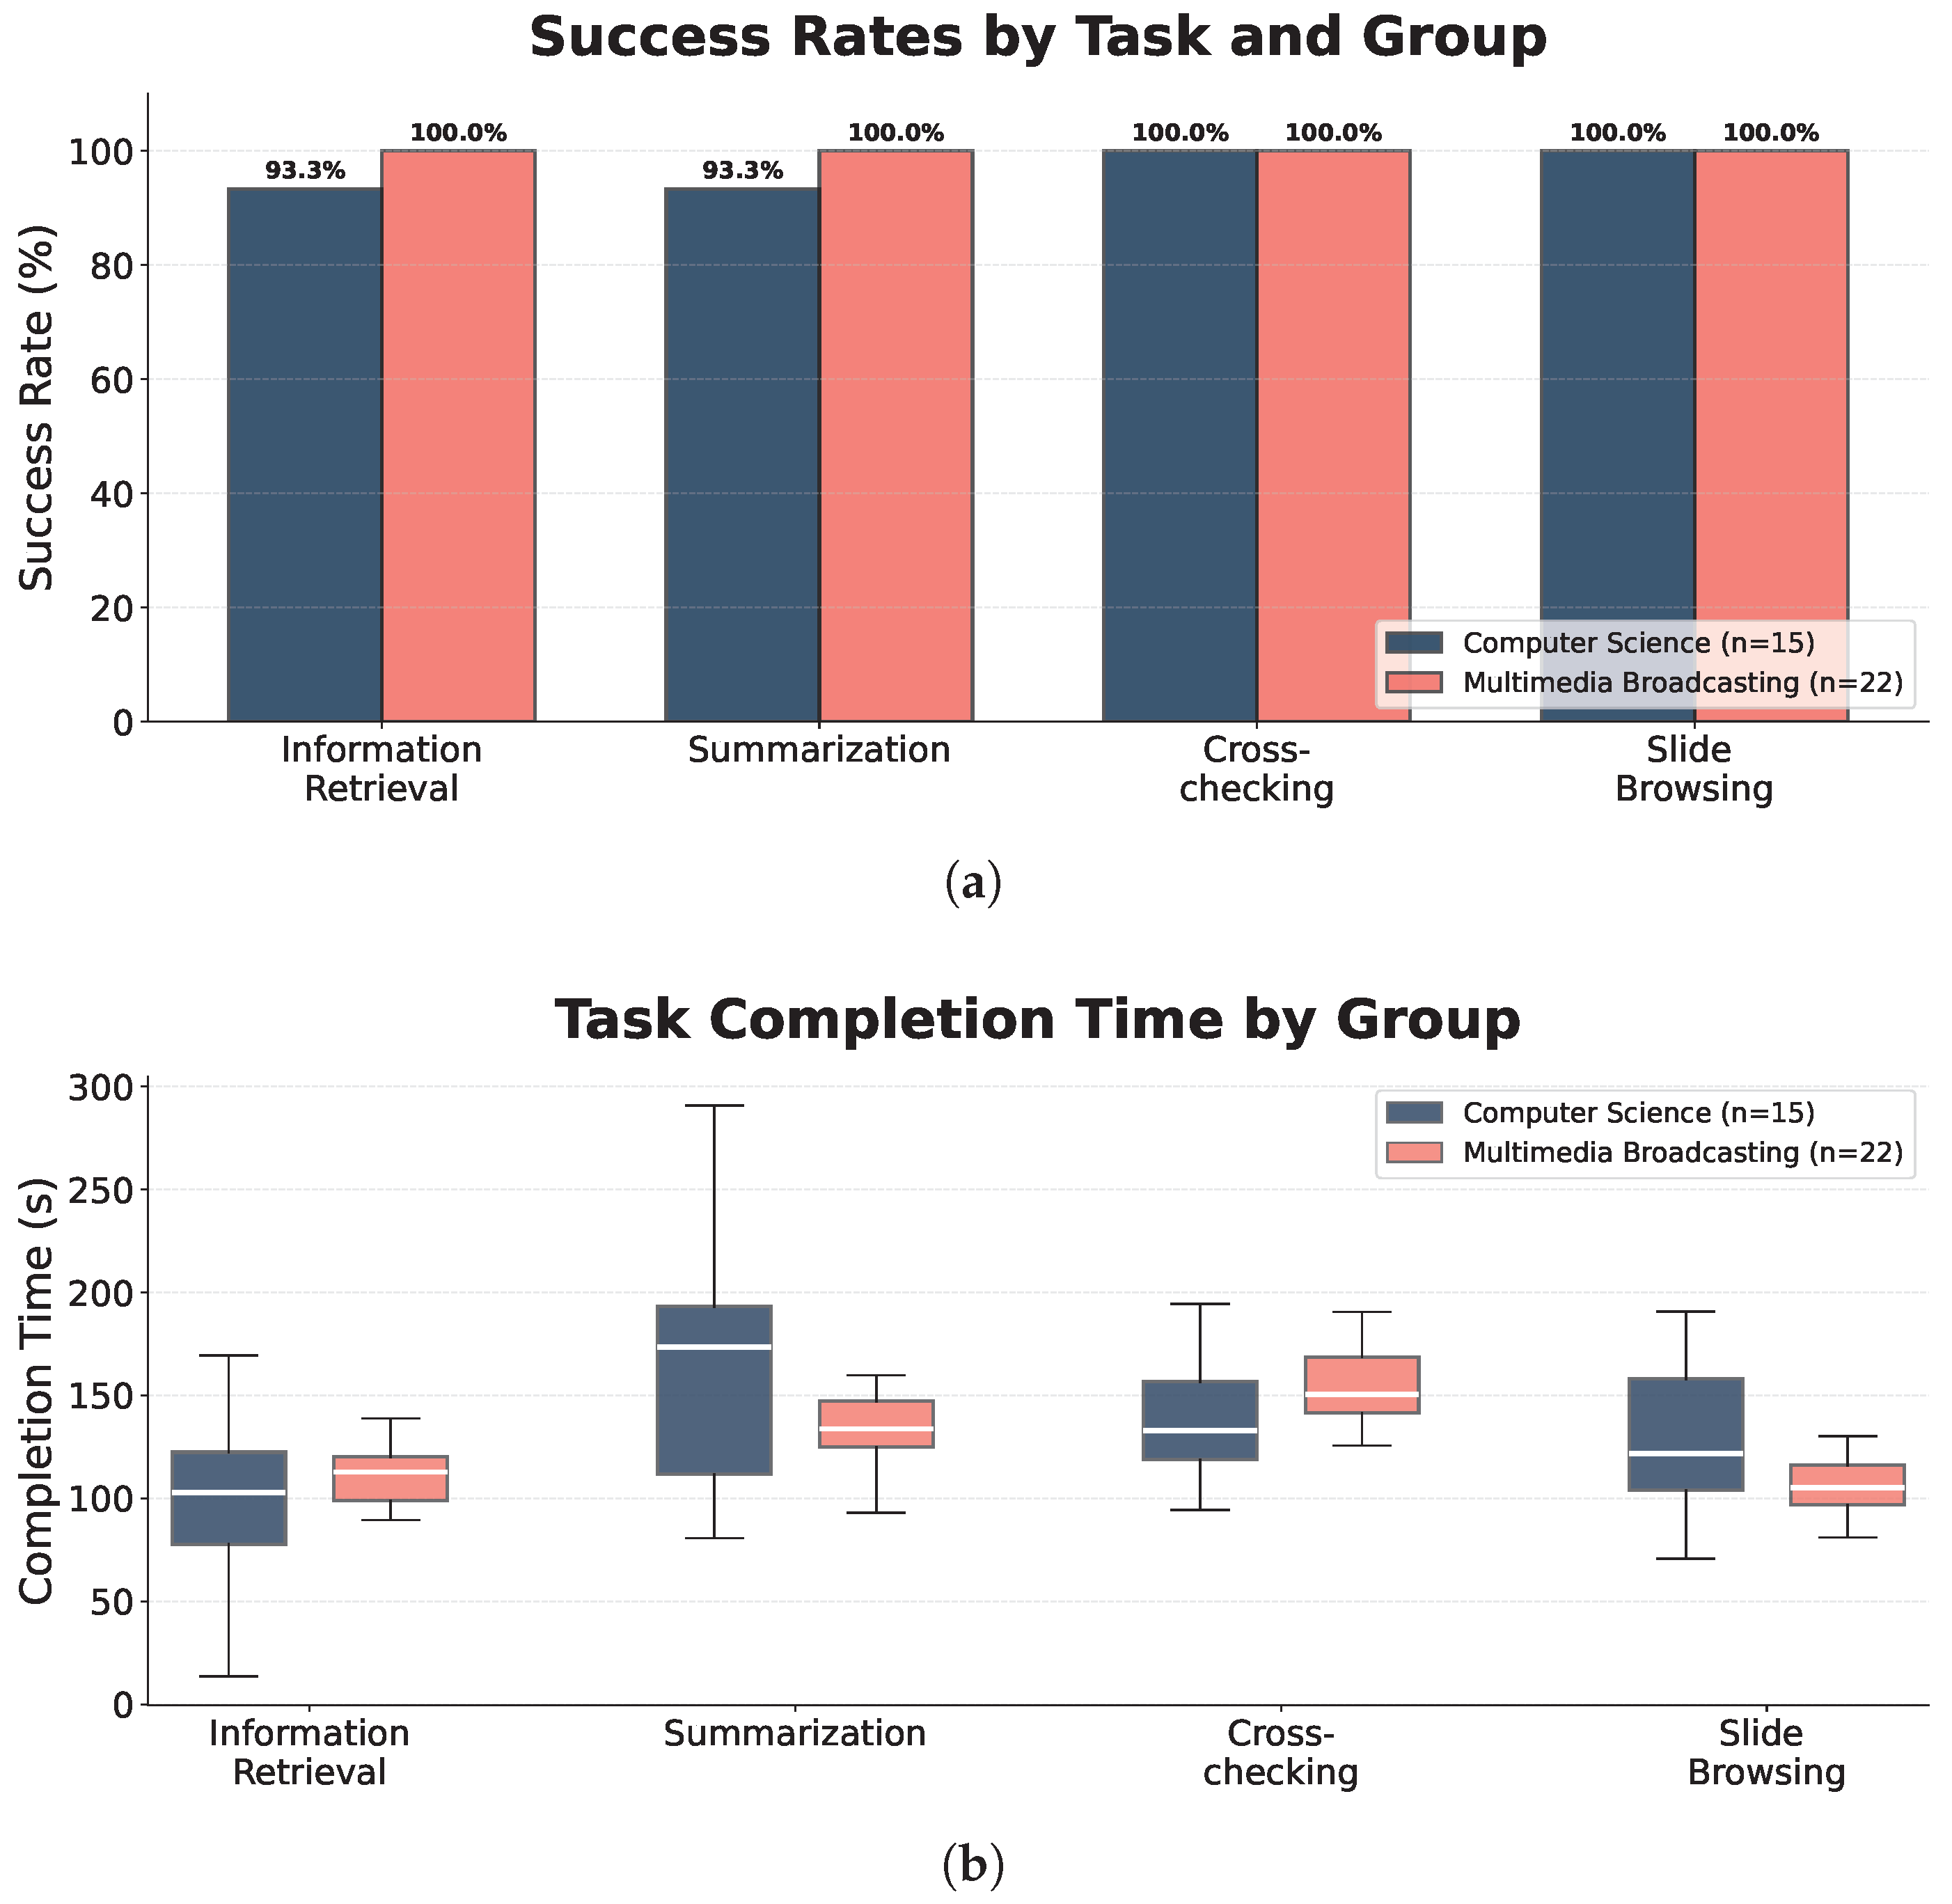
The evaluation assessed task performance to determine the system’s effectiveness and efficiency in supporting review activities across two participant groups with distinct educational backgrounds. The first group comprised 15 students majoring in Computer Science (CS), while the second included 22 students from Multimedia Broadcasting (MB).
Prior studies on slide summarization, content retrieval, and multimodal interaction in recorded presentations guided the selection of the four task categories [
31,
48,
49]. The
success rate, defined as the proportion of participants who successfully completed each task within the allotted 10 min, quantified effectiveness. Simultaneously, the
completion time, calculated as the average duration (in seconds) among successful participants, measured efficiency. A 10 min time limit simulated a realistic review scenario. The system automatically logged both metrics, and
Figure 13 summarizes the results. Prior to analysis, task completion time distributions were assessed for normality using the Shapiro–Wilk test (
) and for homogeneity of variance using Levene’s test (
). Visual inspection of the boxplots on
Figure 13b further confirmed the absence of extreme outliers. Given that the assumptions for parametric testing were met, this study report independent samples
t-tests (
) accompanied by Cohen’s
d to estimate the magnitude of performance differences.
The proportion of participants who completed tasks within the 10 min limit defined effectiveness. The system yielded a high aggregate success rate of 94.6% (35/37), with a 95%
CI of
. As
Figure 13a demonstrates, both groups attained high success rates (93%–100%) across all four task categories, confirming the system’s effectiveness in supporting the review process regardless of educational background. However, the analysis of completion times revealed significant task-specific performance patterns aligned with domain expertise.
The average duration in seconds for successful trials quantified efficiency, serving to identify performance disparities between participant groups.
Table 9 summarizes detailed statistical comparisons, including Means,
Standard Deviations (SD), and significance levels derived from independent
t-tests. The results highlight significant domain-specific advantages, with Multimedia Broadcasting (MB) students demonstrating superior speed in browsing tasks, while Computer Science (CS) students excelled in data verification.
4.11. System Usability and Post-Experimentation Feedback
Usability was assessed through the standardized
System Usability Scale (SUS) [
57], administered immediately after participants completed the tasks. The
SUS is a ten-item questionnaire that produces a usability score on a 0–100 scale, where higher values indicate better usability [
58]. In addition to the
SUS questionnaire, participants were asked to provide open-ended feedback on strengths, limitations, and suggestions for improvement. Both the
SUS questionnaire and the open-ended feedback were collected using a digital form. The questions for the open-ended feedback are illustrated in
Table 10, which documents the qualitative dimensions of participant experience.
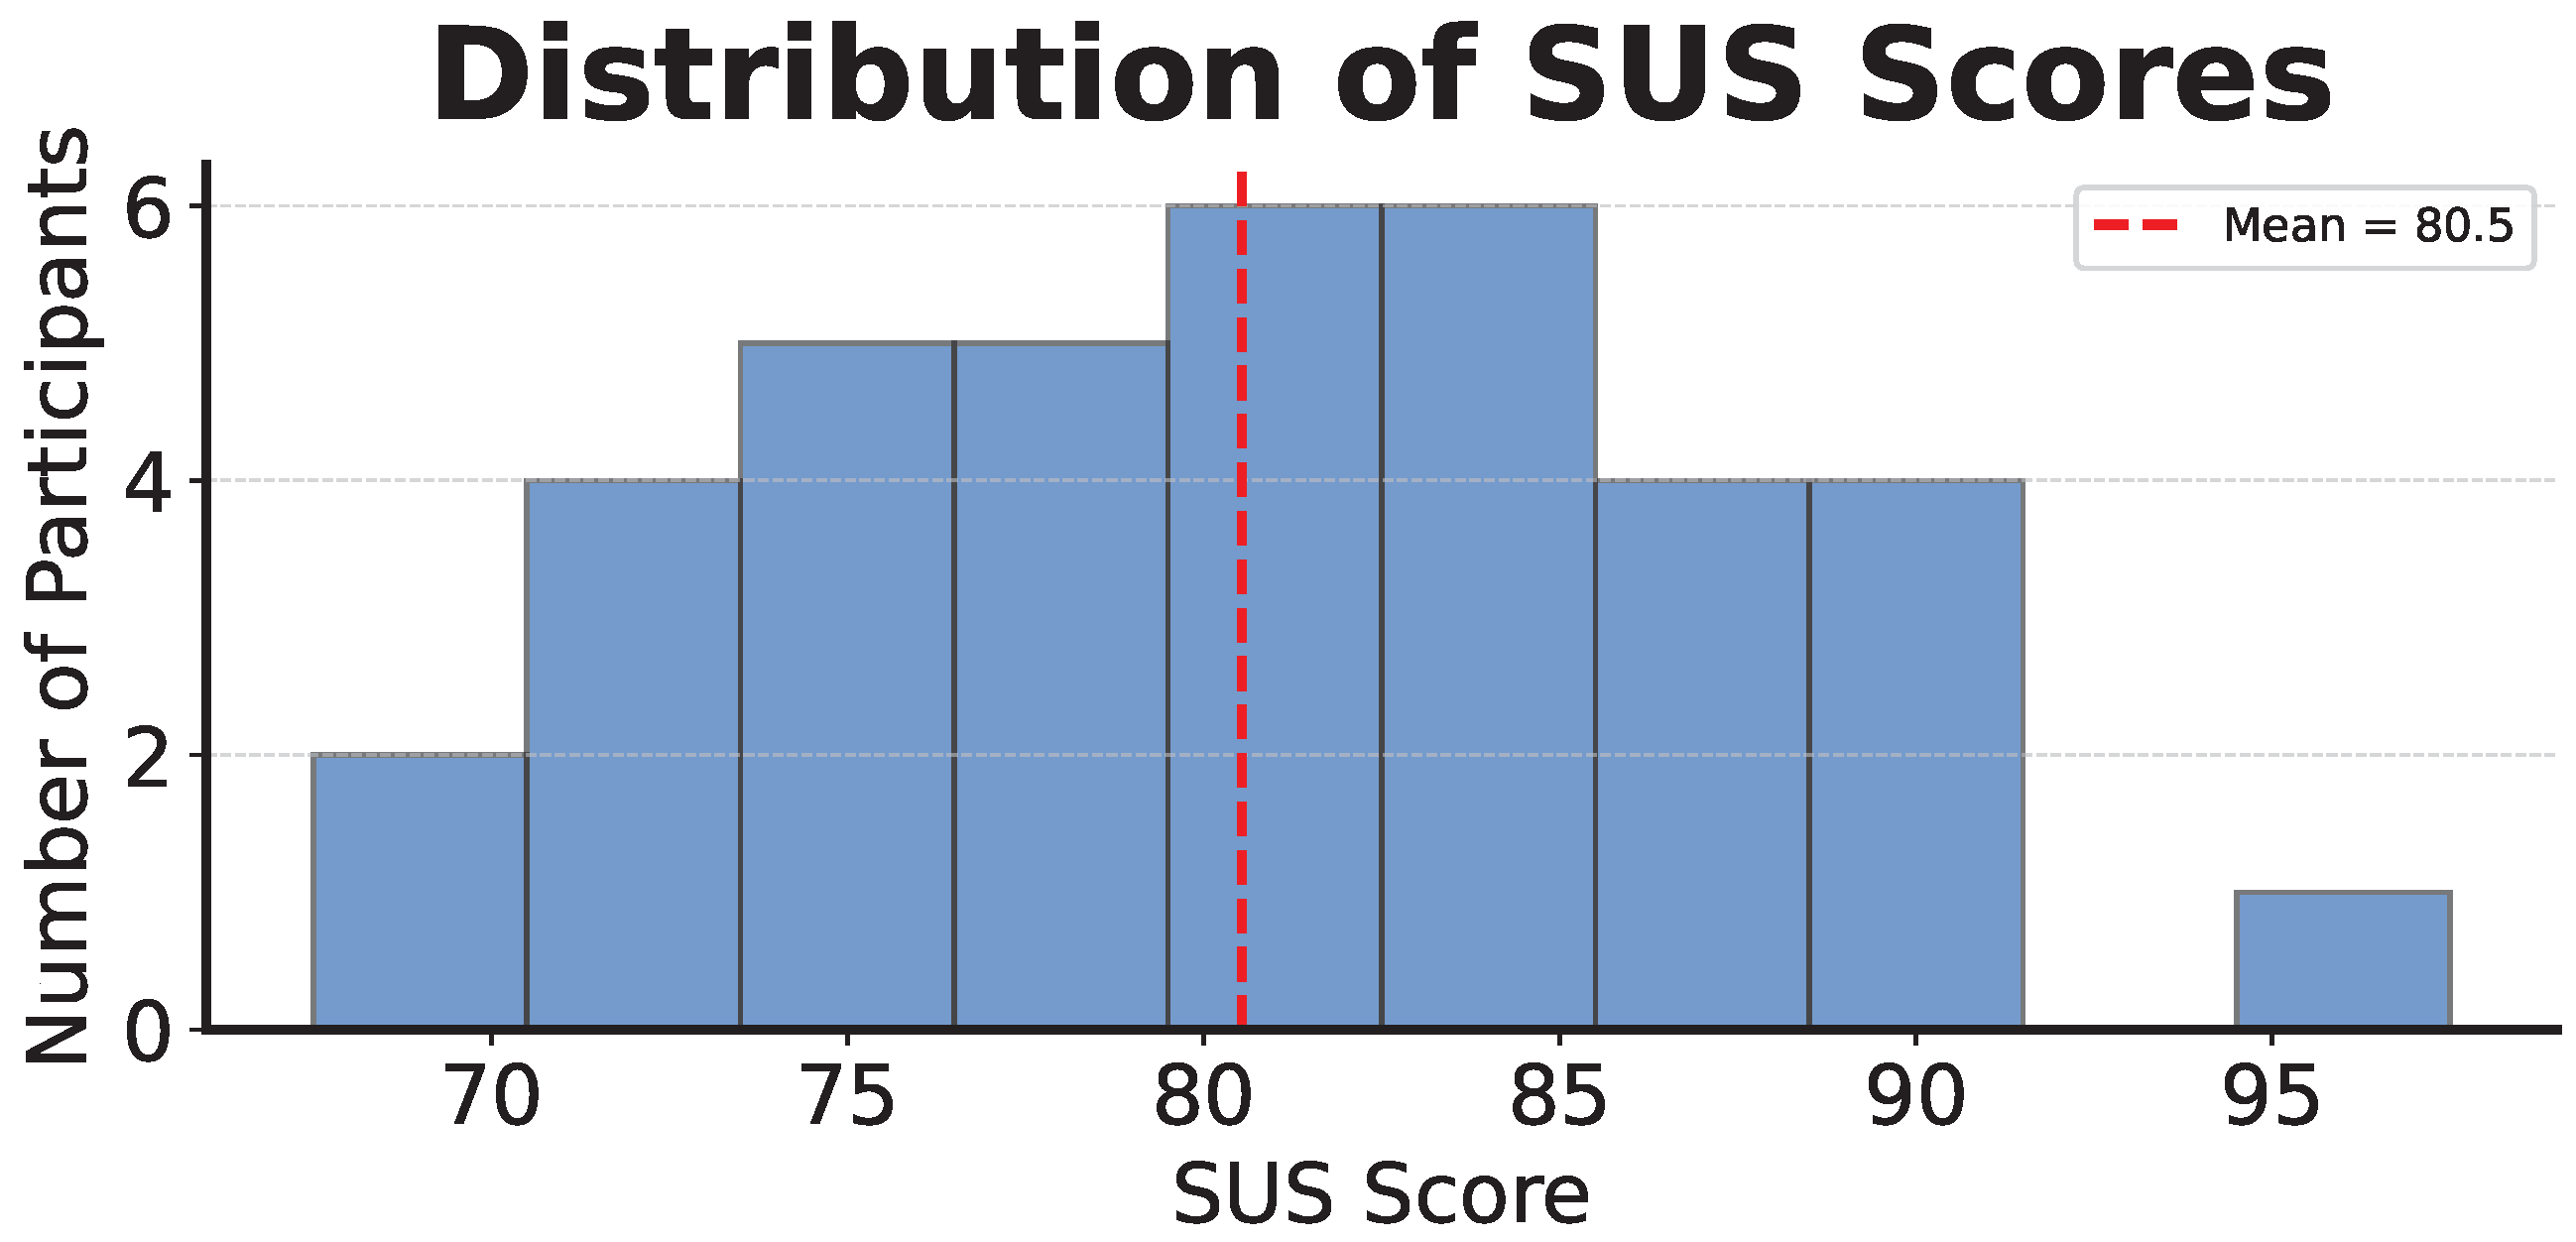
The system achieved a mean
SUS score of 80.5 (
), with a 95%
CI of
. Reliability analysis yielded a Cronbach’s
of 0.83, indicating high internal consistency in the participant responses. The distribution of individual scores is illustrated in
Figure 14. Qualitative feedback revealed recurring strengths, particularly the ease of browsing, interface clarity, and the time efficiency gained through automated annotations. As one participant explained,
“Slide navigation was very smooth and helped me focus on the important parts.”However, participants also identified areas for refinement, most notably annotation precision and system responsiveness. Typical remarks included “Some annotations were slightly misaligned, especially around numerical content,” and “There was a minor delay when generating PowerPoint files, which made the process feel a bit slow.” Several users further proposed practical enhancements, such as improved text alignment, automatic cleaning of extracted text, and lighter export options to streamline the overall workflow.
These results indicate that the system was generally well-received, with some variation in user perception reflecting users’ differing levels of familiarity with digital systems and expectations of annotation accuracy. Since participants were primarily computer science and information systems students, a degree of technology-oriented bias cannot be ruled out, and the findings may not fully generalize to broader user populations. The combination of strong usability scores and constructive feedback supports the system’s overall feasibility for presentation review.
5. Discussion
The evaluation results demonstrate that the proposed Slide Annotation System effectively integrates multimodal inputs, including hybrid slide segmentation, speech-to-text transcription, and LLM-driven annotation generation, to produce coherent and contextually accurate slide-level annotations. Across all evaluation criteria, the system exhibited high technical accuracy, semantic reliability, and strong user acceptance, indicating its practical feasibility for presentation review and the enrichment of educational content.
Technical and User Performance. The segmentation function achieved an effective balance between accuracy and computational efficiency. The proposed hybrid two-stage detector achieved a macro-average
score of 0.879 (
, 95%
CI ) on the standard dataset. Notably, the system maintained functional performance with an
score of 0.885 (
, 95%
CI ) even when visual slide markers were digitally obscured, overcoming the limitations of pure
OCR approaches. Regarding annotation quality, the
LLM-as-Judge evaluation showed substantial agreement with human ratings (
,
), confirming the reliability of the automated assessment [
54]. Complementarily, expert validation by presentation owners yielded high validity scores of 4.48/5 (
, 95%
CI ), confirming that annotations were contextually aligned with the presenters’ intent. In terms of usability, the average
SUS score of 80.5 (
, 95%
CI ) indicates excellent usability, with participants demonstrating high task success rates. Tasks involving information browsing were completed significantly faster by multimedia students, while summarization tasks reflected cognitive load patterns consistent with multimedia learning theory [
59].
Comparative Positioning. To contextualize the contribution of the proposed system,
Table 11 presents a qualitative comparison against standard commercial meeting assistants and educational video indexing platforms. Existing commercial tools such as Otter.ai and Zoom AI are primarily audio-centric. While they provide effective transcription, they lack visual alignment, meaning they cannot relate information to specific slide regions. Conversely, video indexing platforms such as Panopto utilize
OCR for keyword retrieval but typically lack the generative capabilities to synthesize explanatory notes. The proposed system fills this gap by integrating generative
LLM capabilities with hybrid spatial-temporal analysis, enabling precise annotations that are contextually aligned with the corresponding slide.
Pedagogical Implications and Recommendations. Beyond technical utility, the system supports a shift from passive watching to active learning. At the course level, this study recommend using the system to break long lectures into short, focused clips. These should be assigned for pre-class viewing, allowing class time to be used for problem-solving rather than listening. To help students manage their study time, these clips can be paired with simple to-do checklists and quick surveys where students can flag confusing topics. At the staff level, adoption depends on making the process easy for instructors. Institutions should provide simple recording kits such as studio-in-a-box and standardized slide templates that are easy for the AI to read, along with a shared library of good examples to guide slide design. Finally, at the institutional level, clear policies are needed regarding who owns the video data and how long it is stored. We also advise using the system’s data, such as monitoring where students stop watching to identify boring or difficult sections and improve the course content each semester.
Scalability and Computational Optimization. For long-term adoption and deployment on larger video corpora, optimizing runtime performance is critical. The current implementation relies on GPU acceleration for the LLM and ASR modules, which may present a cost barrier for large-scale processing. To address this, future iterations can employ model quantization to reduce memory footprint without compromising generation quality. Furthermore, handling a large-scale repository of videos would require transitioning to an indexed architecture. Integrating vector databases would allow for efficient storage and retrieval of slide embeddings across thousands of presentations, ensuring the system remains responsive as the dataset grows.
Limitations and Future Work. Despite these encouraging results, several limitations remain. The participants primarily consisted of technically proficient students, which may have biased usability perceptions. While the hybrid detector significantly improves robustness, the visual fallback mechanism (Stage 2) can occasionally be sensitive to animation movement or in-slide embedded video playback, which may trigger false positive transitions. Additionally, the alignment ablation study revealed a 10% error rate in spatial anchoring, even with cross-encoder re-ranking. This algorithmic limitation aligns with participant feedback regarding “occasional misalignments” in dense slide regions
To address this, future iterations will explore audio-based segmentation cues and apply Digital Signal Processing (DSP) to further refine detection in highly dynamic scenarios. User feedback also highlighted challenges in aligning numerical content. Future iterations will implement a Human-in-the-Loop (HITL) mechanism allowing users to manually adjust annotation placement. Finally, as the current evaluation focused primarily on textual coherence, future work will incorporate Vision-Language Models such as GPT-4V and objective metrics like ROUGE to explicitly assess visual consistency and spatial alignment accuracy.
Nevertheless, the findings collectively highlight that multimodal fusion with LLM-based generation can transform presentation recordings into semantically enriched materials, offering practical potential for intelligent educational review systems.
6. Conclusions
This study presented a multimodal slide annotation system that automatically generates coherent and contextually aligned annotations from recorded presentation videos by integrating hybrid slide segmentation, speech-to-text transcription, and LLM-based annotation generation. Experimental results demonstrated high segmentation accuracy (macro-average , , 95% ), precise annotation alignment (90.0% accuracy), and reliable annotation coherence validated by both human and automated evaluation. User evaluations further revealed high satisfaction, with an average SUS score of 80.5 (, 95% CI ), confirming the system’s feasibility for enhancing the review process by transforming recorded presentations into interactive and semantically enriched PowerPoint materials. While improvements in text normalization and runtime efficiency remain, this work establishes a foundation for scalable, semantically coherent documentation of presentation content. Future research will focus on integrating audio-based segmentation cues to handle dynamic visual scenarios and extending the system’s capabilities to support multilingual annotation generation.
Author Contributions
Conceptualization, A.L.H. and N.F.; methodology, A.L.H. and N.F.; software, A.L.H.; visualization, A.L.H., K.C.B. and E.D.F.; investigation, A.L.H., E.D.F. and S.S.; writing—original, A.L.H.; writing—review and editing, N.F., K.C.B., S.S. and H.H.S.K.; supervision, N.F. All authors have read and agreed to the published version of the manuscript.
Funding
This research received no external funding.
Institutional Review Board Statement
Ethical review and approval were waived for this study due to non-invasive, voluntary participation and anonymized data collection.
Informed Consent Statement
Informed consent was obtained from all subjects involved in the study.
Data Availability Statement
Data are contained within the article.
Acknowledgments
We would like to thank all the colleagues in the Distributing System Laboratory at Okayama University and DTMK at Politeknik Elektronika Negeri Surabaya who were involved in this study.
Conflicts of Interest
The authors declare no conflicts of interest.
Appendix A
To ensure reproducibility, this study provide the full system prompt used for the Keyword Extraction module below. In this template, variables enclosed in braces such as {text} are dynamically replaced by the system during runtime.
| Listing A1. System prompt for Keyword Extraction using gemma3:4b Q4_K_M quantization. |
 |
Appendix C
Table A1.
The verbatim structured rubric used by both human evaluators and the LLM-as-Judge to assess annotation coherence (1–5 Likert Scale).
Table A1.
The verbatim structured rubric used by both human evaluators and the LLM-as-Judge to assess annotation coherence (1–5 Likert Scale).
| Criterion | Scoring Definition |
|---|
| Factual Consistency | 1: Major hallucinations; contradicts source material.
2: Significant inaccuracies; misinterprets key facts.
3: Mostly accurate but contains minor errors or unverified claims.
4: Accurate with negligible discrepancies.
5: Fully supported by slide text and narration; factually precise. |
| Coverage of Key Ideas | 1: Misses the main point entirely; irrelevant.
2: Captures only peripheral details; misses core concepts.
3: Captures the general topic but omits important nuances.
4: Covers most key ideas with slight omissions.
5: Comprehensive summary; captures all critical information. |
| Specificity | 1: Vague, generic, or repetitive (e.g., “The slide discusses data”).
2: Minimal detail; relies on high-level generalizations.
3: Moderately specific but lacks concrete examples.
4: Specific and detailed; clearly references slide elements.
5: Highly specific; contains distinct, relevant, and precise details. |
| Linguistic Clarity | 1: Disjointed, incoherent, or grammatically incorrect.
2: Hard to read; frequent phrasing errors.
3: Understandable but awkward phrasing or minor typos.
4: Fluent and clear; minor stylistic issues.
5: Natural, fluent, and professional phrasing; error-free. |
References
- Adhikari Egodawele, M.H.; Sedera, D.; Bui, V. A Systematic Review of Digital Transformation Literature (2013–2021) and the development of an overarching a-priori model to guide future research. In Proceedings of the Australasian Conference on Information Systems (ACIS) 2022 Proceedings, Melbourne, Australia, 4–7 December 2022. [Google Scholar]
- Bennett, A.A.; Campion, E.D.; Keeler, K.R.; Keener, S.K. Videoconference fatigue? Exploring changes in fatigue after videoconference meetings during COVID-19. J. Appl. Psychol. 2021, 106, 330. [Google Scholar]
- Taş, M.; Kiraz, A. A model for the acceptance and use of online meeting tools. Systems 2023, 11, 558. [Google Scholar] [CrossRef] [Scilit]
- Fabriz, S.; Mendzheritskaya, J.; Stehle, S. Impact of synchronous and asynchronous settings of online teaching and learning in higher education on students’ learning experience during COVID-19. Front. Psychol. 2021, 12, 733554. [Google Scholar] [CrossRef] [Scilit] [PubMed]
- Lo, N.P.K.; Wong, A.M.H. Reimagining teaching and learning in higher education in the post-COVID-19 era: The use of recorded lessons from teachers’ perspectives. In Proceedings of the Critical Reflections on ICT and Education: Selected Papers from the HKAECT 2023 International Conference, Hong Kong, China, 15–17 June 2023; Springer: Singapore, 2023; pp. 215–230. [Google Scholar]
- Lee, H.; Liu, M.; Scriney, M.; Smeaton, A.F. Usage-Based Summaries of Learning Videos. In Proceedings of the European Conference on Technology Enhanced Learning, Online, 20–24 September 2021; Springer: Berlin/Heidelberg, Germany, 2021; pp. 414–418. [Google Scholar]
- Navarrete, E.; Nehring, A.; Schanze, S.; Ewerth, R.; Hoppe, A. A closer look into recent video-based learning research: A comprehensive review of video characteristics, tools, technologies, and learning effectiveness. Int. J. Artif. Intell. Educ. 2025, 35, 1631–1694. [Google Scholar] [CrossRef] [Scilit]
- Kryściński, W.; Keskar, N.S.; McCann, B.; Xiong, C.; Socher, R. Neural text summarization: A critical evaluation. arXiv 2019, arXiv:1908.08960. [Google Scholar] [CrossRef] [Scilit]
- Hall, M.; Kirby, R.M.; Li, F.; Meyer, M.; Pascucci, V.; Phillips, J.M.; Ricci, R.; Van der Merwe, J.; Venkatasubramanian, S. Rethinking abstractions for big data: Why, where, how, and what. arXiv 2013, arXiv:1306.3295. [Google Scholar] [CrossRef] [Scilit]
- Haz, A.L.; Funabiki, N.; Fajrianti, E.D.; Sukaridhoto, S. A Study of Summarization and Keyword Extraction Function in Meeting Note Generation System from Voice Records. In Proceedings of the 2023 12th International Conference on Networks, Communication and Computing, Osaka, Japan, 15–17 December 2023; pp. 106–112. [Google Scholar]
- Mayer, R.E. The Cambridge Handbook of Multimedia Learning; Cambridge University Press: Cambridge, UK, 2005. [Google Scholar]
- Saborío-Taylor, S.; Rojas-Ramírez, F. Universal Design for Learning and Artificial Intelligence in the Digital Era: Fostering Inclusion and Autonomous Learning. Int. J. Prof. Dev. Learn. Learn. 2024, 6, ep2408. [Google Scholar] [CrossRef] [Scilit] [PubMed]
- Carrillo, C.; Flores, M.A. COVID-19 and teacher education: A literature review of online teaching and learning practices. Eur. J. Teach. Educ. 2020, 43, 466–487. [Google Scholar] [CrossRef] [Scilit]
- Bewersdorff, A.; Nerdel, C.; Zhai, X. How AI literacy correlates with affective, behavioral, cognitive and contextual variables: A systematic review. Comput. Educ. Artif. Intell. 2025, 9, 100493. [Google Scholar] [CrossRef] [Scilit]
- Wang, J.; Kwok, R.Y.K.; Ngai, E.C. Towards Key Point Identification (KPI) for Lecture Videos: Approaches and Performance Evaluation. ACM Trans. Multimed. Comput. Commun. Appl. 2025, 21, 1–23. [Google Scholar]
- Nankani, H.; Mahrishi, M.; Morwal, S.; Hiran, K.K. A formal study of shot boundary detection approaches—Comparative analysis. In Soft Computing: Theories and Applications: Proceedings of SoCTA 2020; Springer: Berlin/Heidelberg, Germany, 2021; Volume 1, pp. 311–320. [Google Scholar]
- Jose, J.T.; Rajkumar, S.; Ghalib, M.R.; Shankar, A.; Sharma, P.; Khosravi, M.R. Efficient shot boundary detection with multiple visual representations. Mob. Inf. Syst. 2022, 2022, 4195905. [Google Scholar] [CrossRef] [Scilit]
- Sindel, A.; Hernandez, A.; Yang, S.H.; Christlein, V.; Maier, A. SliTraNet: Automatic Detection of Slide Transitions in Lecture Videos using Convolutional Neural Networks. arXiv 2022, arXiv:2202.03540. [Google Scholar]
- Yuan, Y.; Zhang, J. Shot boundary detection using color clustering and attention mechanism. ACM Trans. Multimed. Comput. Commun. Appl. 2023, 19, 1–23. [Google Scholar] [CrossRef] [Scilit]
- Che, X.; Yang, H.; Meinel, C. Lecture video segmentation by automatically analyzing the synchronized slides. In Proceedings of the 21st ACM international Conference on Multimedia, Barcelona, Spain, 21–25 October 2013; pp. 345–348. [Google Scholar]
- LeFevre, G.; Hosier, J.; Zhou, Y.; Gurbani, V.K. LLM Selection: Improving ASR Transcript Quality via Zero-Shot Prompting. In Proceedings of the SoutheastCon 2025, Concord, NC, USA, 27–30 March 2025; IEEE: Piscataway, NJ, USA, 2025; pp. 1440–1445. [Google Scholar]
- Sapena, O.; Onaindia, E. Multimodal classification of teaching activities from University lecture recordings. Appl. Sci. 2022, 12, 4785. [Google Scholar] [CrossRef] [Scilit]
- Radford, A.; Kim, J.W.; Xu, T.; Brockman, G.; McLeavey, C.; Sutskever, I. Robust speech recognition via large-scale weak supervision. In Proceedings of the International Conference on Machine Learning, Honolulu, HI, USA, 23–29 July 2023; pp. 28492–28518. [Google Scholar]
- Chen, Y.; Li, K.; Bao, W.; Patel, D.; Kong, Y.; Min, M.R.; Metaxas, D.N. Learning to Localize Actions in Instructional Videos with LLM-Based Multi-Pathway Text-Video Alignment. In Proceedings of the European Conference on Computer Vision, Milan, Italy, 29 September–4 October 2024; Springer: Berlin/Heidelberg, Germany, 2024; pp. 193–210. [Google Scholar]
- Giarelis, N.; Mastrokostas, C.; Karacapilidis, N. Abstractive vs. extractive summarization: An experimental review. Appl. Sci. 2023, 13, 7620. [Google Scholar] [CrossRef] [Scilit]
- Pahune, S.; Akhtar, Z. Transitioning from MLOps to LLMOps: Navigating the unique challenges of large language models. Information 2025, 16, 87. [Google Scholar] [CrossRef] [Scilit]
- List, A.; Lin, C.J. Content and quantity of highlights and annotations predict learning from multiple digital texts. Comput. Educ. 2023, 199, 104791. [Google Scholar] [CrossRef] [Scilit]
- Mezzetti, D. Annotateai. 2024. Available online: https://github.com/neuml/annotateai (accessed on 18 December 2025).
- Haz, A.L.; Panduman, Y.Y.F.; Funabiki, N.; Fajrianti, E.D.; Sukaridhoto, S. Fully Open-Source Meeting Minutes Generation Tool. Future Internet 2024, 16, 429. [Google Scholar] [CrossRef] [Scilit]
- Gonzalez, H.; Li, J.; Jin, H.; Ren, J.; Zhang, H.; Akinyele, A.; Wang, A.; Miltsakaki, E.; Baker, R.; Callison-Burch, C. Automatically Generated Summaries of Video Lectures May Enhance Students’ Learning Experience. In Proceedings of the 18th Workshop on Innovative Use of NLP for Building Educational Applications (BEA 2023), Toronto, ON, Canada, 13 July 2023. [Google Scholar]
- Warner, J.; Pavel, A.; Nguyen, T.; Agrawala, M.; Hartmann, B. Slidespecs: Automatic and interactive presentation feedback collation. In Proceedings of the 28th International Conference on Intelligent User Interfaces, Sydney, Australia, 27–31 March 2023; pp. 695–709. [Google Scholar]
- Li, Z.; Wang, Z.; Wang, W.; Hung, K.; Xie, H.; Wang, F.L. Retrieval-augmented generation for educational application: A systematic survey. Comput. Educ. Artif. Intell. 2025, 8, 100417. [Google Scholar] [CrossRef] [Scilit]
- Baltrušaitis, T.; Ahuja, C.; Morency, L.P. Multimodal machine learning: A survey and taxonomy. IEEE Trans. Pattern Anal. Mach. Intell. 2018, 41, 423–443. [Google Scholar] [CrossRef] [Scilit] [PubMed]
- Küchemann, S.; Avila, K.E.; Dinc, Y.; Hortmann, C.; Revenga, N.; Ruf, V.; Stausberg, N.; Steinert, S.; Fischer, F.; Fischer, M.; et al. On opportunities and challenges of large multimodal foundation models in education. npj Sci. Learn. 2025, 10, 11. [Google Scholar] [CrossRef] [Scilit]
- Singh, D.; Gupta, A.; Jawahar, C.; Tapaswi, M. Unsupervised audio-visual lecture segmentation. In Proceedings of the IEEE/CVF Winter Conference on Applications of Computer Vision, Waikoloa, HI, USA, 3–7 January 2023; pp. 5232–5241. [Google Scholar]
- Lee, D.W.; Ahuja, C.; Liang, P.P.; Natu, S.; Morency, L.P. Lecture presentations multimodal dataset: Towards understanding multimodality in educational videos. In Proceedings of the IEEE/CVF International Conference on Computer Vision, Paris, France, 2–6 October 2023; pp. 20087–20098. [Google Scholar]
- Wright, B.; Guruvayur, V.; Napolitano, L.; Ozar, D.; Rivera, A.; Sai, A.; Tafesse, B. Using Digital Textbook and Classroom Data to Explore Multimodal (Audio, Visual, & Textual) LLM Retrieval Techniques. In Proceedings of the iTextbooks 2025: Sixth Workshop on Intelligent Textbooks, Palermo, Italy, 26 July 2025. [Google Scholar]
- Li, Z.; Li, C.; Zhang, M.; Mei, Q.; Bendersky, M. Retrieval augmented generation or long-context llms? A comprehensive study and hybrid approach. arXiv 2024, arXiv:2407.16833. [Google Scholar] [CrossRef] [Scilit]
- An, S.; Ma, Z.; Lin, Z.; Zheng, N.; Lou, J.G. Make Your LLM Fully Utilize the Context. arXiv 2024, arXiv:2404.16811. [Google Scholar] [CrossRef] [Scilit]
- Kasneci, E.; Sessler, K.; Küchemann, S.; Bannert, M.; Dementieva, D.; Fischer, F.; Gasser, U.; Groh, G.; Günnemann, S.; Hüllermeier, E.; et al. ChatGPT for good? On opportunities and challenges of large language models for education. Learn. Individ. Differ. 2023, 103, 102274. [Google Scholar] [CrossRef] [Scilit]
- Grassini, S. Shaping the Future of Education: Exploring the Potential and Consequences of AI and ChatGPT. Educ. Sci. 2023, 13, 692. [Google Scholar] [CrossRef] [Scilit]
- Haz, A.L.; Fajrianti, E.D.; Funabiki, N.; Sukaridhoto, S. A Study of Audio-to-Text Conversion Software Using Whispers Model. In Proceedings of the 2023 Sixth International Conference on Vocational Education and Electrical Engineering (ICVEE), Surabaya, Indonesia, 14–15 October 2023; IEEE: Piscataway, NJ, USA, 2023; pp. 268–273. [Google Scholar]
- Liu, Y.; Zheng, Z.; Zhang, F.; Feng, J.; Fu, Y.; Zhai, J.; He, B.; Zhang, X.; Du, X. A comprehensive taxonomy of prompt engineering techniques for large language models. Front. Comput. Sci. 2025, 20, 2003601. [Google Scholar] [CrossRef] [Scilit]
- White, J.; Fu, Q.; Hays, S.; Sandborn, M.; Olea, C.; Gilbert, H.; Elnashar, A.; Spencer-Smith, J.; Schmidt, D.C. A prompt pattern catalog to enhance prompt engineering with chatgpt. arXiv 2023, arXiv:2302.11382. [Google Scholar] [CrossRef] [Scilit]
- Bai, X.; Wu, X.; Stojkovic, I.; Tsioutsiouliklis, K. Leveraging large language models for improving keyphrase generation for contextual targeting. In Proceedings of the 33rd ACM International Conference on Information and Knowledge Management, Boise, ID, USA, 21–25 October 2024; pp. 4349–4357. [Google Scholar]
- Francis, S.A.; Sangeetha, M. A comparison study on optical character recognition models in mathematical equations and in any language. Results Control Optim. 2025, 18, 100532. [Google Scholar] [CrossRef] [Scilit]
- Alroobaea, R.; Mayhew, P.J. How many participants are really enough for usability studies? In Proceedings of the 2014 Science and Information Conference, London, UK, 27–29 August 2014; IEEE: Piscataway, NJ, USA, 2014; pp. 48–56. [Google Scholar]
- Otegi, A.; San Vicente, I.; Saralegi, X.; Peñas, A.; Lozano, B.; Agirre, E. Information retrieval and question answering: A case study on COVID-19 scientific literature. Knowl.-Based Syst. 2022, 240, 108072. [Google Scholar]
- Shimada, A.; Okubo, F.; Yin, C.; Ogata, H. Automatic summarization of lecture slides for enhanced student previewtechnical report and user study. IEEE Trans. Learn. Technol. 2017, 11, 165–178. [Google Scholar] [CrossRef] [Scilit]
- Nauta, M.; Trienes, J.; Pathak, S.; Nguyen, E.; Peters, M.; Schmitt, Y.; Schlötterer, J.; Van Keulen, M.; Seifert, C. From anecdotal evidence to quantitative evaluation methods: A systematic review on evaluating explainable ai. ACM Comput. Surv. 2023, 55, 1–42. [Google Scholar] [CrossRef] [Scilit]
- Hearst, M.A. Text tiling: Segmenting text into multi-paragraph subtopic passages. Comput. Linguist. 1997, 23, 33–64. [Google Scholar]
- Ghazimatin, A.; Garmash, E.; Penha, G.; Sheets, K.; Achenbach, M.; Semerci, O.; Galvez, R.; Tannenberg, M.; Mantravadi, S.; Narayanan, D.; et al. PODTILE: Facilitating podcast episode browsing with auto-generated chapters. In Proceedings of the 33rd ACM International Conference on Information and Knowledge Management, Boise, ID, USA, 21–25 October 2024; pp. 4487–4495. [Google Scholar]
- Castellano, B. PySceneDetect: Python-Based Scene Detection Program. 2025. Available online: https://github.com/Breakthrough/PySceneDetect (accessed on 26 January 2026).
- Zheng, L.; Chiang, W.L.; Sheng, Y.; Zhuang, S.; Wu, Z.; Zhuang, Y.; Lin, Z.; Li, Z.; Li, D.; Xing, E.; et al. Judging llm-as-a-judge with mt-bench and chatbot arena. Adv. Neural Inf. Process. Syst. 2023, 36, 46595–46623. [Google Scholar]
- Aydin, O.; Karaarslan, E.; Erenay, F.S.; Bacanin, N. Generative AI in Academic Writing: A Comparison of DeepSeek, Qwen, ChatGPT, Gemini, Llama, Mistral, and Gemma. arXiv 2025, arXiv:2503.04765. [Google Scholar]
- Bavaresco, A.; Bernardi, R.; Bertolazzi, L.; Elliott, D.; Fernández, R.; Gatt, A.; Ghaleb, E.; Giulianelli, M.; Hanna, M.; Koller, A.; et al. Llms instead of human judges? A large scale empirical study across 20 nlp evaluation tasks. arXiv 2024, arXiv:2406.18403. [Google Scholar] [CrossRef] [Scilit]
- Brooke, J. SUS—A Quick and Dirty Usability Scale. Usability Eval. Ind. 1996, 189, 4–7. [Google Scholar]
- Bangor, A.; Kortum, P.; Miller, J. Determining what individual SUS scores mean: Adding an adjective rating scale. J. Usability Stud. 2009, 4, 114–123. [Google Scholar]
- Mayer, R.E. Multimedia learning. In Psychology of Learning and Motivation; Elsevier: Amsterdam, The Netherlands, 2002; Volume 41, pp. 85–139. [Google Scholar]
Figure 1.
System overview of the Slide Annotation System with a numbered workflow. Best viewed in color and at full size for clarity.
Figure 1.
System overview of the Slide Annotation System with a numbered workflow. Best viewed in color and at full size for clarity.
Figure 2.
User-defined ROI drawn around the slide number (bottom-right), used as the reference area for hybrid slide-change detection.
Figure 2.
User-defined ROI drawn around the slide number (bottom-right), used as the reference area for hybrid slide-change detection.
Figure 3.
Few-shot prompt structure illustrating the inputs, role assignment, and weighted scoring mechanism for keyword extraction. Light grey box is input & output, white box is process.
Figure 3.
Few-shot prompt structure illustrating the inputs, role assignment, and weighted scoring mechanism for keyword extraction. Light grey box is input & output, white box is process.
Figure 4.
Illustration of OCR and clustering results. (a) Original image. (b) Raw word-level bounding boxes detected by the OCR engine. (c) Coherent text blocks formed by grouping the raw bounding boxes using DBSCAN based on vertical proximity.
Figure 4.
Illustration of OCR and clustering results. (a) Original image. (b) Raw word-level bounding boxes detected by the OCR engine. (c) Coherent text blocks formed by grouping the raw bounding boxes using DBSCAN based on vertical proximity.
Figure 5.
Hierarchical LLM Prompting Architecture for structured information extraction.
Figure 5.
Hierarchical LLM Prompting Architecture for structured information extraction.
Figure 6.
Flow Diagram of the Multi-Stage Annotation Alignment Process. Grey box is input & output, white box is process.
Figure 6.
Flow Diagram of the Multi-Stage Annotation Alignment Process. Grey box is input & output, white box is process.
Figure 7.
Sample annotated output demonstrating the integration of annotation inside the PowerPoint.
Figure 7.
Sample annotated output demonstrating the integration of annotation inside the PowerPoint.
Figure 8.
Experimental procedure distinguishing the training phase (upload demonstration) from the controlled task phase.
Figure 8.
Experimental procedure distinguishing the training phase (upload demonstration) from the controlled task phase.
Figure 9.
Summary statistics of the recorded videos and corresponding presentation documents. (a) Distribution of the number of OCR-extracted text tokens per slide. (b) Distribution of spoken words per slide derived from the audio transcript. (c) Duration of each slide segment (in seconds) after video segmentation. (d) Speaking rate measured as words per minute for each slide segment.
Figure 9.
Summary statistics of the recorded videos and corresponding presentation documents. (a) Distribution of the number of OCR-extracted text tokens per slide. (b) Distribution of spoken words per slide derived from the audio transcript. (c) Duration of each slide segment (in seconds) after video segmentation. (d) Speaking rate measured as words per minute for each slide segment.
Figure 10.
Visual comparison of slide segmentation outputs on a sample presentation video. Variations in box colors and formats denote individual segmented sub-clips.
Figure 10.
Visual comparison of slide segmentation outputs on a sample presentation video. Variations in box colors and formats denote individual segmented sub-clips.
Figure 11.
Structured setup for the LLM-as-Judge evaluation of generated annotations.
Figure 11.
Structured setup for the LLM-as-Judge evaluation of generated annotations.
Figure 12.
Summary of presenter ratings on the validity and usefulness of embedded annotations.
Figure 12.
Summary of presenter ratings on the validity and usefulness of embedded annotations.
Figure 13.
Task performance comparison between Computer Science (CS) and Multimedia Broadcasting (MB) student groups across four review task categories. (a) Success rates (%) by task category and participant group (CS vs. MB). (b) Boxplots of completion times (s) for successful task completions. In each boxplot, the middle white line indicates the median, the box represents the interquartile range (IQR), and the whiskers extend to the minimum and maximum values.
Figure 13.
Task performance comparison between Computer Science (CS) and Multimedia Broadcasting (MB) student groups across four review task categories. (a) Success rates (%) by task category and participant group (CS vs. MB). (b) Boxplots of completion times (s) for successful task completions. In each boxplot, the middle white line indicates the median, the box represents the interquartile range (IQR), and the whiskers extend to the minimum and maximum values.
Figure 14.
Distribution of System Usability Scale (SUS) scores reported by participants, illustrating overall usability ratings and individual variability.
Figure 14.
Distribution of System Usability Scale (SUS) scores reported by participants, illustrating overall usability ratings and individual variability.
Table 1.
Mapping of evaluation tasks and example activities.
Table 1.
Mapping of evaluation tasks and example activities.
| Task | Purpose | Example Activity |
|---|
| Information retrieval | Evaluate how efficiently participants locate key content. | Locate the slide where the main contribution is introduced. |
| Summarization | Evaluate how well annotations convey content quality and coherence. | Summarize the main contributions of the work in 2–3 sentences. |
| Cross-checking | Evaluate consistency between narration and slide text. | Check whether the accuracy value mentioned in the narration matches the value on the slide. |
| Slide browsing | Evaluate ease of browsing and contextual orientation. | Identify the slide that introduces background concepts and report its title. |
Table 2.
Debouncing Window Selection with 95% Confidence Intervals ().
Table 2.
Debouncing Window Selection with 95% Confidence Intervals ().
| Window | FP Count | FPR (95% CI) | Trade-Off |
|---|
| 1 frame | 47 | 4.7% [3.5, 6.2] | Too sensitive, triggers on noise |
| 2 frames | 4 | 0.4% [0.2, 1.0] | Still some false alarms |
| 3 frames | 0 | 0.0% [0.0, 0.4] | Optimal Balance (100 ms) |
| 4 frames | 0 | 0.0% [0.0, 0.4] | Slower (133 ms) with no benefit |
| 5 frames | 0 | 0.0% [0.0, 0.4] | Much slower, may miss transitions |
Table 3.
SSIM Threshold Selection with 95% Confidence Intervals.
Table 3.
SSIM Threshold Selection with 95% Confidence Intervals.
| TPR (95% CI) | FPR (95% CI) | F1 Score (95% CI) | Trade-Off |
|---|
| 0.75 | 100.0% [98.5, 100] | 3.1% [2.0, 4.4] | 0.95 [0.94, 0.96] | Too loose |
| 0.80 | 99.6% [97.8, 99.9] | 0.4% [0.1, 1.1] | 0.99 [0.98, 1.00] | Some FP |
| 0.85 | 99.6% [97.8, 99.9] | 0.0% [0.0, 0.5] | 1.00 [0.99, 1.00] | Optimal |
| 0.90 | 98.0% [95.4, 99.1] | 0.0% [0.0, 0.5] | 0.99 [0.98, 1.00] | Misses some |
| 0.95 | 84.8% [79.8, 88.7] | 0.0% [0.0, 0.5] | 0.92 [0.89, 0.94] | Misses many |
Table 4.
Segmentation accuracy comparison across all 5 videos (Mean ± SD).
Table 4.
Segmentation accuracy comparison across all 5 videos (Mean ± SD).
| Method | Precision | Recall | Score | Avg. Time (mm:ss) |
|---|
| Uniform Segmentation | 0.182 ± 0.002 | 0.167 ± 0.002 | 0.174 ± 0.008 | 00:07 ± 00:01 |
| Text Tiling | 0.062 ± 0.001 | 0.030 ± 0.001 | 0.041 ± 0.001 | 00:04 ± 00:01 |
| SSIM | 0.913 ± 0.016 | 0.875 ± 0.017 | 0.892 ± 0.047 | 03:52 ± 01:50 |
| Histogram | 0.079 ± 0.002 | 0.807 ± 0.002 | 0.144 ± 0.003 | 04:50 ± 02:15 |
| PySceneDetect v0.6.7 | 0.806 ± 0.009 | 0.691 ± 0.009 | 0.743 ± 0.013 | 00:58 ± 00:28 |
| Proposed (1 s) | 0.971 ± 0.009 | 0.938 ± 0.008 | 0.955 ± 0.023 | 06:34 ± 03:15 |
| Proposed (3 s) | 0.900 ± 0.011 | 0.860 ± 0.011 | 0.879 ± 0.024 | 01:49 ± 00:54 |
| Ground Truth (GT) | 1.000 | 1.000 | 1.000 | – |
Table 5.
Ablation study evaluating system robustness on the Obscured Dataset. Comparison of the OCR-only baseline vs. the proposed Hybrid Two-Stage detector. Mean ± SD.
Table 5.
Ablation study evaluating system robustness on the Obscured Dataset. Comparison of the OCR-only baseline vs. the proposed Hybrid Two-Stage detector. Mean ± SD.
| Method | Precision | Recall | Score | Status |
|---|
| OCR-Only Baseline | 0.000 | 0.000 | 0.000 | Failed |
| Hybrid Two-Stage (Proposed) | 0.865 ± 0.010 | 0.907 ± 0.011 | 0.885 ± 0.011 | Functional |
Table 6.
Annotation coherence reliability analysis on 30 samples. Metrics include categorical agreement (Weighted Cohen’s ) and rank correlation (Spearman’s ) with 95% CI.
Table 6.
Annotation coherence reliability analysis on 30 samples. Metrics include categorical agreement (Weighted Cohen’s ) and rank correlation (Spearman’s ) with 95% CI.
| Comparison Pair | Avg. Score Diff. | Cohen’s (95% CI) | Spearman’s (95% CI) |
|---|
| Human 1 vs. Human 2 | 0.12 | 0.655 | 0.745 |
| LLM vs. Human Consensus | 0.16 | 0.705 | 0.836 |
Table 7.
Ablation study of Annotation Alignment Accuracy ( slides, stratified across dense text, figures, and formulas). Accuracy is reported with 95% CI.
Table 7.
Ablation study of Annotation Alignment Accuracy ( slides, stratified across dense text, figures, and formulas). Accuracy is reported with 95% CI.
| Configuration | Accuracy (95% CI) | Key Observation |
|---|
| Cosine-Only Baseline | 53.3% | Low confidence on dense academic slides. |
| Hybrid Score (w/o Re-rank) | 76.7% | Recovered 7 failures via numeric/spatial cues. |
| Full Pipeline (Proposed) | 90.0% [74.4, 96.5] | Resolved final semantic ambiguities. |
Table 8.
End-to-end pipeline runtime breakdown averaged across videos. Data are reported as Mean ± SD.
Table 8.
End-to-end pipeline runtime breakdown averaged across videos. Data are reported as Mean ± SD.
| Pipeline Stage | Duration (Mean ± SD) |
|---|
| 1. Video Segmentation | 1 min 49 s ± 25 s |
| 2. Automatic Speech Recognition (ASR) | 1 min 35 s ± 25 s |
| 3. Keyword Extraction (LLM) | 1 min 15 s ± 18 s |
| 4. Slide Content Extraction (OCR) | 5 s ± 2 s |
| 5. Annotation Generation (LLM) | 1 min 18 s ± 20 s |
| 6. Annotation Alignment | 1 min 07 s ± 15 s |
| 7. Slide Reconstruction | 4 s ± 1 s |
| Total End-to-End Runtime | 7 min 13 s ± 1 min 38 s |
Table 9.
Comparison of Task Completion Times (Efficiency). Statistical differences were assessed via independent t-tests. Effect sizes (Cohen’s d) indicate practical significance.
Table 9.
Comparison of Task Completion Times (Efficiency). Statistical differences were assessed via independent t-tests. Effect sizes (Cohen’s d) indicate practical significance.
| Task Category | CS Group (s) | MB Group (s) | t-Stat | Sig. (p) | Cohen’s d |
|---|
| Slide Browsing | 130.7 ± 21.4 | 106.6 ± 18.2 | | <0.001 | 1.23 (Large) |
| Summarization | 160.7 ± 25.3 | 136.0 ± 22.1 | | 0.004 | 1.05 (Large) |
| Cross-Checking | 139.0 ± 19.8 | 155.5 ± 24.2 | | 0.038 | 0.73 (Med) |
| Info. Retrieval | 111.6 ± 28.5 | 101.0 ± 30.1 | | | 0.36 (Small) |
Table 10.
Open-ended feedback prompts after SUS questionnaire.
Table 10.
Open-ended feedback prompts after SUS questionnaire.
| Category | Question |
|---|
| Strengths | What aspects of the system did you find most useful or effective? |
| Limitations | What aspects of the system did you find confusing, frustrating, or difficult to use? |
| Suggestions | If you could improve one thing about the system, what would it be? |
| Overall impression | How would you describe your overall experience with the system in one or two sentences? |
Table 11.
Qualitative feature comparison between the proposed system and existing video analysis paradigms.
Table 11.
Qualitative feature comparison between the proposed system and existing video analysis paradigms.
| Feature Capability | Meeting Assistants
(Otter.ai, Zoom) | Video Indexing
(Panopto) | Proposed
System |
|---|
| Input Modality | Audio Only | Audio + Visual | Audio + Visual |
| Transcription (ASR) | ✓ | ✓ | ✓ |
| Generative Summarization | ✓ (Global) | × | ✓ (Slide-Level) |
| Slide Text Extraction (OCR) | × | ✓ | ✓ |
| Visual Alignment | × | × | ✓ |
| Disclaimer/Publisher’s Note: The statements, opinions and data contained in all publications are solely those of the individual author(s) and contributor(s) and not of MDPI and/or the editor(s). MDPI and/or the editor(s) disclaim responsibility for any injury to people or property resulting from any ideas, methods, instructions or products referred to in the content. |




 ,
,