Abstract
Accurate and real-time classification of low-latency Internet traffic is critical for applications such as video conferencing, online gaming, financial trading, and autonomous systems, where millisecond-level delays can degrade user experience. Existing methods for low-latency traffic classification, reliant on raw temporal features or static statistical analyses, fail to capture dynamic frequency patterns inherent to real-time applications. These limitations hinder accurate resource allocation in heterogeneous networks. This paper proposes a novel framework integrating wavelet transform (WT) and artificial neural networks (ANNs) to address this gap. Unlike prior works, we systematically apply WT to commonly used temporal features—such as throughput, slope, ratio, and moving averages—transforming them into frequency-domain representations. This approach reveals hidden multi-scale patterns in low-latency traffic, akin to structured noise in signal processing, which traditional time-domain analyses often overlook. These wavelet-enhanced features train a multilayer perceptron (MLP) ANN, enabling dual-domain (time–frequency) analysis. We evaluate our approach on a dataset comprising FTP, video streaming, and low-latency traffic, including mixed scenarios with up to four concurrent traffic types. Experiments demonstrate 99.56% accuracy in distinguishing low-latency traffic (e.g., video conferencing) from FTP and streaming, outperforming k-NN, CNNs, and LSTMs. Notably, our method eliminates reliance on deep packet inspection (DPI), offering ISPs a privacy-preserving and scalable solution for prioritizing time-sensitive traffic. In mixed-traffic scenarios, the model achieves 74.2–92.8% accuracy, offering ISPs a scalable solution for prioritizing time-sensitive traffic without deep packet inspection. By bridging signal processing and deep learning, this work advances efficient bandwidth allocation and enables Internet Service Providers to prioritize time-sensitive flows without deep packet inspection, improving quality of service in heterogeneous network environments.
1. Introduction
The digital age has brought a tremendous demand for high-speed Internet services, fueling the search for efficient traffic management and optimization strategies. One critical branch of this effort is the accurate identification and classification of low-latency Internet traffic. Low-latency networking demands end-to-end delays below 100 ms for real-time applications (e.g., video conferencing and online gaming), and below 10 ms for mission-critical systems like autonomous vehicles or financial trading [1,2,3]. For instance, video conferencing suffers from “freezing” and audio–video de-synchronization with delays >150 ms, degrading user experience. Online gaming requires <50 ms latency to prevent gameplay disadvantage (e.g., delayed reactions in competitive matches). Financial trading platforms (e.g., algorithmic trading) incur revenue losses with delays >1 ms due to missed arbitrage opportunities. Autonomous systems (e.g., vehicle-to-vehicle communication) risk collisions if control signals exceed 10 ms thresholds. Accurate classification of such traffic is foundational for QoS-aware resource allocation, where millisecond-level delays directly impact safety, revenue, and user satisfaction.
Traditional approaches to latency management rely on real-time monitoring [4], statistical analysis [5], and Quality-of-Service (QoS) metrics [6]. Streaming platforms like Netflix and YouTube, for instance, dynamically adjust video quality by monitoring bandwidth and allocating resources to minimize buffering [7]. However, these methods often lack the granularity to distinguish low-latency traffic’s unique characteristics, which resemble Gaussian noise due to consistent bidirectional micro-packet exchanges. This “noise-like” pattern, when analyzed through signal processing techniques such as wavelet transforms, reveals high-frequency components indicative of rapid packet dynamics [8].
Wavelet transforms (WTs) are particularly suited for decomposing traffic signals into time–frequency domains, enabling the isolation of transient features like throughput fluctuations, slope variations, and moving averages. These temporal metrics, when combined with bidirectional ratios, provide a multi-scale perspective essential for differentiating low-latency traffic from bulk data transfers. Building on this, our methodology integrates artificial neural networks (ANNs) with wavelet-transformed features to enhance classification accuracy. By exposing high-frequency patterns often obscured in raw time-series data, the model captures both temporal dynamics and spectral signatures inherent to low-latency flows.
This hybrid approach addresses a critical challenge: distinguishing structured low-latency “noise” from background network “signal” with precision. Unlike conventional noise reduction techniques in signal processing [9,10], our framework leverages ANNs to adaptively learn traffic patterns, ensuring robust classification even in dynamic network environments. The result is a system capable of near real-time prioritization, crucial for applications demanding instantaneous responsiveness.
In the forthcoming sections of this article, we will explore our methodology in a comprehensive way, dive into the details of data collection, present our experimental findings, and engage in thoughtful discussions. The goal is to vividly demonstrate the effectiveness of our approach in classifying and identifying low-latency traffic.
2. Related Work
The rapid growth of high-speed Internet services has driven a surge in demand for efficient traffic management and optimization strategies as highlighted in the Cisco report [11]. With increasing reliance on real-time applications such as online gaming, video conferencing, and financial trading, the ability to accurately classify low-latency Internet traffic has become a critical research challenge [12,13,14]. However, existing classification methods often struggle with the dynamic and bursty nature of low-latency traffic, necessitating novel approaches that move beyond traditional techniques.
Early traffic classification methods relied on port-based heuristics, deep packet inspection (DPI), and statistical analysis [15,16,17,18]. While these approaches provided initial insights into network traffic behavior, they suffer from severe limitations in modern networks. Port-based methods are increasingly unreliable due to dynamic port allocations and encryption techniques that obscure traffic signatures [19]. DPI, while highly accurate, raises significant privacy concerns and requires high computational overhead, making it impractical for large-scale deployments [20]. Statistical approaches, though lightweight, often fail when dealing with encrypted traffic, which now dominates Internet communications [21].
To address these shortcomings, machine learning (ML) and deep learning (DL) models have gained traction in traffic classification research. ANNs, in particular, have demonstrated remarkable success in recognizing complex traffic patterns [22,23]. They have been applied to traffic classification, anomaly detection, and predictive modeling, offering adaptability to evolving network conditions [24,25,26]. However, a major challenge with ANN-based methods is their reliance on time-domain traffic features, which often fail to capture the high-frequency fluctuations characteristic of low-latency traffic. As a result, standard ANNs struggle to differentiate between low-latency and non-low-latency traffic in complex network environments.
To enhance feature extraction and improve classification accuracy, researchers have turned to signal-processing techniques such as wavelet transform (WT). Wavelet analysis has been widely used in time-series data processing, particularly in network traffic prediction [27], anomaly detection [28], and QoS monitoring [29]. Unlike traditional statistical methods, wavelets decompose network traffic into multiple frequency scales, allowing for a more granular representation of the underlying patterns. This capability is particularly useful for low-latency traffic, which exhibits noise-like fluctuations that are difficult to detect in the time domain alone [30].
Beyond wavelet transformations, recent advancements in Internet traffic classification have focused on trend-based features that enhance model interpretability. Studies have introduced fine-grained statistical features such as moving averages, throughput patterns, and slope-based metrics, which have led to significant improvements in classification accuracy [4,18,31]. Additionally, feature selection techniques—such as multifractal analysis and PCA-based selection—have been applied to refine classification models, further improving performance and robustness [30,32]. Despite these advances, most studies still rely solely on time-domain features, which limits their ability to fully exploit the high-frequency patterns unique to low-latency traffic.
Parallel to ML-based solutions, researchers have also explored alternative traffic classification approaches to improve scalability and real-time adaptability. Incremental Support Vector Machines (SVMs) have been developed to handle dynamic traffic patterns, allowing for adaptive classification in real-world networks [33]. Other work has explored hardware-accelerated classification techniques, such as FPGA-based decision trees, which enable high-speed traffic analysis with minimal computational overhead [34]. Bio-inspired methods, such as artificial immune system algorithms, have also shown promise in optimizing classification models [35], while multi-stage classifiers have been proposed for handling encrypted and obfuscated traffic types [36,37,38]. While these approaches offer unique advantages, they still fall short in achieving the high-precision classification of low-latency traffic, particularly in mixed-traffic scenarios.
In recent years, deep learning-based traffic classification has gained prominence, with CNN-based models such as Deep Packet [39] and LSTM-based solutions like FlowPic [40] achieving state-of-the-art results. These models leverage large-scale datasets, including those introduced by Draper-Gil et al. [41] and Lashkari et al. [42], which contain a mix of VPN, Tor, and unencrypted traffic. However, these solutions primarily focus on categorizing general Internet traffic and are not specifically optimized for low-latency classification. Furthermore, their reliance on end-to-end deep learning architectures often sacrifices interpretability, making them less suitable for real-time network management applications.
A detailed analysis of the key approaches in Table 1 reveals distinct strengths and limitations. ANN-based methods [20,23,24] achieve high accuracy (97–99.08%) for encrypted traffic but rely exclusively on time-domain features, limiting their ability to capture high-frequency patterns in low-latency applications. The multilayer perceptron in [20] demonstrates scalability but requires full flow captures. DPI techniques [21] offer computational efficiency through Aho-Corasick pattern matching but fundamentally require payload inspection, rendering them ineffective for encrypted traffic and privacy-sensitive environments. Hybrid ML methods [27] incorporate wavelet kernels (GA-WK-ELM) for improved feature extraction but depend on evolutionary optimization that introduces significant computational overhead, hindering real-time deployment. CNN architectures [39,40] attain state-of-the-art accuracy (up to 99.7%) through spatial feature learning but operate as black-box models with limited interpretability. FlowPic’s [40] image-based representation enables efficient classification but discards temporal sequencing crucial for latency-sensitive traffic.

Table 1.
Comparison of Internet traffic solutions.
As summarized in Table 1, recent studies achieved high accuracy (97–99.7%) in classifying encrypted/VPN traffic using ANNs, CNNs, and time-domain features (e.g., [20,40]). Despite promising results in prior studies, existing traffic classification methods generally fall short in one or more of the following ways:
- They rely on full payload data, which is inaccessible in encrypted traffic;
- They require complete flow captures, making them unsuitable for real-time use;
- They do not specifically target low-latency traffic, which has distinct statistical and temporal patterns.
Also, datasets like ISCX and Darknet2020 (column “Dataset”) support general application layer classification, and they lack benchmarks for dynamic, mixed low-latency scenarios. Existing methods struggle to differentiate low-latency traffic due to its bursty nature and overdependence on time-domain features. Although wavelet transforms excel in anomaly detection and QoS analysis, their integration with deep learning for traffic classification remains underexplored. Furthermore, ANN-based approaches (column “Algorithms”) lack hybrid mechanisms to unify temporal and spectral representations. This paper addresses these gaps by proposing a novel hybrid ANN–Wavelet framework that synergizes time-domain statistical features with wavelet-decomposed frequency components, enhancing low-latency classification. The following sections detail our methodology, experiments, and results validating this approach.
3. Methodology
In this section, we detail the methodology for the identification of low-latency Internet traffic. Our approach combines ANN with the application of wavelet transform to create a powerful system for distinguishing a unique form of ’noise’ from the ’signal’ of network with precision and consistency. The proposed framework, illustrated in Figure 1, integrates three core components to enable accurate low-latency traffic classification:
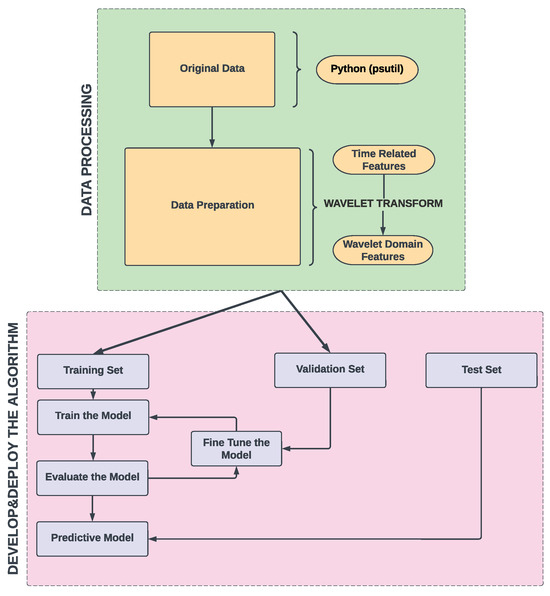
Figure 1.
System architecture.
- Temporal Feature Extraction: This stage extracts time-domain metrics from raw network traffic, including throughput (total data volume per interval), slope (rate of packet change over time), downlink-to-uplink ratio (asymmetry in traffic direction), and moving averages (smoothed trends of throughput). These features capture dynamic traffic behavior, such as burstiness and periodicity, which are critical for distinguishing low-latency traffic (e.g., rapid bidirectional packet exchanges in video conferencing) from bulk transfers (e.g., FTP). Equations (2)–(6) formalize these metrics.
- Wavelet Transform (Frequency-Domain Enhancement): The temporal features are processed using a continuous wavelet transform (CWT) with a Ricker (Mexican hat) wavelet kernel. The CWT decomposes each feature into multi-scale frequency components, isolating high-frequency patterns (e.g., microbursts in low-latency traffic) and low-frequency trends (e.g., steady streaming flows). This stage transforms raw time-series data into wavelet coefficients, effectively separating structured “noise” (low-latency traffic) from the broader network “signal”.
- ANN Classifier (Dual-Domain Analysis): An MLP artificial neural network receives concatenated time-domain and wavelet-transformed features as input. The MLP comprises an input layer (temporal + wavelet features), two hidden layers with ReLU activation for nonlinear pattern recognition, and a softmax output layer for probabilistic classification.
3.1. Data Collection
The data collection process was performed on a local Wi-Fi network to allow full control over the traffic generation and capture environment. This setup enabled the intentional creation of mixed traffic scenarios, including combinations of FTP, video streaming, and low-latency applications, which are not available in existing public datasets. Such controlled data collection was essential to simulate realistic network conditions and evaluate the proposed classification model’s robustness in dynamic and heterogeneous environments.
3.2. Introducing Continuous Wavelet Transform (CWT) with Ricker Wavelet
As mentioned in the previous sections, low-latency traffic shares some statistical properties with Gaussian noise, which provides a strong foundation for applying wavelet transform techniques. In this context, it becomes important to understand the complex nature of data flows within networks. Figure 2a shows the patterns of low-latency Internet traffic throughput of video conferencing and (b) Gaussian noise. The similarity observed in these patterns offers valuable insights, suggesting that low-latency traffic may exhibit noise-like characteristics. In signal processing, noise is conventionally perceived as unpredictable fluctuations or disturbances that can obscure crucial signal information [43]. In contrast, low-latency traffic exhibits a form of organized ’noise’, a controlled and structured flow of data characterized by the frequent exchanges of small packets [4]. To further support this observation, Figure 3 presents the Probability Distribution Functions (PDFs) of both the low-latency traffic (b) and Gaussian noise (a). PDF analysis demonstrates that, when normalized, both signals share similar statistical properties, such as a classic bell-shaped curve, maximum density, and tails of the distribution. These similarities reinforce the idea that low-latency traffic can be modeled using the signal-processing techniques traditionally applied to noise in signal systems, such as wavelet transforms. This parallel draws attention to the fact that, while the nature of this data exchange might appear as noise to a casual observer, it is actually a deliberate and integral component within the network environment [44].
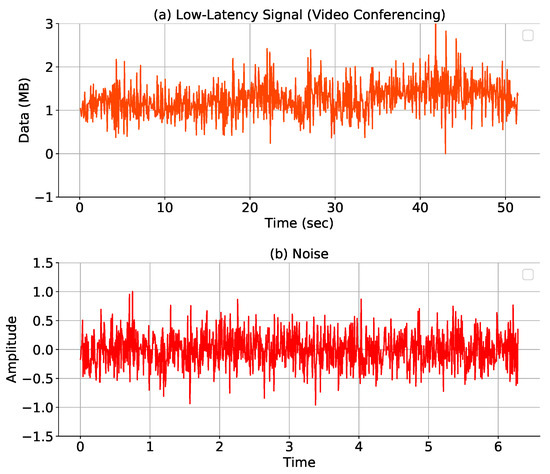
Figure 2.
Parallel patterns: (a) low-latency traffic and (b) Gaussian noise.
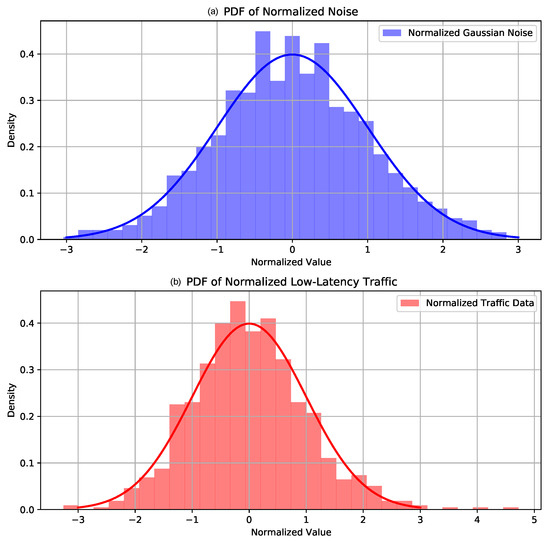
Figure 3.
Parallel distributions: (a) Gaussian noise and (b) low-latency traffic.
Obtaining representations in the frequency domain is crucial for several reasons. The frequency domain provides a different perspective on the data, highlighting patterns and characteristics that may not be apparent in the time domain. This is particularly valuable for analyzing non-stationary signals, where the signal properties change over time. Thus, all the extracted time-related features are processed using the continuous wavelet transform (CWT). The CWT is a powerful mathematical technique employed to analyze non-stationary signals in both the time and frequency domains. Unlike other transforms such as the Fourier Transform, the CWT decomposes a signal into various frequency components over time, enabling the capture of localized features and time-varying characteristics. This ability to capture fine-scale variations and changes in a signal makes the CWT particularly well suited for analyzing dynamic and irregular signals. Low-latency Internet traffic exhibits time properties similar to these signals, making CWT an effective tool for its classification. To better capture both short-term and long-term variations in Internet traffic, we apply wavelet transforms to key temporal features. This transformation provides a frequency-domain representation, exposing structured patterns in network traffic that traditional time-domain features fail to reveal. Figure 4 illustrates how core temporal features (e.g., throughput, slope, moving averages, and ratio) are mapped into their corresponding wavelet representations, which serve as enhanced inputs for the ANN model.
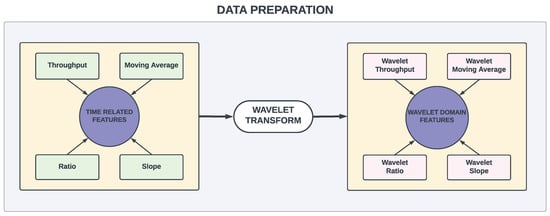
Figure 4.
Features from time domain to wavelet domain.
The Ricker wavelet, shown in Equation (1), also known as the Mexican hat wavelet due to its resemblance to the cross-sectional profile of a Mexican hat, is a commonly used wavelet in time–frequency analysis. Unlike wavelets optimized for smooth or periodic signals (e.g., Daubechies and Morlet), the Ricker wavelet’s sharp localization in both time and frequency domains enables the precise identification of transient patterns in low-latency traffic, akin to structured noise. This aligns with our observation that low-latency traffic exhibits noise-like statistical properties. Its mathematical definition is as follows:
where t is the time variable, f is the central frequency of the wavelet, and is the width parameter that determines the scale of the wavelet.
The Ricker wavelet was selected based on its established success in prior works for transient signal detection (e.g., [8,9]). Its second-derivative Gaussian shape is particularly effective at isolating high-frequency microbursts in network traffic, which align with the rapid packet exchanges characteristic of low-latency applications.
The application of a wavelet transform enhances the feature representation by decomposing time-related features into distinct frequency components. This transformation allows the model to identify patterns in different frequency bands, enabling it to capture both short-term and long-term variations in network behavior. This capability is vital for accurate and robust classification of low-latency Internet traffic, which often exhibits complex, multi-scale patterns due to the nature of real-time applications.
Furthermore, low-latency traffic such as video conferencing or online gaming generates frequent, small data throughput bursts that may appear as noise in conventional time-domain analysis. However, by applying wavelet transform, we can isolate and emphasize these throughput bursts, which are characteristic of low-latency traffic, thus distinguishing them from other traffic types such as FTP or video streaming, which have different temporal dynamics. For instance, the wavelet transform helps to separate high-frequency components corresponding to the rapid exchanges in low-latency traffic from the slower, more consistent patterns seen in bulk data transfers. Figure 5 and Figure 6 illustrate this transformation for throughput and the ratio of sent to received packets, respectively, highlighting the distinct frequency components that the wavelet transform extracts from the raw time-domain features.
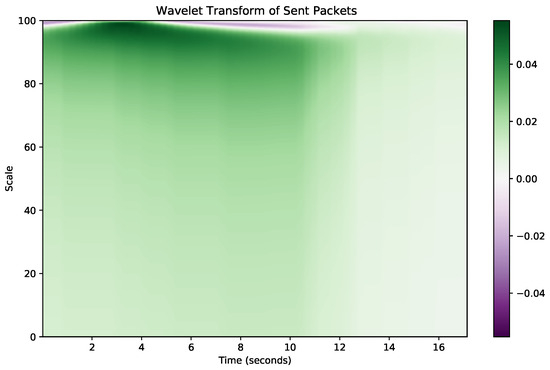
Figure 5.
Throughput in wavelet domain.
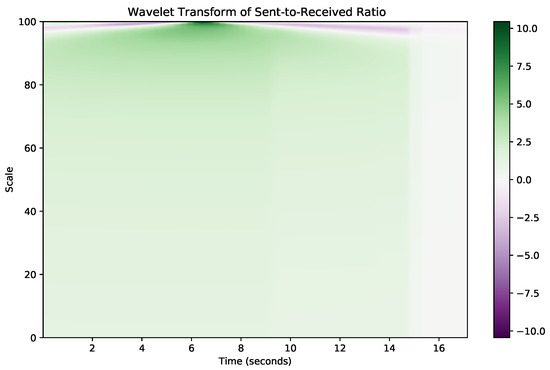
Figure 6.
Ratio in wavelet domain.
Using these enhanced feature representations, our ANN model becomes more adept at recognizing the unique patterns associated with low-latency traffic. This addresses the core challenge in traffic classification, where the goal is to accurately identify and prioritize time-sensitive data flows among a diverse mix of network activities.
3.3. Data Preparation
After collecting the raw data related to sent and received packets, a series of preprocessing steps were applied to extract novel time-domain features. These preprocessing steps were designed to improve the dataset with meaningful features that could be used for effective classification. The following time domain features were derived for each network traffic.
3.3.1. Throughput
This feature represents the total volume of data (in bytes) captured within specific time intervals during the measurement. The collected data includes the volume of individual sent and received traffic aggregated over these intervals. The features are denoted by for the total volume of sent traffic and for the total volume of received traffic within the interval. Here, i represents the index of the time interval. Thus, for each traffic, the feature ’Throughput’ captures the volume of the sent and received data, providing valuable information about the data traffic patterns over time. In Figure 7, the throughput of YouTube traffic in the downlink and uplink is demonstrated.
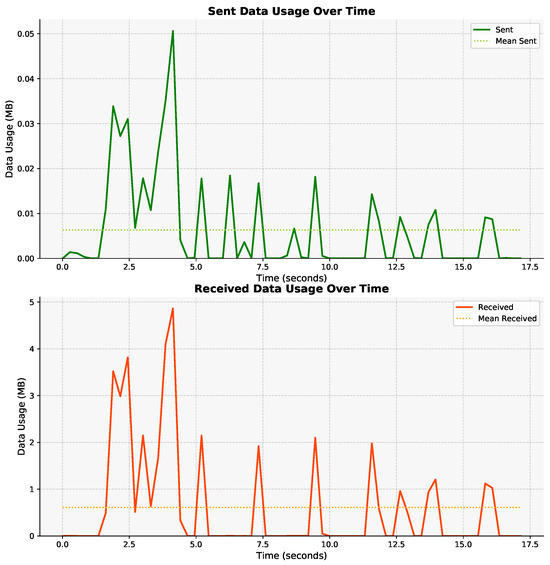
Figure 7.
Throughput of YouTube traffic.
3.3.2. Moving Averages
This feature calculates the moving average of throughput in time, which can provide insight into the application’s traffic patterns. The moving averages of throughput in uplink and downlink are denoted by and , respectively, and computed using Equations (2) and (3):
where k represents the moving average period (window size), i denotes the current time index, and represents the throughput at that time j.
The moving average of throughput allows the model to consider the dynamic behavior of network traffic over time. By incorporating this feature, the model can detect variations in data flow rates and adapt its classification decisions based on temporal patterns, which is crucial for identifying intermittent low-latency conditions. In Figure 8, the MA of YouTube traffic is demonstrated.
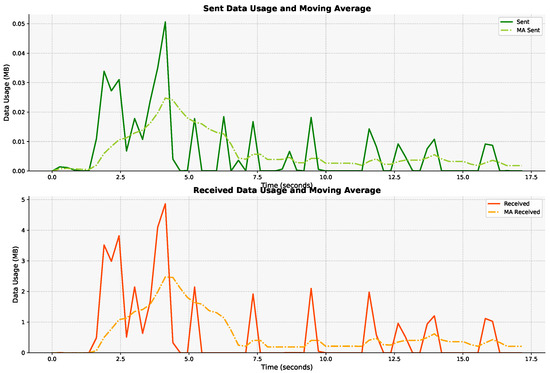
Figure 8.
Moving average of YouTube traffic.
3.3.3. Ratio
This feature measures the downlink to uplink throughput values over time. The ratio, denoted by R, is calculated as shown in Equation (4):
where i denotes the current time index, represents the downlink throughput, and represents the uplink throughput at time i.
The ratio quantifies the asymmetry between the sent and received throughput, revealing the unidirectional or bidirectional nature of each application. This characteristic helps the model distinguish between scenarios where byte transfer is required for both uplink and downlink communication and those where it is essential only for specific directions. In Figure 9, the received to sent throughput ratio of YouTube traffic is demonstrated.
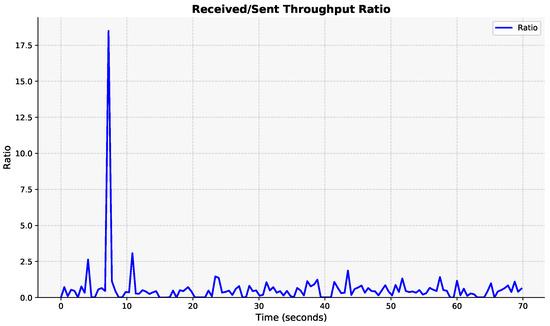
Figure 9.
Downlink/uplink throughput ratio.
3.3.4. Slope
The slope feature represents the rate of change in packet throughput over time and captures the dynamic behavior of traffic flow. It is mathematically defined as the first derivative of throughput, reflecting how rapidly the data volume increases or decreases between successive time intervals. This rate of change is particularly significant for distinguishing between traffic types with different temporal characteristics: In low-latency traffic (e.g., video conferencing), the slope shows more gradual or consistent trends, reflecting larger but steadier data flows. In bulk transfers or streaming (e.g., FTP or YouTube), the slope often exhibits frequent, sharp fluctuations due to small but rapid bidirectional packet exchanges.
By including the slope, the model becomes more sensitive to temporal transitions in traffic behavior, allowing it to detect subtle bursts or dips in data transmission. When combined with wavelet transform, the slope’s frequency-domain representation helps highlight transient events that are characteristic of real-time traffic, thus improving classification accuracy. Slope is represented by for sent packets and for received packets, defined in Equations (5) and (6):
where represents the number of sent packets at time i, and is the corresponding time stamp.
Positive slope values indicate an increasing trend in byte activity, whereas negative slope values indicate a decrease. This feature is particularly useful for identifying traffic types characterized by distinctive patterns over time, such as video streaming. Video streaming traffic, for example, often shows a consistent and predictable pattern of data transmission due to buffering and playback mechanisms. A representation of it can be seen in Figure 10. In addition, this characterization of trends offers crucial discriminatory information for the classification of various classes of low-latency Internet traffic.
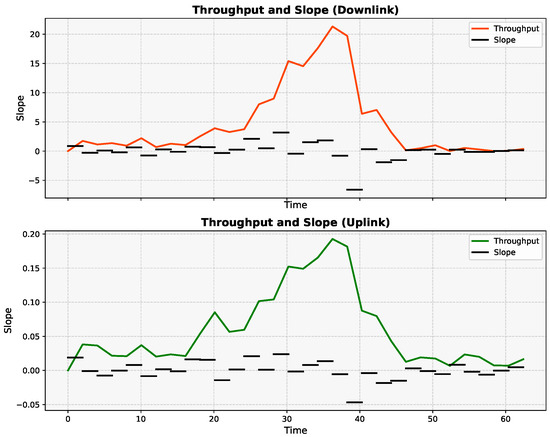
Figure 10.
Slope of throughput for downlink and uplink traffic.
3.4. Artificial Neural Network
The objective of incorporating an MLP in our framework is to take advantage of its powerful pattern recognition capabilities [45] to accurately classify low-latency Internet traffic. In our approach, the MLP serves as the core component of the artificial neural network model, which is essential to analyze the complex temporal dynamics present in the network traffic data. Using MLP, our aim is to effectively distinguish between various types of Internet traffic, ensuring high accuracy in identifying low-latency traffic patterns. The multilayer perceptron belongs to a category of feed-forward artificial neural networks as depicted in Figure 11. It typically comprises three or more layers. The initial layer is designated for receiving input data. Subsequent hidden layers, one or more in number, are responsible for extracting relevant features from the input data. The final layer produces a classification result. Each hidden layer, such as the layer, is constructed with multiple neurons primarily utilizing a nonlinear activation function as described in Equation (7) below:
where denotes an activation function, for example, . A key attribute of the activation function is its ability to provide a smooth transition as input values change. represents a weight matrix, and is a bias vector. It is possible to have multiple hidden layers, and each layer performs the same function but with distinct weight matrices and bias vectors. The final layer produces the output based on the results of the last hidden layer, often denoted as layer j and defined in Equation (8):
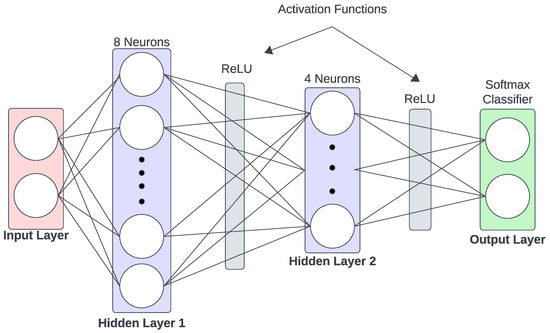
Figure 11.
Overview of the MLP-based ANN classifier.
The deep learning model employed in this study is a feedforward neural network with three layers demonstrated in Figure 11: an input layer, two hidden layers, and an output layer. The architecture is mathematically defined as follows. Equation (9) represents the model’s input vector, composed of all feature types. The operations in Equations (10)–(15) define the transformations in the first and second hidden layers and the final softmax output layer.
- Input Layer: The input layer consists of N neurons, where N represents the number of features in the dataset. These features include throughput T, moving averages , downlink-to-uplink ratio R, slope S and wavelet transformed counterparts of them . The input vector X is represented aswhere represents the value of the feature i.
- First Hidden Layer: The first hidden layer has neurons, where in this implementation. Each neuron applies the Rectified Linear Unit (ReLU) activation function to its weighted sum of inputs. Mathematically, for each neuron j in the first hidden layer,where represents the weight of the connection between is the bias term for neuron j.
- Second Hidden Layer: The second hidden layer consists of neurons, where in this configuration. Similar to the first hidden layer, each neuron applies the ReLU activation function to its weighted sum of inputs. Mathematically, for each neuron k in the first hidden layer,where represents the weight of the connection between is the bias term for neuron j.
- Output Layer: The output layer comprises C neurons, where C is the different number of traffic classes in the dataset. It uses the softmax activation function to produce class probabilities. The softmax function calculates the probability of each class i, given the input features. Mathematically, for each class i in the output layer,The class with the highest probability is selected as the predicted class. This architecture enables multi-class classification, making it suitable for low-latency network traffic identification.
4. Experiment Setup
Due to the simplicity and efficiency of our design, our experiments were performed on a standard Windows 10 PC with an Intel Core i7 processor running at 3.20 GHz and 16 GB of RAM. This configuration was sufficient for the execution and training of the artificial neural network model without the need for additional computational resources, such as GPU acceleration. Furthermore, we used TensorFlow [46], a versatile and powerful machine learning framework, which further facilitated the efficient implementation and training of our model.
4.1. Dataset
The data collection process was performed on a local Wi-Fi network, and the set of traffic traces comprised FTP, video streaming, low-latency and mix of these. The traces were collected over a 50 Mbps Internet connection, and the throughput measurements of the active traffic in both directions were recorded and stored. In total, over 350,000 samples of throughput values (more than 35 h of applications usage) were collected.
For the experiments, we designed two types of scenario: basic and complex. The basic scenarios, detailed in Table 2, involved pairwise combinations of traffic types, while the complex scenarios, described in Table 3, involved three or more types of traffic co-existing simultaneously. Each scenario was meticulously selected to ensure a comprehensive evaluation of our model’s performance under various real-world traffic conditions.The selection of such traffic mixes is similar to the approach used in the Low Latency DOCSIS study, which also employed a mix of different traffic types to evaluate latency performance and network behavior under varying conditions [47].
Table 2.
Basic traffic scenarios.
Table 3.
Complex traffic scenarios.
In the basic scenarios where (Table 2), we tested combinations such as the following:
- FTP + Video Streaming (A + B);
- FTP + Low-Latency (A + C);
- Video Streaming + Low-Latency (B + C);
- Repeated instances of the same traffic type (A + A, B + B, C + C).
For the complex scenarios (Table 3), we included combinations such as the following:
- Three instances of the same traffic type (3A, 3B, 3C);
- Two instances of one type combined with one instance of another (2A + B, A + 2B, 2A + C, A + 2C, 2B + C, B + 2C);
- One instance of each traffic type (A + B + C);
- One instance of each traffic type (A + B + C);
- Multiple instances of mixed traffic types (2A + B + C, A + 2B + C, A + B + 2C).
This comprehensive scenario design enabled a robust analysis of low-latency Internet traffic, ensuring the reliability and accuracy of our classification methodology.
4.2. Evaluation Metrics
Similar to [39], we measure the model’s performance using key metrics, including accuracy, precision, recall, and the F1 score, to assess the effectiveness of traffic classification. Accuracy, denoted as A, serves as an indicator of the model’s performance, reflecting the proportion of correctly classified instances out of the total samples, and is computed following Equation (16). However, it is essential to understand that high accuracy alone may not provide a complete picture, especially in scenarios with imbalanced datasets. We evaluate model performance using accuracy, precision, recall, and the F1 score as defined in Equations (16)–(19).
Precision and recall offer deeper insights into the model’s performance on different classes of traffic. Precision, which measures the ratio of true positive predictions to the total predicted positives, is particularly crucial in assessing the model’s reliability in identifying low-latency traffic without false alarms. In contrast, recall, which calculates the ratio of true positive predictions to all actual positives, highlights the model’s ability to capture all relevant instances of low-latency traffic. The mathematical representations of these metrics are as follows:
The score, as a harmonic mean of precision and recall, provides a balanced metric that is especially useful when dealing with imbalanced classes. In the context of our study, where accurate identification of low-latency traffic is critical, the F1 score serves as a robust measure of the model’s overall effectiveness and is defined as
By focusing on these metrics, we can better understand the strengths and weaknesses of our classification model. For instance, while accuracy gives us a broad view, precision and recall help us delve into specific aspects of model performance that are crucial for practical applications, such as minimizing false positives in low-latency traffic detection. This comprehensive evaluation ensures that our model is not only accurate but also reliable and efficient in real-world scenarios.
4.3. Hyperparameter Tuning
In pursuit of optimizing the performance and robustness of our ANN model, a systematic hyperparameter tuning process was conducted. Table 4 summarizes the hyperparameters and the selected values based on experimental evaluation. Below, we explain the role and selection rationale for each parameter.
Table 4.
Hyperparameter tuning for ANN model.
- Number of Hidden Layers: Determines the depth of the neural network. We tested configurations ranging from shallow (1 layer) to deeper networks (up to 5 layers). A 2-layer model offered a good balance between learning complexity and computational efficiency.
- Activation Function: Controls the nonlinear transformations applied at each neuron. We compared sigmoid, tanh, and ReLU. ReLU was selected for its faster convergence and ability to mitigate vanishing gradient issues in deep networks.
- Learning Rate: Dictates how quickly the model updates its weights during training. We tested values of 0.1, 0.01, and 0.001. A learning rate of 0.001 provided stable convergence without overshooting minima.
- Batch Size: Specifies the number of training samples used in one iteration of model updates. We tested 16, 32, 64, and 128. A batch size of 32 provided a good trade-off between computational cost and convergence speed.
- Number of Epochs: Refers to the number of times the entire training dataset is passed through the model. We evaluated ranges from 10 to 150. We selected 100 epochs as the model showed consistent convergence without signs of overfitting.
- Optimizer: Defines the algorithm used to adjust model weights. We chose Adam for its adaptive learning rate and proven effectiveness in deep learning tasks.
- Dropout Rate: A regularization parameter that randomly deactivates a fraction of neurons during training to prevent overfitting. We tested rates from 0 to 0.5. A dropout rate of 0 was ultimately selected, as the model did not exhibit overfitting during training.
Although detailed ablation results are beyond the scope of this paper, these values align with best practices in deep learning [48,49] and were selected based on grid search and empirical performance.
5. Experimental Results and Analysis
The experiments were meticulously planned to assess the efficacy of our work by contrasting it with state-of-the-art classification methods. To ensure that our evaluation is appropriate for the problem of low-latency Internet traffic classification, we designed our experiments with the following considerations:
- Diverse Traffic Types: We included a variety of traffic types such as FTP, video streaming, and low-latency traffic. This selection ensures that our model is tested against different patterns of Internet traffic, reflecting real-world scenarios.
- Balanced Dataset: The dataset used for training and testing the classification algorithm was designed to maintain a balanced representation of each traffic type, with approximately one hour’s worth of sampling per category. This balance is critical for avoiding bias in the model’s performance.
- Comparison with Established Methods: Our approach was compared with state-of-the-art classification methods, including k-NN, CNN, and LSTM-based models, as highlighted in various studies [4,39,40,50,51]. This comparison not only validates the robustness of our model but also situates our results within the context of existing research.
- Evaluation Metrics: We measured the model’s performance using key metrics such as accuracy, precision, recall, and the F1 score. These metrics are standard in the field of traffic classification and provide a comprehensive assessment of the model’s effectiveness.
- Confusion Matrix Analysis: The use of confusion matrices allowed us to visualize the classification performance across different traffic types, providing insights into the strengths and weaknesses of our model.
- Mixed Traffic Scenarios: We evaluated our model under both simple and complex traffic scenarios to understand its performance in real-world conditions where multiple types of traffic coexist. This evaluation is crucial for demonstrating the practical applicability of our approach.
Our initial experiments focused on evaluating the classification performance in mixed traffic scenarios involving different types of Internet traffic, such as File Transfer Protocol (FTP), video streaming, and low-latency traffic. These scenarios were selected based on a section of the [47] and our own experiences. These scenarios reflect real-world conditions where multiple types of traffic coexist, providing a comprehensive test of the model’s ability to accurately identify the traffic types. We designed a series of basic traffic scenarios to assess the model’s accuracy. As shown in Table 5, these scenarios consisted of different combinations of two or more traffic types, with special attention to the presence of low-latency traffic. The results demonstrated that the model achieved higher accuracy when low-latency traffic was involved, with the highest accuracy of 96.5% in the scenario where both instances were low-latency traffic. In scenarios without low-latency traffic, the accuracy was slightly lower, such as 88.3% in the case of two FTP instances.
Table 5.
Basic traffic scenarios with accuracy.
In addition to the basic traffic scenarios, we designed a set of complex traffic scenarios to further evaluate the model’s performance in more challenging environments where three or more types of traffic coexist. These scenarios provide insight into how the model performs as the traffic patterns become more intricate and diverse. Table 6 presents the results of these experiments, showing the classification accuracy both with and without the application of wavelet transform (WT). The wavelet transform was employed to enhance feature extraction, particularly in the presence of low-latency traffic, which often exhibits patterns similar to noise in signal processing. The addition of wavelet transform consistently improved classification accuracy across all scenarios. For example, in Scenario 3C, where all traffic types were low-latency, the model achieved an accuracy of 93.2% with wavelet transform, compared to 88.2% without it. Similarly, in Scenario 6 (2A + C), where the traffic was composed of two instances of FTP and one instance of low-latency traffic, accuracy improved from 76.5% to 83.2% with the application of wavelet transform. As complexity increased, such as in scenarios with four types of traffic (e.g., Scenario 13: A + B + 2C), the model’s performance remained strong but showed a slight decline, with an accuracy of 79.2% with wavelet transform. This decline reflects the increasing difficulty in distinguishing between different traffic types as the mix becomes more complex.
Table 6.
Complex traffic scenarios with accuracy.
Figure 12 and Figure 13 further visualize the model’s performance. The confusion matrix (Figure 12) displays the accuracy of the model in classifying low-latency traffic across the complex traffic scenarios. The diagonal dominance shows a strong correlation between predicted and actual classifications, with the model performing particularly well in distinguishing between low-latency and non-low-latency traffic. Scenarios where low-latency traffic was present (e.g., Scenario 3C) showed high classification accuracy. Furthermore, Figure 13 illustrates the accuracy improvement brought about by applying the wavelet transform in each scenario. The plot clearly shows a consistent increase in accuracy when wavelet transform is applied, particularly in scenarios with low-latency traffic, highlighting the robustness of our model under complex conditions. Also, Figure 14 provides a visual representation of the accuracy improvement across various scenarios. The improvement is evident, particularly in scenarios involving low-latency traffic, where the wavelet transform significantly enhances classification performance.
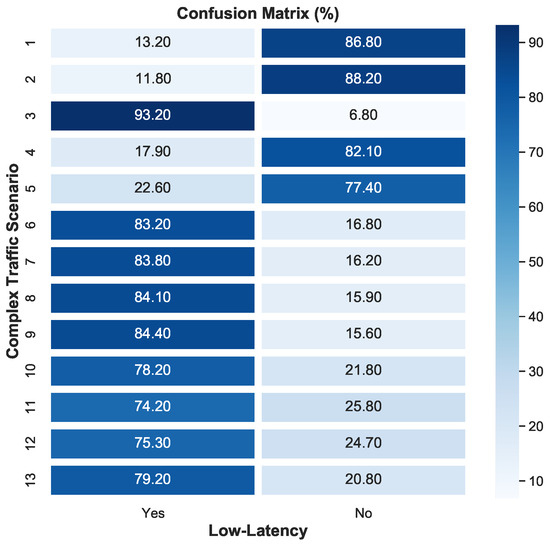
Figure 12.
Confusion matrix of complex scenarios.
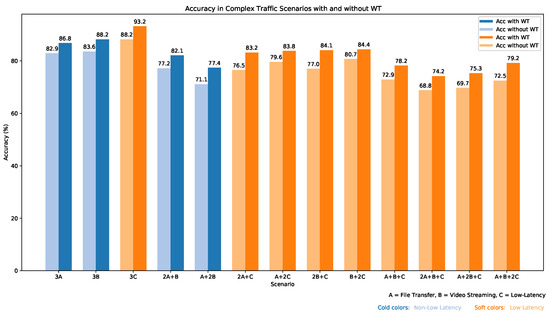
Figure 13.
Impact of wavelet transform on classification accuracy in complex traffic scenarios.
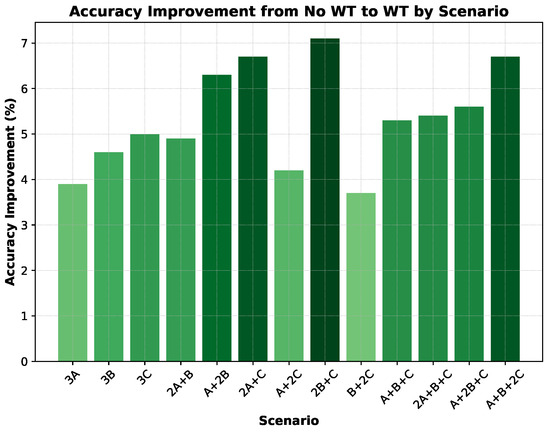
Figure 14.
Impact of wavelet transform on classification accuracy.
In the next experiment, our aim was to classify three distinct types of Internet traffic: FTP, video streaming, and low-latency traffic. The dataset used for training the classification algorithm was designed to maintain a balanced representation of each traffic type, with approximately one hour’s worth of sampling per category. The decision to utilize 14,400 samples for each traffic type was deliberate. This sampling frequency, equivalent to an average of four samples per second over the course of an hour, allowed for a comprehensive representation of the behavior of each traffic category. Table 7 presents the exact sample sizes for each traffic type, confirming the careful selection of our dataset, ensuring a balanced representation essential for robust model training and validation.
Table 7.
Traffic types and exact sample sizes.
The deliberate selection of FTP, video streaming, and low-latency traffic was made to encompass a diverse representation of common Internet activities while maintaining a focused scope for the experiment. The accuracy results for our classification model are illustrated in Figure 15, further supporting the exceptional performance with rates of 99.2% for FTP traffic, 99.3% for video streaming, and 99.4% for low-latency types, validating the effectiveness of our approach in accurately classifying these primary Internet traffic types. Figure 15 presents the confusion matrix, visualizing the performance evaluation of the classification of the proposed models among different types of traffic.
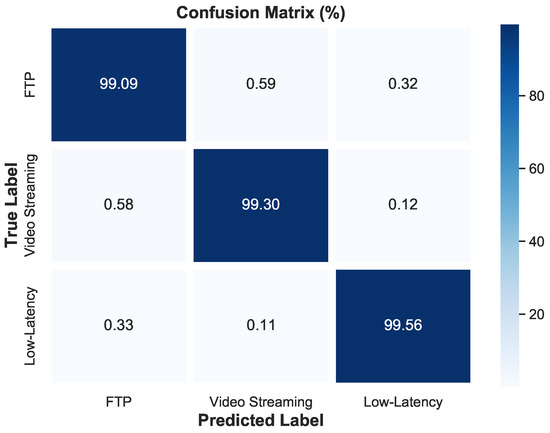
Figure 15.
Confusion matrix of the model.
The ROC curve, Figure 16, illustrates the model’s performance in terms of true positive rates and false positive rates for each traffic type. The Area Under the Curve (AUC) values show that the model achieved excellent classification performance across all three classes, with AUC values of 0.99 for FTP, and 0.95 for both video streaming and low-latency traffic.
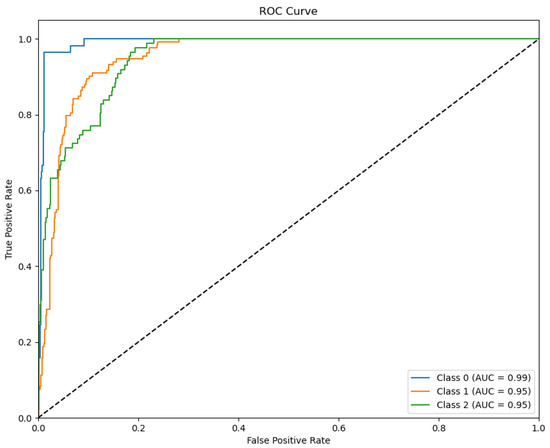
Figure 16.
ROC curve.
In the following, Figure 17 and Table 8 demonstrate the benefit of incorporating wavelet transform into the model, we compared its performance against a standard scaling method (SS) across all traffic types. As can be seen, the application of the wavelet transform provided a significant improvement, particularly for low-latency traffic classification, where the accuracy increased by approximately 6% compared to using standard scaling methods alone. This improvement was also notable for FTP and video streaming, where the accuracy increased from 93.41% to 99.09% and from 92.76% to 99.30%, respectively. This demonstrates the wavelet transform’s effectiveness in enhancing feature extraction and improving overall classification performance, particularly in scenarios involving low-latency traffic.
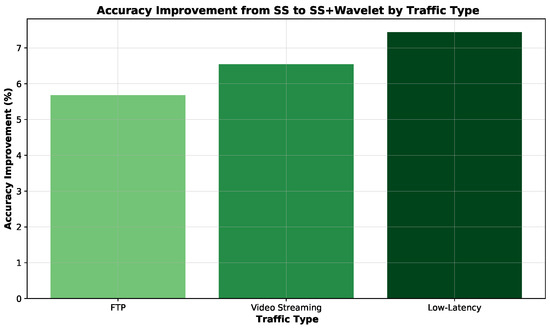
Figure 17.
Accuracy improvement of single traffic types.
Table 8.
Impact of wavelet transform on classification.
The t-SNE visualization in Figure 18 portrays the distribution of predicted classes, FTP (Class 0), Video Streaming (Class 1), and Low-Latency (Class 2). Each distinct cluster in the plot corresponds to a class, revealing how the model separates and perceives these traffic types in a two-dimensional space. Overall, the plot provides a concise representation of the model’s segregation of these network behaviors into distinct categories with minimal overlap.
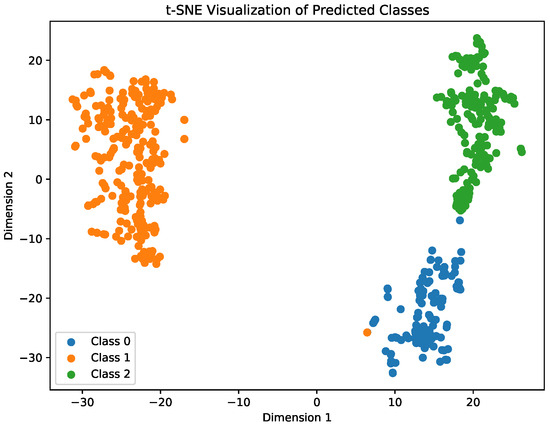
Figure 18.
Visualization of the predicted classes.
Table 9 presents a comparison of the classification accuracy achieved by various methods. This table highlights the performance of different methods, including solutions offered by other researchers, across three distinct traffic types: FTP, Video, and Low Latency. In our previous paper [4], we demonstrated high accuracy using the k-NN algorithm across all traffic types, while Wang et al.’s [50] employment of CNN showed strong performance, especially in FTP and video classifications. Moreover, the utilization of Deep Packet [39] with CNN yielded consistent accuracy rates of 98% across all traffic types. Chang et al.’s [51] ANN model exhibited significant challenges in accurately classifying video traffic, registering a notably lower accuracy compared to other methods. The method proposed in this paper, employing an ANN approach, showcased remarkable accuracy rates of 99.1% in FTP and 99.6% in Low-Latency traffic classification, positioning it as a competitive solution among the state-of-the-art approaches for traffic classification in network analysis. Notably, FlowPic’s [40] deployment of LSTM outperformed other methods with an exceptional 99.9% accuracy in Video traffic classification, underscoring the effectiveness of recurrent neural networks in handling sequential traffic data.
Table 9.
Classification performance comparison among six methods. Results are in the format of Avg.
6. Discussion and Limitations
The experimental results presented in this study demonstrate the significant potential of integrating wavelet transforms with artificial neural networks for accurately classifying low-latency Internet traffic. The high classification accuracy across both basic and complex traffic scenarios highlights the robustness of the proposed approach, particularly in identifying real-time traffic amidst heterogeneous traffic environments. Furthermore, the use of frequency-domain features derived through wavelet transforms proved especially effective in isolating the subtle, noise-like characteristics of low-latency communication.
Despite these encouraging results, several limitations must be acknowledged. First, the dataset used for training and evaluation was generated under controlled conditions on a local Wi-Fi network. While this setup provides a consistent and manageable environment for analysis, it may not fully reflect the complexities and variability of large-scale, real-world networks. Thus, generalization of the model to broader deployments requires further validation using diverse and publicly available datasets. Second, the current implementation employs a relatively simple MLP architecture. Although effective, more sophisticated deep learning models—such as CNNs or transformers—could potentially further enhance classification performance, particularly in highly congested or encrypted network environments. Third, while wavelet-transformed features significantly improve performance, they also introduce computational overhead. This could be a limiting factor for deployment in edge devices or latency-sensitive network components without optimization or hardware acceleration. Finally, the current model does not dynamically adapt to evolving traffic patterns or new application behaviors over time. Future research could explore online learning or adaptive classification mechanisms that evolve with the network environment. Finally, while comparative analysis with other wavelets (e.g., Haar, Daubechies) could further validate our choice, this was beyond the scope of this study. Future work will explore wavelet function adaptability for broader traffic classification scenarios.
7. Conclusions and Future Works
In this study, we have presented a novel approach for the classification and identification of low-latency Internet traffic using deep learning techniques and trend-based features. By incorporating advanced trend features such as slope, moving averages, download-to-upload ratio, and wavelet transform, we have demonstrated the effectiveness of our methodology in accurately classifying different types of Internet traffic. Experimental results have shown that our model achieved high accuracy rates of classifying FTP, video streaming, and low-latency traffic with 99.09%, 99.3%, and 99.56%, respectively. These results validate the robustness and efficacy of our approach in accurately classifying primary Internet traffic types.
Furthermore, our experiments with mixed traffic scenarios, both basic and complex, have provided valuable insights into the performance of our model in real-world traffic mix situations. We observed that as the complexity and number of traffic types increased, the accuracy of identifying the existence of low-latency in the traffic mix decreased. However, our model still showed promising performance in detecting low-latency traffic within mixed traffic scenarios.
In general, the integration of wavelet transform and deep learning techniques has proven to be instrumental in enhancing the accuracy and precision of Internet traffic classification, particularly in the context of identifying low-latency traffic. Our findings contribute to the advancement of traffic analysis methodologies and have practical implications for optimizing the delivery of time-sensitive applications over the Internet.
In conclusion, our work underscores the significance of accurately identifying and prioritizing low-latency Internet traffic, and our proposed methodology offers a promising solution for addressing this critical aspect of network traffic management.
Future research directions could focus on enhancing the scalability and adaptability of the proposed framework. Validating the model on large-scale, publicly available datasets encompassing diverse network environments—such as 5G, IoT, and edge computing scenarios—would strengthen its generalizability. Exploring advanced deep learning architectures, such as attention-based transformers or hybrid CNN-LSTM models, could further improve classification accuracy in highly dynamic or encrypted traffic scenarios. Additionally, optimizing wavelet transform computations through hardware acceleration or lightweight algorithms would reduce computational overhead, enabling deployment on resource-constrained edge devices. Integrating online learning mechanisms to dynamically adapt to evolving traffic patterns and emerging applications would address real-time network variability. Extending the framework to classify encrypted traffic and support multi-class scenarios with finer-grained application distinctions (e.g., differentiating between gaming, VoIP, and financial trading) could broaden its applicability. Finally, investigating federated learning approaches for privacy-preserving traffic classification in distributed networks represents another promising avenue. These enhancements would solidify the framework’s utility in next-generation network management systems.
Author Contributions
Conceptualization, R.E. and V.R.; methodology, R.E. and V.R.; software, R.E.; validation, R.E. and V.R.; formal analysis, R.E. and V.R.; investigation, R.E. and V.R.; resources, R.E.; data curation, R.E. and V.R.; writing—original draft preparation, R.E. and V.R.; writing—review and editing, R.E. and V.R.; visualization, R.E. and V.R.; supervision, V.R.; project administration, R.E. and V.R.; funding acquisition, V.R. All authors have read and agreed to the published version of the manuscript.
Funding
This work was supported by the Ministry of Education of Turkey through a doctoral scholarship awarded to Ramazan Enisoglu.
Data Availability Statement
No data is being made available for the work presented in the paper.
Conflicts of Interest
Ramazan Enisoglu is a PhD candidate at City St George’s, University of London. The authors declare no conflicts of interest.
References
- Cisco. What Is Low Latency? Available online: https://www.cisco.com/c/en/us/solutions/data-center/data-center-networking/what-is-low-latency.html (accessed on 2 May 2024).
- ETSI. Service Requirements for the 5G System. Available online: https://www.etsi.org/deliver/etsi_ts/122200_122299/122261/16.14.00_60/ts_122261v161400p.pdf (accessed on 20 July 2025).
- Union, I.T. One-Way Transmission Time. Recommendations: G Series: G.114. 2003. Available online: https://www.itu.int/rec/T-REC-G.114 (accessed on 20 July 2025).
- Enisoglu, R.; Rakocevic, V. Low-Latency Internet Traffic Identification using Machine Learning with Trend-based Features. In Proceedings of the 2023 International Wireless Communications and Mobile Computing (IWCMC), Marrakesh, Morocco, 19–23 June 2023; pp. 394–399. [Google Scholar]
- Middleton, S.E.; Modafferi, S. Scalable classification of QoS for real-time interactive applications from IP traffic measurements. Comput. Netw. 2016, 107, 121–132. [Google Scholar] [CrossRef]
- Hirchoren, G.A.; Porrez, N.; La Sala, B.; Buraczewski, I. Quality of service in networks with self-similar traffic. In Proceedings of the 2017 XVII Workshop on Information Processing and Control (RPIC), Mar del Plata, Argentina, 20–22 September 2017; pp. 1–5. [Google Scholar]
- Bentaleb, A.; Taani, B.; Begen, A.C.; Timmerer, C.; Zimmermann, R. A survey on bitrate adaptation schemes for streaming media over HTTP. IEEE Commun. Surv. Tutorials 2018, 21, 562–585. [Google Scholar] [CrossRef]
- Osadchiy, A.; Kamenev, A.; Saharov, V.; Chernyi, S. Signal processing algorithm based on discrete wavelet transform. Designs 2021, 5, 41. [Google Scholar] [CrossRef]
- Sun, G.; Zhang, R.; Liu, Z.; Wu, L.; Yu, Q.; Tan, X. Application of EMD combined with wavelet algorithm for filtering slag noise in steel cord conveyor belt. J. Phys. Conf. Ser. 2023, 2638, 012014. [Google Scholar] [CrossRef]
- Habeeb, I.Q.; Fadhil, T.Z.; Jurn, Y.N.; Habeeb, Z.Q.; Abdulkhudhur, H.N. An ensemble technique for speech recognition in noisy environments. Indones. J. Electr. Eng. Comput. Sci. 2020, 18, 835–842. [Google Scholar] [CrossRef]
- Cisco, U. Cisco Annual Internet Report (2018–2023) White Paper; Cisco: San Jose, CA, USA, 2020; Volume 10, pp. 1–35. [Google Scholar]
- Drajic, D.; Krco, S.; Tomic, I.; Popovic, M.; Zeljkovic, N.; Nikaein, N.; Svoboda, P. Impact of online games and M2M applications traffic on performance of HSPA radio access networks. In Proceedings of the 2012 Sixth International Conference on Innovative Mobile and Internet Services in Ubiquitous Computing, Palermo, Italy, 4–6 July 2012; pp. 880–885. [Google Scholar]
- Sander, C.; Kunze, I.; Wehrle, K.; Rüth, J. Video conferencing and flow-rate fairness: A first look at Zoom and the impact of flow-queuing AQM. In Proceedings of the Passive and Active Measurement: 22nd International Conference, PAM 2021, Virtual Event, 29 March–1 April 2021; pp. 3–19. [Google Scholar]
- Rajadurai, S.; Alazab, M.; Kumar, N.; Gadekallu, T.R. Latency evaluation of SDFGs on heterogeneous processors using timed automata. IEEE Access 2020, 8, 140171–140180. [Google Scholar] [CrossRef]
- Finsterbusch, M.; Richter, C.; Rocha, E.; Muller, J.A.; Hanssgen, K. A survey of payload-based traffic classification approaches. IEEE Commun. Surv. Tutor. 2013, 16, 1135–1156. [Google Scholar] [CrossRef]
- Nguyen, T.T.; Armitage, G. A survey of techniques for internet traffic classification using machine learning. IEEE Commun. Surv. Tutor. 2008, 10, 56–76. [Google Scholar] [CrossRef]
- Salman, O.; Elhajj, I.H.; Kayssi, A.; Chehab, A. A review on machine learning–based approaches for Internet traffic classification. Ann. Telecommun. 2020, 75, 673–710. [Google Scholar] [CrossRef]
- Adje, E.A.; Houndji, V.R.; Dossou, M. Features analysis of internet traffic classification using interpretable machine learning models. IAES Int. J. Artif. Intell. 2022, 11, 1175. [Google Scholar] [CrossRef]
- Deri, L.; Sartiano, D. Monitoring IoT Encrypted Traffic with Deep Packet Inspection and Statistical Analysis. In Proceedings of the 2020 15th International Conference for Internet Technology and Secured Transactions (ICITST), London, UK, 8–10 December 2020; pp. 1–6. [Google Scholar] [CrossRef]
- Manju, N.; Harish, B.; Nagadarshan, N. Multilayer Feedforward Neural Network for Internet Traffic Classification. Int. J. Interact. Multim. Artif. Intell. 2020, 6, 117–122. [Google Scholar] [CrossRef]
- Khandait, P.; Hubballi, N.; Mazumdar, B. Efficient Keyword Matching for Deep Packet Inspection based Network Traffic Classification. In Proceedings of the 2020 International Conference on COMmunication Systems & NETworkS (COMSNETS), Bengaluru, India, 7–11 January 2020; pp. 567–570. [Google Scholar] [CrossRef]
- Oliveira, T.P.; Barbar, J.S.; Soares, A.S. Multilayer perceptron and stacked autoencoder for Internet traffic prediction. In Proceedings of the Network and Parallel Computing: 11th IFIP WG 10.3 International Conference, NPC 2014, Ilan, Taiwan, 18–20 September 2014; pp. 61–71. [Google Scholar]
- Aswad, S.A.; Sonuç, E. Classification of VPN network traffic flow using time related features on Apache Spark. In Proceedings of the 2020 4th International Symposium on Multidisciplinary Studies and Innovative Technologies (ISMSIT), Istanbul, Turkey, 22–24 October 2020; pp. 1–8. [Google Scholar]
- Ishak, S.; Alecsandru, C. Optimizing traffic prediction performance of neural networks under various topological, input, and traffic condition settings. J. Transp. Eng. 2004, 130, 452–465. [Google Scholar] [CrossRef]
- Abiodun, O.I.; Jantan, A.; Omolara, A.E.; Dada, K.V.; Umar, A.M.; Linus, O.U.; Arshad, H.; Kazaure, A.A.; Gana, U.; Kiru, M.U. Comprehensive review of artificial neural network applications to pattern recognition. IEEE Access 2019, 7, 158820–158846. [Google Scholar] [CrossRef]
- Roy, S.; Shapira, T.; Shavitt, Y. Fast and lean encrypted Internet traffic classification. Comput. Commun. 2022, 186, 166–173. [Google Scholar] [CrossRef]
- Ertam, F.; Avcı, E. A new approach for internet traffic classification: GA-WK-ELM. Measurement 2017, 95, 135–142. [Google Scholar] [CrossRef]
- Salagean, M.; Firoiu, I. Anomaly detection of network traffic based on analytical discrete wavelet transform. In Proceedings of the 2010 8th International Conference on Communications, Bucharest, Romania, 10–12 June 2010; pp. 49–52. [Google Scholar]
- Gál, Z.; Terdik, G. Wavelet analysis of QoS based network traffic. In Proceedings of the 2011 6th IEEE International Symposium on Applied Computational Intelligence and Informatics (SACI), Timisoara, Romania, 19–21 May 2011; pp. 275–280. [Google Scholar]
- Shi, H.; Li, H.; Zhang, D.; Cheng, C.; Wu, W. Efficient and robust feature extraction and selection for traffic classification. Comput. Netw. 2017, 119, 1–16. [Google Scholar] [CrossRef]
- Liu, Z.; Liu, Q. Balanced feature selection method for Internet traffic classification. IET Netw. 2012, 1, 74–83. [Google Scholar] [CrossRef]
- Zhang, H.; Lu, G.; Qassrawi, M.T.; Zhang, Y.; Yu, X. Feature selection for optimizing traffic classification. Comput. Commun. 2012, 35, 1457–1471. [Google Scholar] [CrossRef]
- Sun, G.; Chen, T.; Su, Y.; Li, C. Internet traffic classification based on incremental support vector machines. Mob. Networks Appl. 2018, 23, 789–796. [Google Scholar] [CrossRef]
- Tong, D.; Qu, Y.R.; Prasanna, V.K. Accelerating decision tree based traffic classification on FPGA and multicore platforms. IEEE Trans. Parallel Distrib. Syst. 2017, 28, 3046–3059. [Google Scholar] [CrossRef]
- Schmidt, B.; Al-Fuqaha, A.; Gupta, A.; Kountanis, D. Optimizing an artificial immune system algorithm in support of flow-Based internet traffic classification. Appl. Soft Comput. 2017, 54, 1–22. [Google Scholar] [CrossRef]
- Crotti, M.; Dusi, M.; Gringoli, F.; Salgarelli, L. Traffic classification through simple statistical fingerprinting. ACM SIGCOMM Comput. Commun. Rev. 2007, 37, 5–16. [Google Scholar] [CrossRef]
- Wang, X.; Parish, D.J. Optimised multi-stage tcp traffic classifier based on packet size distributions. In Proceedings of the 2010 Third International Conference on Communication Theory, Reliability, and Quality of Service, Athens, Greece, 13–19 June 2010; pp. 98–103. [Google Scholar]
- Qin, T.; Wang, L.; Liu, Z.; Guan, X. Robust application identification methods for P2P and VoIP traffic classification in backbone networks. Knowl. Based Syst. 2015, 82, 152–162. [Google Scholar] [CrossRef]
- Lotfollahi, M.; Jafari Siavoshani, M.; Shirali Hossein Zade, R.; Saberian, M. Deep packet: A novel approach for encrypted traffic classification using deep learning. Soft Comput. 2020, 24, 1999–2012. [Google Scholar] [CrossRef]
- Shapira, T.; Shavitt, Y. Flowpic: Encrypted internet traffic classification is as easy as image recognition. In Proceedings of the IEEE INFOCOM 2019-IEEE Conference on Computer Communications Workshops (INFOCOM WKSHPS), Paris, France, 29 April–2 May 2019; pp. 680–687. [Google Scholar]
- Draper-Gil, G.; Lashkari, A.H.; Mamun, M.S.I.; Ghorbani, A.A. Characterization of encrypted and vpn traffic using time-related. In Proceedings of the 2nd International Conference on Information Systems Security and Privacy (ICISSP), Rome, Italy, 19–21 February 2016; pp. 407–414. [Google Scholar]
- Lashkari, A.H.; Gil, G.D.; Mamun, M.S.I.; Ghorbani, A.A. Characterization of tor traffic using time based features. In Proceedings of the International Conference on Information Systems Security and Privacy, SciTePress, Porto, Portugal, 19–21 February 2017; Volume 2, pp. 253–262. [Google Scholar]
- Zou, Y.; Zhu, J.; Wang, X.; Hanzo, L. A survey on wireless security: Technical challenges, recent advances, and future trends. Proc. IEEE 2016, 104, 1727–1765. [Google Scholar] [CrossRef]
- Kontogeorgaki, S.; Sánchez-García, R.J.; Ewing, R.M.; Zygalakis, K.C.; MacArthur, B.D. Noise-processing by signaling networks. Sci. Rep. 2017, 7, 532. [Google Scholar] [CrossRef] [PubMed]
- Hammedi, R. A Deep Learning Based Traffic Classification in Software Defined Networking. In Proceedings of the 14th IADIS International Conference Information Systems, Virtual, 3–5 March 2021. [Google Scholar] [CrossRef]
- Abadi, M.; Agarwal, A.; Barham, P.; Brevdo, E.; Chen, Z.; Citro, C.; Corrado, G.S.; Davis, A.; Dean, J.; Devin, M.; et al. Tensorflow: Largescale Machine Learning on Heterogeneous Systems. Available online: https://www.tensorflow.org/?hl=tr. (accessed on 25 October 2023).
- White, G.; Sundaresan, K.; Briscoe, B. Low latency docsis: Technology overview. Res. Dev. 2019, 1, 11–13. [Google Scholar]
- Yang, Y.; Theisen, R.; Hodgkinson, L.; Gonzalez, J.E.; Ramchandran, K.; Martin, C.H.; Mahoney, M.W. Test accuracy vs. generalization gap: Model selection in nlp without accessing training or testing data. In Proceedings of the 29th ACM SIGKDD Conference on Knowledge Discovery and Data Mining, Long Beach, CA, USA, 6–10 August 2023; pp. 3011–3021. [Google Scholar]
- Du, X.; Xu, H.; Zhu, F. Understanding the effect of hyperparameter optimization on machine learning models for structure design problems. Comput. Aided Des. 2021, 135, 103013. [Google Scholar] [CrossRef]
- Wang, W.; Zhu, M.; Wang, J.; Zeng, X.; Yang, Z. End-to-end encrypted traffic classification with one-dimensional convolution neural networks. In Proceedings of the 2017 IEEE International Conference on Intelligence and Security Informatics (ISI), Beijing, China, 22–24 July 2017; pp. 43–48. [Google Scholar]
- Chang, L.H.; Lee, T.H.; Chu, H.C.; Su, C.W. Application-based online traffic classification with deep learning models on SDN networks. Adv. Technol. Innov. 2020, 5, 216–229. [Google Scholar] [CrossRef]
Disclaimer/Publisher’s Note: The statements, opinions and data contained in all publications are solely those of the individual author(s) and contributor(s) and not of MDPI and/or the editor(s). MDPI and/or the editor(s) disclaim responsibility for any injury to people or property resulting from any ideas, methods, instructions or products referred to in the content. |
© 2025 by the authors. Licensee MDPI, Basel, Switzerland. This article is an open access article distributed under the terms and conditions of the Creative Commons Attribution (CC BY) license (https://creativecommons.org/licenses/by/4.0/).