
Bayesian Binary Search

Abstract
1. Introduction
2. Methodology
2.1. Classical Binary Search/Bisection
2.2. Bayesian Binary Search (BBS)
2.2.1. Binary Search as Bayesian Inference
2.2.2. Problem Formulation
2.3. Bayesian Binary Search Framework
2.4. Proof of Posterior Update Equivalence to Bisection in Probability Density Space with a Non-Uniform Prior
2.5. Case 1: Observation
2.6. Case 2: Observation
2.7. Search Space Probability Density Function Estimation
2.7.1. Supervised Learning Approaches
- Gaussian Process Regression (GPR): GPR provides a non-parametric way to model the PDF, offering both a mean prediction and uncertainty estimates.
- Bayesian Neural Networks (BNNs): BNNs combine the flexibility of neural networks with Bayesian inference, allowing for uncertainty quantification in the predictions.
- Quantile Regression: Quantile Regression estimates the conditional quantiles of a response variable, providing a more comprehensive view of the relationship between variables across different parts of the distribution, without assuming a particular parametric form for the underlying distribution.
2.7.2. Unsupervised Learning Approaches
- Gaussian Mixture Models (GMMs): GMMs (typically fit using the Expectation-Maximization (EM) algorithm) can model complex, multimodal distributions by representing the PDF as a weighted sum of Gaussian components.
- Kernel Density Estimation (KDE): KDE is a non-parametric method for estimating PDFs, which can capture complex shapes without assuming a specific functional form.
- Maximum Likelihood Estimation (MLE): MLE is a method of estimating the parameters of a probability distribution by maximizing a likelihood function. It can be used to fit various parametric distributions (e.g., normal, exponential, Poisson) to data, providing a PDF that best explains the observed samples according to the chosen distribution family.
2.8. Probabilistic Bisection Step
| Algorithm 1: Bayesian Binary Search |
 |
| Algorithm 2: Estimate Search Space Probability Density Function (PDF) |
 |
| Algorithm 3: FindMedian Function |
 |
| Algorithm 4: UpdatePDF Function |
 |
| Algorithm 5: Sign Function |
 |
3. Experiments
3.1. Experiments on Simulated Data
3.1.1. Experimental Setup
3.1.2. Distribution Parameters
- Mean (): 0;
- Standard Deviation (): 10,000.
3.1.3. Target Value Generation
3.1.4. Search Procedure
- Lower Bound (): ;
- Upper Bound (): .
3.1.5. Metrics Collected
- Number of Steps: Total iterations required to find each target.
- Bracket Size: The range () at each step of the search.
3.2. Experiments on Lightning Network Channel Probing
3.2.1. Description of Channel Balance Prediction Task
3.2.2. Data Collection and Preprocessing
3.3. Methodology
3.3.1. Modeling
3.3.2. Node Features
- Node Feature FlagsA vector of 0–1 indicating which of the features each node supports. For example, feature flag #19, the wumbo flag.
- Capacity CentralityThe node’s capacity divided by the network’s capacity. This indicates how much of the network’s capacity is incident to a node.
- Fee RatioRatio of the mean cost of a node’s outgoing fees to the mean cost of its incoming fees.
3.3.3. Edge Features
- Time Lock Delta: The number of blocks a relayed payment is locked into an HTLC.
- Min HTLC: The minimum amount this edge will route (denominated in millisats).
- Max HTLC msat: The maximum amount this edge will route (denominated in millisats).
- Fee Rate millimsat: Proportional fee to route a payment along an edge (denominated in millimillisats).
- Fee Base msat: Fixed fee to route a payment along an edge (denominated in millisats).
3.3.4. Positional Encodings
3.3.5. Concatenated Prediction ML Model
3.3.6. Model Training Details and Performance
4. Discussion
4.1. Theoretical Alignment and Performance Gains
4.2. Real-World Application and Implications
4.3. Limitations and Challenges
- Computational Overhead: The improved search efficiency of BBS comes at the cost of increased computational complexity, particularly in the PDF estimation step. This overhead may offset the reduction in search steps for certain applications, especially those dealing with small search spaces or requiring extremely fast operation.
- PDF Estimation Accuracy: The performance of BBS is heavily dependent on the accuracy of the PDF estimation. In scenarios where the underlying distribution is highly complex or rapidly changing, the chosen PDF estimation method may struggle to provide accurate probabilities, potentially leading to suboptimal performance.
4.4. Future Research Directions
- Adaptive PDF Estimation: Developing methods to dynamically adjust the PDF estimation technique based on the observed search space characteristics could further improve the robustness and efficiency of BBS.
- Theoretical Bounds: While we provide empirical evidence of BBS’s effectiveness, deriving tighter theoretical bounds on its performance under various distribution types would strengthen its theoretical foundation.
- Application to Other Domains: Exploring the applicability of BBS to other areas such as database indexing, computational biology, or optimization algorithms could reveal new use cases and challenges.
4.5. Conclusions
Author Contributions
Funding
Data Availability Statement
Conflicts of Interest
Appendix A
Appendix A.1. BBS on Imperfect Search Space Density Estimation
- Target distribution: ;
- Desired KL divergence: D.

| KLD | Percent Decrease | Basic Mean Steps | Bayesian Mean Steps |
|---|---|---|---|
| 0.0 | 9.40% | 10.00 ± 0.00 | 9.06 ± 0.95 |
| 0.05 | 8.85% | 10.00 ± 0.00 | 9.12 ± 1.07 |
| 0.1 | 7.70% | 10.00 ± 0.00 | 9.23 ± 1.12 |
| 0.15 | 6.95% | 10.00 ± 0.00 | 9.30 ± 1.19 |
| 0.2 | 6.35% | 10.00 ± 0.00 | 9.37 ± 1.26 |
| 0.25 | 6.15% | 10.00 ± 0.00 | 9.38 ± 1.34 |
| 0.3 | 4.90% | 10.00 ± 0.00 | 9.51 ± 1.40 |
| 0.35 | 4.35% | 10.00 ± 0.00 | 9.56 ± 1.44 |
| 0.4 | 3.00% | 10.00 ± 0.00 | 9.70 ± 1.42 |
| 0.45 | 2.25% | 10.00 ± 0.00 | 9.78 ± 1.56 |
| 0.5 | 1.20% | 10.00 ± 0.00 | 9.88 ± 1.62 |
| 0.55 | 0.60% | 10.00 ± 0.00 | 9.94 ± 1.65 |
| 0.6 | 0.60% | 10.00 ± 0.00 | 9.94 ± 1.66 |
| 0.65 | −0.20% | 10.00 ± 0.00 | 10.02 ± 1.77 |
| 0.7 | −0.90% | 10.00 ± 0.00 | 10.09 ± 1.80 |
| 0.75 | −1.90% | 10.00 ± 0.00 | 10.19 ± 1.87 |
| 0.8 | −2.75% | 10.00 ± 0.00 | 10.28 ± 1.94 |
| 0.85 | −3.35% | 10.00 ± 0.00 | 10.34 ± 2.00 |
| 0.9 | −4.10% | 10.00 ± 0.00 | 10.41 ± 2.00 |
| 0.95 | −4.85% | 10.00 ± 0.00 | 10.48 ± 2.03 |

| Percent Decrease | Basic Mean Steps | Bayesian Mean Steps | |
|---|---|---|---|
| 1 | 3.14% | 13.38 ± 0.49 | 12.96 ± 0.99 |
| 2 | 2.38% | 12.58 ± 0.50 | 12.28 ± 0.90 |
| 3 | 2.67% | 12.00 ± 0.00 | 11.68 ± 0.79 |
| 4 | 4.22% | 11.86 ± 0.35 | 11.36 ± 0.72 |
| 5 | 0.36% | 11.00 ± 0.00 | 10.96 ± 0.78 |
| 6 | 2.91% | 11.00 ± 0.00 | 10.68 ± 0.82 |
| 7 | 4.55% | 11.00 ± 0.00 | 10.50 ± 0.74 |
| 8 | 5.27% | 11.00 ± 0.00 | 10.42 ± 0.64 |
| 9 | 1.53% | 10.48 ± 0.50 | 10.32 ± 0.51 |
| 10 | 0.40% | 10.00 ± 0.00 | 9.96 ± 0.78 |
| 11 | 2.80% | 10.00 ± 0.00 | 9.72 ± 0.81 |
| 12 | 3.80% | 10.00 ± 0.00 | 9.62 ± 0.75 |
| 13 | 4.40% | 10.00 ± 0.00 | 9.56 ± 0.76 |
| 14 | 5.00% | 10.00 ± 0.00 | 9.50 ± 0.71 |
| 15 | 5.60% | 10.00 ± 0.00 | 9.44 ± 0.67 |
| 16 | 5.80% | 10.00 ± 0.00 | 9.42 ± 0.64 |
| 17 | 6.40% | 10.00 ± 0.00 | 9.36 ± 0.56 |
| 18 | 6.60% | 10.00 ± 0.00 | 9.34 ± 0.52 |
| 19 | -1.98% | 9.08 ± 0.27 | 9.26 ± 0.56 |
| 20 | 0.00% | 9.00 ± 0.00 | 9.00 ± 0.78 |
| 21 | 1.78% | 9.00 ± 0.00 | 8.84 ± 0.84 |
| 22 | 2.67% | 9.00 ± 0.00 | 8.76 ± 0.74 |
| 23 | 3.78% | 9.00 ± 0.00 | 8.66 ± 0.75 |
| 24 | 4.00% | 9.00 ± 0.00 | 8.64 ± 0.75 |
| 25 | 4.00% | 9.00 ± 0.00 | 8.64 ± 0.75 |
| 26 | 4.44% | 9.00 ± 0.00 | 8.60 ± 0.76 |
| 27 | 4.44% | 9.00 ± 0.00 | 8.60 ± 0.76 |
| 28 | 5.11% | 9.00 ± 0.00 | 8.54 ± 0.76 |
| 29 | 6.00% | 9.00 ± 0.00 | 8.46 ± 0.68 |
| 30 | 6.22% | 9.00 ± 0.00 | 8.44 ± 0.67 |
| 31 | 6.44% | 9.00 ± 0.00 | 8.42 ± 0.64 |
| 32 | 6.67% | 9.00 ± 0.00 | 8.40 ± 0.61 |

| Percent Decrease | Basic Mean Steps | Bayesian Mean Steps | |
|---|---|---|---|
| 1 | 12.86% | 16.87 ± 0.34 | 14.70 ± 1.41 |
| 2 | 13.03% | 16.00 ± 0.00 | 13.91 ± 1.34 |
| 3 | 14.40% | 15.55 ± 0.50 | 13.31 ± 1.37 |
| 4 | 13.07% | 15.00 ± 0.00 | 13.04 ± 1.33 |
| 5 | 15.10% | 15.00 ± 0.00 | 12.73 ± 1.35 |
| 6 | 17.17% | 15.00 ± 0.00 | 12.43 ± 1.36 |
| 7 | 13.01% | 14.03 ± 0.16 | 12.20 ± 1.37 |
| 8 | 13.75% | 14.00 ± 0.00 | 12.07 ± 1.34 |
| 9 | 14.39% | 14.00 ± 0.00 | 11.98 ± 1.31 |
| 10 | 15.54% | 14.00 ± 0.00 | 11.82 ± 1.34 |
| 11 | 16.89% | 14.00 ± 0.00 | 11.63 ± 1.36 |
| 12 | 18.11% | 14.00 ± 0.00 | 11.46 ± 1.36 |
| 13 | 19.00% | 14.00 ± 0.00 | 11.34 ± 1.35 |
| 14 | 13.83% | 13.05 ± 0.23 | 11.25 ± 1.36 |
| 15 | 14.27% | 13.00 ± 0.00 | 11.14 ± 1.37 |
| 16 | 14.62% | 13.00 ± 0.00 | 11.10 ± 1.37 |
| 17 | 15.00% | 13.00 ± 0.00 | 11.05 ± 1.34 |
| 18 | 15.38% | 13.00 ± 0.00 | 11.00 ± 1.32 |
| 19 | 15.65% | 13.00 ± 0.00 | 10.96 ± 1.32 |
| 20 | 16.42% | 13.00 ± 0.00 | 10.87 ± 1.34 |
| 21 | 17.35% | 13.00 ± 0.00 | 10.74 ± 1.36 |
| 22 | 18.19% | 13.00 ± 0.00 | 10.63 ± 1.36 |
| 23 | 18.50% | 13.00 ± 0.00 | 10.60 ± 1.37 |
| 24 | 19.08% | 13.00 ± 0.00 | 10.52 ± 1.34 |
| 25 | 19.81% | 13.00 ± 0.00 | 10.43 ± 1.35 |
| 26 | 20.15% | 13.00 ± 0.00 | 10.38 ± 1.34 |
| 27 | 20.77% | 13.00 ± 0.00 | 10.30 ± 1.34 |
| 28 | 15.42% | 12.13 ± 0.34 | 10.26 ± 1.36 |
| 29 | 14.92% | 12.00 ± 0.00 | 10.21 ± 1.37 |
| 30 | 15.42% | 12.00 ± 0.00 | 10.15 ± 1.37 |
| 31 | 15.58% | 12.00 ± 0.00 | 10.13 ± 1.37 |
| 32 | 15.75% | 12.00 ± 0.00 | 10.11 ± 1.37 |

| Percent Decrease | Basic Mean Steps | Bayesian Mean Steps | |
|---|---|---|---|
| 1 | 4.26% | 13.25 ± 0.43 | 12.68 ± 0.92 |
| 2 | 4.36% | 12.39 ± 0.49 | 11.85 ± 0.89 |
| 3 | 5.43% | 12.00 ± 0.00 | 11.35 ± 0.79 |
| 4 | 6.20% | 11.62 ± 0.49 | 10.90 ± 0.85 |
| 5 | 4.04% | 11.00 ± 0.00 | 10.56 ± 0.82 |
| 6 | 5.44% | 11.00 ± 0.00 | 10.40 ± 0.76 |
| 7 | 6.67% | 11.00 ± 0.00 | 10.27 ± 0.73 |
| 8 | 9.42% | 11.00 ± 0.00 | 9.96 ± 0.84 |
| 9 | 3.65% | 10.08 ± 0.27 | 9.71 ± 0.85 |
| 10 | 4.24% | 10.00 ± 0.00 | 9.58 ± 0.85 |
| 11 | 5.14% | 10.00 ± 0.00 | 9.49 ± 0.81 |
| 12 | 5.84% | 10.00 ± 0.00 | 9.42 ± 0.77 |
| 13 | 6.28% | 10.00 ± 0.00 | 9.37 ± 0.74 |
| 14 | 6.74% | 10.00 ± 0.00 | 9.33 ± 0.71 |
| 15 | 7.44% | 10.00 ± 0.00 | 9.26 ± 0.72 |
| 16 | 9.50% | 10.00 ± 0.00 | 9.05 ± 0.81 |
| 17 | 11.44% | 10.00 ± 0.00 | 8.86 ± 0.86 |
| 18 | 4.50% | 9.15 ± 0.36 | 8.74 ± 0.86 |
| 19 | 3.80% | 9.00 ± 0.00 | 8.66 ± 0.86 |
| 20 | 4.56% | 9.00 ± 0.00 | 8.59 ± 0.86 |
| 21 | 5.09% | 9.00 ± 0.00 | 8.54 ± 0.83 |
| 22 | 5.64% | 9.00 ± 0.00 | 8.49 ± 0.82 |
| 23 | 5.98% | 9.00 ± 0.00 | 8.46 ± 0.79 |
| 24 | 6.31% | 9.00 ± 0.00 | 8.43 ± 0.77 |
| 25 | 6.53% | 9.00 ± 0.00 | 8.41 ± 0.76 |
| 26 | 6.84% | 9.00 ± 0.00 | 8.38 ± 0.75 |
| 27 | 7.24% | 9.00 ± 0.00 | 8.35 ± 0.72 |
| 28 | 7.47% | 9.00 ± 0.00 | 8.33 ± 0.70 |
| 29 | 7.58% | 9.00 ± 0.00 | 8.32 ± 0.69 |
| 30 | 7.84% | 9.00 ± 0.00 | 8.29 ± 0.68 |
| 31 | 8.36% | 9.00 ± 0.00 | 8.25 ± 0.71 |
| 32 | 10.36% | 9.00 ± 0.00 | 8.07 ± 0.80 |

| Percent Decrease | Basic Mean Steps | Bayesian Mean Steps | |
|---|---|---|---|
| 1 | 21.08% | 19.53 ± 0.50 | 15.41 ± 1.90 |
| 2 | 22.52% | 18.78 ± 0.41 | 14.55 ± 1.89 |
| 3 | 21.72% | 18.00 ± 0.00 | 14.09 ± 1.86 |
| 4 | 24.10% | 18.00 ± 0.00 | 13.66 ± 1.89 |
| 5 | 23.51% | 17.46 ± 0.50 | 13.36 ± 1.89 |
| 6 | 22.42% | 17.00 ± 0.00 | 13.19 ± 1.85 |
| 7 | 23.78% | 17.00 ± 0.00 | 12.96 ± 1.82 |
| 8 | 25.28% | 17.00 ± 0.00 | 12.70 ± 1.90 |
| 9 | 26.40% | 17.00 ± 0.00 | 12.51 ± 1.91 |
| 10 | 26.44% | 16.85 ± 0.36 | 12.39 ± 1.91 |
| 11 | 23.15% | 16.00 ± 0.00 | 12.30 ± 1.88 |
| 12 | 23.64% | 16.00 ± 0.00 | 12.22 ± 1.86 |
| 13 | 24.19% | 16.00 ± 0.00 | 12.13 ± 1.85 |
| 14 | 24.68% | 16.00 ± 0.00 | 12.05 ± 1.82 |
| 15 | 25.88% | 16.00 ± 0.00 | 11.86 ± 1.87 |
| 16 | 26.69% | 16.00 ± 0.00 | 11.73 ± 1.89 |
| 17 | 27.36% | 16.00 ± 0.00 | 11.62 ± 1.93 |
| 18 | 27.84% | 16.00 ± 0.00 | 11.55 ± 1.93 |
| 19 | 28.34% | 16.00 ± 0.00 | 11.47 ± 1.90 |
| 20 | 28.69% | 16.00 ± 0.00 | 11.41 ± 1.90 |
| 21 | 27.63% | 15.71 ± 0.45 | 11.37 ± 1.90 |
| 22 | 24.44% | 15.00 ± 0.00 | 11.33 ± 1.89 |
| 23 | 24.84% | 15.00 ± 0.00 | 11.27 ± 1.88 |
| 24 | 25.07% | 15.00 ± 0.00 | 11.24 ± 1.87 |
| 25 | 25.37% | 15.00 ± 0.00 | 11.19 ± 1.86 |
| 26 | 25.65% | 15.00 ± 0.00 | 11.15 ± 1.85 |
| 27 | 25.93% | 15.00 ± 0.00 | 11.11 ± 1.84 |
| 28 | 26.09% | 15.00 ± 0.00 | 11.09 ± 1.84 |
| 29 | 26.44% | 15.00 ± 0.00 | 11.03 ± 1.81 |
| 30 | 27.21% | 15.00 ± 0.00 | 10.92 ± 1.85 |
| 31 | 27.95% | 15.00 ± 0.00 | 10.81 ± 1.88 |
| 32 | 28.24% | 15.00 ± 0.00 | 10.76 ± 1.89 |

Appendix A.2. Binary Search Tree Visualization Comparison


Theoretical Foundations of Probabilistic Search
Appendix A.3. Theoretical Analysis: General Convergence Proof and Worst Case for Normal Distribution
- Domain/Search Space: , where and ;
- Unknown Target: ;
- Sign Function: ;
- Boundary Conditions: ;
- Tolerance: .
Appendix A.3.1. Proof of Convergence of Bisection Method on Domain Space
Algorithm Description
Stopping Condition
Appendix A.3.2. Proof of Convergence of Bisection Method on Probability Density Space
Algorithm Description
Stopping Condition
| Algorithm A1: Number of Steps Required for Bayesian Binary Search Convergence |
 |
Appendix A.3.3. Proving Worst-Case Time Complexity of BBS on Normal Distribution
- The interval always includes one of the endpoints (0 or 1);
- The domain space interval is therefore maximized at each iteration.
Appendix A.3.4. Additional Experiments with GPR Density Estimation and Runtime Approximation


References
- Knuth, D.E. The Art of Computer Programming: Volume 3: Sorting and Searching; Addison-Wesley Professional: Boston, MA, USA, 1998. [Google Scholar]
- Peterson, W.W. Addressing for random-access storage. IBM J. Res. Dev. 1957, 1, 130–146. [Google Scholar] [CrossRef]
- Lehmer, D.H. Teaching combinatorial tricks to a computer. Proc. Sympos. Appl. Math. 1960, 10, 179–193. [Google Scholar]
- Bottenbruch, H. Structure and use of algol 60. In Symbolic Languages in Data Processing; Gordon and Breach: London, UK, 1962; pp. 121–140. [Google Scholar]
- Chazelle, B.; Guibas, L.J. Fractional cascading: I. A data structuring technique. In Algorithmica; Springer: Berlin/Heidelberg, Germany, 1986; pp. 133–162. [Google Scholar]
- Mohammed, A.S.; Amrahov, Ş.E.; Çelebi, F.V. Interpolated binary search: An efficient hybrid search algorithm on ordered datasets. Eng. Sci. Technol. Int. J. 2021, 24, 1072–1079. [Google Scholar] [CrossRef]
- Lin, J.-L. Interpolation Once Binary Search over a Sorted List. Mathematics 2024, 12, 1394. [Google Scholar] [CrossRef]
- Lin, H.; Luo, T.; Woodruff, D. Learning augmented binary search trees. In International Conference on Machine Learning; PMLR: New York, NY, USA, 2022; pp. 13431–13440. [Google Scholar]
- Russ, S. The Mathematical Works of Bernard Bolzano; Oxford University Press: Oxford, UK, 2004. [Google Scholar]
- Burden, R.L.; Faires, J.D. Numerical Analysis; Cengage Learning: Boston, MA, USA, 2015. [Google Scholar]
- Horstein, M. Sequential transmission using noiseless feedback. IEEE Trans. Inf. Theory 1963, 9, 136–143. [Google Scholar] [CrossRef]
- Hansen, E.; Walster, G.W. Global optimization using interval analysis: The multi-dimensional case. Comput. Math. Appl. 1991, 21, 173–194. [Google Scholar] [CrossRef]
- Waeber, R.; Frazier, P.I.; Henderson, S.G. A bayesian approach to stochastic root finding. In Proceedings of the 2013 Winter Simulation Conference, Phoenix, AZ, USA, 11–14 December 2011; IEEE: New York, NY, USA, 2013; pp. 4033–4043. [Google Scholar]
- Jedynak, B.; Frazier, P.I.; Sznitman, R. Twenty questions with noise: Bayes optimal policies for entropy loss. J. Appl. Probab. 2012, 49, 114–136. [Google Scholar] [CrossRef]
- Nievergelt, J. Parallel methods for integrating ordinary differential equations. Commun. ACM 1964, 7, 731–733. [Google Scholar] [CrossRef]
- Ghahramani, Z. Probabilistic machine learning and artificial intelligence. Nature 2015, 521, 452–459. [Google Scholar] [CrossRef] [PubMed]
- Rasmussen, C.E.; Williams, C.K. Gaussian Processes for Machine Learning; MIT Press: Cambridge, UK, 2006. [Google Scholar]
- Wang, H.; Yeung, D.-Y. Towards bayesian deep learning: A framework and some existing methods. IEEE Trans. Knowl. Data Eng. 2016, 28, 3395–3408. [Google Scholar] [CrossRef]
- Shahriari, B.; Swersky, K.; Wang, Z.; Adams, R.P.; De Freitas, N. Taking the human out of the loop: A review of bayesian optimization. Proc. IEEE 2015, 104, 148–175. [Google Scholar] [CrossRef]
- Tikhomirov, S.; Pickhardt, R.; Biryukov, A.; Nowostawski, M. Probing channel balances in the lightning network. arXiv 2020, arXiv:2004.00333. [Google Scholar]
- Rossi, E.; Singh, V. Channel balance interpolation in the lightning network via Machine learning. arXiv 2024, arXiv:2405.12087. [Google Scholar]
- Rosenblatt, F. The perceptron—A Perceiving and Recognizing Automaton; Technical Report 85-460-1; Cornell Aeronautical Laboratory: Ithaca, NY, USA, 1957. [Google Scholar]
- Dwivedi, V.P.; Joshi, C.K.; Laurent, T.; Bengio, Y.; Bresson, X. Benchmarking graph neural networks. arXiv 2020, arXiv:2003.00982. [Google Scholar]
- Mehlhorn, K. Nearly optimal binary search trees. Acta Inform. 1975, 5, 287–295. [Google Scholar] [CrossRef]
- Dinitz, M.; Im, S.; Lavastida, T.; Moseley, B.; Niaparast, A.; Vassilvitskii, S. Binary search with distributional predictions. arXiv 2024, arXiv:2411.16030. [Google Scholar]
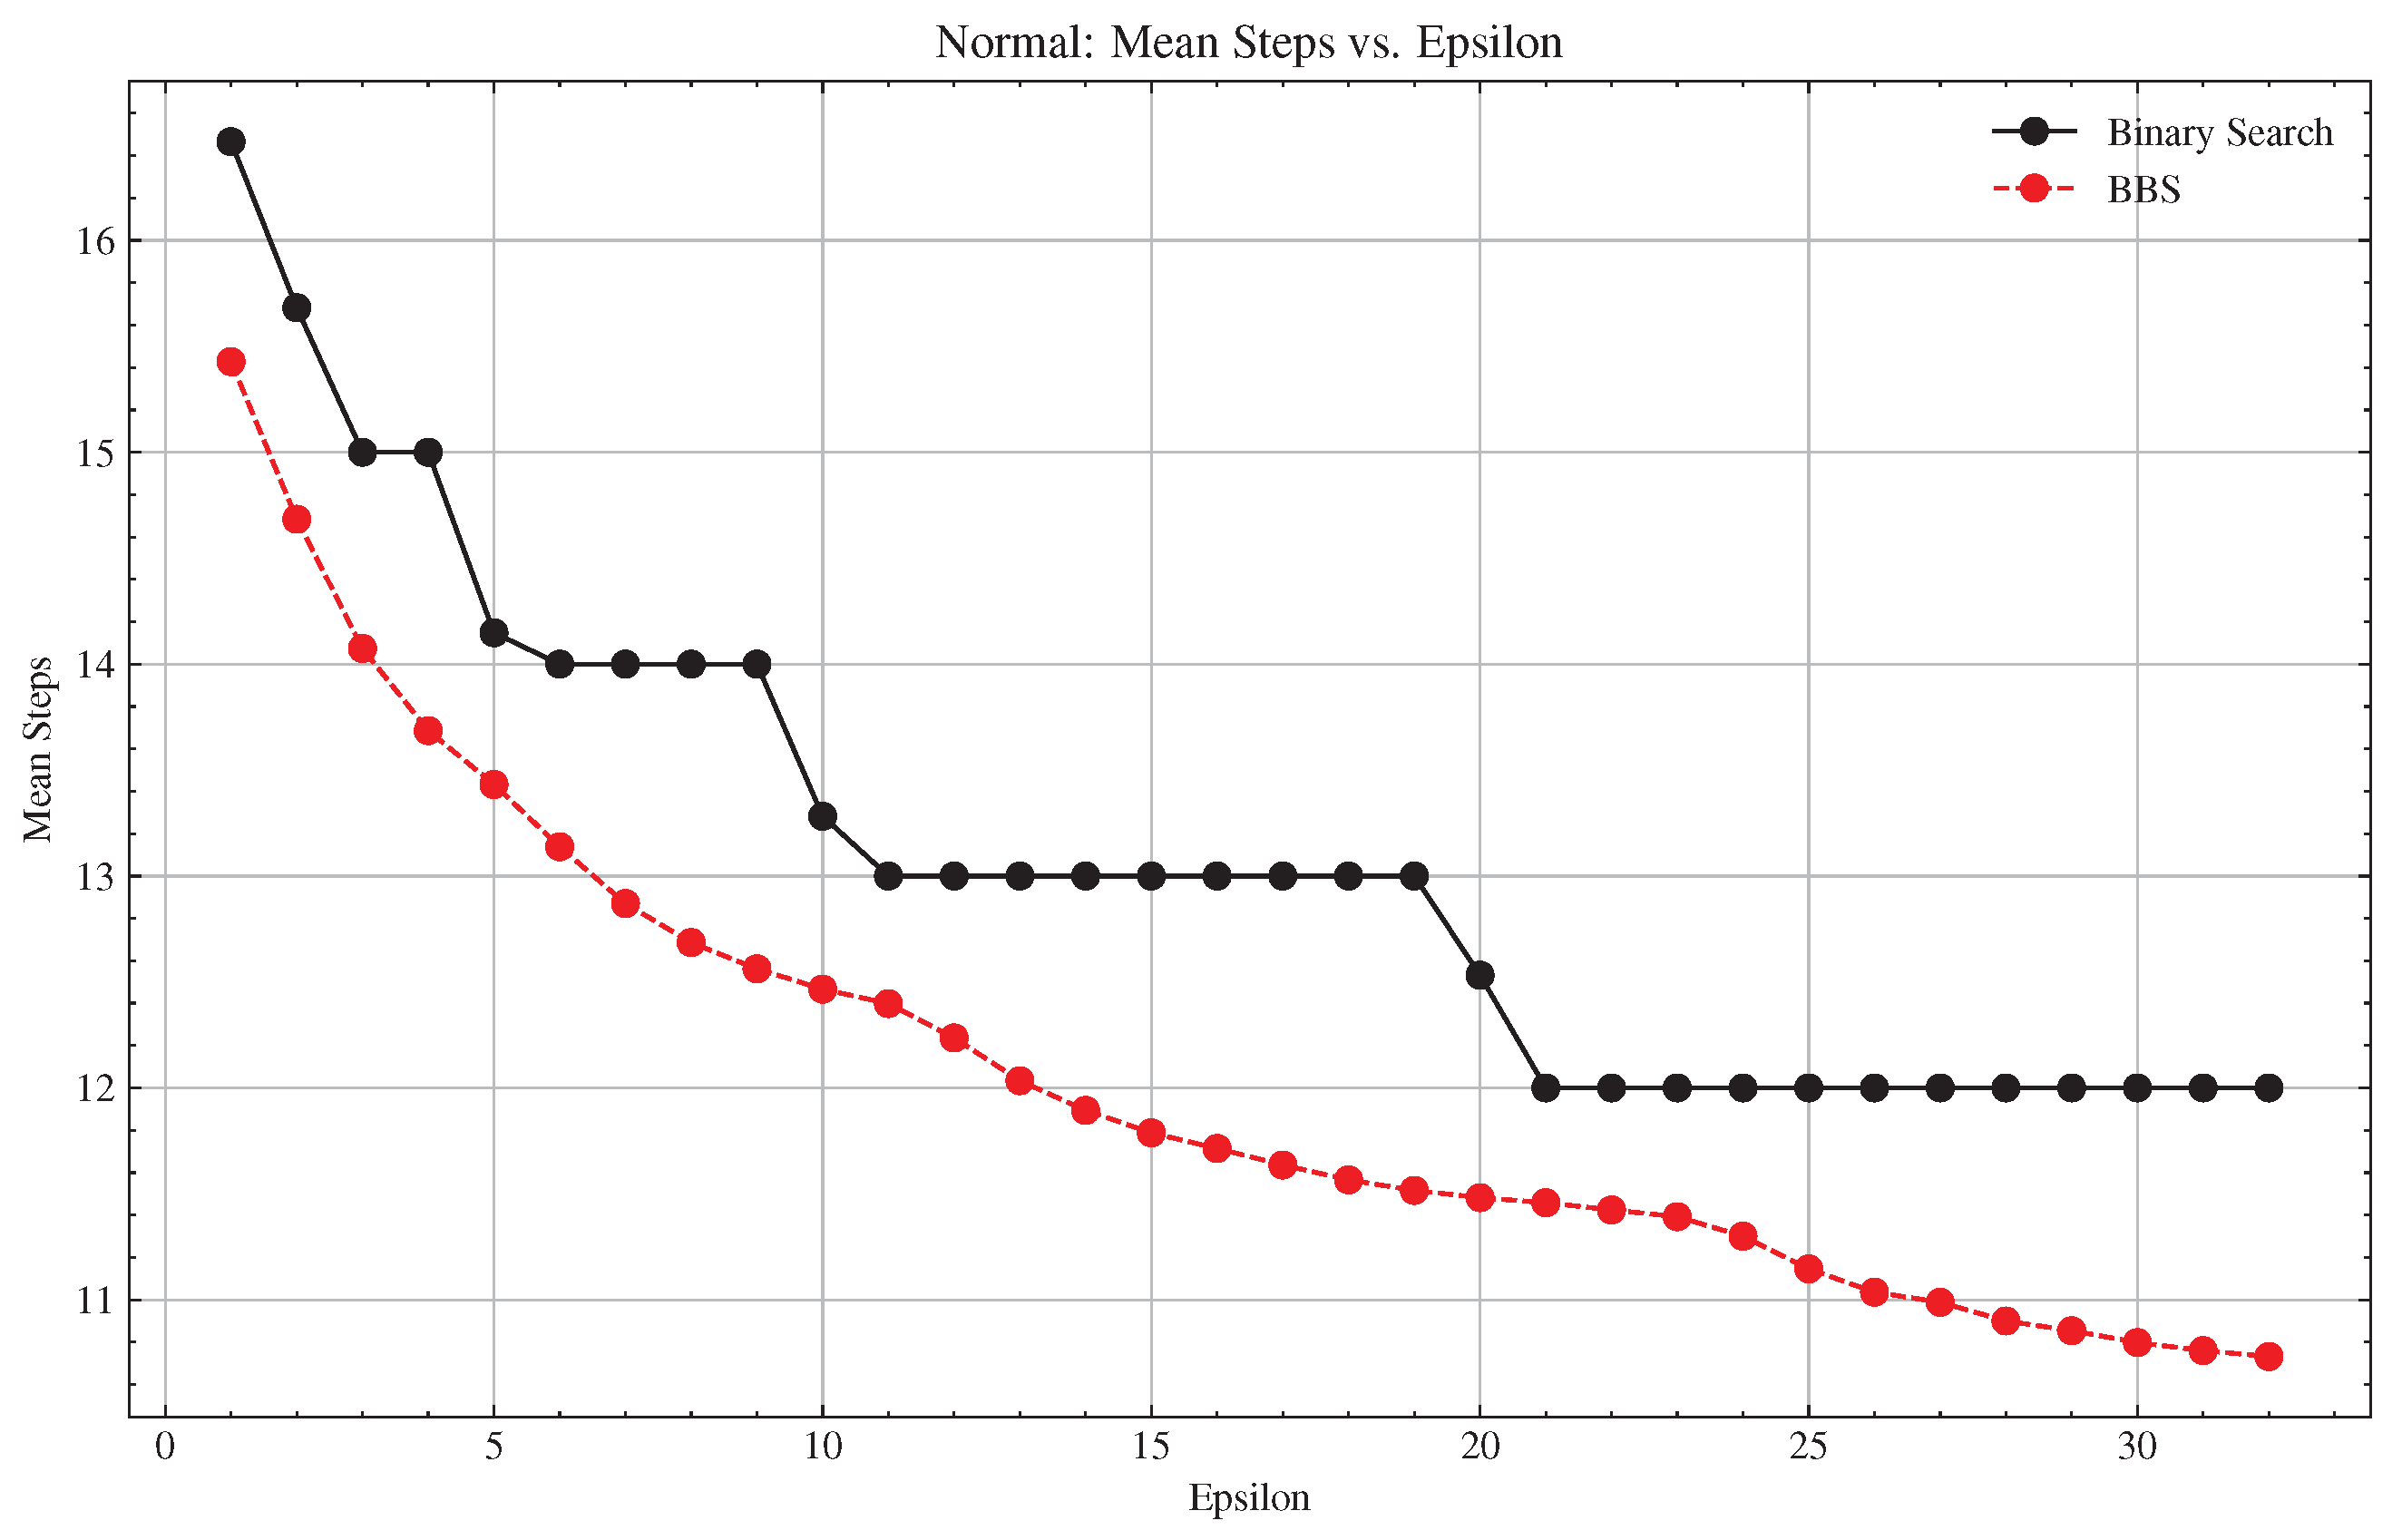

| Percent Decrease | Basic Mean Steps | BBS Mean Steps | |
|---|---|---|---|
| 1 | 6.30% | 16.47 ± 0.50 | 15.43 ± 1.19 |
| 2 | 6.36% | 15.68 ± 0.47 | 14.68 ± 1.15 |
| 3 | 6.17% | 15.00 ± 0.00 | 14.07 ± 1.15 |
| 4 | 8.76% | 15.00 ± 0.00 | 13.69 ± 1.11 |
| 5 | 5.06% | 14.15 ± 0.36 | 13.43 ± 1.02 |
| 6 | 6.16% | 14.00 ± 0.00 | 13.14 ± 1.09 |
| 7 | 8.07% | 14.00 ± 0.00 | 12.87 ± 1.16 |
| 8 | 9.39% | 14.00 ± 0.00 | 12.69 ± 1.12 |
| 9 | 10.27% | 14.00 ± 0.00 | 12.56 ± 1.08 |
| 10 | 6.14% | 13.28 ± 0.45 | 12.47 ± 1.01 |
| 11 | 4.63% | 13.00 ± 0.00 | 12.40 ± 0.99 |
| 12 | 5.88% | 13.00 ± 0.00 | 12.24 ± 1.05 |
| 13 | 7.43% | 13.00 ± 0.00 | 12.03 ± 1.13 |
| 14 | 8.51% | 13.00 ± 0.00 | 11.89 ± 1.15 |
| 15 | 9.32% | 13.00 ± 0.00 | 11.79 ± 1.15 |
| 16 | 9.89% | 13.00 ± 0.00 | 11.71 ± 1.12 |
| 17 | 10.49% | 13.00 ± 0.00 | 11.64 ± 1.11 |
| 18 | 11.03% | 13.00 ± 0.00 | 11.57 ± 1.09 |
| 19 | 11.42% | 13.00 ± 0.00 | 11.52 ± 1.05 |
| 20 | 8.38% | 12.53 ± 0.50 | 11.48 ± 1.03 |
| 21 | 4.52% | 12.00 ± 0.00 | 11.46 ± 1.01 |
| 22 | 4.80% | 12.00 ± 0.00 | 11.42 ± 0.97 |
| 23 | 5.07% | 12.00 ± 0.00 | 11.39 ± 0.95 |
| 24 | 5.83% | 12.00 ± 0.00 | 11.30 ± 1.01 |
| 25 | 7.12% | 12.00 ± 0.00 | 11.15 ± 1.10 |
| 26 | 8.03% | 12.00 ± 0.00 | 11.04 ± 1.13 |
| 27 | 8.43% | 12.00 ± 0.00 | 10.99 ± 1.14 |
| 28 | 9.17% | 12.00 ± 0.00 | 10.90 ± 1.15 |
| 29 | 9.55% | 12.00 ± 0.00 | 10.85 ± 1.15 |
| 30 | 10.02% | 12.00 ± 0.00 | 10.80 ± 1.15 |
| 31 | 10.33% | 12.00 ± 0.00 | 10.76 ± 1.14 |
| 32 | 10.57% | 12.00 ± 0.00 | 10.73 ± 1.13 |
| Percent Decrease | Basic Mean Steps | BBS Mean Steps | |
|---|---|---|---|
| 128 | 3.07% | 14.26 ± 2.26 | 13.82 ± 2.35 |
| 256 | 3.31% | 13.26 ± 2.26 | 12.82 ± 2.35 |
| 512 | 3.57% | 12.26 ± 2.26 | 11.82 ± 2.35 |
| 1024 | 3.89% | 11.26 ± 2.26 | 10.82 ± 2.35 |
| 2048 | 4.27% | 10.26 ± 2.26 | 9.82 ± 2.35 |
| 4096 | 4.73% | 9.26 ± 2.26 | 8.82 ± 2.35 |
| 8192 | 5.03% | 8.26 ± 2.26 | 7.84 ± 2.30 |
| 16,384 | 5.73% | 7.26 ± 2.26 | 6.84 ± 2.29 |
Disclaimer/Publisher’s Note: The statements, opinions and data contained in all publications are solely those of the individual author(s) and contributor(s) and not of MDPI and/or the editor(s). MDPI and/or the editor(s) disclaim responsibility for any injury to people or property resulting from any ideas, methods, instructions or products referred to in the content. |
© 2025 by the authors. Licensee MDPI, Basel, Switzerland. This article is an open access article distributed under the terms and conditions of the Creative Commons Attribution (CC BY) license (https://creativecommons.org/licenses/by/4.0/).
Share and Cite
Singh, V.; Khanzadeh, M.; Davis, V.; Rush, H.; Rossi, E.; Shrader, J.; Lio’, P. Bayesian Binary Search. Algorithms 2025, 18, 452. https://doi.org/10.3390/a18080452
Singh V, Khanzadeh M, Davis V, Rush H, Rossi E, Shrader J, Lio’ P. Bayesian Binary Search. Algorithms. 2025; 18(8):452. https://doi.org/10.3390/a18080452
Chicago/Turabian StyleSingh, Vikash, Matthew Khanzadeh, Vincent Davis, Harrison Rush, Emanuele Rossi, Jesse Shrader, and Pietro Lio’. 2025. "Bayesian Binary Search" Algorithms 18, no. 8: 452. https://doi.org/10.3390/a18080452
APA StyleSingh, V., Khanzadeh, M., Davis, V., Rush, H., Rossi, E., Shrader, J., & Lio’, P. (2025). Bayesian Binary Search. Algorithms, 18(8), 452. https://doi.org/10.3390/a18080452