Article

Integrating Machine Learning Techniques and the Theory of Planned Behavior to Assess the Drivers of and Barriers to the Use of Generative Artificial Intelligence: Evidence in Spain

by
Antonio Pérez-Portabella
1,
Jorge de Andrés-Sánchez
2,*,
Mario Arias-Oliva
3 and
Mar Souto-Romero
4
1
Estudis de Comunicació, Universitat Rovira i Virgili and Universidad Complutense de Madrid, Campus Catalunya, 43002 Tarragona, Spain
2
Social and Business Research Laboratory, Universitat Rovira i Virgili, Campus de Bellissens, 43002 Tarragona, Spain
3
Marketing Department, Faculty of Business and Economy, University Complutense of Madrid, Campus de Somosaguas, 28223 Madrid, Spain
4
Department of Business Economics, Faculty of Business and Economy, University Rey Juan Carlos, P.º de los Artilleros, 38, 28032 Madrid, Spain
*
Author to whom correspondence should be addressed.
Algorithms 2025, 18(7), 410; https://doi.org/10.3390/a18070410
Submission received: 3 June 2025 / Revised: 30 June 2025 / Accepted: 1 July 2025 / Published: 3 July 2025
(This article belongs to the Special Issue Evolution of Algorithms in the Era of Generative AI)

Abstract

Generative artificial intelligence (GAI) is emerging as a disruptive force, both economically and socially, with its use spanning from the provision of goods and services to everyday activities such as healthcare and household management. This study analyzes the enabling and inhibiting factors of GAI use in Spain based on a large-scale survey conducted by the Spanish Center for Sociological Research on the use and perception of artificial intelligence. The proposed model is based on the Theory of Planned Behavior and is fitted using machine learning techniques, specifically decision trees, Random Forest extensions, and extreme gradient boosting. While decision trees allow for detailed visualization of how variables interact to explain usage, Random Forest provides an excellent model fit (R2 close to 95%) and predictive performance. The use of Shapley Additive Explanations reveals that knowledge about artificial intelligence, followed by innovation orientation, is the main explanatory variable of GAI use. Among sociodemographic variables, Generation X and Z stood out as the most relevant. It is also noteworthy that the perceived privacy risk does not show a clear inhibitory influence on usage. Factors representing the positive consequences of GAI, such as performance expectancy and social utility, exert a stronger influence than the negative impact of hindering factors such as perceived privacy or social risks.

1. Introduction

Artificial intelligence (AI) has become integrated into society, serving as essential support in virtually all areas of life. It is a tool that extends across economic sectors and enhances economic productivity and quality of life [1]. Beyond its professional use in industry 4.0 [2] and complex cognitive tasks [3], it is increasingly used in domestic settings. AI facilitates home management through smart devices that optimize energy consumption, security, and comfort [4]. It also plays a key role in home healthcare, health monitoring, and personalized medical assistance [5]. Additionally, its presence is common in educational environments [6,7].
Among the various types of AI, generative artificial intelligence (GAI) is prominent. Unlike other AI types that focus on classification or data analysis, GAI has the ability to create original content, such as text, images, music, code, or designs [8]. Models such as ChatGPT, Copilot, and Gemini are widely recognized applications that are capable of generating results that traditionally require human intervention. Their potential spans from creative assistance in the arts and communication to advanced applications in medicine, education, and product design, opening new avenues for research in human–machine interaction [9].
However, the deployment of AI presents challenges, particularly in the case of GAI. One of the most significant concerns is the quality and accuracy of the generated content, as this technology does not always distinguish between accurate and erroneous information, which can lead to misleading or incorrect results [8]. There is also the risk of algorithmic bias—if training data contain prejudices, these can be replicated or even amplified in the generated outputs. These limitations can exacerbate informational risks, especially if GAI is used deliberately to spread misinformation, impersonate identities [10], or normalize practices such as automated plagiarism [11]. Additionally, there are unresolved legal uncertainties regarding intellectual property and the copyright of generated content [12]. Ethical and social concerns have also been raised, such as the potential replacement of human creative labor and the urgent need for regulatory frameworks that balance innovation with responsibility [13]. These challenges highlight the need to promote the ethical, transparent, and supervised use of GAI [14].
The aim of this study is to analyze the determinants of generative AI (GAI) usage in Spain and its social relevance, using data from the National Survey conducted by the Centro de Investigaciones Sociológicas (Sociology Research Centre) [15] on the use of generative artificial intelligence in Spanish society. This study focuses specifically on general-purpose GAI, that is, tools designed for multiple functions and cognitive tasks, rather than specialized applications such as image, music, or art generation. These generalist tools are widely accessible to the public and include popular platforms such as ChatGPT (OpenAI), Copilot (Microsoft), Gemini (Google), and Perplexity AI—all of which share the common feature of processing natural language and assisting users across a broad range of general tasks.
This study adopts the Theory of Planned Behavior (TPB) [16] as a theoretical framework, which identifies three categories of behavior predictors: attitude, perceived behavioral control, and subjective norms. This conceptual framework has proven effective in explaining a wide range of behaviors, including the acceptance and use of GAI [17]. Figure 1 illustrates the proposed theoretical model.
Attitude is defined as the positive or negative evaluation a person makes about performing a specific behavior [16]. In technology adoption models, such as the Technology Acceptance Model (TAM) [18], the main antecedent of attitude is perceived usefulness, such as increased productivity [19]. Additionally, a predisposition to using new technologies has proven particularly relevant in shaping attitudes toward AI usage [20].
TPB defines perceived behavioral control as the sense of control a person believes they have over performing a behavior, including both internal and external factors [21]. The literature identifies various approaches to this concept, ranging from self-efficacy to perceived control over outcomes [22]. This study considered two factors under perceived behavioral control. The first is the perceived risk of losing control over personal data privacy [10]. The second is the level of knowledge about how GAI works, as technological understanding is key to its effective usage [19].
Subjective norms refer to perceived social pressure to perform a behavior [16]. In the case of GAI, this study considers that it may be shaped by both beliefs about its social benefits and concerns about social risks, such as its use for spreading misinformation [23] and the perception of insufficient regulation to mitigate its potential risks [13].
Based on the previous reflections, this study proposes the following research objectives:
  • RO1: To develop a theoretical framework based on TPB to explain and predict the use of GAI. The proposed theoretical model was tested using a national survey conducted in Spain by Centro de Investigaciones Sociológicas titled “Artificial Intelligence” [15].
  • RO2: To identify the most relevant variables in explaining GAI use.
Unlike conventional empirical applications of technology acceptance and use—which often apply linear-regression-based tools such as Partial Least Squares–Structural Equation Modeling (PLS-SEM)—this study adopts a more innovative approach based on machine learning (ML) techniques, using Decision Tree Regression (DTR) and its extensions: Random Forest (RF) [24] and Extreme Gradient Boosting (XGBoost) [25].
Conventional regression models require assumptions about linear relationships among variables and predefined interaction terms, which may represent mediated influences, as in TAM3 [26], or moderated ones, as proposed in the Unified Theory of Acceptance and Use of Technology (UTAUT) [27]. In contrast, DTR allows for an intuitive representation of nonlinear relationships and the discovery of emergent interactions from data [28], which is especially useful in analyzing behavioral phenomena such as technology acceptance [29,30].
Combining DTR with RF or XGBoost enhanced the predictive power of DTR. Additionally, applying Shapley Additive Explanations (SHAP) [31] enables the interpretation of the relative importance of each variable in RF and XGBoost predictions.

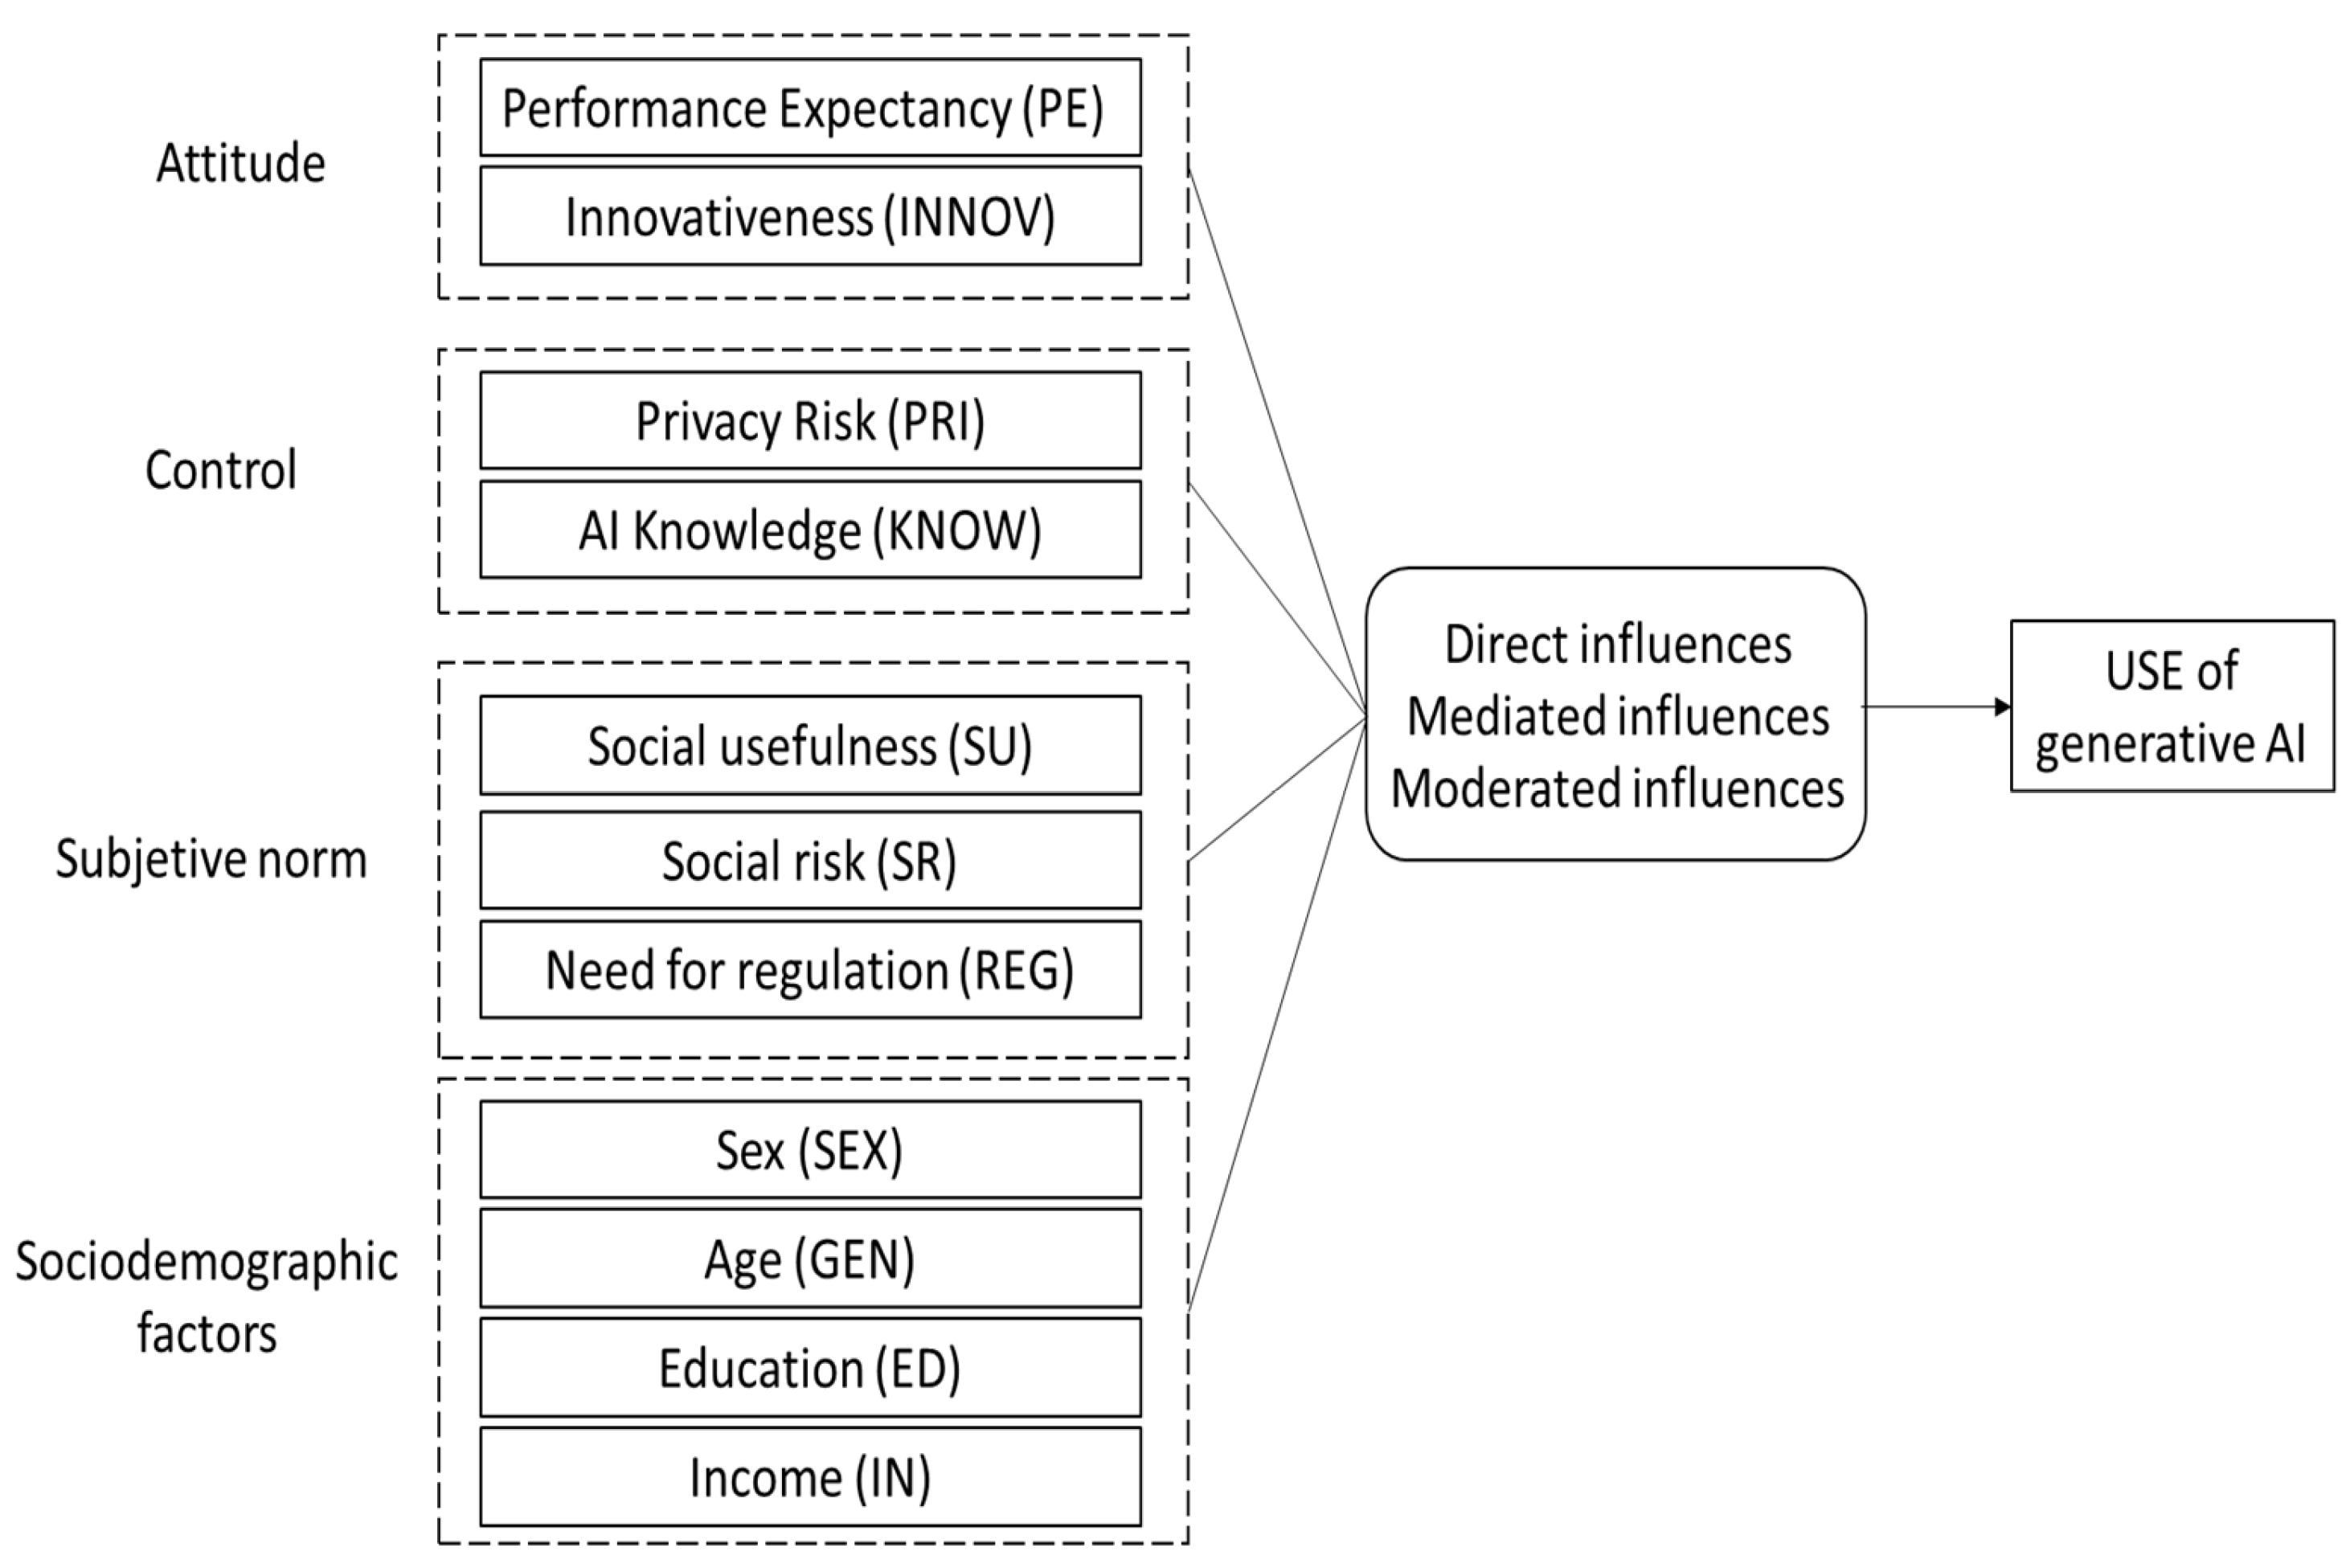
2. Theoretical Background

2.1. Attitudinal Variables

In the field of AI adoption, attitude has been reported as one of the most relevant factors explaining its acceptance and use [17]. One of the main antecedents of attitudes toward new technologies is performance expectancy (PE), which is the belief that using the evaluated technology enables individuals to perform intended tasks more efficiently than traditional methods [32].
GAI is transforming both everyday activities and complex intellectual tasks and has tremendous potential to reshape human life [13]. In daily life, GAI optimizes routine tasks such as home management [33] and healthcare delivery [34]. Beyond daily tasks, GAI significantly enhances intellectual- and knowledge-based work. In the academic domain, it supports researchers and educators by automating repetitive tasks, facilitating data analysis, and assisting in the writing of scholarly articles, thereby allowing professionals to focus on higher-order thinking and creativity [35]. Moreover, GAI tools have been shown to increase productivity and improve work quality in knowledge-intensive fields [36].
Perceived usefulness and perceptions of efficiency and effectiveness have proven particularly relevant in the adoption of AI, and, therefore, GAI [37,38], whether among firm employees [39], in AI-powered products [20], or in educational settings [40,41,42,43]. Thus, we propose the following:
Hypothesis 1 (H1):
Performance expectancy (PE) is positively associated with the use of GAI.
Innovativeness (INNOV) refers to an individual’s willingness to try new technologies [44]. People with higher levels of innovativeness tend to develop more positive perceptions of an innovation in terms of advantages, ease of use, compatibility, etc., and are more likely to express favorable intentions toward its use [45]. When exposed to the same technology, individuals with greater INNOV are more likely to form positive beliefs about its use [44].
Innovativeness has been shown to be relevant to the acceptance and use of AI [20,46], as well as GAI [47]. Therefore, we propose the following:
Hypothesis 2 (H2):
Innovativeness (INNOV) is positively associated with the use of GAI.

2.2. Variables Associated with Behavioral Control

Perceived behavioral control, in the context of GAI, refers to an individual’s perceived ability to use this tool effectively [17]. One consequence of the efficacy of using a technology is its positive impact on perceived ease of use [40], which has been identified as a relevant factor in AI acceptance at work [39], in home environments [20], and in the use of GAI [40,43].
As shown in Figure 1, this study considers two factors within this dimension: the loss of control over personal information, which creates privacy risks (PRIs), and the level of knowledge (KNOW) of users about GAI.
Using the Internet entails risks related to the privacy of digital consumers’ personal data [48]. GAI users are no exception, as they are ultimately online consumers and are thus exposed to these risks. Moreover, these risks are intensified by the inherent characteristics of AI: massive data collection, limited control over reuse, and difficulty in auditing algorithms, all of which increase public concern and regulatory demand [49].
The rapid evolution of AI, particularly generative models, presents significant privacy challenges. GAI systems often operate with large volumes of data, including sensitive information, which increases risks, such as unauthorized identification of individuals or biased, opaque automated decision-making [50]. In particular, unauthorized access—by internal or external third parties—to personal data without consent violates fundamental principles of confidentiality and user autonomy, and may lead to serious consequences such as identity theft or fraud [51].
Empirical findings on the impact of PRI on AI adoption are mixed. While some studies argue that a higher perceived risk discourages the use of AI and GAI [46,52], others find no significant relationship between privacy concerns and GAI acceptance in educational contexts [53]. Therefore, the following hypothesis is proposed:
Hypothesis 3 (H3):
Privacy risk (PRI) negatively impacts the use of GAI.
Prior knowledge about a technology can significantly strengthen users’ perceived self-efficacy, understood as their belief in their ability to effectively use the technology [54]. This psychological component directly influences the perceived ease of use, which is a key determinant of technology acceptance [32]. In fact, ease of use not only affects intention to use directly but also acts as a predictor of perceived usefulness [26,55].
In this regard, prior knowledge of AI (KNOW), whether general education or domain-specific expertise, is associated with more favorable expectations of its usefulness and lower perceived risk [56]. Alshutayli et al. [57] supported this relationship by showing that higher levels of AI knowledge, especially among young people with higher education, enhance acceptance in healthcare contexts. Similarly, in health education settings, lack of AI training hinders adoption among students and professionals, whereas greater understanding promotes acceptance [58,59]. Higher self-efficacy in using GAI has also been shown to foster acceptance [40,43,60]. So:
Hypothesis 4 (H4):
Greater knowledge (KNOW) of GAI leads to its greater use.

2.3. Subjective Norms

Subjective norms, also referred to as social influence in models such as the Unified Theory of Acceptance and Use of Technology (UTAUT) [27], have been extensively reported as a relevant variable for understanding the adoption of AI [20,61] and GAI in both societal [37,47] and industrial [39] contexts, as well as for academic purposes [62,63].
Various sources have highlighted the numerous benefits of GAI for society [8], as well as their significant risks, which must be carefully managed [10]. Among the main positive social utilities (SU) are their potential to increase productivity and improve decision-making in key sectors, such as healthcare, education, and industry [8]. GAI has already been used in medicine to predict health risks and in mining to perform hazardous tasks, reduce costs, and improve operational efficiency [49]. Its capacity to support innovation and solve complex problems is widely acknowledged, contributing to both economic and social development [13]. It supports personalized learning and facilitates inclusive education [7,64].
However, there are substantial social risks (SR) associated with GAI. Economically, several studies have warned that GAI may increase income and wealth inequality. While highly skilled workers may benefit from higher wages, lower-skilled workers face a greater risk of job displacement and unemployment [65], potentially exacerbating existing social divides. Ethically, GAI raises concerns regarding algorithmic bias, transparency, and privacy [10].
Public trust in these technologies has been limited. A study analyzing social media comments revealed that negative emotions such as anger and disgust are prevalent in attitudes toward GAI, with frequent concerns about misinformation, loss of privacy, and existential risks [13]. In education, GAI use may undermine academic integrity more than traditional plagiarism does by enabling undetectable cheating, fostering overreliance, and a lack of collective creativity [11,66]. Therefore, we propose the following:
Hypothesis 5 (H5):
Greater perception of social utility (SU) of GAI leads to its increased use.
Hypothesis 6 (H6):
Greater perception of social risks (SRs) of GAI leads to its decreased use.
The growing perception of the need for regulation (REG) of AI and GAI largely stems from the ethical, social, and legal risks posed by technology and its negative externalities. Its widespread use has sparked concerns regarding privacy, misinformation, security, and algorithmic discrimination [10]. Many individuals lack trust in AI systems, and nearly half of them admit that their automation projects have been slowed by uncertainties regarding the inner workings of these tools [49]. These concerns are especially relevant in GAI systems trained on massive datasets, including potentially sensitive information, increasing the risk of data leaks, or misuse [67,68].
There is also mounting social and political pressure for regulations to ensure principles such as transparency, fairness, data protection, and respect for human rights [13]. The academic community has emphasized that the opacity, potential bias, and audit challenges associated with these models demand urgent measures to protect individual rights and institutional integrity [10,69].
Hypothesis 7 (H7):
Greater perception of the need for regulation (REG) of GAI leads to its decreased use.

2.4. Influence of Sociodemographic Variables

The relevance of variables such as age, work experience (which is related to age), and gender in the adoption and use of technology has been widely acknowledged in adoption models, such as UTAUT and its extensions [27,70]. This study included four sociodemographic variables: gender (SEX), generation (GEN), educational level (ED), and income level (IN).
Sex has strong potential to influence the perception of GAI. Women tend to express higher levels of ethical and privacy concerns regarding these technologies, which may translate into a lower willingness to adopt them than men [71]. This difference is also reflected in self-perceptions of technological competence: men tend to assess their AI skills more positively and trust the technology more, whereas women demand more transparency, understanding, and practical examples before adopting it [72].
Age is another potentially relevant factor for GAI acceptance. Younger individuals are more likely to adopt these technologies, showing more positive attitudes, confidence in their use, and willingness to integrate them into educational or professional environments. By contrast, older individuals tend to express more concern, particularly regarding privacy, transparency, and potential loss of control over automated processes [71]. Trust in AI varies across generations. Digital natives tend to perceive AI as a useful and trustworthy tool, whereas older adults are more cautious or skeptical [73].
Individuals with higher education levels typically demonstrate more favorable attitudes toward GAI, partly because they have more prior technological knowledge and are better equipped to understand how it works and its potential. This positive relationship between education and acceptance has been observed in various academic contexts, where students with advanced training show greater interest in integrating GAI into their work, particularly valuing its practical utility and ability to streamline processes [72]. Moreover, prior training in technology and AI, often included in university curricula, directly influences a more confident and positive perception of these tools [74].
Income level also affects access to and use of GAI. Individuals from higher socioeconomic strata tend to have more resources to access devices, specialized training, and supportive digital environments, which increases their exposure to and familiarity with these technologies [75]. Thus, we propose the following:
Hypothesis 8 (H8):
Men are more likely to use GAI than women.
Hypothesis 9 (H9):
Members of younger generations (Z and Y) are more likely to use GAI than older generations (X and Baby Boomers).
Hypothesis 10 (H10):
Individuals with higher levels of education are more likely to use GAI.
Hypothesis 11 (H11):
Individuals with higher income levels are more likely to use GAI.

3. Materials and Methods

3.1. Sampling

The study was conducted at the national level, targeting a population consisting of residents of Spain of both sexes aged 18 years or older. The sample was designed to include 4000 interviews, with a final total of 4004 interviews conducted [15].
The sampling procedure combined the random selection of landline numbers (17.4%) and mobile phones (82.6%), and individuals were selected using quotas based on sex and age. Strata were defined by the combination of autonomous communities (17 communities and 2 autonomous cities) and habitat size, and classified into seven categories according to population. A total of 1131 municipalities across 50 Spanish provinces were included. The interviews were conducted between February 6 and February 15, 2025.
The sampling error for the total sample was ±1.6%, assuming a 95.5% confidence level and simple random sampling.
The final number of observations used was 3877, with 187 respondents who initially agreed to participate reporting having never heard of artificial intelligence.

3.2. Sample

Table 1 lists the profiles of the samples used in this study. The sex distribution was 1880 men (48.5%) and 1997 women (51.5%). The age distribution, shown in more detail in Table 1, can be approximated by generational groups: 40.6% of participants belonged to Generation Z and Y (aged up to 44), while 59.4% were from Generation X and the Baby Boomer generation (aged 45 or older). The average age of the participants was 49.60 years, with a standard deviation of 15.91 years.
The vast majority of respondents (91.3%, or 3540 individuals) reported exclusively Spanish nationality.
Regarding educational attainment, 16.1% (624 respondents) had completed no more than a primary education, 57.2% (2218) had secondary or vocational training, and 26.7% (1035) held a university degree.
As for income levels, Table 1 shows that 989 individuals (25.5%) reported net monthly incomes of up to EUR 1200, whereas 651 (16.8%) earned between EUR 1201 and EUR 1800. A total of 1101 respondents (28.4%) earned between EUR 1801 and EUR 3000 and 597 (15.4%) earned between EUR 3001 and EUR 4500. Finally, 357 individuals (9.2%) reported earning more than EUR 4500 per month, while 151 (3.9%) chose not to disclose their income.

3.3. Measurement of Variables

The variables used in this study were measured using items from a survey [15]. The items and scales used are listed in Table 2. Regarding the response variable, participants indicated the frequency of use of various GAIs (e.g., ChatGPT, Gemini) on a 6-point scale.
The explanatory variables related to attitude (PE and INNOV) consisted of multiple items measured on a 10-point scale. The variables associated with perceived behavioral control include PRI, which comprises five items assessed on a 4-point Likert scale, and KNOW, which is measured through a single item using a 10-point Likert scale.
The variables corresponding to subjective norms were also multiple items. SU includes three items with a 3-point response scale, while SR and REG consist of four and five items, respectively, measured on 5-point scales.

3.4. Data Analysis

3.4.1. Operationalizing the Variables

The operationalization of the variables used for the quantitative analysis of RO1 and RO2 is detailed in Table 2. Regarding the outcome variable, the intensity of GAI use was better captured by the frequency of use than by the number of tools used. A person may use a single GAI intensively, whereas another may occasionally use it. In this case, the former exhibited higher intensity of use. Accordingly, for each individual, the usage intensity is defined as follows:
USEINT = Max{USE1, USE2, USE3, USE4, USE5}
Finally, USE is the standardized value of USEINT.
For multi-item variables (PE, INNOV, PRI, SU, SR, and REG), the standardized value of the first principal component, extracted using varimax rotation, was employed. This extraction was justified if factor loadings exceeded 0.6, the average variance extracted was at least 50%, and the null hypothesis of the correlation matrix’s sphericity was rejected using Bartlett’s test.
For single-item variables measured on multi-point scales (KNOW, ED, and IN), standardized values were used.
As shown in Table 2, SEX and GEN are dichotomous variables. SEX distinguishes between men and women (1 = woman), whereas GEN classifies individuals by generation (0 = Generations Z and Y; 1 = Generation X and Baby Boomers).
The principal component analysis was conducted using in R 4.5.0 with the tidyverse and factoextra libraries.

3.4.2. The Use of Machine Learning Instruments to Assess Drivers of GAI Use

We begin by establishing the direction of the relationship between USE and the explanatory variables using Spearman correlations, and by estimating the model presented in Figure 1 using linear regression. These analyses allow us to empirically verify whether the direction and significance of the relationships proposed in Section 2 are supported. Additionally, linear regression serves as a benchmark for assessing the ability of ML methods to fit the proposed model.
Subsequently, to address RO1, we fit a DTR and its generalizations, RF and XGBoost, using the full sample. Model fit was assessed using the coefficient of determination (R2), root mean squared error (RMSE), and mean absolute error (MAE). Although RF [24] and XGBoost [25] are expected to yield substantially higher R2 values, DTR provides a clear visual representation of how threshold values for explanatory variables direct observations toward lower-level nodes. For instance, if a node splits under the condition X < Xa, leading to nodes associated with lower usage, the relationship between USE and X is interpreted as increasing. Conversely, if the condition is X > Xa, USE is considered to decrease with X. Surrogate splits will also be of interest, as they help infer the sign of the relationship for explanatory variables that are not primary split criteria, but may act as substitutes. In this step, we also conducted a preliminary analysis of the predictive performance of the machine learning methods and linear regression using a holdout validation test. Evaluating predictive power is essential for theory development and validation as well as for selecting models to support decision-making in management and policy [76]. The evaluation was based on three performance metrics: Stone–Geisser’s Q2, root mean squared error (RMSE), and mean absolute error (MAE), and randomly splitting the sample into 80% training and 20% testing sets. This approach provides an initial comparison of the out-of-sample predictive capabilities of each method.
Third, to develop RO2, we first conduct a deeper comparison than in RO1 of the predictive capacities of the three tree-based methods by using Monte Carlo cross-validation. The performance of methods was again assessed using Stone–Geisser’s Q2, RMSE, and MAE. To test the significance of the differences among the methods, an ANOVA was conducted to examine the homogeneity of the RMSE and MAE across the three models. For pairwise comparisons, paired-sample Student’s t-tests were applied with Tukey’s adjustment for p-values. A total of 500 simulations were conducted by randomly splitting the sample into 80% training and 20% testing sets. Finally, we determined the explanatory importance of each variable using the SHAP method [31], applied to the ML method with the highest predictive performance.
All analyses were conducted in R 4.5.0 using various libraries. The rpart and rpart.plot packages were used to fit and visualize the decision tree. The randomForest library was used for RF and xgboost for the XGBoost model. Monte Carlo cross-validation was implemented using the caret, dplyr, and tibble packages. Finally, SHAP analysis was performed using the iml package.

4. Results

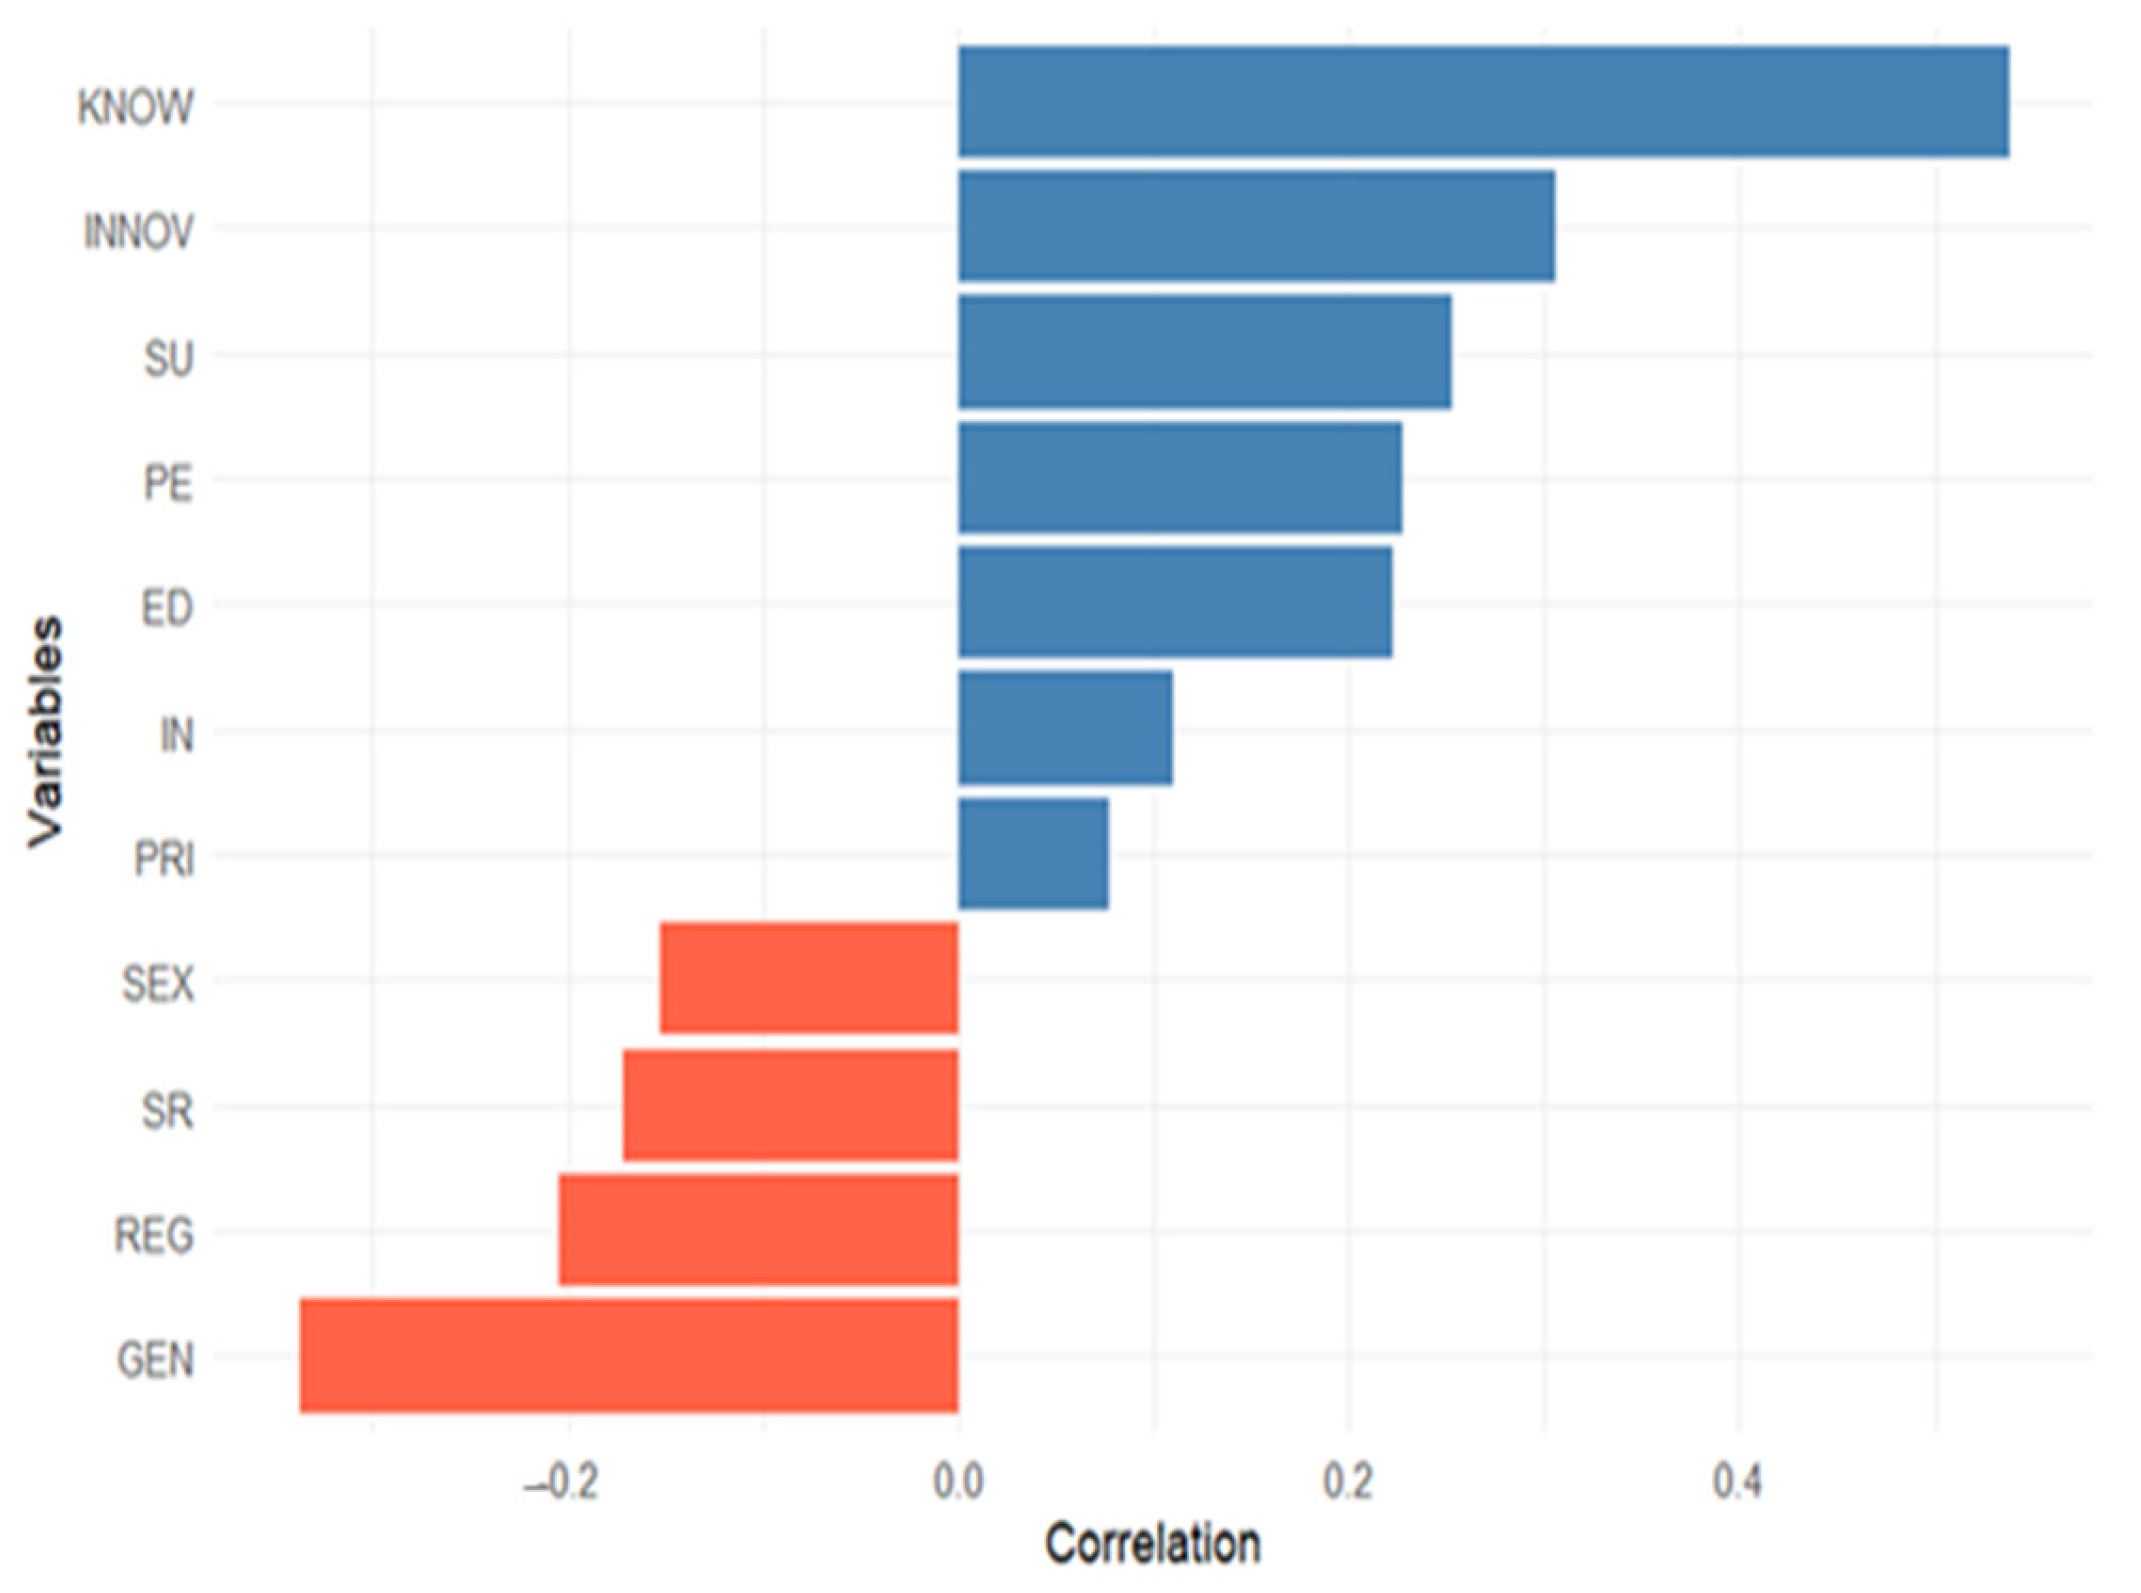
4.1. Descriptive Statistics and Linear Regression Estimation

Table 3 presents descriptive statistics for the items included in the study. Among generative AI (GAI) tools, ChatGPT in any of its versions is the most widely used. The average value of the variable aggregating usage frequency across all tools (USEINT) is 1.87, which, according to Table 2, corresponds to usage between “once” and “several times a year”.
Notably, the items related to performance expectancy (PE) showed high evaluations, with values ranging from 6.28 to 7.88 on a 10-point scale. In contrast, self-reported knowledge (KNOW) had a mean score of only 4.26 out of 10. The average score for items capturing perceived societal benefits (SU) did not reach a neutral value of 2 on a three-point scale. Conversely, the items addressing perceived societal risk (SR) range from 3.57 (SR4) to 4.37 (SR1), exceeding the neutral value of 3, indicating a generalized perception of risk. Finally, the items with perceived need for regulation (REG) scores above 4 reflect a predominantly favorable opinion toward the regulation of AI development and use.
All factor extractions for the multi-item variables (PE, INNOV, PRI, SU, SR, and REG) exceed the 0.6 loading threshold, and the first principal component in each case explained, on average, more than 50% of the variance, supporting the reliability of the measurement constructs.
Using the variable values defined in Table 2, Spearman correlations with the USE were computed, and all were statistically significant (p < 0.001). These values are shown in Figure 2. As expected, PE, INNOV, KNOW, SU, ED, and IN showed positive correlations with GAI use, whereas perceived societal risks (SRs) and the need for regulation (REG) were negatively correlated. Additionally, the negative correlations between SEX and GEN suggest that older generations and women are less inclined to use GAIs. Interestingly, the correlation for privacy risk perception (PRI), although weakest, is positive. Thus, the Spearman correlations support all the hypotheses proposed in Section 2, except H3, which predicts a negative correlation between PRI and USE.
Regarding the linear regression estimation, whose results are shown in Table 4, the results closely align with the Spearman correlations, with the notable exception that societal risk (SR) is not statistically significant. The model fit is acceptable, with an R2 of 39.12%, indicating moderate explanatory power. The regression analysis shows that KNOW is by far the most influential predictor of usage (β = 0.709, η2 = 0.2494, p < 0.001), underscoring its central role in GAI adoption. Other relevant positive predictors include INNOV (β = 0.228), ED (β = 0.199), and SU (β = 0.140), all statistically significant with moderate-to-small effect sizes.
In contrast, GEN and SEX show significant negative effects (β = –0.730 and β = –0.156, respectively), suggesting that being female may act as a barrier to adoption. Additionally, REG (β = −0.153, p < 0.001) negatively predicts usage, indicating that regulatory concerns may discourage engagement with GAI tools. Other variables, such as PE, PR, and IN, exhibit small but statistically significant positive effects. In summary, the results from linear regression support all the proposed hypotheses except H3 and H6, which were not statistically significant.

4.2. Results of Research Objective 1

Table 5 and Figure 3 present the results of the DTR. The variable that appears most frequently as the primary splitting condition is KNOW, which is present in two instances. The variables GEN, SU, and REG also appear once each. In all cases, their participation aligns with the expected direction of their relationship with USE. For KNOW and SU, the conditions leading to nodes associated with lower GAI use involved values below the respective thresholds. In contrast, for REG, these conditions require values above the threshold. Additionally, at Node 5, being part of an older generation (GEN = 1) led to nodes associated with lower GAI use, which is also consistent with H8.
The role of variables as surrogate splitters in intermediate nodes provides valuable insights, particularly for interpreting the relationship between explanatory and dependent variables when a given explanatory variable does not appear as a primary condition in any node. Thresholds for INNOV and PE (nodes 1, 2, 3, 5, and 7), KNOW (node 7), SU (nodes 1, 2, 5, and 7), and ED (nodes 1, 2, and 5) function as maximum values for reaching branches associated with lower GAI use or, alternatively, minimum values for reaching terminal nodes associated with higher use, consistent with their expected positive correlation with USE. Similarly, accessing nodes of lower use implies being at least 45 years old (GEN = 1) in nodes 2, 3, and 7, and having high values of REG (nodes 1, 3, and 4) also leads to lower usage, which aligns with the hypothesized negative relationship.
In contrast, PRI and SR did not exhibit unidirectional relationships with the USE. For PRI, thresholds serve as maximum values to access higher-use nodes in nodes 2 and 3, supporting the expected negative relationship. However, in nodes 1 and 4, the same thresholds led to lower-use nodes, aligning with the Spearman correlation but contradicting H3. A similar pattern is observed for SR: while thresholds act as maxima, leading to higher-use nodes in nodes 3 and 7 (supporting H6 and the Spearman correlation); in node 2, the threshold leads to a lower-use node, suggesting a positive, rather than negative, relationship.
It is also noteworthy that SEX and IN do not appear as primary or surrogate conditions in any node of the decision tree.
In summary, the interpretation of the DTR results supports H1 (PE), H2 (INNOV), H4 (KNOW), H5 (SU), H7 (REG), H9 (GEN), and H10 (ED). However, they did not support H3 (PRI), H6 (SR), H8 (SEX), or H11 (IN).
Table 6 shows the goodness of fit for the linear regression, DTR, Random Forest (RF), and XGBoost models using the full sample. The two generalizations of DTR clearly outperform the basic model and also linear regression: while DTR achieves an R2 of 32% and linear regression of 39.12%, both RF and XGBoost reach an R2 of 92%. However, this does not mean that RF or XGBoost is preferable in all respects. Instead, they should be viewed as complementary methods. While RF and XGBoost maximize adjustment performance by aggregating multiple trees, DTR offers a clear and interpretable visual representation, which is highly valuable for understanding the structure of the relationships between explanatory variables and the dependent variable.
Table 7 presents the results of the predictive performance tests for the models across different metrics. The Q2 statistic, which shows values greater than zero for all models, suggests that the model developed in Section 2 has predictive capability regardless of the fitting methodology used.
In the holdout validation test shown in Table 7, we observe that RF is the machine learning method with the best predictive performance. It also outperforms linear regression across all metrics. It is also worth noting that linear regression shows better predictive metrics than DTR and XGBoost, although its performance is clearly inferior to that of Random Forest.

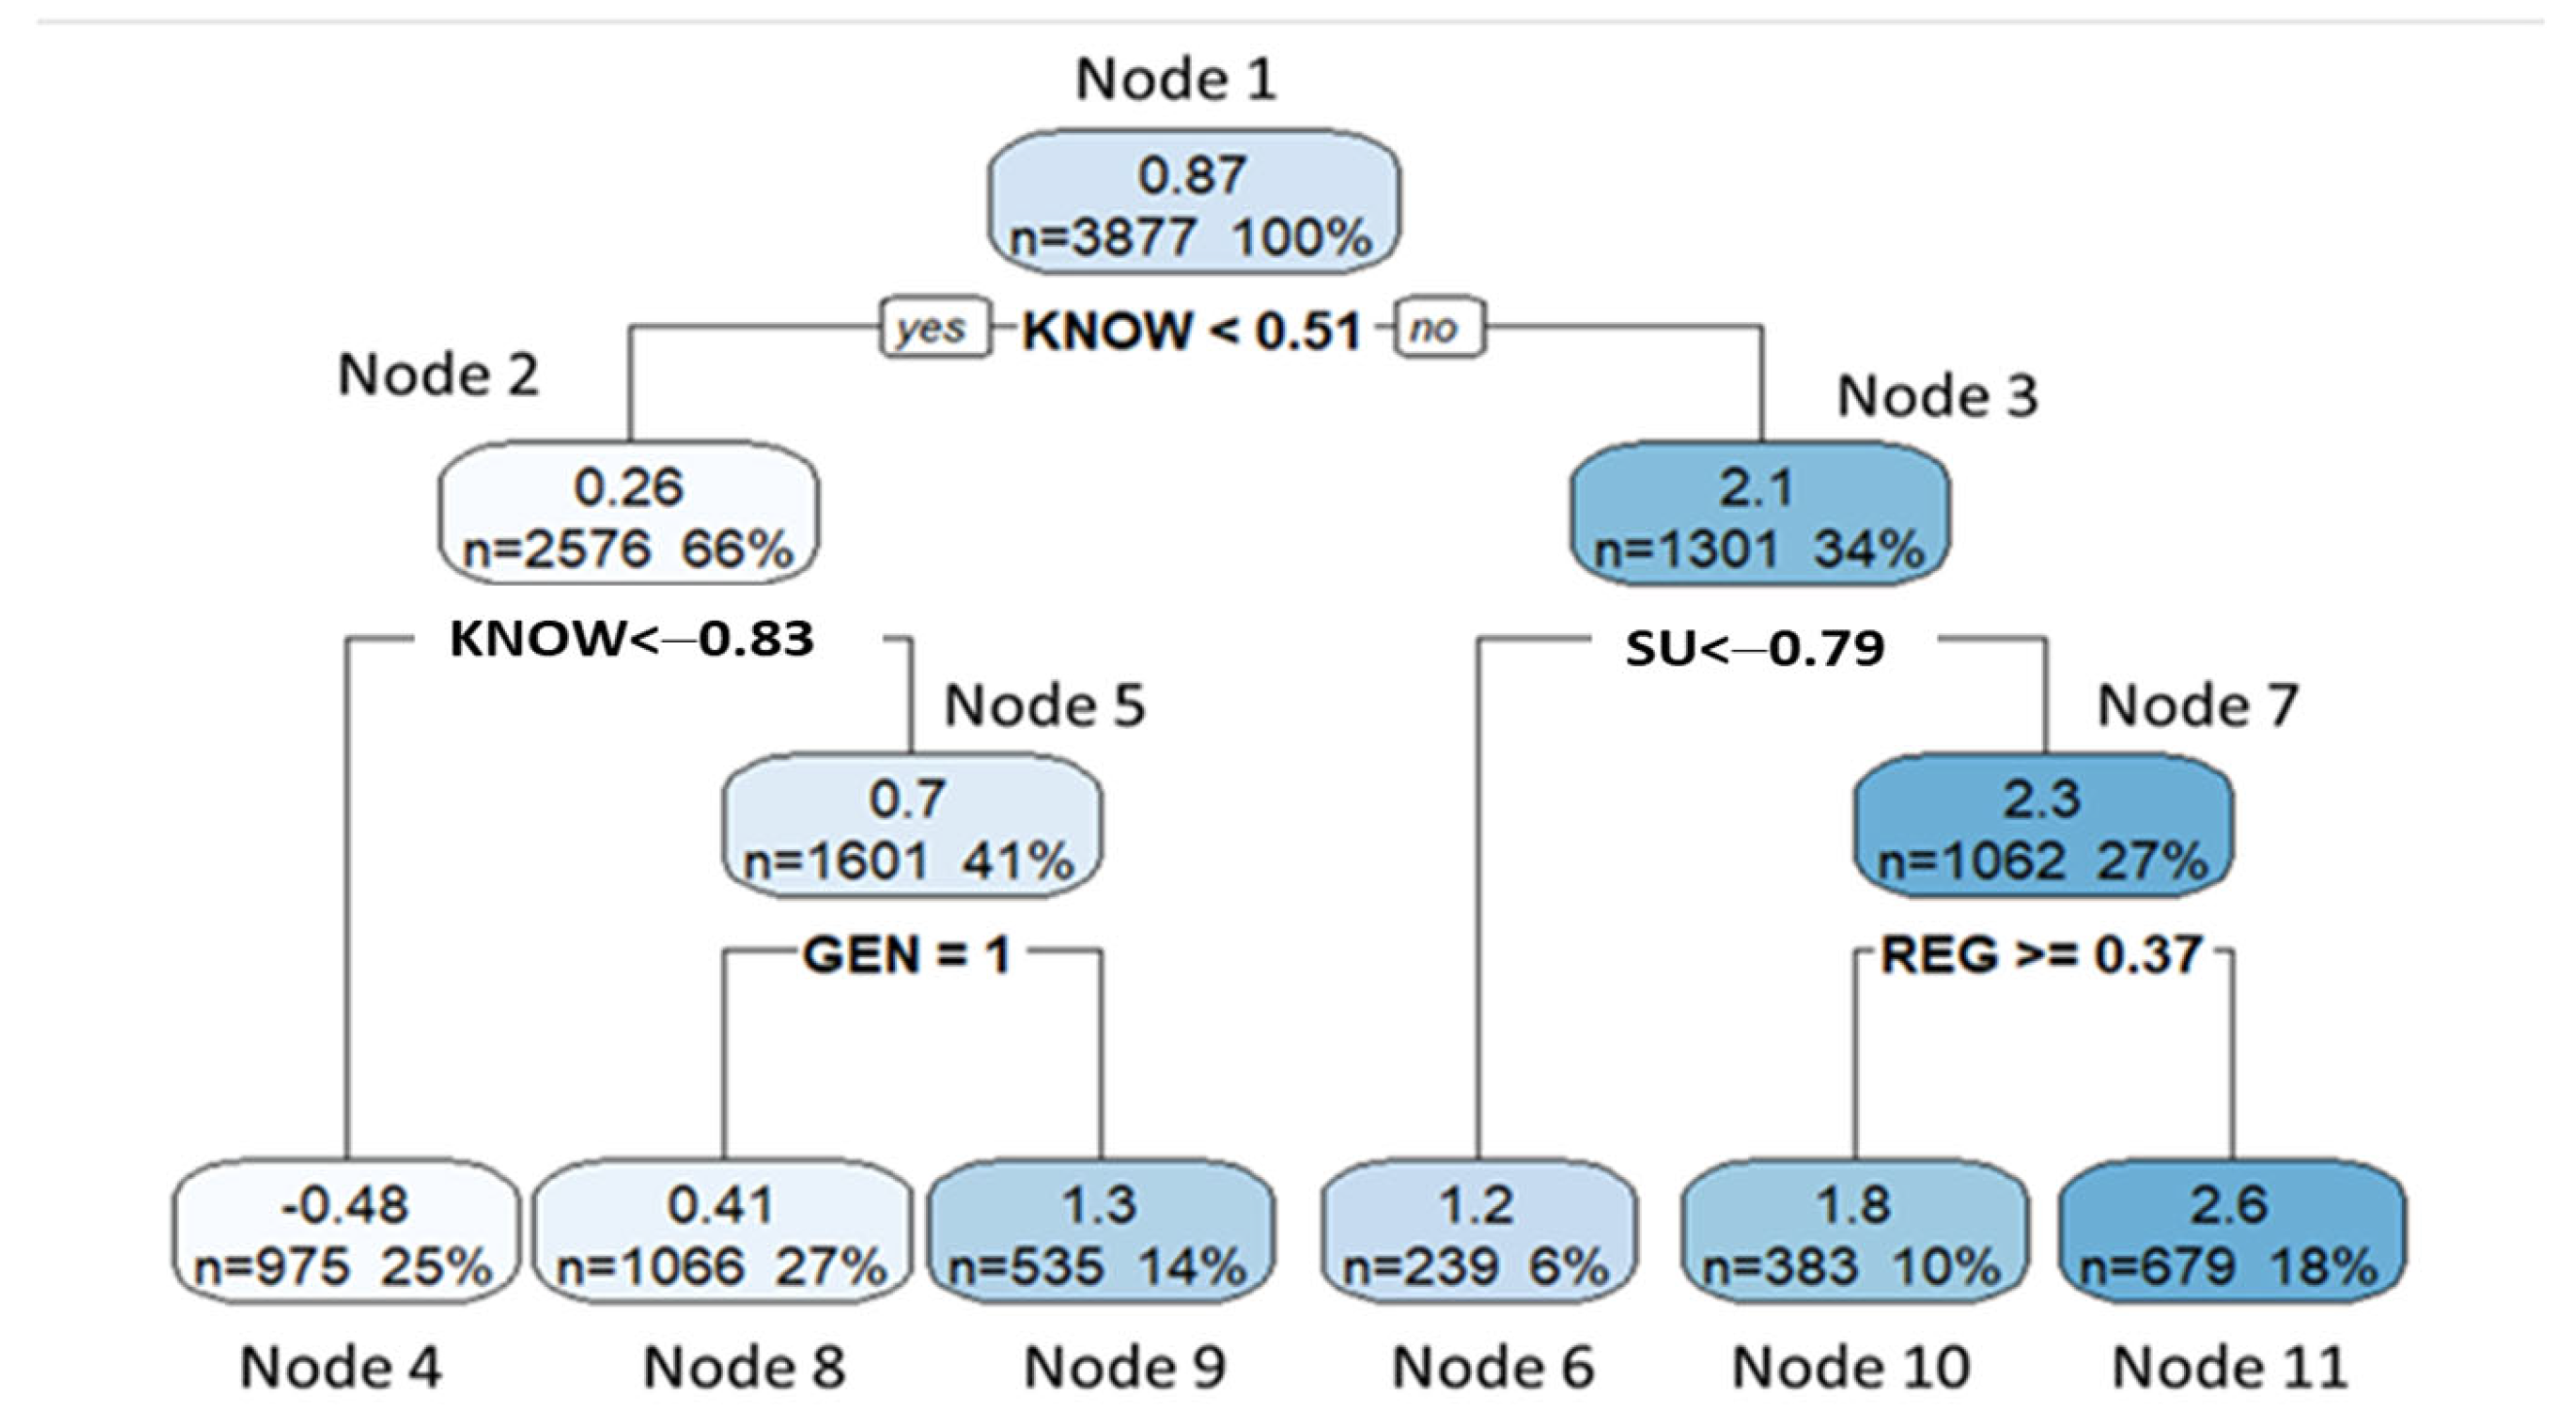
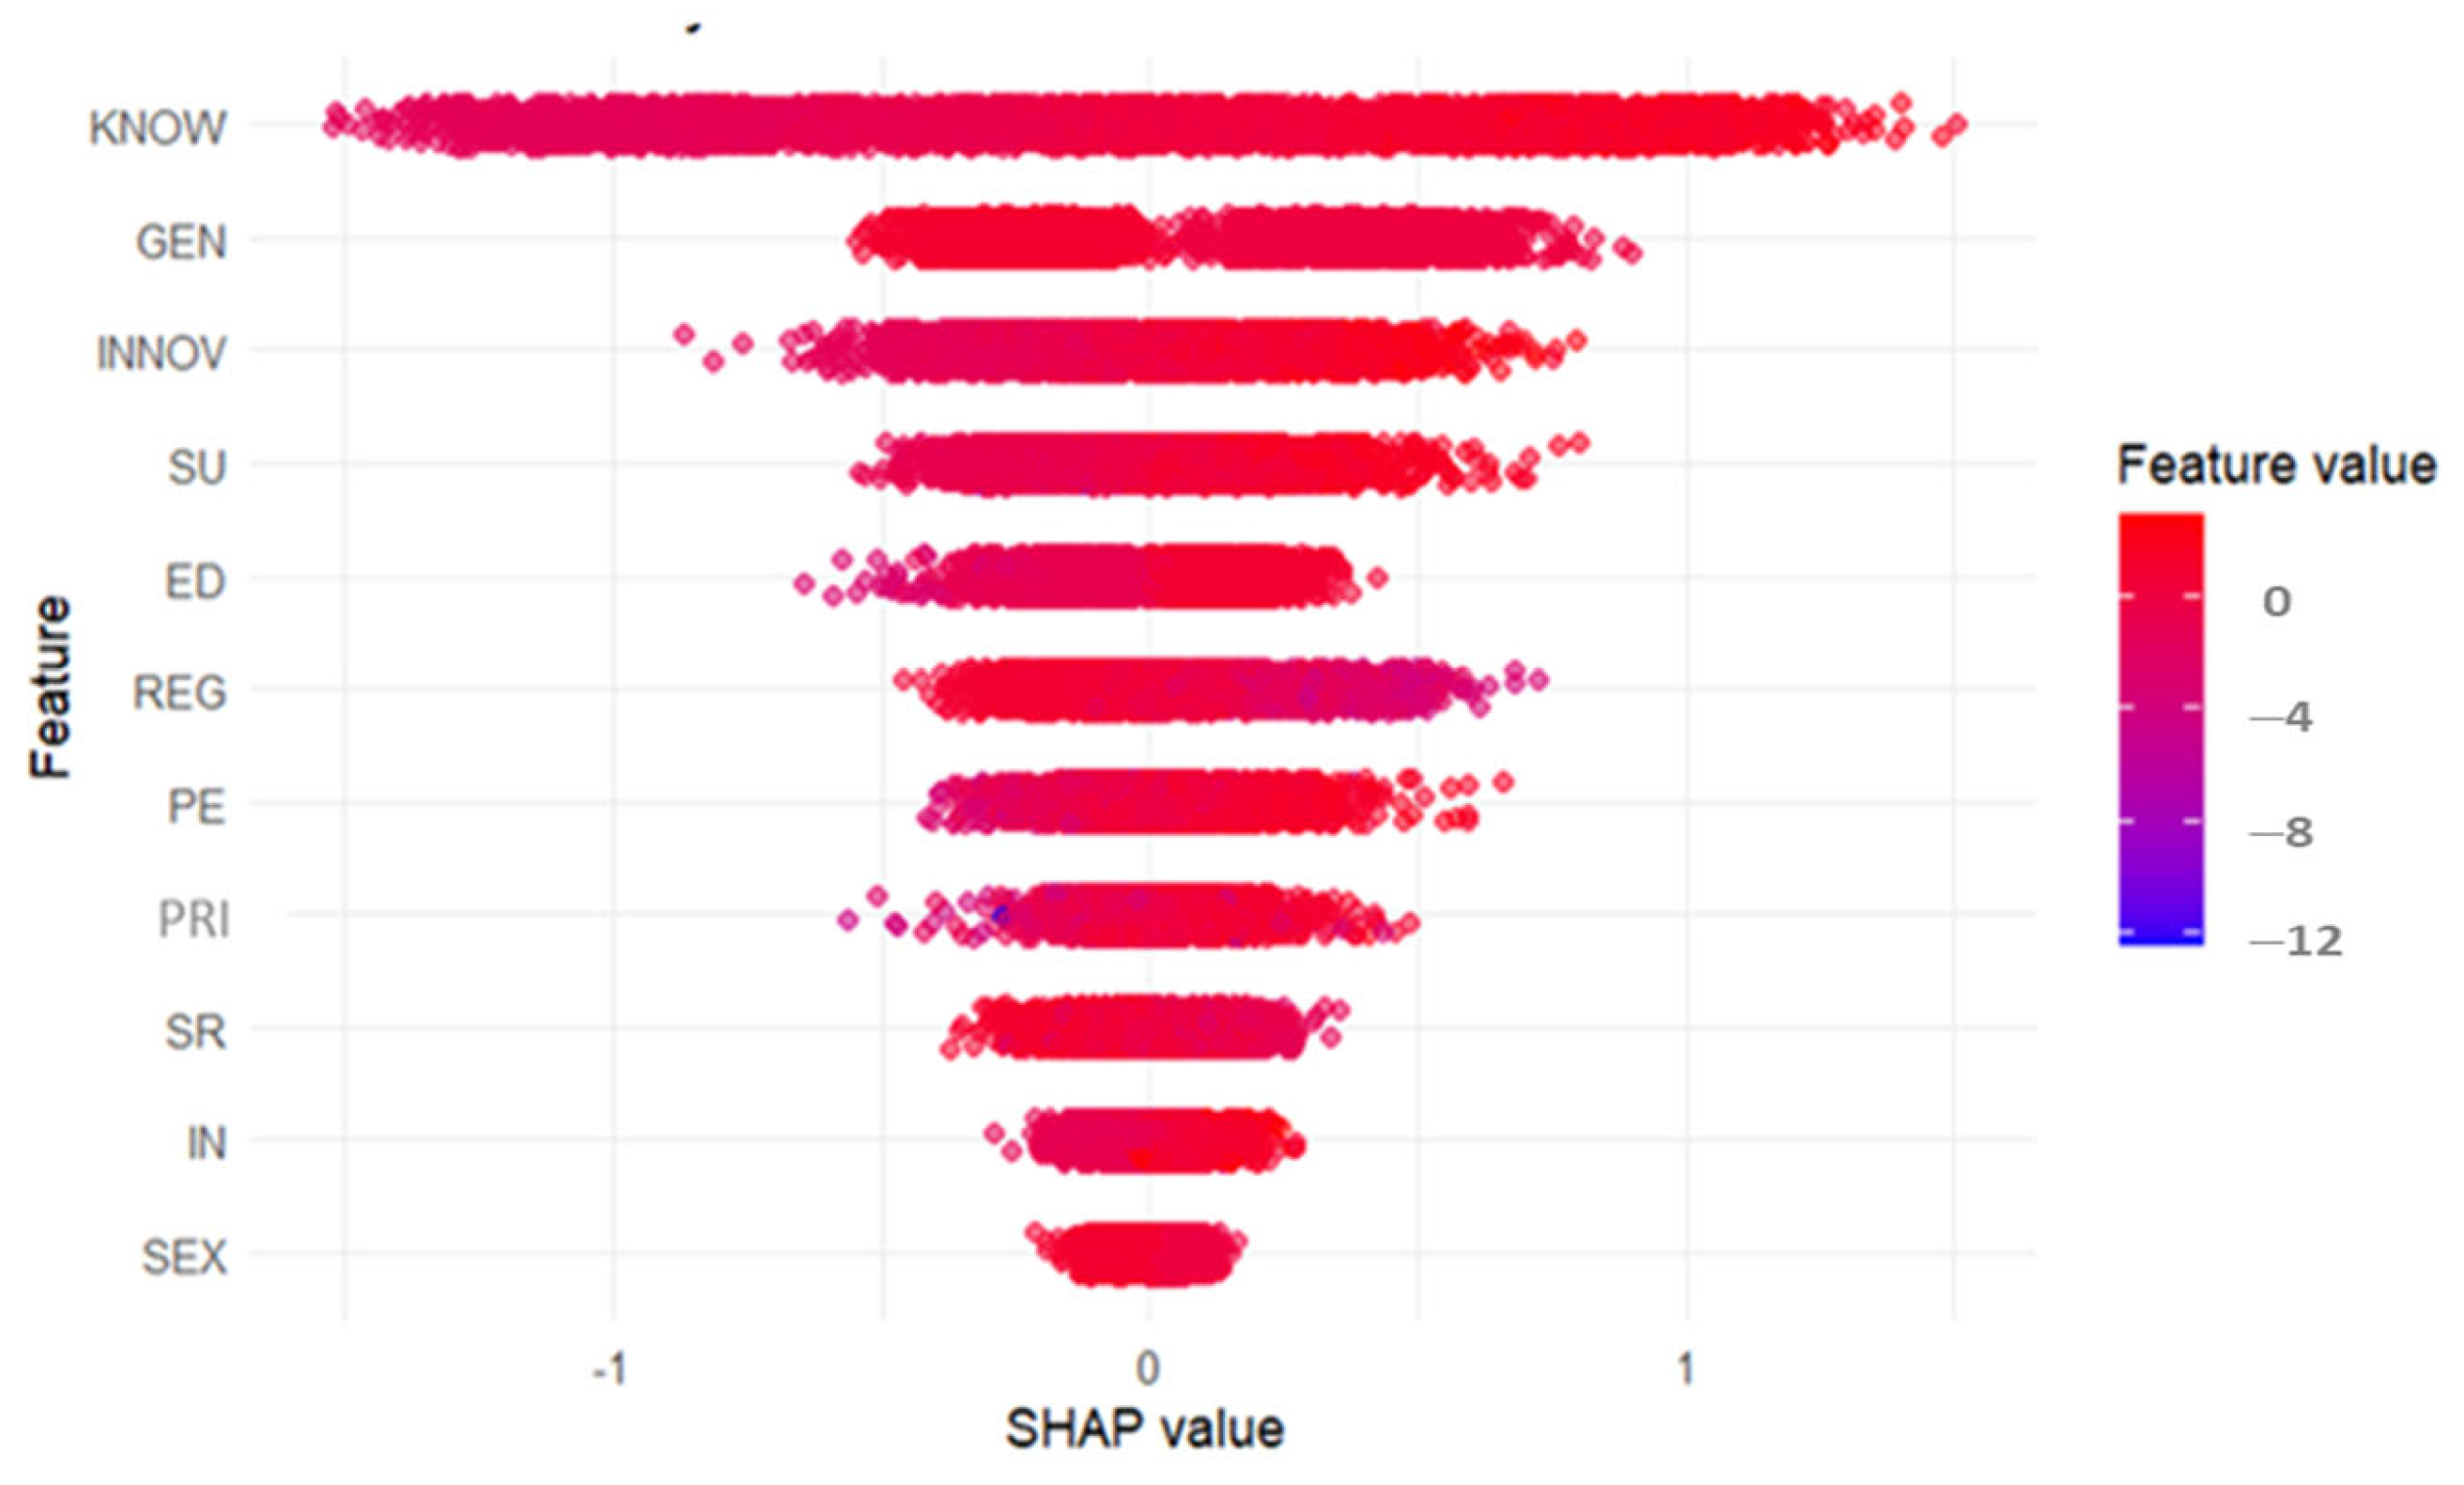
4.3. Results of Research Objective 2

The results presented in Table 7 suggest that Random Forest (RF) is the decision-tree-based method with the highest predictive power. A more insightful evaluation was conducted through a Monte Carlo cross-validation, as shown in Table 8, which further confirms that RF is the machine learning method with the greatest predictive capability. Indeed, the ANOVA applied to RMSE and MAE values allows us to reject the null hypothesis of equal mean errors across the three tree-based methods evaluated in the study.
Table 9 provides a pairwise comparison of average error metrics, showing that RF significantly outperforms the other alternatives, regardless of whether RMSE or MAE is used as the evaluation criterion. It is also worth noting that no conclusive difference was observed between Decision Tree Regression (DTR) and XGBoost in terms of predictive performance: while DTR performed better according to RMSE, XGBoost showed superior performance based on MAE.
Therefore, RF was selected as the reference model for computing SHAP values for the explanatory variables.
Figure 4 shows the SHAP summary beeswarm plot, which displays the individual impact of each explanatory variable on every prediction made by the RF algorithm to USE. The variables are ordered from top to bottom according to their average importance. The variable KNOW stands out as the most influential, followed by GEN and INNOV. In these cases, a clear pattern emerges: high values of these variables tend to be associated with positive contributions to the prediction, while low values generally exert a negative effect. This suggests that, for example, higher KNOW values lead to higher predicted levels of USE.
The variables SU, ED, and REG also show a relevant, though smaller, contribution. In contrast, variables such as PE, PRI, SR, IN, and especially SEX have limited predictive influence, as indicated by their reduced horizontal spread. Overall, the plot reveals not only which variables are most important to the model, but also how different values of each one affect the prediction, capturing nonlinear relationships and interaction effects that would remain hidden in traditional approaches like linear regression.
Table 10 presents the mean of absolute values of SHAP obtained by fitting the model in Section 2 using the RF and also the 95% confidence interval. Notice that by considering the absolute value, we are interested in the size but not the sign of the relationship of every explanatory variable with USE, and so it can be assimilated to the effect size of the relationships in the regression analysis in Table 4. When considering the average value, we focus on the average importance of each variable in the whole sample. The similarity between the mean absolute SHAP values and the effect sizes obtained from the linear regression is reinforced by the fact that the Spearman correlation between the effect sizes of the variables on USE and their mean absolute SHAP values is 0.872.
The most important variable is KNOW, as it exhibits the highest average SHAP value. This finding is consistent with the fact that the KNOW has the highest absolute Spearman correlation and serves as the primary splitting variable in the largest number of branches in the DTR, as shown in Figure 3. It is noteworthy that INNOV appears to be the third most important variable despite not serving as a primary splitter in any node. However, this is understandable given that it has the second-highest Spearman correlation and effect size in linear regression and appears as a surrogate condition in all non-terminal nodes of the DTR model represented in Figure 3.
The fact that the variables SEX and IN do not appear as either primary or surrogate splitters in the DTR is consistent with their position as the least important variables in the SHAP ranking, as shown in Table 8.

5. Discussion

5.1. General Issues

This study, framed within the Theory of Planned Behavior (TPB), analyzes data from a national survey conducted in Spain by the Centro de Investigaciones Sociológicas (Sociology Research Centre) [15], focusing on the perception and use of generative artificial intelligence (GAI). To this end, advanced machine learning techniques were applied. This study had two main objectives. The first (RO1) was used to assess the validity of the proposed theoretical model for fitting the sample data and predicting the observed behavior.
The results show that combining Spearman correlations with machine learning models such as decision trees (DTR) and their extensions (RF and XGBoost) not only enables the visualization of interactions between explanatory variables, but also allows for the explanation of approximately 95% of the variance in the dependent variable. Furthermore, the model demonstrated predictive capacity, regardless of the fitting methodology used. However, RF emerged as the model with the highest predictive power.
The application of SHAP values to the best-performing model (Random Forest) enabled the identification of the most influential factors in explaining GAI use, addressing RO2. The main drivers, in order of importance, are knowledge about technology (KNOW), innovativeness (INNOV), membership in older generations (GEN), and perceived usefulness, both in social utility terms (SU) and in terms of performance expectancy (PE).
Conversely, factors such as the perceived need for stricter regulations, negative societal externalities, and privacy risk perception show lower relevance. Additionally, sociodemographic variables such as education level, income, and gender have a limited influence in predicting GAI use.
The finding that KNOW is the most important variable reinforces existing evidence of its relevance to AI adoption—not only in domains such as healthcare [58,59] and education [40,43,60], but also across diverse cultural contexts, including Abu Dhabi [40], Taiwan and Indonesia [43], Germany [60], and India [59].
In the field of AI adoption, attitude has been consistently reported as a key determinant of acceptance and use [17], which supports the strong role of INNOV, the significance of which has been observed in multiple empirical studies in countries such as Germany [20], Israel [46] and Croatia [47]. This also helps explain the notable relevance of PE, consistently confirmed across various GAI application contexts [37,38,39,40,41,42,43], including regions and countries such as Southern Europe [37], Germany and Poland [38,42], Abu Dhabi and Saudi Arabia [40,41], and Southeast Asia [43].
The strong impact of SU and REG, both related to subjective norms, is consistent with the idea that societal perceptions of AI use are important for understanding its acceptance, as shown in previous studies placed in different cultural context such as Germany [20], Croatia [47], Arabia Saudi [62], or Poland and Egypt [63].
The results concerning privacy risk perceptions were unexpected. In our sample, privacy risk showed a positive correlation with USE in bivariate analysis and appeared as both a positive and negative predictor in the DTR. This suggests that privacy concerns may not be a significant determinant of GAI adoption, a finding echoed in the context of higher education in South Korea [53]. It is also plausible that individuals with greater AI knowledge are more aware of privacy risks but weigh anticipated benefits more heavily. Socially, a similar pattern emerges: perceived social usefulness is valued more than perceived societal risks or the need for regulation.

5.2. Theoretical and Analytical Implications

From a theoretical standpoint, this study validates the applicability of TPB as an explanatory model of digital behavior in the context of GAI, as previously shown in [17]. The use of Random Forest and XGBoost enables model fitting with over 90% accuracy, while also providing strong predictive power.
The three dimensions of the TPB provide empirical support, albeit with uneven importance. Attitude (operationalized via INNOV), perceived behavioral control (via KNOW), and belonging to younger generations are stronger predictors than subjective norms (SU, SR, and REG), suggesting that GAI usage is influenced more by internal factors than by social pressures.
Analytically, the use of non-parametric methods such as decision trees and their extensions allows alternative analytical perspectives to traditional linear models, especially useful in technological adoption, which is mediated by nonlinear relationships and complex interactions. Implementing the SHAP measure in the best predictive method (RF) enables a transparent decomposition of each variable’s impact on model predictions, providing a methodological contribution that can be replicated in future research on technology acceptance. The robust model fit (R2 > 90% in RF and XGBoost) strengthened the validity of the findings.
One of the most interesting theoretical findings was the central role of KNOW as the main predictor of GAI use. This suggests that perceived self-efficacy and technological familiarity carry more weight than do concerns about social risks or formal education levels. Similarly, the high relevance of INNOV, despite not being a primary split in the DTR, reinforces the idea that individual dispositions toward innovation act transversally in the adoption of new technologies.
Also noteworthy is the lack of influence of traditionally relevant variables, such as gender and income, which did not appear as either primary or surrogate conditions in the DTR models. This calls for a re-evaluation of the centrality of these variables in classical digital divide models, at least in the specific context of GAI.

5.3. Practical Implications

From a practical standpoint, the findings of this study offer clear guidance for designing interventions and public policies that promote responsible and equitable use of GAI. The importance of knowledge suggests that educational and digital literacy campaigns may be the most effective tools for increasing use, especially among older individuals or those with less prior exposure.
Additionally, the strong influence of innovativeness implies that communication strategies should emphasize the disruptive and transformative potential of these tools and present them as opportunities for personal and professional growth. The limited impact of gender and income suggests that barriers to GAI use are not primarily structural but rather linked to individual skills and motivation.
This study strongly supports the integration of GAI-related content into secondary and higher education curricula in the education sector. It also recommends including GAI tools in adult education programs to promote digital inclusion for groups less exposed to emerging technologies.
On the other hand, societal risk perception and the perception of a need for regulation (REG) do not clearly inhibit usage but do appear as significant variables in the models. This indicates that social acceptance of GAI also depends on ensuring its ethical and transparent use. Therefore, institutions should accompany technological development with clear regulations that protect citizens’ rights and minimize undesirable effects, such as misinformation, bias, or privacy violations.
Finally, the predictive capacity of the models developed in this study can be leveraged by both public and private organizations to better segment users, anticipate their needs, and design personalized services. For example, public administrations can use these models to identify profiles with a low likelihood of use and target them with specific training or access programs.
In short, the study provides not only a theoretical understanding of GAI use but also practical tools for its effective and equitable implementation in Spanish society.

6. Conclusions

This study concludes that GAI usage in Spain is determined by a combination of individual (such as knowledge and openness to innovation) and contextual factors (such as perceived usefulness and regulation). The methodological robustness and sample size lend credibility to these findings, which not only validates the TPB as an explanatory framework but also offers new insights into the role of sociodemographic variables.
The minimal influence of gender and income in the models invites a reconsideration of traditional assumptions about the digital divide, whereas the central role of knowledge underscores the need for educational policies.
This study has some limitations. First, it relies primarily on existing research and technical documents, which may overlook recent empirical evidence on the direct impact of regulation in specific contexts. Second, the sample is exclusively based in Spain, potentially limiting the generalizability of the findings to regions with different regulatory frameworks. However, it is worth noting that our discussion highlights that several of our findings are consistent with those reported in other cultural settings. Finally, the rapid technological evolution of AI models creates a persistent gap between regulation and emerging technical capabilities. Therefore, gaining insightful knowledge about how generative AI is adopted requires longitudinal studies that capture the different phases of technology implementation.
Future research should include empirical studies analyzing how different social groups (e.g., users, developers, and legislators) perceive the effectiveness of current regulations. It would also be valuable to study the impact of differentiated regulatory frameworks on countries with varying levels of technological development. Another promising direction is to explore hybrid governance models that combine formal regulation with self-regulation mechanisms, and open participatory algorithmic auditing tools. These lines of research may enhance the understanding of GAI adoption and trust, while contributing to the creation of a more ethical, inclusive, and secure technological ecosystem.

Author Contributions

Conceptualization, A.P.-P. and M.A.-O.; methodology, A.P.-P. and M.S.-R.; software: J.d.A.-S.; validation: M.A.-O.; formal analysis: A.P.-P.; investigation. A.P.-P. and M.A.-O.; resources, M.S.-R.; data curation, J.d.A.-S.; writing—original draft preparation, A.P.-P. and J.d.A.-S.; writing—review and editing, M.S.-R.; visualization, J.d.A.-S.; supervision, M.S.-R.; project administration, M.A.-O. and M.S.-R.; funding acquisition: J.d.A.-S. and M.A.-O. All authors have read and agreed to the published version of the manuscript.

Funding

This research was supported by Telefonica and the Telefonica Chair on Smart Cities of the Universitat Rovira i Virgili and Universitat de Barcelona (project number: 42. DB.00.18.00).

Data Availability Statement

The original data presented in the study are openly available at https://www.cis.es/es/detalle-ficha-estudio?origen=estudio&codEstudio=3495 (accessed on 2 May 2025).

Conflicts of Interest

The authors declare no conflicts of interest.

Abbreviations

The following abbreviations are used in this manuscript:
AIArtificial Intelligence
GAIGenerative Artificial Intelligence
ROResearch Objective
DTRDecision tree regression
RFRandom Forest
XGBoostExtreme Gradient Boosting
TPBTheory of Planned Behavior
TAMTechnology Acceptance Model
UTAUTUnified Theory of Acceptance and Use of Technology
PEPerformance expectancy
INNOVInnovativeness
PRIPerceived privacy risk
KNOWKnowledge
SUSocial utilities
SRSocial risk
REGNeed for regulation
SEXSex
GENGeneration (X and Baby Boom)
EDEducation level
INIncome level
SHAPShapley additive explanations measure
RMSERooted mean squared error
MAEMean average error

References

  1. Polak, P.; Anshari, M. Exploring the multifaceted impacts of artificial intelligence on public organizations, business, and society. Humanit. Soc. Sci. Commun. 2024, 11, 1373. [Google Scholar] [CrossRef]
  2. Tamvada, J.P.; Narula, S.; Audretsch, D.; Puppala, H.; Kumar, A. Adopting new technology is a distant dream? The risks of implementing Industry 4.0 in emerging economy SMEs. Technol. Forecast. Soc. Change 2022, 185, 122088. [Google Scholar] [CrossRef]
  3. Soni, N.; Sharma, E.K.; Singh, N.; Kapoor, A. Artificial intelligence in business: From research and innovation to market deployment. Procedia Comput. Sci. 2020, 167, 2200–2210. [Google Scholar] [CrossRef]
  4. Almusaed, A.; Yitmen, I.; Almssad, A. Enhancing smart home design with AI models: A case study of living spaces implementation review. Energies 2023, 16, 2636. [Google Scholar] [CrossRef]
  5. Alowais, S.A.; Alghamdi, S.S.; Alsuhebany, N.; Alqahtani, T.; Alshaya, A.I.; Almohareb, S.N.; Aldairem, A.; Alrashed, M.; Bin Saleh, K.; Badreldin, H.A.; et al. Revolutionizing healthcare: The role of artificial intelligence in clinical practice. BMC Med. Educ. 2023, 23, 689. [Google Scholar] [CrossRef]
  6. Pérez, J.; Castro, M.; López, G. Serious games and AI: Challenges and opportunities for computational social science. IEEE Access 2023, 11, 62051–62061. [Google Scholar] [CrossRef]
  7. Lo, C.K. What is the impact of ChatGPT on education? A rapid review of the literature. Educ. Sci. 2023, 13, 410. [Google Scholar] [CrossRef]
  8. Feuerriegel, S.; Hartmann, J.; Janiesch, C.; Zschech, P. Generative AI. Bus. Inf. Syst. Eng. 2024, 66, 111–126. [Google Scholar] [CrossRef]
  9. Dwivedi, Y.K.; Kshetri, N.; Hughes, L.; Slade, E.L.; Jeyaraj, A.; Kar, A.K.; Baabdullah, A.M.; Koohang, A.; Raghavan, V.; Ahuja, M.; et al. Opinion paper: ‘So what if ChatGPT wrote it?’ Multidisciplinary perspectives on opportunities, challenges and implications of generative conversational AI for research, practice and policy. Int. J. Inf. Manag. 2023, 71, 102642. [Google Scholar] [CrossRef]
  10. Zhou, J.; Müller, H.; Holzinger, A.; Chen, F. Ethical ChatGPT: Concerns, challenges, and commandments. Electronics 2024, 13, 3417. [Google Scholar] [CrossRef]
  11. Shaw, D. The digital erosion of intellectual integrity: Why misuse of generative AI is worse than plagiarism. AI Soc. 2025. [Google Scholar] [CrossRef]
  12. Sharma, R. AI copyright and intellectual property. In AI and the Boardroom: Insights into Governance, Strategy, and the Responsible Adoption of AI.; Apress: Berkeley, CA, USA, 2024; pp. 47–57. [Google Scholar] [CrossRef]
  13. Mahmoud, A.B.; Kumar, V.; Spyropoulou, S. Identifying the Public’s Beliefs About Generative Artificial Intelligence: A Big Data Approach. IEEE Trans. Eng. Manag. 2025, 72, 827–838. [Google Scholar] [CrossRef]
  14. Taeihagh, A. Governance of generative AI. Policy Soc. 2025, 44, 1–22. [Google Scholar] [CrossRef]
  15. Centro de Investigaciones Sociológicas. Inteligencia artificial. Estudio 3495. Available online: https://www.cis.es/documents/d/cis/es3495mar-pdf (accessed on 7 May 2025).
  16. Ajzen, I. The theory of planned behavior. Organ. Behav. Hum. Decis. Process. 1991, 50, 179–211. [Google Scholar] [CrossRef]
  17. Al-Emran, M.; Abu-Hijleh, B.; Alsewari, A.A. Exploring the Effect of Generative AI on Social Sustainability Through Integrating AI Attributes, TPB, and T-EESST: A Deep Learning-Based Hybrid SEM-ANN Approach. IEEE Trans. Eng. Manag. 2024, 71, 14512–14524. [Google Scholar] [CrossRef]
  18. Davis, F.D. User acceptance of information technology: System characteristics, user perceptions and behavioral impacts. Int. J. Man. Mach. Stud. 1993, 38, 475–487. [Google Scholar] [CrossRef]
  19. Dell’Acqua, F.; McFowland, E., III; Mollick, E.R.; Lifshitz-Assaf, H.; Kellogg, K.; Rajendran, S.; Krayer, L.; Candelon, F.; Lakhani, K.R. Navigating the Jagged Technological Frontier: Field Experimental Evidence of the Effects of AI on Knowledge Worker Productivity and Quality. Harvard Business School Technology & Operations Management Unit Working Paper 2023, No. 24-013. Available online: https://ssrn.com/abstract=4573321 (accessed on 12 May 2025). [CrossRef]
  20. Gansser, O.A.; Reich, C.S. A new acceptance model for artificial intelligence with extensions to UTAUT2: An empirical study in three segments of application. Technol. Soc. 2021, 65, 101535. [Google Scholar] [CrossRef]
  21. Ajzen, I. Perceived behavioral control, self-efficacy, locus of control, and the theory of planned behavior. J. Appl. Soc. Psychol. 2002, 32, 665–683. [Google Scholar] [CrossRef]
  22. Sparks, P.; Guthrie, C.A.; Shepherd, R. The Dimensional Structure of the Perceived Behavioral Control Construct. J. Appl. Soc. Psychol. 1997, 27, 418–438. [Google Scholar] [CrossRef]
  23. Zhang, D.; Xia, B.; Liu, Y.; Xu, X.; Hoang, T.; Xing, Z.; Staples, M.; Lu, Q.; Zhu, L. Privacy and copyright protection in generative AI: A lifecycle perspective. In Proceedings of the IEEE/ACM 3rd International Conference on AI Engineering—Software Engineering for AI, Lisbon, Portugal, 14–5 April 2024; pp. 92–97. [Google Scholar] [CrossRef]
  24. Breiman, L. Random forests. Mach. Learn. 2001, 45, 5–32. [Google Scholar] [CrossRef]
  25. Chen, T.; Guestrin, C. XGBoost: A scalable tree boosting system. In Proceedings of the 22nd ACM SIGKDD International Conference on Knowledge Discovery and Data Mining, San Francisco, CA, USA, 13–17 August 2016; pp. 785–794. [Google Scholar] [CrossRef]
  26. Venkatesh, V.; Bala, H. Technology Acceptance Model 3 and a Research Agenda on Interventions. Decis. Sci. 2008, 39, 273–315. [Google Scholar] [CrossRef]
  27. Venkatesh, V.; Morris, M.G.; Davis, G.B.; Davis, F.D. User acceptance of information technology: Toward a unified view. MIS Q. 2003, 27, 425–478. [Google Scholar] [CrossRef]
  28. Loh, W.-Y. Classification and regression trees. Wiley Interdiscip. Rev. Data Min. Knowl. Discov. 2011, 1, 14–23. [Google Scholar] [CrossRef]
  29. Chung, D.; Jeong, P.; Kwon, D.; Han, H. Technology acceptance prediction of roboadvisors by machine learning. Intell. Syst. Appl. 2023, 18, 200197. [Google Scholar] [CrossRef]
  30. Cuc, L.D.; Rad, D.; Cilan, T.F.; Gomoi, B.C.; Nicolaescu, C.; Almași, R.; Dzitac, S.; Isac, F.L.; Pandelica, I. From AI Knowledge to AI Usage Intention in the Managerial Accounting Profession and the Role of Personality Traits—A Decision Tree Regression Approach. Electronics 2025, 14, 1107. [Google Scholar] [CrossRef]
  31. Lundberg, S.M.; Lee, S.-I. A unified approach to interpreting model predictions. Adv. Neural Inf. Process. Syst. 2017, 30, 4765–4774. Available online: https://proceedings.neurips.cc/paper_files/paper/2017/file/8a20a8621978632d76c43dfd28b67767-Paper.pdf (accessed on 12 May 2025).
  32. Davis, F.D. Perceived usefulness, perceived ease of use, and user acceptance of information technology. MIS Q. 1989, 13, 319–340. [Google Scholar] [CrossRef]
  33. Shirali-Shahreza, S. Set up my smart home as I want. Computer 2024, 57, 65–73. [Google Scholar] [CrossRef]
  34. Daungsupawong, H.; Wiwanitkit, V. Correspondence: Generative artificial intelligence in healthcare. Int. J. Med. Inform. 2024, 189, 105498. [Google Scholar] [CrossRef]
  35. Barros, A.; Prasad, A.; Sliwa, M. Generative artificial intelligence and academia: Implication for research, teaching and service. Manag. Learn. 2023, 54, 597–604. [Google Scholar] [CrossRef]
  36. Benbya, H.; Strich, F.; Tamm, T. Navigating Generative Artificial Intelligence Promises and Perils for Knowledge and Creative Work. J. Assoc. Inf. Syst. 2024, 25, 23–36. [Google Scholar] [CrossRef]
  37. Camilleri, M.A. Factors affecting performance expectancy and intentions to use ChatGPT: Using SmartPLS to advance an information technology acceptance framework. Technol. Forecast. Soc. Change 2024, 201, 123247. [Google Scholar] [CrossRef]
  38. Ibrahim, F.; Münscher, J.-C.; Daseking, M.; Telle, N.-T. The technology acceptance model and adopter type analysis in the context of artificial intelligence. Front. Artif. Intell. 2025, 7, 1496518. [Google Scholar] [CrossRef]
  39. Yudhistyra, W.I.; Srinuan, C. Exploring the Acceptance of Technological Innovation Among Employees in the Mining Industry: A Study on Generative Artificial Intelligence. IEEE Access 2024, 12, 165797–165809. [Google Scholar] [CrossRef]
  40. Al Darayseh, A. Acceptance of artificial intelligence in teaching science: Science teachers’ perspective. Comput. Educ. Artif. Intell. 2023, 4, 100132. [Google Scholar] [CrossRef]
  41. Sobaih, A.E.E.; Elshaer, I.A.; Hasanein, A.M. Examining students’ acceptance and use of ChatGPT in Saudi Arabian higher education. Eur. J. Investig. Health Psychol. Educ. 2024, 14, 709–721. [Google Scholar] [CrossRef] [PubMed]
  42. Strzelecki, A. To use or not to use ChatGPT in higher education? A study of students’ acceptance and use of technology. Interact. Learn. Environ. 2024, 32, 5142–5155. [Google Scholar] [CrossRef]
  43. Hsu, W.-L.; Silalahi, A.D.K.; Tedjakusuma, A.P.; Riantama, D. How Do ChatGPT’s Benefit–Risk Paradoxes Impact Higher Education in Taiwan and Indonesia? An Integrative Framework of UTAUT and PMT with SEM & fsQCA. Comput. Educ. Artif. Intell. 2025, 8, 100412. [Google Scholar] [CrossRef]
  44. Agarwal, R.; Prasad, J. A conceptual and operational definition of personal innovativeness in the domain of information technology. Inf. Syst. Res. 1998, 9, 204–215. [Google Scholar] [CrossRef]
  45. Lu, J.; Yao, J.E.; Yu, C.-S. Personal innovativeness, social influences and adoption of wireless Internet services via mobile technology. J. Strateg. Inf. Syst. 2005, 14, 245–268. [Google Scholar] [CrossRef]
  46. Chalutz Ben-Gal, H. Artificial intelligence (AI) acceptance in primary care during the coronavirus pandemic: What is the role of patients’ gender, age and health awareness? A two-phase pilot study. Front. Public Health 2023, 10, 2022. [Google Scholar] [CrossRef] [PubMed]
  47. Biloš, A.; Budimir, B. Understanding the Adoption Dynamics of ChatGPT among Generation Z: Insights from a Modified UTAUT2 Model. J. Theor. Appl. Electron. Commer. Res. 2024, 19, 863–879. [Google Scholar] [CrossRef]
  48. Wirtz, J.; Lwin, M.O.; Williams, J.D. Causes and consequences of consumer online privacy concern. Int. J. Serv. Ind. Manag. 2007, 18, 326–348. [Google Scholar] [CrossRef]
  49. KPMG International. Privacy in the New World of AI: How to Build Trust in AI Through Privacy. Available online: https://kpmg.com/privacyservices (accessed on 7 May 2025).
  50. Shahriar, S.; Allana, S.; Fard, M.H.; Dara, R. A Survey of Privacy Risks and Mitigation Strategies in the Artificial Intelligence Life Cycle. IEEE Access 2023, 11, 61829–61854. [Google Scholar] [CrossRef]
  51. Jagtap, P. Artificial Intelligence and Privacy: Examining the Risks and Potential Solutions. Artif. Intell. 2024. Available online: https://www.researchgate.net/publication/378545816 (accessed on 7 May 2025).
  52. Moon, W.-K.; Xiaofan, W.; Holly, O.; Kim, J.K. Between Innovation and Caution: How Consumers’ Risk Perception Shapes AI Product Decisions. J. Curr. Issues Res. Advert. 2025, 1–23. [Google Scholar] [CrossRef]
  53. Chung, J.; Kwon, H. Privacy fatigue and its effects on ChatGPT acceptance among undergraduate students: Is privacy dead? Educ. Inf. Technol. 2025, 30, 12321–12343. [Google Scholar] [CrossRef]
  54. Compeau, D.R.; Higgins, C.A. Computer self-efficacy: Development of a measure and initial test. MIS Q. 1995, 19, 189–210. [Google Scholar] [CrossRef]
  55. Venkatesh, V. Determinants of perceived ease of use: Integrating control, intrinsic motivation, and emotion into the technology acceptance model. Inf. Syst. Res. 2000, 11, 342–365. [Google Scholar] [CrossRef]
  56. Araujo, T.; Helberger, N.; Kruikemeier, S.; de Vreese, C.H. In AI We Trust? Perceptions About Automated Decision-Making by Artificial Intelligence. AI Soc. 2020, 35, 611–623. [Google Scholar] [CrossRef]
  57. Alshutayli, A.A.M.; Asiri, F.M.; Abutaleb, Y.B.A.; Alomair, B.A.; Almasaud, A.K.; Almaqhawi, A. Assessing Public Knowledge and Acceptance of Using Artificial Intelligence Doctors as a Partial Alternative to Human Doctors in Saudi Arabia: A Cross-Sectional Study. Cureus 2024, 16, e64461. [Google Scholar] [CrossRef]
  58. Lokaj, B.; Pugliese, M.; Kinkel, K.; Lovis, C.; Schmid, J. Barriers and Facilitators of Artificial Intelligence Conception and Implementation for Breast Imaging Diagnosis in Clinical Practice: A Scoping Review. Eur. Radiol. 2023, 34, 2096–2109. [Google Scholar] [CrossRef]
  59. Kansal, R.; Bawa, A.; Bansal, A.; Trehan, S.; Goyal, K.; Goyal, N.; Malhotra, K. Differences in Knowledge and Perspectives on the Usage of Artificial Intelligence Among Doctors and Medical Students of a Developing Country: A Cross-Sectional Study. Cureus 2022, 14, e21434. [Google Scholar] [CrossRef] [PubMed]
  60. Gado, S.; Kempen, R.; Lingelbach, K.; Bipp, T. Artificial intelligence in psychology: How can we enable psychology students to accept and use artificial intelligence? Psychol. Learn. Teach. 2021, 21, 37–56. [Google Scholar] [CrossRef]
  61. Kelly, S.; Kaye, S.-A.; Oviedo-Trespalacios, O. What factors contribute to the acceptance of artificial intelligence? A systematic review. Telemat. Inform. 2023, 77, 101925. [Google Scholar] [CrossRef]
  62. Elshaer, I.A.; Hasanein, A.M.; Sobaih, A.E.E. The Moderating Effects of Gender and Study Discipline in the Relationship between University Students’ Acceptance and Use of ChatGPT. Eur. J. Investig. Health Psychol. Educ. 2024, 14, 1981–1995. [Google Scholar] [CrossRef]
  63. Strzelecki, A.; ElArabawy, S. Investigation of the moderation effect of gender and study level on the acceptance and use of generative AI by higher education students: Comparative evidence from Poland and Egypt. Br. J. Educ. Technol. 2024, 55, 1209–1230. [Google Scholar] [CrossRef]
  64. Gadekallu, T.R.; Yenduri, G.; Kaluri, R.; Rajput, D.S.; Lakshmanna, K.; Fang, K.; Chen, J.; Wang, W. The role of GPT in promoting inclusive higher education for people with various learning disabilities: A review. PeerJ Comput. Sci. 2025, 11, e2400. [Google Scholar] [CrossRef]
  65. Liu, F.; Liang, C. Analyzing wealth distribution effects of artificial intelligence: A dynamic stochastic general equilibrium approach. Heliyon 2025, 11, e41943. [Google Scholar] [CrossRef]
  66. Doshi, A.R.; Hauser, O.P. Generative AI enhances individual creativity but reduces the collective diversity of novel content. Sci. Adv. 2024, 10, eadn5290. [Google Scholar] [CrossRef] [PubMed]
  67. Sebastian, G. Privacy and Data Protection in ChatGPT and Other AI Chatbots: Strategies for Securing User Information. Int. J. Secur. Priv. Pervasive Comput. 2024, 15, 1–14. [Google Scholar] [CrossRef]
  68. Alkamli, S.; Alabduljabbar, R. Understanding privacy concerns in ChatGPT: A data-driven approach with LDA topic modeling. Heliyon 2024, 10, e39087. [Google Scholar] [CrossRef] [PubMed]
  69. Wu, X.; Duan, R.; Ni, J. Unveiling Security, Privacy, and Ethical Concerns of ChatGPT. arXiv 2023, arXiv:2307.14192. Available online: https://arxiv.org/abs/2307.14192 (accessed on 7 May 2025). [CrossRef]
  70. Venkatesh, V.; Thong, J.Y.L.; Xu, X. Consumer Acceptance and Use of Information Technology: Extending the Unified Theory of Acceptance and Use of Technology. MIS Q. 2012, 36, 157–178. [Google Scholar] [CrossRef]
  71. Rahman, M.M.; Babiker, A.; Ali, R. Motivation, Concerns, and Attitudes Towards AI: Differences by Gender, Age, and Culture. In Proceedings of the International Conference on Human-Computer Interaction, Doha, Qatar, 2–5 December 2024. [Google Scholar] [CrossRef]
  72. Armutat, S.; Wattenberg, M.; Mauritz, N. Artificial Intelligence: Gender-Specific Differences in Perception, Understanding, and Training Interest. In Proceedings of the International Conference on Gender Research, Barcelona, Spain, 25–26 April 2024; Academic Conferences and Publishing International Limited: Reading, UK, 2024; pp. 36–43. [Google Scholar] [CrossRef]
  73. Kozak, J.; Fel, S. How Sociodemographic Factors Relate to Trust in Artificial Intelligence Among Students in Poland and the United Kingdom. Sci. Rep. 2024, 14, 28776. [Google Scholar] [CrossRef]
  74. Pellas, N. The Influence of Sociodemographic Factors on Students’ Attitudes Toward AI-Generated Video Content Creation. Smart Learn. Environ. 2023, 10, 57. [Google Scholar] [CrossRef]
  75. Otis, N.G.; Cranney, K.; Delecourt, S.; Koning, R. Global Evidence on Gender Gaps and Generative AI; Harvard Business School: Boston, MA, USA, 2024. [Google Scholar] [CrossRef]
  76. Liengaard, B.D.; Sharma, P.N.; Hult, G.T.M.; Jensen, M.B.; Sarstedt, M.; Hair, J.F.; Ringle, C.M. Prediction: Coveted, yet forsaken? Introducing a cross-validated predictive ability test in partial least squares path modeling. Decis. Sci. 2021, 52, 362–392. [Google Scholar] [CrossRef]
Figure 1. Framework used in this paper.
Algorithms 18 00410 g001
Figure 2. Spearman correlations of explanatory variables with USE. Note: All correlations are significant for p < 0.001.
Algorithms 18 00410 g002
Figure 3. Explanatory decision tree for USE.
Algorithms 18 00410 g003
Figure 4. Summary beeswarm plot of SHAP values of explanatory variables of USE.
Algorithms 18 00410 g004
Table 1. Profile of the sample (N = 3877).
FactorCategories
SexMale (48.5%), female (51.5%)
Age18–24 years (8.5%), 25–34 years (13.6%), 35–44 years (18.3%), 45–54 years (19.5%), 55–64 years (16.4%), 65–74 years (11.9%), 75+ years (11.8%)
NationalitySpanish (91.3%), Spanish and others (3.1%), others (5.6%)
Education degreeLess than primary (4.7%), primary (11.4%), secondary
(43.1%), vocational education and training (14.1%),
University degree, master and PhD (26.7%)
Monthly income level≤EUR 300 (0.5%), EUR 301–600 (5.0%), EUR 601–900 (6.0%), EUR 901–1200 (14.0%), EUR 1201–1800 (16.8%), EUR 1801–2400 (15.3%), EUR 2401–3000 (13.1%), EUR 3001–4500 (15.4%), EUR 4501–6000 (5.5%), >EUR 6000 (3.7%), not answered (3.9%)
Table 2. Measurement of the variables used and its operationalization.
VariablesResponsesOperationalization
Output variable: frequency of using GAI (USE)
USE1 = Chat GPT
USE2 = Gemini
USE3 = Microsoft copilot
USE4 = Perplexity
USE5 = Other
Never = 0; Once = 1;
Several times in a year = 2;
Several times in a month = 3;
Several times in a week = 4;
Every day = 5
The standardized value of the maximum of USE1, USE2,…, USE5
Input variables (Attitude)
Performance expectancy (PE): Indicate your agreement respect the following consequences of using GAI:
PE1 = Progress
PE2 = Wealth
PE3 = Efficiency
PE4 = Well-being
From completely disagreement = 1 to completely agreement = 10The standardized value of the first principal component of the items
Innovativeness (INNOV): Indicate your level of comfort in the following situations
INNOV1 = Undergoing a medical operation performed by a robot
INNOV2 = Traveling in a self-driving car
INNOV3 = Talking to an artificial intelligence, for example, a customer service or information service assistant
From completely disagreement = 1 to completely agreement = 10The standardized value of the first principal component of the items
Input variables (Behavioral control)
Privacy risk (PRI): When someone provides personal data on the Internet, do you think it is very likely, somewhat likely, not very likely, or not at all likely that...?
PRI1 = Their data may be used without their knowledge
PRI2 = Their identity may be stolen
PRI3 = Their personal safety may be at risk
PRI4 = They may become a victim of fraud
PRI5 = Their reputation may be damaged
From not possible = 1 to very possible = 4The standardized value of the first principal component of the items
Knowledge (KNOW) = Assess your knowledge and familiarity with artificial intelligence.From complete lack of knowledge = 1 to complete knowledge = 10.The standardized value of the item
Input variables (Subjective norms)
Social usefulness (SU): AI may promote
SU1 = The protection of people’s rights
SU2 = Culture, values, and ways of life
SU3 = Humanity as a whole
Harmful = 1 Neutral = 2; Beneficial = 3The standardized value of the first principal component of the items
Social risks (SR): AI
SR1 = may be used to spread misinformation and fake news
SR2 = may facilitate the commission of crimes or illegal acts
SR3 = may lead to greater global inequality
SR4 = may pose a threat to humanity
From completely disagree = 1 to completely agree = 5. Neutral value = 3.The standardized value of the first principal component of the items
Regulation (REG). Indicate your degree of agreement
REG1 = The programming and training of artificial intelligence should be regulated
REG2 = Companies and organizations should disclose when they use artificial intelligence instead of humans
REG3 = The use of artificial intelligence should be regulated
REG4 = Artificial intelligence poses a threat to intellectual property
REG5 = Implementing stricter ethical standards and legal safeguards for artificial intelligence is one of the most important challenges humanity currently faces
From completely disagree = 1 to completely agree = 5. Neutral value = 3.The standardized value of the first principal component of the items
Input variables (sociodemographic)
Sex (SEX)Male = 0 and Female = 1Dummy variable
Generation (GEN)Gen Z and Y (age less than 45 years) = 0, Gen X or baby Boomers(at least 45 years) = 1Dummy variable
Education (ED)Primary school or less = 1; secondary school or vocational education = 2, University degree or higher = 3The standardized value of the item
Monthly Income (IN)By following the scales in Table 1, from the lower income (< EUR 300) = 1 to the higher degree (>EUR 6000) = 10The standardized value of the item
Table 3. Descriptive statistics of variables used in this paper.
MeanSDFLAVE
Output Variable (USE)
USE1 = ChatGPT 1.581.81------
USE2 = Gemini 0.3851.07------
USE3 = Microsoft Copilot 0.5711.29------
USE4 = Perplexity 0.0990.56------
USE5 = Other0.6321.37------
USEINT 1.871.871100%
Input Variables
MeanSDFLAVE
Performance expectancy (PE)
PE17.881.910.7955.60%
PE26.282.320.69
PE37.561.930.78
PE46.412.10.72
Innovativeness (INNOV)
INNOV14.633.070.7356.10%
INNOV24.12.790.82
INNOV34.522.940.68
Privacy risk (PRI)
PRI13.440.6540.6250.02%
PRI23.060.7620.75
PRI32.720.8510.72
PRI43.230.7050.76
PRI52.740.8630.67
Knowledge (KNOW)
KNOW4.362.231.00100%
Social usefulness (SU)
SU11.630.7530.7454.10%
SU21.620.7630.74
SU31.780.8370.73
Social risks (SR)
SR14.3710.7150.04%
SR24.11.180.75
SR33.791.330.72
SR43.571.350.64
Regulation (REG)
REG14.420.9050.8455.40%
REG24.540.8240.70
REG34.520.8430.86
REG44.011.150.64
REG54.360.950.77
Education (ED)
ED2.530.5431.00100%
Income (IN)
IN3.461.921.00100%
Note: In PE, INNOV, PRI, SU, SR, and REG, the unicity of the correlation matrix was rejected using the Bartlett test with p < 0.001. SD, standard deviation; FL, factor loading; AVE, average variance extracted.
Table 4. Results of the estimation with linear regression of the model in Figure 1.
VariableβSDη2t-Ratiop-Value
PE→USE0.0830.02530.08163.2870.001
INNOV→USE0.2280.02680.09878.5<0.001
PRI→USE0.0830.02400.00813.469<0.001
KNOW→USE0.7090.02620.249427.082<0.001
SU→USE0.1400.02550.01175.49<0.001
SR→USE−0.0360.02810.0050−1.2840.1993
REG→USE−0.1530.02840.0108−5.376<0.001
SEX→USE−0.1560.04900.0024−3.1770.002
GEN→USE−0.7300.05110.0522−14.274<0.001
ED→USE0.1990.02440.01708.178<0.001
IN→USE0.0540.02400.00132.2730.023
Note: R2= 39.12%, β represents the path coefficient, SD the standard deviation, and η2 size factor.
Table 5. Principal splits and subrogate splits in the decision tree regression nodes (Figure 3).
Node 1Node 2Node 3Node 5Node 7
KNOW < 0.511KNOW < −0.834SU < −0.787GEN = 1.000REG > 0.369
GEN = 1.000GEN = 1.000REG > 0.369INNOV < 0.076GEN = 1
INNOV < −0.265INNOV < 0.074INNOV < −0.265SU < −0.196KNOW < 0.960
SU < −0.185ED < −0.056GEN = 1PE < 0.636PE < 0.708
ED < −0.056SU < 0.100SR > 0.687ED < −0.056SR > −0.106
INNOV < 1.324PE < −1.714PE < −2.589PRI > −4.298SU < −0.175
REG > −2.262ED < −1.897PRI < −4.332REG > −4.461INNOV < −0.676
PE < 1.504PRI < −2.565
SU < 1.497SR < −3.448
PRI > −10.588
Note: The first row shows the conditions used to construct the fitted decision tree. The conditions applied to guide observations toward lower-level nodes associated with a lower level of use (i.e., “to the left”).
Table 6. Adjustment performance for the linear regression method and DTR, RF, and XGBoost using the full sample.
MethodR2RMSEMAE
Linear regression39.12%1.4551.176
Decision tree regression32.55%1.5321.260
Random Forest92.30%0.6520.528
XGBoost92.85%0.5350.396
Table 7. Predictive performance for the linear regression method and DTR, Random Forest, and XGBoost with Monte-Carlo cross validation (500 simulations).
MethodQ2RMSEMAE
Linear regression38.81%1.4651.175
Decision tree regression31.53%1.5481.267
Random Forest41.26%1.4371.170
XGBoost32.44%1.5661.231
Table 8. Results of the Monte Carlo cross-validation test of predictive ability assessment.
MethodQ2RMSEMAE
DTR31.52%1.561.28
RF41.36%1.461.2
XGBoost33.21%1.571.24
ANOVA F = 385.8 (<0.001)F = 314.6 (<0.001)
Notes: F stands for Snedecor’s F, and parentheses show the value of ANOVA.
Table 9. Statistical tests on the differences in mean errors of paired methods.
RMSEMAE
Mean
Difference
p-ValueMean
Difference
p-Value
RF vs. DTR−0.097<0.001−0.089<0.001
XGBoost vs. DTR0.0100.038−0.047<0.001
XGBoost vs. RF0.107<0.0010.041<0.001
Table 10. Relative importance of explanatory variables to predict USE measured with the mean of the absolute value of SHAP.
Mean95% Confidence Interval
VariableSHAPSHAP_LowerSHAP_Upper
KNOW0.5590.5470.571
GEN0.2970.2930.301
INNOV0.1930.1890.197
SU0.1540.1500.158
ED0.1360.1340.138
REG0.1170.1130.120
PE0.1020.0990.104
PRI0.0740.0720.076
SR0.0730.0710.075
IN0.0530.0510.054
SEX0.0390.0380.040
Disclaimer/Publisher’s Note: The statements, opinions and data contained in all publications are solely those of the individual author(s) and contributor(s) and not of MDPI and/or the editor(s). MDPI and/or the editor(s) disclaim responsibility for any injury to people or property resulting from any ideas, methods, instructions or products referred to in the content.

