1. Introduction
Using data that describe variations in how each given material interacts with light across different wavelengths is a common technique for characterizing materials at any scale [
1,
2]. Thus, optical remote sensing centers around acquiring variations in how the surface material interacts with the light from the sun. Machine learning (ML) algorithms are typically applied to process such remote sensing data due to the high quantity of data, and this is a topic that has experienced exponential growth in the last few years [
3].
Multiple sensors onboard different satellites are available for data acquisition by academic and non-academic communities, either multispectral or hyperspectral [
3], and remote sensing techniques have shown great potential in identifying variations in materials present in the ground, therefore having extensive potential for geological applications [
4,
5]. One of the main current problems is the limited access potential users have to tools that enable efficient processing and analysis of such data in free, all-in-one software. For this reason, building a tool focused on geological applications and data analysis seems to meet the demand for specific applications that are free and open-source [
6].
In recent years, a limited number of software programs have been developed to provide possible users access to such tools, especially outside the scope of proprietary packages such as “Environment for Visualizing Images” (ENVI) [
7]. Some alternatives have recently been proposed [
8,
9,
10,
11]. We believe that such projects are a step toward giving research and educational communities access to free open-access software.
HypeRvieW [
8] is a license-free software that runs on the Linux operating system. While it is developed using the C language, it provides great capabilities for spatial-spectral supervised classification. Another important feature is the integrated 2D noise correction function, which uses wavelets and soft-thresholding [
12]. Its main limitation is the lack of compatibility with more common file types for remote sensing optical images from satellite missions.
HypPy [
9] provides a different range of tools, focusing on taking advantage of the physical meaning of the wavelength values in place of band numbers. Another advantage is compatibility with all default ENVI file formats. While not focused on typical endmember extraction, it can perform mapping based on variations in central wavelength position and relative depth, making it a valuable tool for spectral analysis.
HYPER-Tools [
10] is a MATLAB-based [
13] interface that provides extensive tools for the preprocessing and analysis of spectral data. For the second component, the functions range from dimensionality reduction, endmember identification, clustering, and classification. The main limitation is the dependency on proprietary software.
EnMap-box [
11] is a plugin for QGIS that provides an extensive set of tools for hyperspectral and multispectral image analysis in a Geographic Information System (GIS) environment. One of the main advantages is the time series visualization function. Though developed to focus on spectral analysis in a broader sense, it also provides some specific tools for geological applications across multiple fields of study. One of the main contributions of AetherGeo is providing a 3D interactive point cloud tool for endmember selection.
Considering some of the limitations identified in other free alternatives, we propose a new software, AetherGeo, with similar capabilities to the mentioned tools but with significant new functions: (i) a higher number of tools/algorithms for dimensionality reduction, (ii) density-based clustering algorithms for classification, and (iii) 3D point cloud selection for endmember extraction. Additionally, AetherGeo is not limited by proprietary components in any of its functionalities, making it a pertinent contribution to the current state-of-the-art technology. A more detailed comparison with other alternatives can be found in
Appendix A.
This work aims to present the AetherGeo software, its interface, main components, and functionalities, while showcasing some processing workflows that can be achieved entirely within the software. The current state of the software allows for the use of classical remote sensing capabilities, such as dimensionality reduction algorithms [
14], band ratios [
15], clustering [
16], and endmember extraction and classification [
17]. The last-mentioned techniques have shown extensive potential across multiple geological applications [
18,
19]. Additionally, AetherGeo serves as a tool for testing and implementing advanced analysis algorithms in the future and, no less importantly, implementing preprocessing algorithms essential for addressing the range ambiguity and noise associated with sensor data [
20,
21,
22].
Overall, this free, open-source software can serve as an alternative to proprietary software for dimensionality reduction, endmember extraction, spectral analysis, and image classification of multi- and hyperspectral data, with a special focus on (but not limited to) geological applications. The user-friendly interface (GUI) allows it to reach a broader audience with ready-to-use tools and no programming knowledge required. Additionally, the software can be installed on Windows via an executable installer (
https://www.fc.up.pt/RS-GISLab/aethergeo.html, accessed on 23 May 2025). As for users with more programming experience, since the program is open source, there is the opportunity to use the functions provided in independent programs/workflows or make alterations to those functions based on user-specific needs.
2. Spectral Data Analysis
“Light” is commonly used to describe the visible component of the electromagnetic spectrum, but in reality, optical data acquired with sensors can span more than the visible component, something important for the characterization of materials and commonly used for the differentiation of minerals in geological applications (
Figure 1) [
23].
This ability to characterize materials is associated with light’s interactions with materials, which vary based on their chemical and physical properties. For this reason, the use of optical data for characterization via remote sensing is a topic that has been used for a long time in multiple domains of study, especially those related to remote sensing [
2,
24,
25]. The launch of the Hyperion-01 sensor [
26] marked a significant advancement in the application of hyperspectral data for different fields of study, with a special emphasis on environmental and geological applications [
5,
27]. Recent advancements in sensor technology, noise levels, and the launch of new satellites due to “Precursore IperSpettrale della Missione Applicativa” (PRISMA) and “Environmental Mapping and Analysis Program” (EnMap) missions not only provide easier access to quality data but also incentivize the need to take full advantage of these data, which have a lot of potential but require more detailed processing due to their high complexity.
Figure 1.
(
a) Almandine mineral. (
b) Respective infrared spectrum [
28].
Figure 1.
(
a) Almandine mineral. (
b) Respective infrared spectrum [
28].
It is also important to introduce the difference between multispectral and hyperspectral data (
Figure 2). The first one is better described as each pixel having a discrete set of associated variables (based on the number of bands), while in the other case, the bands are narrow (2–10 nanometers), and therefore, there is a large number of bands covering the zone of the electromagnetic spectrum being measured [
29,
30].
This continuous property of the spectra associated with hyperspectral data makes them a powerful tool for earth surface characterization [
31], and therefore, they have significant potential for geological applications. The capacity for academic and non-academic communities to have access to such data covering extensive areas has been greatly improved by the recent PRISMA and EnMap, with the added benefit of these products being commonly provided with level 2A and, therefore, having already been corrected for atmospheric effects, making integration with the rest of the analysis workflows faster and easier.
Additionally, access to hyperspectral satellite data is expected to increase in the future due to new missions such as the Copernicus Hyperspectral Imaging Mission for the Environment (CHIME) by the European Space Agency (ESA), which consists of two satellites (CHIME-A and CHIME-B) providing systematic hyperspectral data [
32].
Figure 2.
Comparison of multispectral and hyperspectral imaging [
33].
Figure 2.
Comparison of multispectral and hyperspectral imaging [
33].
Though sensors onboard unmanned aerial vehicles (UAVs), aircraft, and spacecraft can acquire such images, access to proper techniques for processing and inspecting such data is essential for retrieving significant information. Traditional techniques, such as false color RGB combinations, allow for fast, somewhat intuitive evaluation of the overall scenery but lack concrete interpretability of results and capabilities to consider more than three bands.
It is also common to use unsupervised learning algorithms when analyzing spectral data since they provide data-driven results that uncover complex links in data [
34] without requiring labeled data. The most commonly used unsupervised approaches for analyzing remote sensing optical data are clustering and dimensionality reduction algorithms, the latter being especially important for hyperspectral data due to what is described in the literature as the curse of dimensionality [
35].
Another alternative is spectral unmixing, especially algorithms under the category of partial spectral unmixing, since they do not rely on having the full information for each component present in the image [
36], something unreasonable for most geological applications. These algorithms focus on classifying each pixel of an image based on the likelihood of a given input spectrum being present.
There are two approaches for selecting the input spectra for spectral unmixing. The first consists of importing the spectra from an already existing spectral library [
28]. The second relies on finding spectrally pure pixels within the image. Retrieving these pure independent components, commonly called endmembers, from the image itself has the advantage that the spectrum being assumed as a pure material in the image is already adjusted for variations in material composition, sensor noise, and spectral shifts, in this way overcoming typical limitations associated with this type of analysis [
37]. The software AetherGeo allows the user to undertake both approaches.
3. Software Introduction
The current version (v1.0) of the software allows the user to analyze data in the form of an image. This is done with a focus on the analysis of spectral data (multi- and hyperspectral). Handling the high-dimensional datasets associated with these data is challenging, but the user must have access to adequate analysis and visualization tools. For this reason, the software visualization approach is pixel-based but saves the geospatial metadata of the original file to any output file. This allows for interoperability with GIS software.
Regarding image visualization, after importing a raster file (
Figure 3A), the user can also change the bands displayed as an RGB combination (
Figure 3C), a common tool for inspecting spectral data [
38,
39].
Continuing with this approach, the icon bar (
Figure 3B) in the top part, for now, has a total of three functions. The first one allows the user to generate a two-dimensional plot showing the relationship between components of the data, allowing for selection and visualization of the selected pixels. The second and third functions allow the user to access the user guide and license, respectively, which can be accessed by clicking the respective icons (
Figure 4a,b) on the software.
On the right side of the screen is a toolbar for accessing the different available data processing tools (
Figure 3D).
To achieve all the functionalities, the Python language [
40] was used in conjunction with different packages, such as Matplotlib 3.5.0 [
41], NumPy 1.23.0 [
42], Rasterio 1.2.0 [
43], Spectral 0.22.1 [
44], scikit-learn 1.0.0 [
45], Umap 0.5.0 [
46], SciPy 1.7.0 [
47], scikit-image 0.19.0 [
48], h5py 3.6.0 [
49], pyproj 3.3.0 [
50], OpenGL 3.1.5 [
51], and PyQt6 6.4.0 [
52].
The current version supports TIF, DAT, and HE5 files for image inputs. As for spectral libraries, it currently supports SLI and (.txt) files. All outputs are saved as TIF files.
4. Related Software Tools
This section focuses on the different tools currently available and is subdivided in the same order as those categories displayed in the software.
Table 1 comprises the different functions available in the current state of the software. More in-depth explanations for most function groups can be found in their respective subsections.
4.1. Preprocessing
This category currently has two different functions. The first enables the user to generate a layer composed of a normalized version of the input data. This normalization is conducted through a process that sets the lowest value to 0 and scales the other bands proportionally so that the highest possible value is 1, thus normalizing the vector of band values associated with each pixel [
59]. This process is important for minimizing the effects of light intensity changes across the scene and maximizing the focus on the structure of the spectrum itself.
The second function enables the user to attribute the wavelength metadata to an image if that given image lacks previous wavelength metadata and the number of bands associated with it is the same as the number of bands for the selected sensor. This attribution is important for later stages to generate proper spectral libraries with correct wavelength data.
4.2. Spectral Dimensionality Reduction
The following group of functions is built around techniques for dimensionality reduction. For any of the functions under this category, the user can choose a layer to be used as input, another layer to be used as a mask (optional), and a given number of components to be present after the reduction.
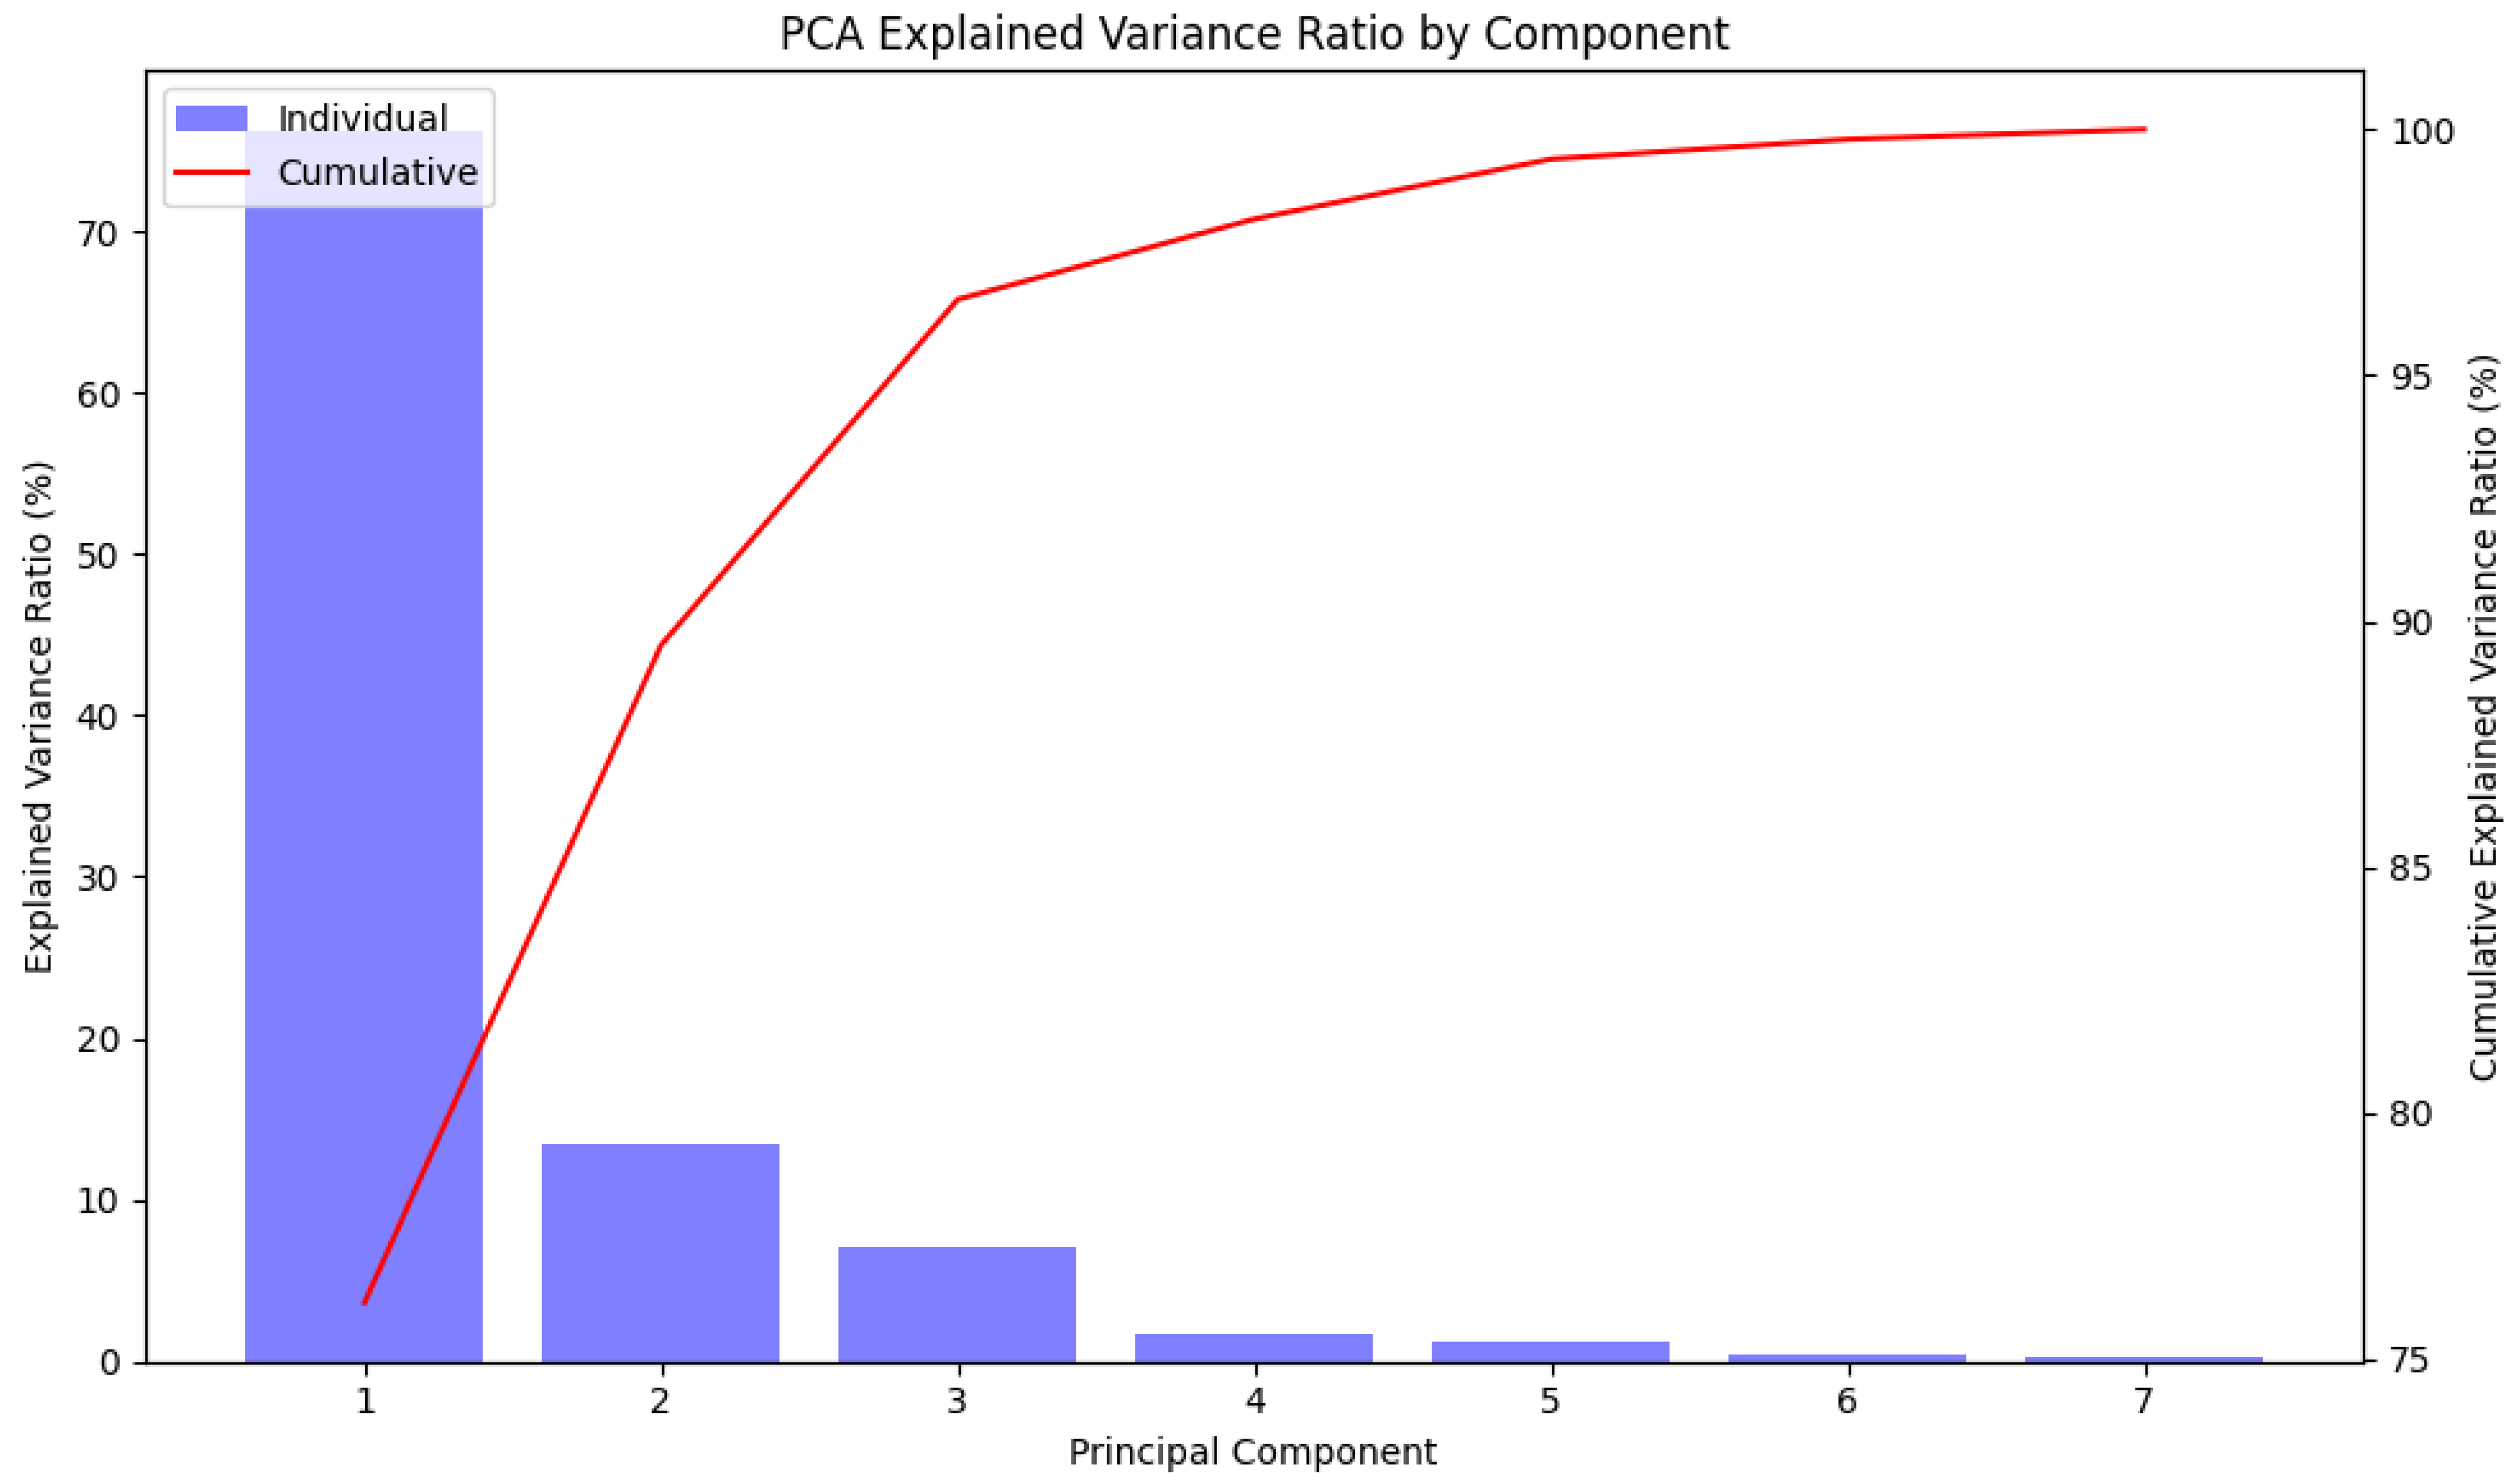
Three different algorithms are implemented to achieve this task: Principal Component Analysis (PCA) [
53], Independent Component Analysis (ICA) [
54], and Non-negative Matrix Factorization (NMF) [
55]. After running any of the functions, the user can generate a graph representing a significance value for each of the new bands. For the case of PCA, the software outputs a graph based on the explained variance ratio of each component (
Figure 5); for ICA, a kurtosis value is used [
54]; and a significance value, which represents how much each given feature is present across the entire dataset, based on the L2 norm of matrix W [
60] is used in the case of NMF.
The first two described functions are already well-established in the remote sensing geological application literature [
14]. On the other hand, NMF is not as established for this specific application, despite showing promising results both for dimensionality reduction [
55] and endmember extraction and classification [
61]. The NMF algorithm also has several advantages due to its nature of working with non-negative values (reflectance values are always positive), as it always generates positive results, making preserving the physical meaning of the reflectance values easier. These constraints regarding potential negative values in the input dataset are also essential for achieving efficient computational times.
4.3. Band Ratios
The application of band ratios to retrieve information from spectral data has applications in all remote sensing fields, being an important feature with extensive application in the geologic context [
2,
15]. This function is added in a context where the user can select from the layer in a given file and a set group of basic mathematical procedures, allowing for math calculations that include sum, subtraction, multiplication, and division of different bands, generating an output file composed of a single layer. This output file can be further inspected based on value variations across the image using the 2D plot function available in the icon bar.
4.4. Spectral Library Management and Visualization
An important feature when working with hyperspectral and multispectral data is the visualization of spectral libraries (
Figure 6). This is the term for files containing groups of different spectra from previous studies, such as open-access libraries resampled for different satellite sensors [
62] or extracted from an image.
In this tool, the spectral angle mapper (SAM) algorithm [
56,
63] can also be used to measure the angle between two selected spectra. An angle of zero degrees means the spectra are precisely equal; as the angle increases, the spectra are less similar.
4.5. Endmember Extraction
The only currently available tool for spatial dimensionality reduction is the pixel purity index (PPI). This algorithm focuses on attributing a purity index for each pixel of a given image. This is an important step in finding the most unique pixels most likely to correspond to pure material [
37]. To achieve this task, the algorithm compares each image pixel against a group of vectors (skewers) and classifies its likelihood of being pure based on a threshold set by the user [
30]. After a selected number of iterations, the output is a binary layer based on whether pixels are considered pure or not.
To retrieve the pure spectra directly from the image, the “Point Cloud Extraction” function allows the user to select the desired input files and generate a three-dimensional point cloud based on Uniform Manifold Approximation and Projection (UMAP) embedding [
46].
From the pop-up window (
Figure 7), the user can either run the automatic selection of the Ordering Points to Identify Cluster Structure (OPTICS) algorithm [
58] to perform density-based clustering (see
Section 4.7) or manually select multiple regions in the point cloud, forming clusters to extract their representative spectra. With this workflow, the user can inspect each endmember spectrum and save the results as a spectral library for future use.
4.6. SAM
Currently, SAM is the only algorithm available for classification based on specific spectral inputs. Considering a given layer (corresponding with raster spectral data) and a spectrum corresponding to a given endmember, the SAM algorithm attributes a value to each pixel based on the similarity between the pixel and the input spectrum. It is assumed that a higher similarity between both spectra indicates a higher likelihood of the endmember material being present. The SAM algorithm is described in Equation (1) [
63]:
where
x and
y are vectors composed of [
,
,
…,
] and [
,
,
…, ], respectively, and represent the array of reflectance values associated with a given pixel and the array of reflectance values associated with a given endmember.
The usage of this algorithm for geological applications is common due to the reliability around light and angle deviations across the landscape [
27,
64].
The endmember used as input can be a spectrum from a spectral library, such as the United States Geological Survey (USGS) open-access library [
28]. Another alternative is to generate a spectral library composed of the pure components present in a given image. This approach shows promising results since it is robust against sensor noise and deviations of the spectra [
37].
A typical workflow for classification after endmember extraction can be seen in
Figure 8.
The spectral dimensionality reduction step is not mandatory but is highly recommended, especially for hyperspectral data, due to what is known in the literature as the curse of dimensionality [
35].
Appendix B provides a practical example of this workflow with more optional steps regarding preprocessing and final data inspection. It shows how to use multiple functions to achieve classification based on an endmember extracted from the image, while starting only with a satellite image product without previous information or processing.
4.7. Clustering
Another implemented alternative is to use unsupervised classification clustering techniques [
65] to classify a given image. To achieve this task, OPTICS [
58] was the main algorithm selected for clustering due to its similarity with density-based spatial clustering of applications with noise (DBSCAN) [
66]. DBSCAN has been proven useful for analyzing geological [
67] and spectral data [
68]. However, OPTICS has the advantage of having a higher degree of interpretation due to having fewer parameters set by the user [
69], with the main ones being the “Minimum samples”, which refers to the minimum number of points in a neighborhood for a point to be considered a core point, and “Xi”, a parameter that controls the model’s sensitivity to changes in point density, therefore affecting cluster boundaries.
K-means clustering is also implemented in AetherGeo in the form of k-means++ [
57]. Due to this algorithm’s fast processing of extensive datasets, K-means is ideal for processing remote sensing data, providing the user with clustering results that segment the data into classes with a higher degree of similarity.
It is also important to mention that the last available function, “Retrieve spectrum from cluster”, allows the user to extract the mean spectrum for each cluster generated by the previously selected clustering algorithm. Thus, this function allows for a more detailed interpretation, especially when used in conjunction with the “Spectral library management and visualization” class.
Figure 9 gives an example result from clustering with K-means.
5. Discussion
The current version of AetherGeo is mainly intended to work with geospatial data, but the visualization is pixel-based and not georeferenced. For the results generated by any analysis to have spatial meaning, all necessary metadata for georeferentiation is saved in conjunction with any new layer created. Therefore, all the output images generated by AetherGeo can be later analyzed in a GIS environment.
Compared with other alternatives, especially other free, open-source projects [
8,
9,
10,
11], it is important to highlight that AetherGeo provides the user with extensive tools for endmember extraction from a 3D point cloud, something that the other free software alternatives described do not offer. Other contributions of AetherGeo for state-of-the-art geological applications are as follows: (i) AetherGeo offers per-band significance graphs for each dimensionality reduction technique; (ii) it is one of the few software that offers the NMF algorithm for dimensionality reduction, having potential for geological application; (iii) AetherGeo is the only software that allows intuitive and interactive 3D point cloud extraction with embedding resulting from UMAP, which provides great capabilities to preserve local and global data structure [
46]; (iv) it provides density-based clustering for image classification and endmember extraction; (v) AetherGeo offers a 2D plot function that enables the user to select pixels based on their associated values.
Figure A1 of
Appendix B shows a more detailed workflow using multiple functions to achieve image classification based on an endmember extracted from a given image and only using such an image as a starting point (without previous information), highlighting how multiple functions can be used together to achieve a final classification result, and also serves as a guide for anyone learning how to use the software.
Additionally, all the tools in AetherGeo are provided without any dependency on proprietary packages or software, and the user can modify any of its components without any proprietary license. In this way, it differs from an available alternative [
10] that runs on MATLAB, which requires a full license. AetherGeo, built in Python, provides access to state-of-the-art libraries, especially for machine learning.
Though the current version does not include any specific algorithm for noise correction, we intend to explore some alternatives currently present in the literature [
20,
21,
22] in the future and subsequently add some functions to the preprocessing group regarding such matters.
Regarding the potential for geological applications, the capabilities of AetherGeo software can be expanded to include more than satellite data, such as UAV, airborne, and laboratory data. Since the software is developed to extract information from images, the scale of work is defined by the capabilities to acquire corrected images, which, in the case of particular sensors for UAV, airborne, and laboratory applications, may require specific preprocessing with software developed for the specific sensor. Even though the image analysis functions were tested in images containing data from the “visible and near-infrared” (VNIR) and “short-wave infrared” (SWIR), they can also be tested and applied to other spectral ranges. Due to the flexibility of working with different spectral ranges and image scales, we believe this software provides helpful analysis tools across different geological applications. Additionally, since hyperspectral data can be helpful in many areas of expertise, the hyperspectral image analysis features available in AetherGeo can be explored by specialists in other fields of study.
Another topic that has been discussed extensively in the literature is that even though many algorithms have been developed, they tend to be difficult to test due to either limitations in testing data or limitations in access and applicability by other experts. For this reason, building an intuitive layout in the form of a GUI (Graphical User Interface) enables experts from different areas to have access to multiple functionalities and algorithms without requiring extensive programming knowledge or other complications.
In addition to improving accessibility, the software also contributes to facilitating reproducibility and consistency in research by providing a standardized environment where procedures can be executed with predefined parameters and settings. This strengthens scientific rigor and also promotes collaboration and transparency.
6. Conclusions
Software that focuses on the analysis of image spectroscopy remote sensing data has been of limited access to the academic and non-academic communities. With this in mind, AetherGeo was built to allow the community access to multiple remote sensing techniques inside a single free, open-source piece of software.
By providing a set of tools and functions in an all-in-one environment with visualization capabilities, AetherGeo can provide a great user experience while also supporting some of the most common data file types currently in use. Compatibility with more file types is expected in future versions. This approach also provides an infrastructure for testing and implementation of new state-of-the-art algorithms in the future.
The current version mainly provides capabilities for classic image analysis tools and endmember extraction. Future versions can extend this by providing new functionalities, improving current visualization options, and supporting more file types. In this way, we believe AetherGeo can continue providing the community access to state-of-the-art techniques for geological applications, which is something of interest to both professionals and students.
In the future, functionalities related to data integration and the development of predictive maps will be implemented under the same scope and workflow format, since this tool is mainly provided as software developed for geological applications and data analysis. Other spectral unmixing algorithms could also be added in future software versions.
Author Contributions
Conceptualization, G.S.; methodology, G.S.; software, G.S.; validation, G.S.; investigation, G.S.; resources, J.C.-F. and A.C.T.; data curation, G.S.; writing—original draft preparation, G.S.; writing—review and editing, J.C.-F. and A.C.T.; visualization, G.S. and J.C.-F.; supervision, J.C.-F. and A.C.T.; project administration, J.C.-F. and A.C.T.; funding acquisition, A.C.T. All authors have read and agreed to the published version of the manuscript.
Funding
This research is funded by the European Union under grant agreement No. 101091616, project S34I–SECURE AND SUSTAINABLE SUPPLY OF RAW MATERIALS FOR EU INDUSTRY, coordinated by ANA C. Teodoro (
https://doi.org/10.3030/101091616), under topic HORIZON-CL4-2022-RESILIENCE-01-08—Earth observation technologies for the mining life cycle in support of EU autonomy and transition to a climate-neutral economy (RIA). The work is also funded by national funds through FCT, Fundação para a Ciência e Tecnologia, I.P., in the framework of UID/04683: Instituto de Ciências da Terra (ICT).
Data Availability Statement
Acknowledgments
The authors would like to acknowledge the contributions of all free and open-source Python libraries that have been used (Matplotlib 3.5.0, NumPy 1.23.0, Rasterio 1.2.0, Spectral 0.22.1, scikit-learn 1.0.0, Umap 0.5.0, SciPy 1.7.0, scikit-image 0.19.0, h5py 3.6.0, pyproj 3.3.0, OpenGL 3.1.5, and PyQt6 6.4.0), which were crucial to making this work possible, remembering that the software is open-source and aligns with the GNU v3 license.
Conflicts of Interest
The authors declare no conflicts of interest. The funders had no role in the design of the study; in the collection, analysis, or interpretation of data; in the writing of the manuscript; or in the decision to publish the results. The views and opinions expressed are those of the authors only and do not necessarily reflect those of the European Union or HADEA; neither the European Union nor the granting authority can be held responsible for them.
Abbreviations
The following abbreviations are used in this manuscript:
| DBSCAN | Density-Based Spatial Clustering of Applications with Noise |
| EnMap | Environmental Mapping and Analysis Program |
| ENVI | Environment for Visualizing Images |
| GIS | Geographic Information System |
| GUI | Graphical User Interface |
| ICA | Independent Component Analysis |
| IDL | Interactive Data Language |
| ML | Machine Learning |
| MATLAB | Matrix Laboratory |
| NMF | Non-negative Matrix Factorization |
| OPTICS | Ordering Points to Identify Cluster Structure |
| PCA | Principal Component Analysis |
| PPI | Pixel Purity Index |
| PRISMA | Precursore IperSpettrale della Missione Applicativa |
| SAM | Spectral Angle Mapper |
| SWIR | Short-Wave Infrared |
| UAV | Unmanned Aerial Vehicle |
| UMAP | Uniform Manifold Approximation and Projection |
| USGS | United States Geological Survey |
| VNIR | Visible and Near-Infrared |
This section presents
Table A1, which is composed of a comparison between AetherGeo and the open-source alternatives discussed in the introduction and discussion sections.
Table A1.
Comparison between AetherGeo v1.0, AetherGeo v1.1, and other open-source alternatives.
Table A1.
Comparison between AetherGeo v1.0, AetherGeo v1.1, and other open-source alternatives.
| | File Type Support (for Images) | Requires Proprietary License | Visualize and Inspect Spectra from Spectral Libraries | 3D Endmember Extraction | Expert-Based Algorithms for Mineral Identification | Noise Correction Functions |
|---|
| HypeRvieW [8] | Raw, MAT, HRW | No | No | No | No | Yes |
| HypPy [9] | DAT | No | Yes | No | No | No |
| HYPER-Tools [10] | MAT, TIF, and DAT | Yes | Yes | No | No | Yes |
| EnMap-Box [11] | TIF, DAT, and HE5 | No | Yes | No | Yes | Yes |
| AetherGeo v1.0 | TIF, DAT, and HE5 | No | Yes | Yes | No | No |
| AetherGeo v1.1 | MAT and other new state-of-the-art file types | No | Yes | Yes | Possibly | Yes |
Figure A1 shows a step-by-step example for identifying an endmember in an area of interest in a given image and performing classification. It proceeds as follows: First, import the image. The second step is optional and depends on previous information, but it is recommended that normalization be performed and the correct wavelengths be attributed to each band. As a third step, run one of the clustering algorithms; in the example case, K-means was used with seven classes (
Figure A1A; partially shown in
Figure 9). Follow this by inspecting the results. In this case, classes 1 and 6 coincide with our zones of interest. Proceed by generating a mask based on classes that match our zones of interest (selection in QGIS). To identify the pixels most likely to be pure, perform PPI with the original image and mask from the last step. Follow this by using PPI results and the original image in the “Generate Point Cloud” function, and select the extreme points in the cloud (
Figure A1B; partially shown in
Figure 7). After selection, inspect the spectra and save the results as a spectral library (
Figure A1C; partially shown in
Figure 7). To perform classification, start by importing the spectral library from the last step and performing SAM with the original image and the desired endmember from the library. To finalize the classification, use the 2D plot feature to extract results with the desired value (for SAM, a smaller angle means the best results;
Figure A1D). Finish by saving and inspecting the final results (
Figure A1E).
Figure A1.
Example workflow for image classification. (A): K-means results with seven classes; (B): selection of the extreme points (endmembers in purple color) in the 3D point cloud; (C): spectral library of selected endmembers; (D): 2D plot feature to extract SAM results with a smaller angle (red); (E): final results with target areas in red.
References
- Dong, X.; Jakobi, M.; Wang, S.; Köhler, M.H.; Zhang, X.; Koch, A.W. A Review of Hyperspectral Imaging for Nanoscale Materials Research. Appl. Spectrosc. Rev. 2019, 54, 285–305. [Google Scholar] [CrossRef]
- Gupta, R.P. Remote Sensing Geology, 3rd ed.; Springer: Berlin, Germany, 2018; ISBN 978-3-662-55874-4. [Google Scholar]
- Shirmard, H.; Farahbakhsh, E.; Müller, R.D.; Chandra, R. A Review of Machine Learning in Processing Remote Sensing Data for Mineral Exploration. Remote Sens. Environ. 2022, 268, 112750. [Google Scholar] [CrossRef]
- Chen, W.; Li, X.; Qin, X.; Wang, L. Geological Remote Sensing: An Overview. In Remote Sensing Intelligent Interpretation for Geology: From Perspective of Geological Exploration; Chen, W., Li, X., Qin, X., Wang, L., Eds.; Springer: Singapore, 2024; pp. 1–14. ISBN 978-981-99-8997-3. [Google Scholar]
- Cardoso-Fernandes, J.; Teodoro, A.C.; Lima, A.; Perrotta, M.; Roda-Robles, E. Detecting Lithium (Li) Mineralizations from Space: Current Research and Future Perspectives. Appl. Sci. 2020, 10, 1785. [Google Scholar] [CrossRef]
- Prokakis, E. Free and Open-Source Software: Freedom, Transparency and Efficiency in the Digitalization Era. J. Polit. Ethics New Technol. AI 2022, 1, e31230. [Google Scholar] [CrossRef]
- Geospatial Software & Solutions|Geospatial Data Analysis. Available online: https://www.nv5geospatialsoftware.com/ (accessed on 5 March 2025).
- Garea, A.S.; Ordóñez, Á.; Heras, D.B.; Argüello, F. HypeRvieW: An Open Source Desktop Application for Hyperspectral Remote-Sensing Data Processing. Int. J. Remote Sens. 2016, 37, 5533–5550. [Google Scholar] [CrossRef]
- Bakker, W.; van Ruitenbeek, F.; van der Werff, H.; Hecker, C.; Dijkstra, A.; van der Meer, F. Hyperspectral Python: HypPy. Algorithms 2024, 17, 337. [Google Scholar] [CrossRef]
- Mobaraki, N.; Amigo, J.M. HYPER-Tools. A Graphical User-Friendly Interface for Hyperspectral Image Analysis. Chemom. Intell. Lab. Syst. 2018, 172, 174–187. [Google Scholar] [CrossRef]
- Jakimow, B.; Janz, A.; Thiel, F.; Okujeni, A.; Hostert, P.; van der Linden, S. EnMAP-Box: Imaging Spectroscopy in QGIS. SoftwareX 2023, 23, 101507. [Google Scholar] [CrossRef]
- Quesada-Barriuso, P.; Argüello, F.; Heras, D.B.; Benediktsson, J.A. Wavelet-Based Classification of Hyperspectral Images Using Extended Morphological Profiles on Graphics Processing Units. IEEE J. Sel. Top. Appl. Earth Obs. Remote Sens. 2015, 8, 2962–2970. [Google Scholar] [CrossRef]
- MathWorks MATLAB. Available online: https://www.mathworks.com/products/matlab.html (accessed on 31 March 2025).
- Mwaniki, M.W.; Moeller, M.S.; Schellmann, G. A Comparison of Landsat 8 (OLI) and Landsat 7 (ETM+) in Mapping Geology and Visualising Lineaments: A Case Study of Central Region Kenya. Int. Arch. Photogramm. Remote Sens. Spat. Inf. Sci. 2015, XL-7-W3, 897–903. [Google Scholar] [CrossRef]
- Ashley, R.P.; Abrams, M.J. Alteration Mapping Using Multispectral Images: Cuprite Mining District, Esmeralda County, Nevada. Open-File Report 1980, 80, ofr80367. [Google Scholar] [CrossRef]
- Kuhn, S.; Cracknell, M.J.; Reading, A.M. Lithological Mapping in the Central African Copper Belt Using Random Forests and Clustering: Strategies for Optimised Results. Ore Geol. Rev. 2019, 112, 103015. [Google Scholar] [CrossRef]
- Modabberi, S.; Ahmadi, A.; Tangestani, M.H. Sub-Pixel Mapping of Alunite and Jarosite Using ASTER Data; A Case Study from North of Semnan, North Central Iran. Ore Geol. Rev. 2017, 80, 429–436. [Google Scholar] [CrossRef]
- Peyghambari, S.; Zhang, Y. Hyperspectral Remote Sensing in Lithological Mapping, Mineral Exploration, and Environmental Geology: An Updated Review. J. Appl. Remote Sens. 2021, 15, 031501. [Google Scholar] [CrossRef]
- Dammage, C.; Ratnayake, K.; Rodrigo, R.; Godaliyadda, R.; Ekanayake, P.; Herath, V. Comparative Analysis of Endmember Extraction Methods for Lithological Mapping Using Hyperspectral Imaging. In Proceedings of the 2024 Moratuwa Engineering Research Conference (MERCon), Moratuwa, Sri Lanka, 8–10 August 2024; pp. 193–198. [Google Scholar] [CrossRef]
- Sidorov, O.; Hardeberg, J.Y. Deep Hyperspectral Prior: Single-Image Denoising, Inpainting, Super-Resolution. In Proceedings of the 2019 IEEE/CVF International Conference on Computer Vision Workshop (ICCVW), Seoul, Republic of Korea, 27–28 October 2019; pp. 3844–3851. [Google Scholar]
- Chang, S.; Deng, Y.; Zhang, Y.; Zhao, Q.; Wang, R.; Zhang, K. An Advanced Scheme for Range Ambiguity Suppression of Spaceborne SAR Based on Blind Source Separation. IEEE Trans. Geosci. Remote Sens. 2022, 60, 1–12. [Google Scholar] [CrossRef]
- Amin, E.J.; Krieger, G.; Younis, M.; Bordoni, F.; da Silva, A.B.C.; Moreira, A. A 2-D Range Ambiguity Suppression Method Based on Blind Source Separation for Multichannel SAR Systems. IEEE Trans. Geosci. Remote Sens. 2024, 62, 1–17. [Google Scholar] [CrossRef]
- Chukanov, N.; Vigasina, M. Vibrational (Infrared and Raman) Spectra of Minerals and Related Compounds, 1st ed.; Springer: Cham, Switzerland, 2019; ISBN 978-3-030-26802-2. [Google Scholar]
- Lillesand, T.; Kiefer, R.W.; Chipman, J. Remote Sensing and Image Interpretation, 7th ed.; John Wiley & Sons: Hoboken, NJ, USA, 2015; ISBN 978-1-118-34328-9. [Google Scholar]
- Chang, C.-I. Hyperspectral Imaging; Springer: Boston, MA, USA, 2003; Volume 1, ISBN 978-1-4613-4820-7. [Google Scholar]
- Pearlman, J.S.; Barry, P.S.; Segal, C.C.; Shepanski, J.; Beiso, D.; Carman, S.L. Hyperion, a Space-Based Imaging Spectrometer. IEEE Trans. Geosci. Remote Sens. 2003, 41, 1160–1173. [Google Scholar] [CrossRef]
- Parashar, C.; Sharma, R.; Chattoraj, S.; Sengar, V.; Champati Ray, P. Identification and Mapping of Minerals by Using Imaging Spectroscopy in Southeastern Region of Rajasthan. Multispectral Hyperspectral Ultraspectral Remote Sens. Technol. 2016, 2016, 988013. [Google Scholar] [CrossRef]
- Kokaly, R.F.; Clark, R.N.; Swayze, G.A.; Livo, K.E.; Hoefen, T.M.; Pearson, N.C.; Wise, R.A.; Benzel, W.; Lowers, H.A.; Driscoll, R.L.; et al. USGS Spectral Library Version 7. US Geol. Surv. 2017, 1035, 61. [Google Scholar] [CrossRef]
- Kale, K.V.; Solankar, M.M.; Nalawade, D.B.; Dhumal, R.K.; Gite, H.R. A Research Review on Hyperspectral Data Processing and Analysis Algorithms. Proc. Natl. Acad. Sci. India Sect. Phys. Sci. 2017, 87, 541–555. [Google Scholar] [CrossRef]
- Buddhiraju, K.M.; Porwal, A. Hyperspectral Image Processing and Analysis. Curr. Sci. 2015, 108, 833–841. [Google Scholar]
- Bhargava, A.; Sachdeva, A.; Sharma, K.; Alsharif, M.H.; Uthansakul, P.; Uthansakul, M. Hyperspectral Imaging and Its Applications: A Review. Heliyon 2024, 10, e33208. [Google Scholar] [CrossRef] [PubMed]
- CHIME (Copernicus Hyperspectral Imaging Mission for the Environment)—eoPortal. Available online: https://www.eoportal.org/satellite-missions/chime-copernicus (accessed on 22 May 2025).
- Vines, P.L.; Zhang, J. High-Throughput Plant Phenotyping for Improved Turfgrass Breeding Applications. Grass Res. 2022, 2, 1. [Google Scholar] [CrossRef]
- Watson, D.S. On the Philosophy of Unsupervised Learning. Philos. Technol. 2023, 36, 28. [Google Scholar] [CrossRef]
- Hammer, P.C. Dynamic Programming. Richard Bellman. Princeton University Press, Princeton, N.J., 1957. xxv+ 342 pp. $6.75. Science 1958, 127, 976. [Google Scholar] [CrossRef]
- Nielsen, A.A. Spectral Mixture Analysis: Linear and Semi-Parametric Full and Iterated Partial Unmixing in Multi- and Hyperspectral Image Data. J. Math. Imaging Vis. 2001, 15, 17–37. [Google Scholar] [CrossRef]
- Kale, K.V.; Solankar, M.M.; Nalawade, D.B.; Kale, K.V.; Solankar, M.M.; Nalawade, D.B. Hyperspectral Endmember Extraction Techniques. In Processing and Analysis of Hyperspectral Data; IntechOpen: Rijeka, Croatia, 2019; ISBN 978-1-78985-110-6. [Google Scholar]
- Kior, A.; Yudina, L.; Zolin, Y.; Sukhov, V.; Sukhova, E. RGB Imaging as a Tool for Remote Sensing of Characteristics of Terrestrial Plants: A Review. Plants 2024, 13, 1262. [Google Scholar] [CrossRef]
- Vaughan, R.G.; Hook, S.J.; Calvin, W.M.; Taranik, J.V. Surface Mineral Mapping at Steamboat Springs, Nevada, USA, with Multi-Wavelength Thermal Infrared Images. Remote Sens. Environ. 2005, 99, 140–158. [Google Scholar] [CrossRef]
- Van Rossum, G.; Drake, F.L. Python 3 Reference Manual; CreateSpace: Scotts Valley, CA, USA, 2009; ISBN 1-4414-1269-7. [Google Scholar]
- Hunter, J.D. Matplotlib: A 2D Graphics Environment. Comput. Sci. Eng. 2007, 9, 90–95. [Google Scholar] [CrossRef]
- Oliphant, T.E. Guide to NumPy, 2nd ed.; CreateSpace Independent Publishing Platform: North Charleston, SC, USA, 2015; ISBN 1-5173-0007-X. [Google Scholar]
- Gillies, S.; Ward, B.; Petersen, A.S. Rasterio: Geospatial Raster I/O for Python Programmers. Available online: https://github.com/mapbox/rasterio (accessed on 3 May 2025).
- Welcome to Spectral Python (SPy). Available online: https://www.spectralpython.net/ (accessed on 5 March 2025).
- Pedregosa, F.; Varoquaux, G.; Gramfort, A.; Michel, V.; Thirion, B.; Grisel, O.; Blondel, M.; Prettenhofer, P.; Weiss, R.; Dubourg, V.; et al. Scikit-Learn: Machine Learning in Python. J. Mach. Learn Res. 2011, 12, 2825–2830. [Google Scholar]
- McInnes, L.; Healy, J.; Saul, N.; Großberger, L. UMAP: Uniform Manifold Approximation and Projection. J. Open Source Softw. 2018, 3, 861. [Google Scholar] [CrossRef]
- Virtanen, P.; Gommers, R.; Oliphant, T.E.; Haberland, M.; Reddy, T.; Cournapeau, D.; Burovski, E.; Peterson, P.; Weckesser, W.; Bright, J.; et al. SciPy 1.0: Fundamental Algorithms for Scientific Computing in Python. Nat. Methods 2020, 17, 261–272. [Google Scholar] [CrossRef]
- van der Walt, S.; Schönberger, J.L.; Nunez-Iglesias, J.; Boulogne, F.; Warner, J.D.; Yager, N.; Gouillart, E.; Yu, T. Scikit-Image: Image Processing in Python. PeerJ 2014, 2, e453. [Google Scholar] [CrossRef]
- Collette, A.; Kluyver, T.; Caswell, T.A.; Tocknell, J.; Kieffer, J.; Jelenak, A.; Scopatz, A.; Dale, D.; Chen; Vincent, T.; et al. h5py/h5py: 3.8.0. software version 3.8.0, Zenodo: Geneva, Switzerland, 2023. [Google Scholar] [CrossRef]
- Snow, A.D.; Whitaker, J.; Cochran, M.; Miara, I.; den Bossche, J.V.; Mayo, C.; Lucas, G.; Cochrane, P.; de Kloe, J.; Karney, C.; et al. pyproj4/pyproj: 3.7.1 Release, software version 3.7.1; Zenodo: Geneva, Switzerland, 2025. [CrossRef]
- Fletcher, M.C. PyOpenGL. Available online: https://pyopengl.sourceforge.net/ (accessed on 3 May 2025).
- Riverbank Computing PyQt6. Available online: https://www.riverbankcomputing.com/software/pyqt/ (accessed on 5 March 2025).
- Wold, S.; Esbensen, K.; Geladi, P. Principal Component Analysis. Chemom. Intell. Lab. Syst. 1987, 2, 37–52. [Google Scholar] [CrossRef]
- Comon, P. Independent Component Analysis, A New Concept? Signal Process. 1994, 36, 287–314. [Google Scholar] [CrossRef]
- Lee, D.D.; Seung, H.S. Learning the Parts of Objects by Non-Negative Matrix Factorization. Nature 1999, 401, 788–791. [Google Scholar] [CrossRef]
- Clark, R.N.; Swayze, G.; Boardman, J.; Kruse, F. Comparison of Three Methods for Materials Identification and Mapping with Imaging Spectroscopy. In Proceedings of the JPL, Summaries of the 4th Annual JPL Airborne Geoscience Workshop, Washington, DC, USA, 25–29 October 1993. [Google Scholar]
- Arthur, D.; Vassilvitskii, S. K-Means++: The Advantages of Careful Seeding. In Proceedings of the Eighteenth Annual ACM-SIAM Symposium on Discrete Algorithms; Society for Industrial and Applied Mathematics, New Orleans, LA, USA, 7–9 January 2007; pp. 1027–1034. [Google Scholar]
- Ankerst, M.; Breunig, M.M.; Kriegel, H.-P.; Sander, J. OPTICS: Ordering Points to Identify the Clustering Structure. SIGMOD Rec. 1999, 28, 49–60. [Google Scholar] [CrossRef]
- Szeliski, R. Computer Vision: Algorithms and Applications; Texts in Computer Science; Springer: London, UK, 2011; ISBN 978-1-84882-934-3. [Google Scholar]
- NMF (Scikit-Learn). Available online: https://scikit-learn.org/stable/modules/generated/sklearn.decomposition.NMF.html#sklearn.decomposition.NMF (accessed on 15 May 2025).
- Gross, W.; Schilling, H.; Middelmann, W. An Approach to Fully Unsupervised Hyperspectral Unmixing. In Proceedings of the 2012 IEEE International Geoscience and Remote Sensing Symposium, Munich, Germany, 22–27 July 2012; pp. 714–4717. [Google Scholar] [CrossRef]
- Cardoso-Fernandes, J.; Santos, D.; Rodrigues de Almeida, C.; Lima, A.; Teodoro, A.C. GREENPEG project team Spectral Library of European Pegmatites, Pegmatite Minerals and Pegmatite Host-Rocks—the GREENPEG Project Database. Earth Syst. Sci. Data 2023, 15, 3111–3129. [Google Scholar] [CrossRef]
- Manolakis, D.; Marden, D.; Shaw, G. Hyperspectral Image Processing for Automatic Target Detection Applications. Linc. Lab J. 2003, 14, 79–116. [Google Scholar]
- Camps-Valls, G. Kernel Spectral Angle Mapper. Electron. Lett. 2016, 52, 1218–1220. [Google Scholar] [CrossRef]
- Hastie, T.; Tibshirani, R.; Friedman, J. Unsupervised Learning. In The Elements of Statistical Learning: Data Mining, Inference, and Prediction; Hastie, T., Tibshirani, R., Friedman, J., Eds.; Springer: New York, NY, USA, 2009; pp. 485–585. ISBN 978-0-387-84858-7. [Google Scholar]
- Ester, M.; Kriegel, H.-P.; Sander, J.; Xu, X. A Density-Based Algorithm for Discovering Clusters in Large Spatial Databases with Noise. In Proceedings of the KDD’96: Proceedings of the Second International Conference on Knowledge Discovery and Data Mining, Portland, Oregon, 2–4 August 1996; pp. 226–231. [Google Scholar]
- Hajihosseinlou, M.; Maghsoudi, A.; Ghezelbash, R. Intelligent Mapping of Geochemical Anomalies: Adaptation of DBSCAN and Mean-Shift Clustering Approaches. J. Geochem. Explor. 2024, 258, 107393. [Google Scholar] [CrossRef]
- Zhan, C.; Bai, K.; Tu, B.; Zhang, W. Offshore Oil Spill Detection Based on CNN, DBSCAN, and Hyperspectral Imaging. Sensors 2024, 24, 11. [Google Scholar] [CrossRef] [PubMed]
- Bhuyan, R.; Borah, S. A Survey of Some Density Based Clustering Techniques. In Proceedings of the National Conference on Advancements in Information, Computer and Communication (AICC-2013), Mysore, India, 12 January 2013. [Google Scholar] [CrossRef]
| Disclaimer/Publisher’s Note: The statements, opinions and data contained in all publications are solely those of the individual author(s) and contributor(s) and not of MDPI and/or the editor(s). MDPI and/or the editor(s) disclaim responsibility for any injury to people or property resulting from any ideas, methods, instructions or products referred to in the content. |
© 2025 by the authors. Licensee MDPI, Basel, Switzerland. This article is an open access article distributed under the terms and conditions of the Creative Commons Attribution (CC BY) license (https://creativecommons.org/licenses/by/4.0/).


