Abstract
Blood pressure is a vital indicator of cardiovascular health and plays a crucial role in the early detection and management of heart-related diseases. However, current practices for recording blood pressure readings are still largely manual, leading to inefficiencies and data inconsistencies. To address this challenge, we propose a deep learning-based method for automated digit recognition and measurement-type classification (systolic, diastolic, and pulse) from images of blood pressure monitors. A total of 2147 images were collected and expanded to 3649 images using data augmentation techniques. We developed and trained three YOLOv8 variants (small, medium, and large). Post-training quantization (PTQ) was employed to optimize the models for edge deployment in a mobile health (mHealth) application. The quantized INT8 YOLOv8-small (YOLOv8s) model emerged as the optimal model based on the trade-off between accuracy, inference time, and model size. The proposed model outperformed existing approaches, including the RT-DETR (Real-Time DEtection TRansformer) model, achieving 99.28% accuracy, 96.48% F1-score, 641.40 ms inference time, and a compact model size of 11 MB. The model was successfully integrated into the mHealth application, enabling accurate, fast, and automated blood pressure tracking. This end-to-end solution provides a scalable and practical approach for enhancing blood pressure monitoring via an accessible digital platform.
1. Introduction
Blood pressure is one of the most widely used and informative clinical metrics for assessing cardiovascular health [1,2]. It comprises two key values: systolic pressure, measured during heart contraction, and diastolic pressure, measured during heart relaxation [3]. Regular monitoring of these values enables the early detection of cardiovascular conditions such as hypertension, heart attacks, and strokes [4]. Often referred to as a “silent killer,” elevated blood pressure can lead to serious complications without showing obvious symptoms [2], making routine monitoring essential for prevention. This is particularly important given that cardiovascular diseases remain the leading cause of death globally [5].
The rapid advancement of information and communication technologies has reshaped healthcare delivery through mobile health (mHealth) applications [6]. These applications empower users to track their health data and engage with healthcare providers remotely, promoting proactive and preventive care [7]. Mobile health applications have emerged as a key enabler of accessible and real-time health monitoring, contributing to improved personal health and wellness.
Despite these technological advances, the process of recording blood pressure readings—whether in clinical settings or through mHealth applications—still relies heavily on manual input. In healthcare facilities, readings are often written on paper before being transferred to digital systems, while users at home typically enter values manually into mHealth applications [8]. This approach is impractical, inefficient, and error-prone, with common issues including incorrect data entry and loss of physical records.
A potential alternative involves the use of wireless communication technologies, such as Bluetooth or Wi-Fi, to transfer measurements directly from blood pressure monitors to mobile applications. However, such features are uncommon in current commercial devices. According to the British & Irish Hypertension Society, fewer than 3% of the 176 recommended digital blood pressure monitors are equipped with Bluetooth connectivity [8]. Replacing existing monitors with newer models that support wireless transmission would be costly and impractical on a large scale, especially in low-resource settings.
To overcome these limitations, we propose a deep learning-based solution for automated digit recognition and measurement-type classification (systolic, diastolic, and pulse) from images of blood pressure monitors. Instead of relying on manual input or Bluetooth-enabled devices, users simply take a photo of the monitor’s seven-segment display using a smartphone. Our proposed model, integrated into a custom-developed mHealth application, automatically extracts and records the measurements. This approach provides a practical, scalable, and cost-effective alternative to enhance the usability and reliability of digital blood pressure tracking.
The rest of this paper is structured as follows. Section 2 reviews related works, identifies research gaps, and summarizes our contributions. Section 3 describes the proposed method, including dataset preparation, model training, model quantization, and mHealth application development. The evaluation results and discussion are presented in Section 4. Finally, conclusions are drawn in Section 5.
2. Related Works
Several studies have investigated methods for accurately detecting and interpreting seven-segment digits, which are commonly used in medical devices to display numerical information. Hjelm and Andersson [9] demonstrated that deep learning-based object detection models such as Faster Region-Based Convolutional Neural Network (Faster R-CNN) and You Only Look Once (YOLO) outperform traditional OCR-based approaches like Tesseract in detecting seven-segment digits on odometers, particularly in challenging image conditions affected by noise, blur, poor lighting, and oblique viewing angles. This result is relevant, as both odometers and blood pressure monitors employ seven-segment displays to present measurements.
Finnegan et al. [8] focused specifically on detecting and recognizing seven-segment digits in blood pressure monitors using conventional image-processing techniques. Their method achieved a digit localization F1-score of 80% and a classification accuracy of 89.70%. However, the blob extraction component of the algorithm occasionally misclassified visually similar digits, particularly between 0 and 8, and between 1 and 7. Moreover, the study was limited to model development and did not include deployment or integration into an mHealth application.
Another related work [10] proposed a mobile application-based system for reading seven-segment digits on various medical devices, including blood pressure monitors, blood glucose meters, and weight scales. The approach utilized computer vision techniques to extract digit features, followed by a random forest classifier for interpretation. The method achieved an overall accuracy of 98.20%. However, the input images used in the study were not realistic for practical use, as they were pre-cropped and contained only a single measurement type. Furthermore, the system faced classification challenges due to insufficient training data, particularly between digits 0 and 8, and performed poorly on blurry images. The model was not embedded within the mobile application but instead deployed on a remote server, which introduced reliance on internet connectivity and additional latency in the detection process.
In this work, we address the aforementioned limitations by proposing an end-to-end deep learning approach integrated into an mHealth application for accurate, efficient, and scalable digit recognition and measurement-type classification from blood pressure monitor images. The main contributions of this study are as follows:
- End-to-End Deep Learning Pipeline: We design a unified YOLOv8-based architecture that automatically detects the region of interest (ROI), without requiring manual cropping or selection, and performs accurate digit recognition. Subsequently, these digits are grouped and mapped to the corresponding measurement types (systolic, diastolic, and pulse) through a spatial-based postprocessing mechanism, utilizing the intersections of the bounding boxes.
- Model Optimization for Edge Deployment: To support real-time inference on mobile devices, we apply post-training quantization (PTQ) to compress the model. We evaluate the trade-offs between different YOLOv8 variants (small, medium, large) in terms of precision, recall, F1-score, accuracy, inference time, and model size under both float32 and INT8 configurations.
- Mobile Health Application Integration: We develop a fully functional Android-based mHealth application that integrates the optimized model. The app enables real-time camera capture, digit recognition, and classification, storing results for continuous blood pressure tracking without the need for manual input.
3. Methods
3.1. Dataset Preparation
The data preparation process consisted of data collection, data labeling, dataset splitting, and data augmentation stages. The data used in this study are images of blood pressure monitor measurement results that were collected through a combination of public datasets and image-scraping algorithms. Details about the sources of these datasets can be found in Table 1. Data sorting was performed to eliminate irrelevant or poor-quality data. Once the data was filtered, the labeling process was conducted using Roboflow [11] by applying bounding boxes to the input data (images), covering a total of 11 classes that included 10 classes for digits (0 to 9) and 1 class for indicating systolic pressure, diastolic pressure, or pulse rate. Figure 1 displays the class distribution of the whole dataset. In the dataset, Class 10 has the highest occurrence, as each image typically contains three objects from Class 10, representing the three blood pressure metrics: systolic, diastolic, and pulse rate. Following Class 10, Class 1 has the second-highest occurrence because systolic pressure values generally fall in the range of hundreds. The relatively high frequencies of Classes 7 and 8 can be attributed to diastolic pressure and pulse-rate values, which commonly fall within the 70 s to 80 s range.

Table 1.
Distribution of dataset sources.
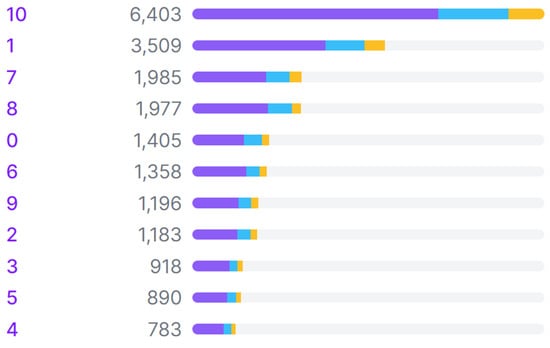
Figure 1.
Class distribution across training (purple), validation (blue), and test (yellow) sets in the dataset.
The labeled data was then divided into three sets: training, validation, and testing, with percentages of 70%, 20%, and 10%, respectively. To ensure the robustness of the trained model, the validation and test sets were carefully curated to be representative of the overall dataset in terms of image quality and real-world variability. Images exhibiting variations in blur levels, lighting conditions, and other artifacts commonly found in real-world settings were deliberately included in all sets. The final stage was data augmentation, which aimed to increase the volume and variety of training data twofold. This was intended to improve the model’s accuracy and flexibility in real-world conditions. The data augmentation process included rotations of , shearing of , brightness adjustments of , blurring of up to 3.5 pixels, and adding noise up to 5% of the total pixels. The dataset splits before and after the augmentation process can be seen in Table 2.
Table 2.
Dataset splitting before and after augmentation.
To further assess the model’s robustness in real-world scenarios, we also performed cross-validation using 10 additional images captured directly from a physical digital blood pressure monitor. These images were collected independently from the original dataset and were not part of the training, validation, or test sets. They reflect authentic variations in image quality, including lighting conditions, viewing angles, and device display differences that may occur during practical usage.
3.2. Model Development
We employed a deep learning model with the YOLOv8 architecture [14]. The YOLO (You Only Look Once) architecture was selected due to its typically superior performance in AP (average precision) and inference time compared to other object detection models [15]. YOLO has been in development since 2015 as an open-source algorithm, thereby providing accessibility to researchers and developers globally. Its popularity has led to a large community, resulting in thorough documentation, easier troubleshooting, and knowledge sharing among users [16]. YOLOv8, the eighth version of the YOLO architecture, exhibits enhancements in mAP over its predecessor [17].
YOLOv8 has five variants: nano, small, medium, large, and extra-large. A comparison of these five variants can be found in Table 3. As the model size increases, its network complexity and accuracy also improve, but its inference time is longer. In this study, the training process was conducted only for the small, medium, and large variants. The nano variant was not selected due to its relatively lower accuracy than the other variants. Meanwhile, the extra-large variant was not chosen because of its complexity and large size, making it unsuitable for use on smartphones with limited computational capabilities.
Table 3.
Performance benchmarks of YOLOv8 variants [18].
The three variants were trained using the following parameters: epochs = 500, patience = 50, batch size = {8, 16, 32}, image size = 640, IoU = 0.5, optimizer = auto. The automatic option for optimizer parameters resulted in the use of the best optimizer, SGD, with a learning rate of 0.01 and a momentum of 0.9. Meanwhile, other parameters that are not mentioned used the default configuration.
The model was developed using several Python (v3.10.12) libraries, such as OpenCV (v4.8.0.76), PyTorch (v2.3.0) [19], TensorFlow (v2.13.0) [20], TensorFlow Lite (v2.13.0) [21], etc. The Google Colab [22] environment was used to develop the model, while a laptop was used to develop the mHealth application. Smartphones, on the other hand, were used as the platform to deploy and run the mHealth application. In this study, 2 smartphones were utilized to evaluate performance across different hardware capabilities: a Xiaomi Redmi 9A, representing a low-end device, and a Samsung Galaxy A30S, representing a mid-range device. For clarity in the subsequent sections, these are referred to as Smartphone 1 (Xiaomi Redmi 9A) and Smartphone 2 (Samsung Galaxy A30S). The specifications of the working environments used in this work are shown in Table 4.
Table 4.
Specifications of the working environment.
In addition to the YOLOv8 model, which serves as our focus in this study, two other object detection models were selected for comparative analysis: YOLOv11 and RT-DETR. YOLOv11 represents the latest advancement in the YOLO (You Only Look Once) family, introducing architectural improvements that focus on enhancing both accuracy and inference speed through adaptive re-parameterization and improved feature aggregation [23]. Although our study primarily focuses on YOLOv8, YOLOv11 was included to provide insight into the ongoing evolution and potential performance ceiling of the YOLO framework. Meanwhile, RT-DETR (Real-Time DEtection TRansformer) is a recent transformer-based detector designed for real-time performance, incorporating a one-stage pipeline and query-based object decoding that eliminates the need for non-maximum suppression [24]. Its inclusion offers a perspective on how convolutional models like YOLO compare with transformer-based architectures in the specific task of digit recognition from medical device displays, especially those that use seven-segment digit representation.
3.3. Model Compression
Model compression employed a quantization technique aimed at enhancing detection speed and reducing the computational load of the model, given its deployment on smartphones, which typically have lower computational capabilities than computers. Quantization techniques were applied to convert model weights into 16-bit floating-point (FP16) and 8-bit-integer (INT8) precision. The FP16 quantization process was conducted using the export feature of the Ultralytics YOLOv8 library by specifying the format parameter to ‘tflite’ and enabling the ‘optimize’ and ‘half’ options. The ‘optimize’ parameter optimizes the model for mobile devices, while the ‘half’ parameter implements FP16 half-precision quantization. In addition to producing models in the FP16 format, the export results also yielded models in the 32-bit floating-point (FP32) TensorFlow format, which was used for quantization to INT8 precision using the TensorFlow library.
During INT8 quantization, a calibration process is necessary to estimate the range of all floating-point values in the model. Constant values such as weights and biases are easily calibrated. However, variable values like inputs, activations, and outputs require cycles of the inference process to be calibrated. Consequently, a dataset of approximately 100 to 500 samples is needed for this calibration process. In this study, a validation dataset consisting of 430 images was used as the calibration dataset. These validation samples were carefully selected to ensure representativeness in terms of class diversity, image quality, and real-world variability. This subset covered a broad range of image conditions, including different lighting levels, degrees of focus, and background complexities, typically encountered in practical mHealth environments. The representativeness of these calibration samples contributes to maintaining the robustness and accuracy of the quantized YOLOv8-small INT8 model despite the precision reduction inherent to quantization.
3.4. Evaluation Metrics
The trained models were evaluated using the following performance and efficiency metrics to assess their effectiveness in digit recognition tasks:
- Accuracy: Measures the overall proportion of correctly predicted digits out of all predictions, providing a general sense of model performance.
- Precision: Quantifies the proportion of true positive predictions among all predicted positives, indicating the model’s ability to avoid false positives.
- Recall: Also known as sensitivity, which evaluates the proportion of true positives captured out of all actual positive cases, reflecting the model’s ability to detect all relevant digits.
- F1-score: The harmonic mean of precision and recall, offering a balanced metric that is especially useful when dealing with class imbalance.
- Model size: Used to assess the memory footprint of each trained model, which is crucial for deployment on resource-constrained devices.
- Inference time: Refers to the amount of time the model takes to process an input and produce an output, highlighting the model’s efficiency and suitability for real-time applications.
Accuracy, precision, recall, and F1-score are formulated below. , , , and refer to true positive, true negative, false positive, and false negative, respectively.
3.5. Development of mHealth Application
The mHealth application features three main functionalities: capturing blood pressure readings using the camera, recording historical blood pressure data, and visualizing this data in graphical form. Additionally, there is an authentication feature that binds these data to a user account. The deep learning model developed in the previous stage is integrated into the mHealth application for the blood pressure reading feature.
This mHealth application encompasses a total of 9 use cases, as depicted in Figure 2. The first three use cases—login, register, and logout—are part of the authentication feature. Subsequently, the blood pressure data visualization feature is represented as the display measurement history use case. With this use case, users can see the blood pressure measurement history in the form of a line chart and a list of measurement logs. Furthermore, users can record their blood pressure measurements through the use case to add new blood pressure measurement results. Recording blood pressure data can be performed in two ways: by directly capturing measurement results or by uploading photos of the results from the smartphone’s image gallery. Meanwhile, user management features can be accessed through the last 4 use cases: view profile, add new user, delete user, and edit user information.
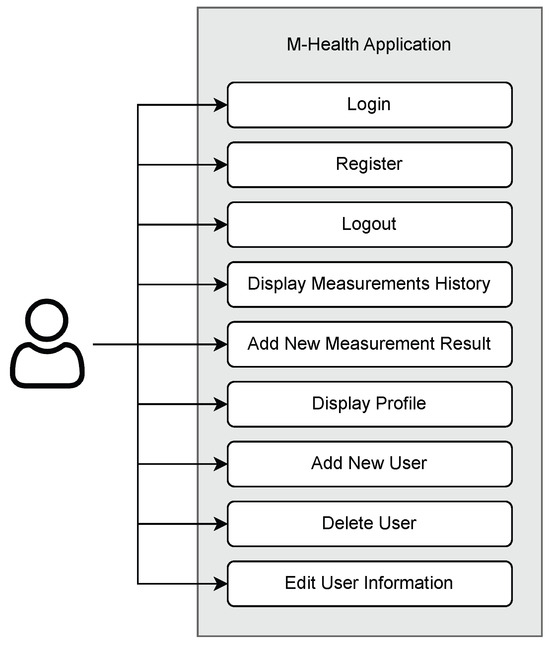
Figure 2.
Use-case diagram of the mHealth application.
The workflow of the blood pressure reading feature is illustrated in Figure 3. Generally, this process is divided into two main parts, digit detection and digit grouping, to derive blood pressure values. In the digit detection process, a deep learning model is utilized to detect and classify the digits present in the photo. Subsequently, in the grouping process, these digits are grouped and categorized into systolic pressure, diastolic pressure, and pulse-rate values. Then, the resulting data is stored in a database for use by the visualization feature. Data storage is implemented using a non-relational database, Cloud Firestore. This choice ensures that the data is not just stored locally, allowing users to access it even if their local data is deleted. Additionally, Cloud Firestore supports caching, eliminating the need for constant internet access to perform data reading and writing operations. The data on the user’s phone is automatically synchronized with the data stored in the cloud once the phone is connected to the internet. This design allows it to operate both online and offline, making it suitable for clinical settings where network connectivity may be limited.
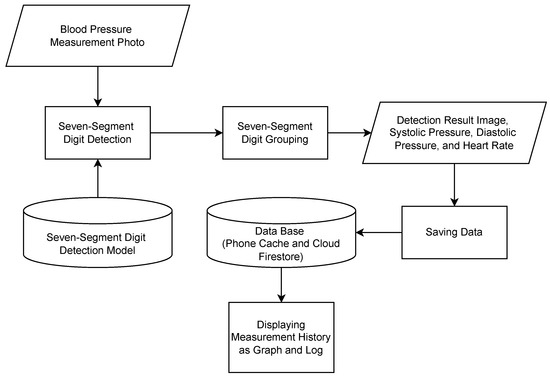
Figure 3.
Workflow of mHealth’s blood pressure measurement reading.
The grouping process of the detected digits into meaningful values is performed by considering the intersection percentage of a digit’s bounding box (represented by Classes ‘0’ to ‘9’) with a value’s bounding box (represented by Class ‘10’). An illustration of these classes and their corresponding bounding boxes is depicted in Figure 4. Value classes are displayed as purple boxes, while digit classes are displayed as boxes of other colors. A digit class is grouped into a value class (i.e., systolic, diastolic, or pulse) if its bounding box intersects with at least 75% of the corresponding value’s bounding box area along the vertical axis. This 75% threshold was determined empirically through controlled experiments under commonly observed real-world image conditions, including slight skew and display angle variations. The objective was to select a threshold that achieves reliable grouping accuracy while maintaining computational efficiency. This heuristic also accommodates occasional overextensions of digit bounding boxes beyond the expected value region.
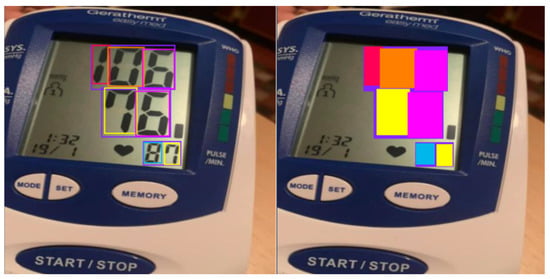
Figure 4.
Illustration of intersection of bounding boxes.
Once grouped, the digits within each group are sorted based on their positions from left to right. Then, concatenating these digits results in a meaningful value. As a result, three values representing the three blood pressure metrics are obtained. Subsequently, categorization into systolic pressure, diastolic pressure, or pulse-rate values is determined by sorting the values’ positions in the image from top to bottom.
Overall, this mHealth application consists of 5 pages: login page, register page, home page, camera page, and profile page. The user interface of the home, camera, and profile pages is displayed in Figure 5. In the implementation, these pages are divided into 3 activities: main activity, login activity, and register activity, with the main activity handling 3 fragments: home, camera, and profile.
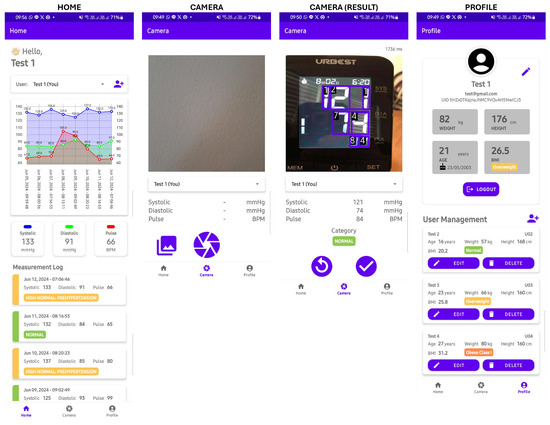
Figure 5.
The UI of the mHealth application.
On the login page, users are required to enter their registered email and password, while on the registration page, users are asked to provide personal information, including their name, email, password, weight, height, and date of birth. The name, email, and password are used for authentication purposes, while the weight, height, and date of birth are used to determine the categorization of blood pressure values.
The homepage serves the primary function of visualizing recorded blood pressure data within the application. On the homepage, there is a dropdown menu for selecting the user whose blood pressure data will be displayed. Meanwhile, on the profile page, users can view and modify their account details. Additionally, the profile page displays a list of other user profiles registered under the same account, allowing for user management operations such as adding, modifying, and deleting user data.
On the camera page, there is a camera view displaying live frames captured by the camera. This section also includes an overlay to draw bounding boxes surrounding the detected seven-segment digits. The detection results, such as inference time, systolic pressure, diastolic pressure, pulse rate, and blood pressure category, are displayed below the camera view. After capturing an image, users can confirm the detection results or retake the picture. In addition to using the camera, users have the option to use images from the phone’s image gallery by pressing the gallery button.
4. Results and Discussion
4.1. Evaluation of Model Training
The evaluation metrics for the training results of the three variants of the digit detection model (YOLOv8) are presented in Table 5. Based on these results, the training configuration with a batch size of 8 was found to be optimal for each variant. This is evidenced by the highest accuracy, precision, recall, and F1-score values achieved with this setting. The YOLOv8 model employs a deep learning technique that does not require manual feature extraction; it can automatically extract relevant features from data and improve accuracy over time with training. This capability allows the model to be more adaptable in managing data variability, such as blur, perspective, rotation, and lighting factors. The YOLOv8 model was trained with a sufficiently large dataset and showed good generalization capability, enabling it to recognize objects, specifically seven-segment digits in this context, in unseen situations during training [25].
Table 5.
Evaluation metrics for the training results of the three YOLOv8 variants across different batch sizes (8, 16, and 32). Bold values indicate the best performance for each metric.
Among the three trained YOLOv8 variants, the medium variant achieved the highest accuracy, recall, and F1-score, even though there were no significant differences in their metrics. Significant differences were observed only in the model size and inference time. The size and inference time of the YOLOv8-small variant were approximately half that of the medium variant and one-fourth that of the large variant. This is due to the simpler network structure of the YOLOv8-small variant compared to the YOLOv8-medium and YOLOv8-large variants.
Figure 6 shows the training curves of the YOLOv8-small variant. The training and validation losses (box loss, classification loss, and distribution focal loss) steadily decreased throughout the training epochs, indicating proper convergence. The evaluation metrics—precision, recall, mAP@0.5, and mAP@0.5:0.95—consistently improved and stabilized near the end of training. This shows that both variants were able to learn effectively and maintain high detection quality.
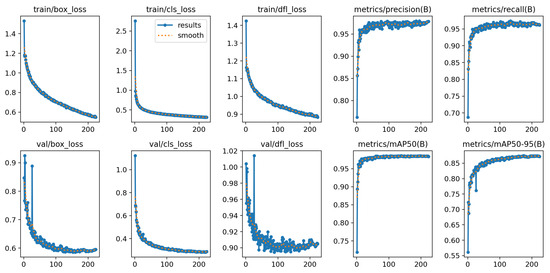
Figure 6.
Training results of the YOLOv8-small model.
Further insight into the performance of the YOLOv8-small variant is provided in Figure 7, which compares the confusion matrices of models trained with and without data augmentation. The matrix for the augmented model (right) exhibits stronger diagonal dominance and fewer misclassifications overall, indicating better digit detection and classification.
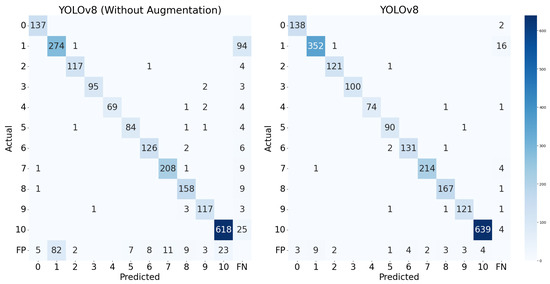
Figure 7.
Confusion matrix of the YOLOv8-small model.
Notably, the augmentation strategy (including rotation, shearing, and brightness adjustments) led to substantial improvements across most digit classes, particularly those that were previously underrepresented or prone to confusion. For instance, the number of correct predictions for digit ‘1’ increased from 274 to 352, those for digit ‘3’ improved from 64 to 74, and those for digit ‘10’, which appeared far more frequently due to its representation of grouped digits, increased from 618 to 639. This confirms that data augmentation not only benefits overall performance but also helps mitigate the effects of class imbalance, improving the recognition of both frequent and less frequent digits. Although Class ‘10’ was overrepresented, the model maintained high precision and recall across all classes, with minimal false positives and false negatives. These observations suggest that the augmented model generalizes well, even under skewed class distributions.
4.2. Evaluation of Model Quantization
The evaluation metrics for the results of the quantization process of the digit detection model are presented in Table 6. Based on the results of 16-bit quantization, there were no significant changes in accuracy, precision, recall, F1-score, and model size. In fact, the changes in these five metrics were almost negligible, approaching 0%. However, there was a significant reduction in inference time, particularly for the small variant, which exhibited a decrease of 36.60%. Model size remained relatively unchanged because, as stated before, the base model is a PyTorch model, so they are already stored in 16-bit floating-point precision. Overall, the FP16 version of the YOLOv8-small variant proved to have the smallest size and the fastest inference speed.
Table 6.
Evaluation metrics for quantization results on three YOLOv8 model variants.
In contrast, with 8-bit quantization, there was a significant reduction in both model size and inference time. Model size was successfully compressed to half that of the base model. The INT8 version of the YOLOv8-small variant had the smallest size, at only 11 MB. Generally, there was a slight decrease in precision for models quantized to INT8 precision, ranging from 2.50% to 4.00%. The YOLOv8-medium (YOLOv8m) model was the best-performing INT8 model in terms of accuracy, precision, and F1-score, although compared to other INT8 models, the differences were insignificant.
So, based on the results, it can be concluded that quantization was effective in compressing the model. This is demonstrated by the fact that quantization generally reduces model size and inference time without significant drops in accuracy, precision, recall, and F1-score. When considering all quantized variants, the FP16 version of the YOLOv8-medium (YOLOv8m) model achieved the best accuracy, precision, recall, and F1-score. However, the differences in these four metrics were not significant compared to the other quantized models. Since the model is intended for deployment in a mobile (mHealth) application, model size and inference time are the primary considerations in selecting the final model. Based on the data, the INT8 version of the YOLOv8-small (YOLOv8s) variant had the smallest size compared to the other quantized models. Additionally, its inference time was not significantly different from that of the FP16 version of the YOLOv8-small variant, which had the fastest inference time.
To formalize the selection of the final model, we conducted a Pareto analysis incorporating four criteria: accuracy, F1-score, inference time, and model size. In this analysis, predictive performance is represented as the mean of the accuracy and F1-score, while computational cost is defined as the mean of the normalized inference time and model size. These metrics were plotted in two-dimensional space, with performance on one axis and computational cost on the other. Prior to visualization, inference time and model size were each normalized to the range [0, 1], where 0 corresponds to the minimum and 1 to the maximum observed value across all models. Models located on the Pareto frontier are considered optimal, as they achieve a favorable trade-off—maximizing predictive performance while minimizing computational demands.
As shown in Figure 8, YOLOv8-small INT8, YOLOv8-small FP16, and YOLOv8-medium FP16 lie on the Pareto frontier, representing models that offer the best trade-off between predictive performance and computational efficiency. This analysis highlights their potential for deployment in resource-constrained mHealth applications, where both accuracy and runtime efficiency are critical. Although the differences in accuracy and F1-score among the three models were marginal, YOLOv8-small INT8 demonstrated the highest normalized computational efficiency due to its quantized architecture. The INT8 precision significantly reduced model size and inference latency, making it particularly suitable for real-time deployment on mobile or embedded devices. This efficiency, combined with its strong predictive performance, makes YOLOv8-small INT8 the optimal model, effectively balancing high detection quality with the practical requirements of mHealth applications. Therefore, considering these factors, the INT8 quantized version of the YOLOv8-small (YOLOv8s) variant was chosen as the final model for use in the mHealth application.
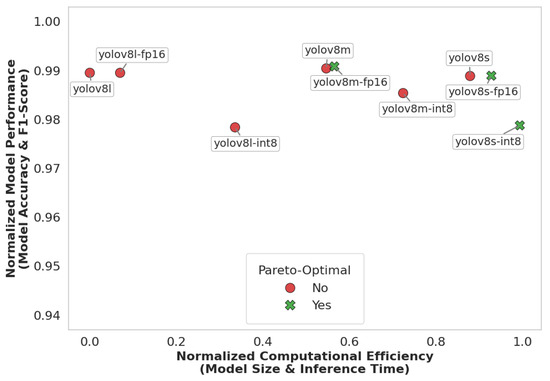
Figure 8.
Model performance and efficiency trade-off.
4.3. Performance Comparison with Other Models
To further validate the performance of our proposed model (YOLOv8-small), we conducted a comparative study with two other deep learning models: RT-DETR (Real-Time Detection Transformer) and YOLOv11-small. RT-DETR represents a transformer-based detection framework, while YOLOv11 is the latest evolution of the YOLO family. All models were evaluated on the same training and test datasets under identical experimental conditions to ensure fair benchmarking.
As shown in Table 7, YOLOv8s attained a strong accuracy of 99.70%, outperforming RT-DETR (98.27%) and nearly matching the performance of YOLOv11s (+0.08%). Notably, YOLOv8s achieved a higher F1-score than RT-DETR, with a delta of 3.85%, reflecting a well-balanced trade-off between precision and recall. While YOLOv11s marginally exceeded YOLOv8s in raw accuracy and recall, the differences were minimal and may be negligible in practical applications, particularly in resource-constrained environments. In terms of efficiency, YOLOv8s performed better than RT-DETR, as it has a smaller model size (21.51 MB) and faster inference times (974.50 ms). RT-DETR, although competitive in recall, suffered from a large model footprint (63.10 MB) and significantly slower inference (2391.70 ms), making it less suitable for real-time deployment.
Table 7.
Evaluation metrics for the training results of three deep learning models.
The confusion matrices in Figure 9 further illustrate model behavior. Both YOLOv8 and YOLOv11 show strong diagonal patterns, indicating high prediction accuracy across all digit classes. YOLOv8 maintains low false positive () and false negative () rates, and only occasional confusion occurs between visually similar digits. in contrast, RT-DETR demonstrates more frequent misclassifications and false predictions, especially on digit ‘1’.
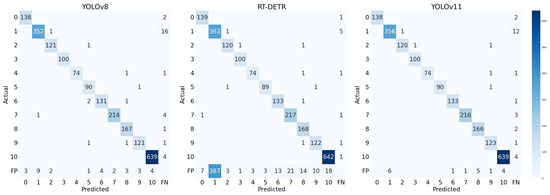
Figure 9.
Confusion matrix of the test results of 3 models.
In comparison, RT-DETR illustrates the promise of transformer-based detection but currently lacks the computational efficiency needed for edge-level applications. Meanwhile, YOLOv8s provides a better trade-off between accuracy, speed, and model size for deployment in our mHealth application, especially considering the resource-constrained environment of mobile devices.
4.4. Performance Comparison with Other Works
A comparison of the proposed seven-segment digit detection model with other works is presented in Table 8. Overall, the developed model successfully detected seven-segment digits automatically and accurately without requiring manual ROI selection. The model presented in this study achieved higher accuracy (99.28%) and F1-score (96.48%) compared to other works [8,10,26]. Additionally, it detected blood pressure measurement images containing shadow reflections and illumination effects by leveraging data variability and augmentation techniques. This demonstrates that the developed model has effectively addressed the challenges faced by Finnegan et al. [8] and Shenoy and Aalami [10]. Furthermore, the model has been compressed to INT8 precision, resulting in a smaller model size and inference time. Therefore, this model can run efficiently with low latency on edge devices such as mobile phones. Consequently, there is no need to deploy the model on servers like the implementation by Wannachai et al. in their research [26].
Table 8.
Performance comparison with other works.
4.5. Evaluation of mHealth Application
The outcomes of the model’s detection process include bounding boxes for each defined class. Hence, further processing within the mHealth application is required to categorize and identify the detected digits as blood pressure values: systolic pressure, diastolic pressure, and pulse rate. Subsequently, an evaluation of these processes was also necessary to assess their effectiveness and accuracy.
To verify its performance, the model was tested on 40 samples of blood pressure measurements. These samples included 30 images from a test dataset and 10 images directly captured from a digital blood pressure monitor. The inclusion of 10 directly captured images was intended to validate that the model had not overfit. Based on the test results, the accuracy of digit grouping was found to be 96.67%, indicating that only 4 out of 120 blood pressure metrics were incorrectly identified.
To evaluate performance scalability on mobile platforms, inference tests were conducted on two Android smartphones: Smartphone 1, representing a low-end device, and Smartphone 2, representing a mid-range device. The hardware specifications of the devices used are detailed in Table 4. The average inference times were 1976.50 ms for Smartphone 1 and 1867.60 ms for Smartphone 2, both showing approximately a threefold increase compared to the measurement on Google Colab (CPU). This increase is attributed to differences in device specifications between Google Colab as the model development platform and the mobile phone as the mHealth deployment platform. Mobile phones typically have limited computational capabilities compared to the hardware of Google Colab, thus resulting in longer inference times for model execution. However, while there was a performance difference between the two smartphones, the results indicate that even low-end devices are capable of running the model seamlessly, albeit with slightly longer inference times. The performance of the model in terms of accuracy was also the same on both devices.
Additionally, the model within the mHealth application was tested on five general cases, including LCD color variations, variations in the layout of blood pressure monitor values, the distance and angle of image capture, and image disturbances such as blur and light reflections. A sample of the test results is shown in Figure 10 where the upper panel shows the input images captured from various blood pressure monitors, while the middle panel shows the corresponding output images with digit predictions generated by the proposed deep learning model. The lower panel presents the extracted systolic, diastolic, and pulse values along with the classification category. Based on the results in the table, the model successfully detected blood pressure values across these defined cases with satisfactory performance. For cases a and b, the model accurately recognized blood pressure values across various digital blood pressure monitor layouts. In cases d and e, the model also successfully detected images taken from a distance and slightly blurred, as long as they remained within reasonable limits for manual readability by the average person. The model only failed to detect digits in some images from the test case involving an extreme angle (more than 45 degrees) of image capture, where the angle was too steep for the model to accurately recognize the seven-segment digits. Overall, the mHealth application has proven capable of accurately reading blood pressure measurement results.
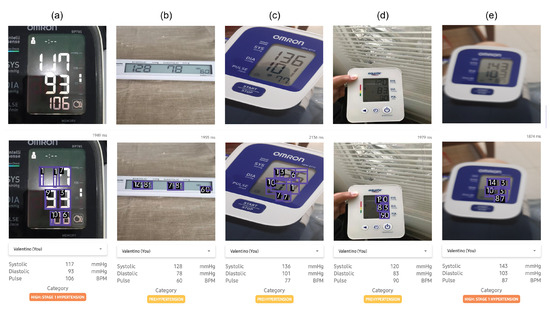
Figure 10.
Sample of the test results for the mHealth application on several cases: (a) digit color and lighting conditions, (b) monitor layout, (c) capture angle, (d) capture distance, and (e) blurred conditions. The upper panel represent the input images whereas the middle panel represent the output images predicted using the proposed deep learning model.
5. Conclusions
In this study, we proposed and developed an efficient deep learning-based method for automated digit recognition and measurement-type classification (systolic, diastolic, and pulse) from images of blood pressure monitors. The core of the system is a lightweight YOLOv8s model optimized using post-training quantization (INT8 precision) to enable deployment on edge devices. The model achieved a high digit detection accuracy of 99.28%, with an inference time of 661.4 ms on a Google Colab CPU and 1867.6 ms on a mid-range mobile phone while maintaining a compact model size of only 11 MB. The proposed model outperformed the Real-Time DEtection TRansformer (RT-DETR) across multiple metrics, including accuracy, F1-score, model size, and inference time.
The proposed model was further evaluated through integration into a mobile health (mHealth) application, demonstrating practical performance with 96.67% accuracy on a set of 40 test samples. These results confirm the model’s robustness and feasibility for real-world use, especially in scenarios where manual data entry or Bluetooth-enabled devices are impractical or unavailable. Overall, the proposed deep learning approach offers a scalable, accurate, and resource-efficient solution for automated digit recognition for blood pressure monitoring.
Author Contributions
Conceptualization, N.A. and R.M.; methodology, N.A. and H.V.T.; software, H.V.T.; validation, N.A., H.V.T. and R.M.; formal analysis, N.A. and H.V.T.; investigation, H.V.T.; resources, N.A.; data curation, H.V.T.; writing—original draft preparation, N.A. and H.V.T.; writing—review and editing, N.A., H.V.T. and R.M.; visualization, N.A. and H.V.T.; supervision, N.A. and R.M.; project administration, N.A.; funding acquisition, N.A. All authors have read and agreed to the published version of the manuscript.
Funding
This work was financially supported by Hibah Riset Unggulan Pusat dan Penelitian (RU3P) 2024 (Contract No. 766.20/IT1.B07.5/TA.00/2024) managed by The Institute for Science and Technology Development (LPIT), Institut Teknologi Bandung.
Data Availability Statement
The original data presented in the study are openly available in Roboflow Universe at https://universe.roboflow.com (accessed on 17 June 2025) and https://cameralab.eng.ox.ac.uk (accessed on 17 June 2025).
Conflicts of Interest
The authors declare no conflicts of interest.
References
- Khan, Y.; Ostfeld, A.E.; Lochner, C.M.; Pierre, A.; Arias, A.C. Monitoring of vital signs with flexible and wearable medical devices. Adv. Mater. 2016, 28, 4373–4395. [Google Scholar] [CrossRef] [PubMed]
- Man, P.K.; Cheung, K.L.; Sangsiri, N.; Shek, W.J.; Wong, K.L.; Chin, J.W.; Chan, T.T.; So, R.H.Y. Blood Pressure Measurement: From Cuff-Based to Contactless Monitoring. Healthcare 2022, 10, 2113. [Google Scholar] [CrossRef] [PubMed]
- Muntner, P.; Shimbo, D.; Carey, R.M.; Charleston, J.B.; Gaillard, T.; Misra, S.; Myers, M.G.; Ogedegbe, G.; Schwartz, J.E.; Townsend, R.R.; et al. Measurement of blood pressure in humans: A scientific statement from the American Heart Association. Hypertension 2019, 73, e35–e66. [Google Scholar] [CrossRef] [PubMed]
- Pistoia, F.; Sacco, S.; Degan, D.; Tiseo, C.; Ornello, R.; Carolei, A. Hypertension and stroke: Epidemiological aspects and clinical evaluation. High Blood Press. Cardiovasc. Prev. 2016, 23, 9–18. [Google Scholar] [CrossRef] [PubMed]
- Rana, J.S.; Khan, S.S.; Lloyd-Jones, D.M.; Sidney, S. Changes in mortality in top 10 causes of death from 2011 to 2018. J. Gen. Intern. Med. 2021, 36, 2517–2518. [Google Scholar] [CrossRef] [PubMed]
- McCool, J.; Dobson, R.; Whittaker, R.; Paton, C. Mobile health (mHealth) in low-and middle-income countries. Annu. Rev. Public Health 2022, 43, 525–539. [Google Scholar] [CrossRef] [PubMed]
- Kwee, V.; Widjojo, H. Understanding the Determinants of m-Health Adoption in Indonesia. J. Manaj. Teor. Dan Terap. 2022, 15, 408–422. [Google Scholar] [CrossRef]
- Finnegan, E.; Villarroel, M.; Velardo, C.; Tarassenko, L. Automated method for detecting and reading seven-segment digits from images of blood glucose metres and blood pressure monitors. J. Med. Eng. Technol. 2019, 43, 341–355. [Google Scholar] [CrossRef] [PubMed]
- Hjelm, M.; Andersson, E. Benchmarking Object Detection Algorithms for Optical Character Recognition of Odometer Mileage. 2022. Available online: https://www.diva-portal.org/smash/get/diva2:1688125/FULLTEXT01.pdf (accessed on 1 January 2024).
- Shenoy, V.N.; Aalami, O.O. Utilizing smartphone-based machine learning in medical monitor data collection: Seven segment digit recognition. AMIA Annu. Symp. Proc. 2017, 2017, 1564. [Google Scholar] [PubMed]
- Roboflow. Roboflow: Computer Vision Tools for Developers and Enterprises. 2025. Available online: https://roboflow.com (accessed on 17 March 2025).
- AH. Esfigmo Dataset. 2024. Available online: https://universe.roboflow.com/ah-kkl2g/esfigmo (accessed on 1 January 2024).
- Ega, A.V. Automated BP Device Digit Recognition Dataset. 2023. Available online: https://universe.roboflow.com/adindra-vickar-ega-odhei/automated-bp-device-digit-recognition (accessed on 1 January 2024).
- Sohan, M.; Sai Ram, T.; Rami Reddy, C.V. A review on yolov8 and its advancements. In International Conference on Data Intelligence and Cognitive Informatics; Springer: Singapore, 2024; pp. 529–545. [Google Scholar]
- Boesch, G. Object Detection in 2024: The Definitive Guide. 2024. Available online: https://viso.ai/deep-learning/object-detection/ (accessed on 5 July 2024).
- Setiyono, B.; Amini, D.A.; Sulistyaningrum, D.R. Number plate recognition on vehicle using YOLO-Darknet. J. Phys. Conf. Ser. 2021, 1821, 012049. [Google Scholar] [CrossRef]
- Ultralytics. YOLOv8.2: Unleashing Next-Gen AI Capabilities. 2023. Available online: https://github.com/ultralytics/ultralytics (accessed on 20 January 2024).
- Ultralytics. Explore Ultralytics YOLOv8. 2024. Available online: https://docs.ultralytics.com/models/yolov8/ (accessed on 17 March 2025).
- Paszke, A.; Gross, S.; Massa, F.; Lerer, A.; Bradbury, J.; Chanan, G.; Killeen, T.; Lin, Z.; Gimelshein, N.; Antiga, L.; et al. Pytorch: An imperative style, high-performance deep learning library. Adv. Neural Inf. Process. Syst. 2019, 32, 8026–8037. [Google Scholar]
- Abadi, M.; Barham, P.; Chen, J.; Chen, Z.; Davis, A.; Dean, J.; Devin, M.; Ghemawat, S.; Irving, G.; Isard, M.; et al. TensorFlow: A system for large-scale machine learning. In Proceedings of the 12th USENIX Symposium on Operating Systems Design and Implementation (OSDI 16), Savannah, GA, USA, 2–4 November 2016; pp. 265–283. [Google Scholar]
- David, R.; Duke, J.; Jain, A.; Janapa Reddi, V.; Jeffries, N.; Li, J.; Kreeger, N.; Nappier, I.; Natraj, M.; Wang, T.; et al. TensorFlow lite micro: Embedded machine learning for tinyML systems. Proc. Mach. Learn. Syst. 2021, 3, 800–811. [Google Scholar]
- Google Colaboratory. Google Colaboratory: Jupyter Notebooks in the Cloud. 2024. Available online: https://colab.research.google.com/ (accessed on 23 August 2024).
- Jocher, G.; Qiu, J. Ultralytics YOLO11. Version 11.0.0. Available under AGPL-3.0 license. 2024. Available online: https://github.com/ultralytics/ultralytics (accessed on 1 January 2024).
- Lv, W.; Xu, S.; Zhao, Y.; Wang, G.; Wei, J.; Cui, C.; Du, Y.; Dang, Q.; Liu, Y. DETRs Beat YOLOs on Real-time Object Detection. arXiv 2023, arXiv:2304.08069. [Google Scholar]
- Gushima, K.; Kashima, T. Automatic Generation of Seven-Segment Display Image for Machine-Learning-Based Digital Meter Reading. In Proceedings of the PHM Society Asia-Pacific Conference, Tokyo, Japan, 11–14 September 2023; Volume 4. [Google Scholar]
- Wannachai, A.; Boonyung, W.; Champrasert, P. Real-Time Seven Segment Display Detection and Recognition Online System Using CNN. In Proceedings of the Bio-inspired Information and Communication Technologies: 12th EAI International Conference, BICT 2020, Shanghai, China, 7–8 July 2020; Proceedings 12. Springer: Cham, Switzerland, 2020; pp. 52–67. [Google Scholar]
Disclaimer/Publisher’s Note: The statements, opinions and data contained in all publications are solely those of the individual author(s) and contributor(s) and not of MDPI and/or the editor(s). MDPI and/or the editor(s) disclaim responsibility for any injury to people or property resulting from any ideas, methods, instructions or products referred to in the content. |
© 2025 by the authors. Licensee MDPI, Basel, Switzerland. This article is an open access article distributed under the terms and conditions of the Creative Commons Attribution (CC BY) license (https://creativecommons.org/licenses/by/4.0/).