1. Introduction
Early clinical decision support systems codified physician-authored guidelines into rule-based systems to help with decisions about patient diagnosis, treatments or outcomes [
1,
2,
3,
4,
5]. By contrast, many recent approaches are data-driven. They aim to build predictive models from massive data sets of electronic health records [
6,
7,
8,
9,
10]. These approaches are often specialized [
11,
12,
13,
14,
15,
16], focusing on a small set of treatments or procedures for a specific patient group with certain diagnostic and demographic characteristics [
9,
10,
17,
18]. While these specialized models can achieve high predictive accuracy [
9,
10,
11,
12], we seek a generalizable model for the extremely diverse set of patients seen and treatments provided in an Intensive Care Unit (ICU).
1.1. Goal and Workflow
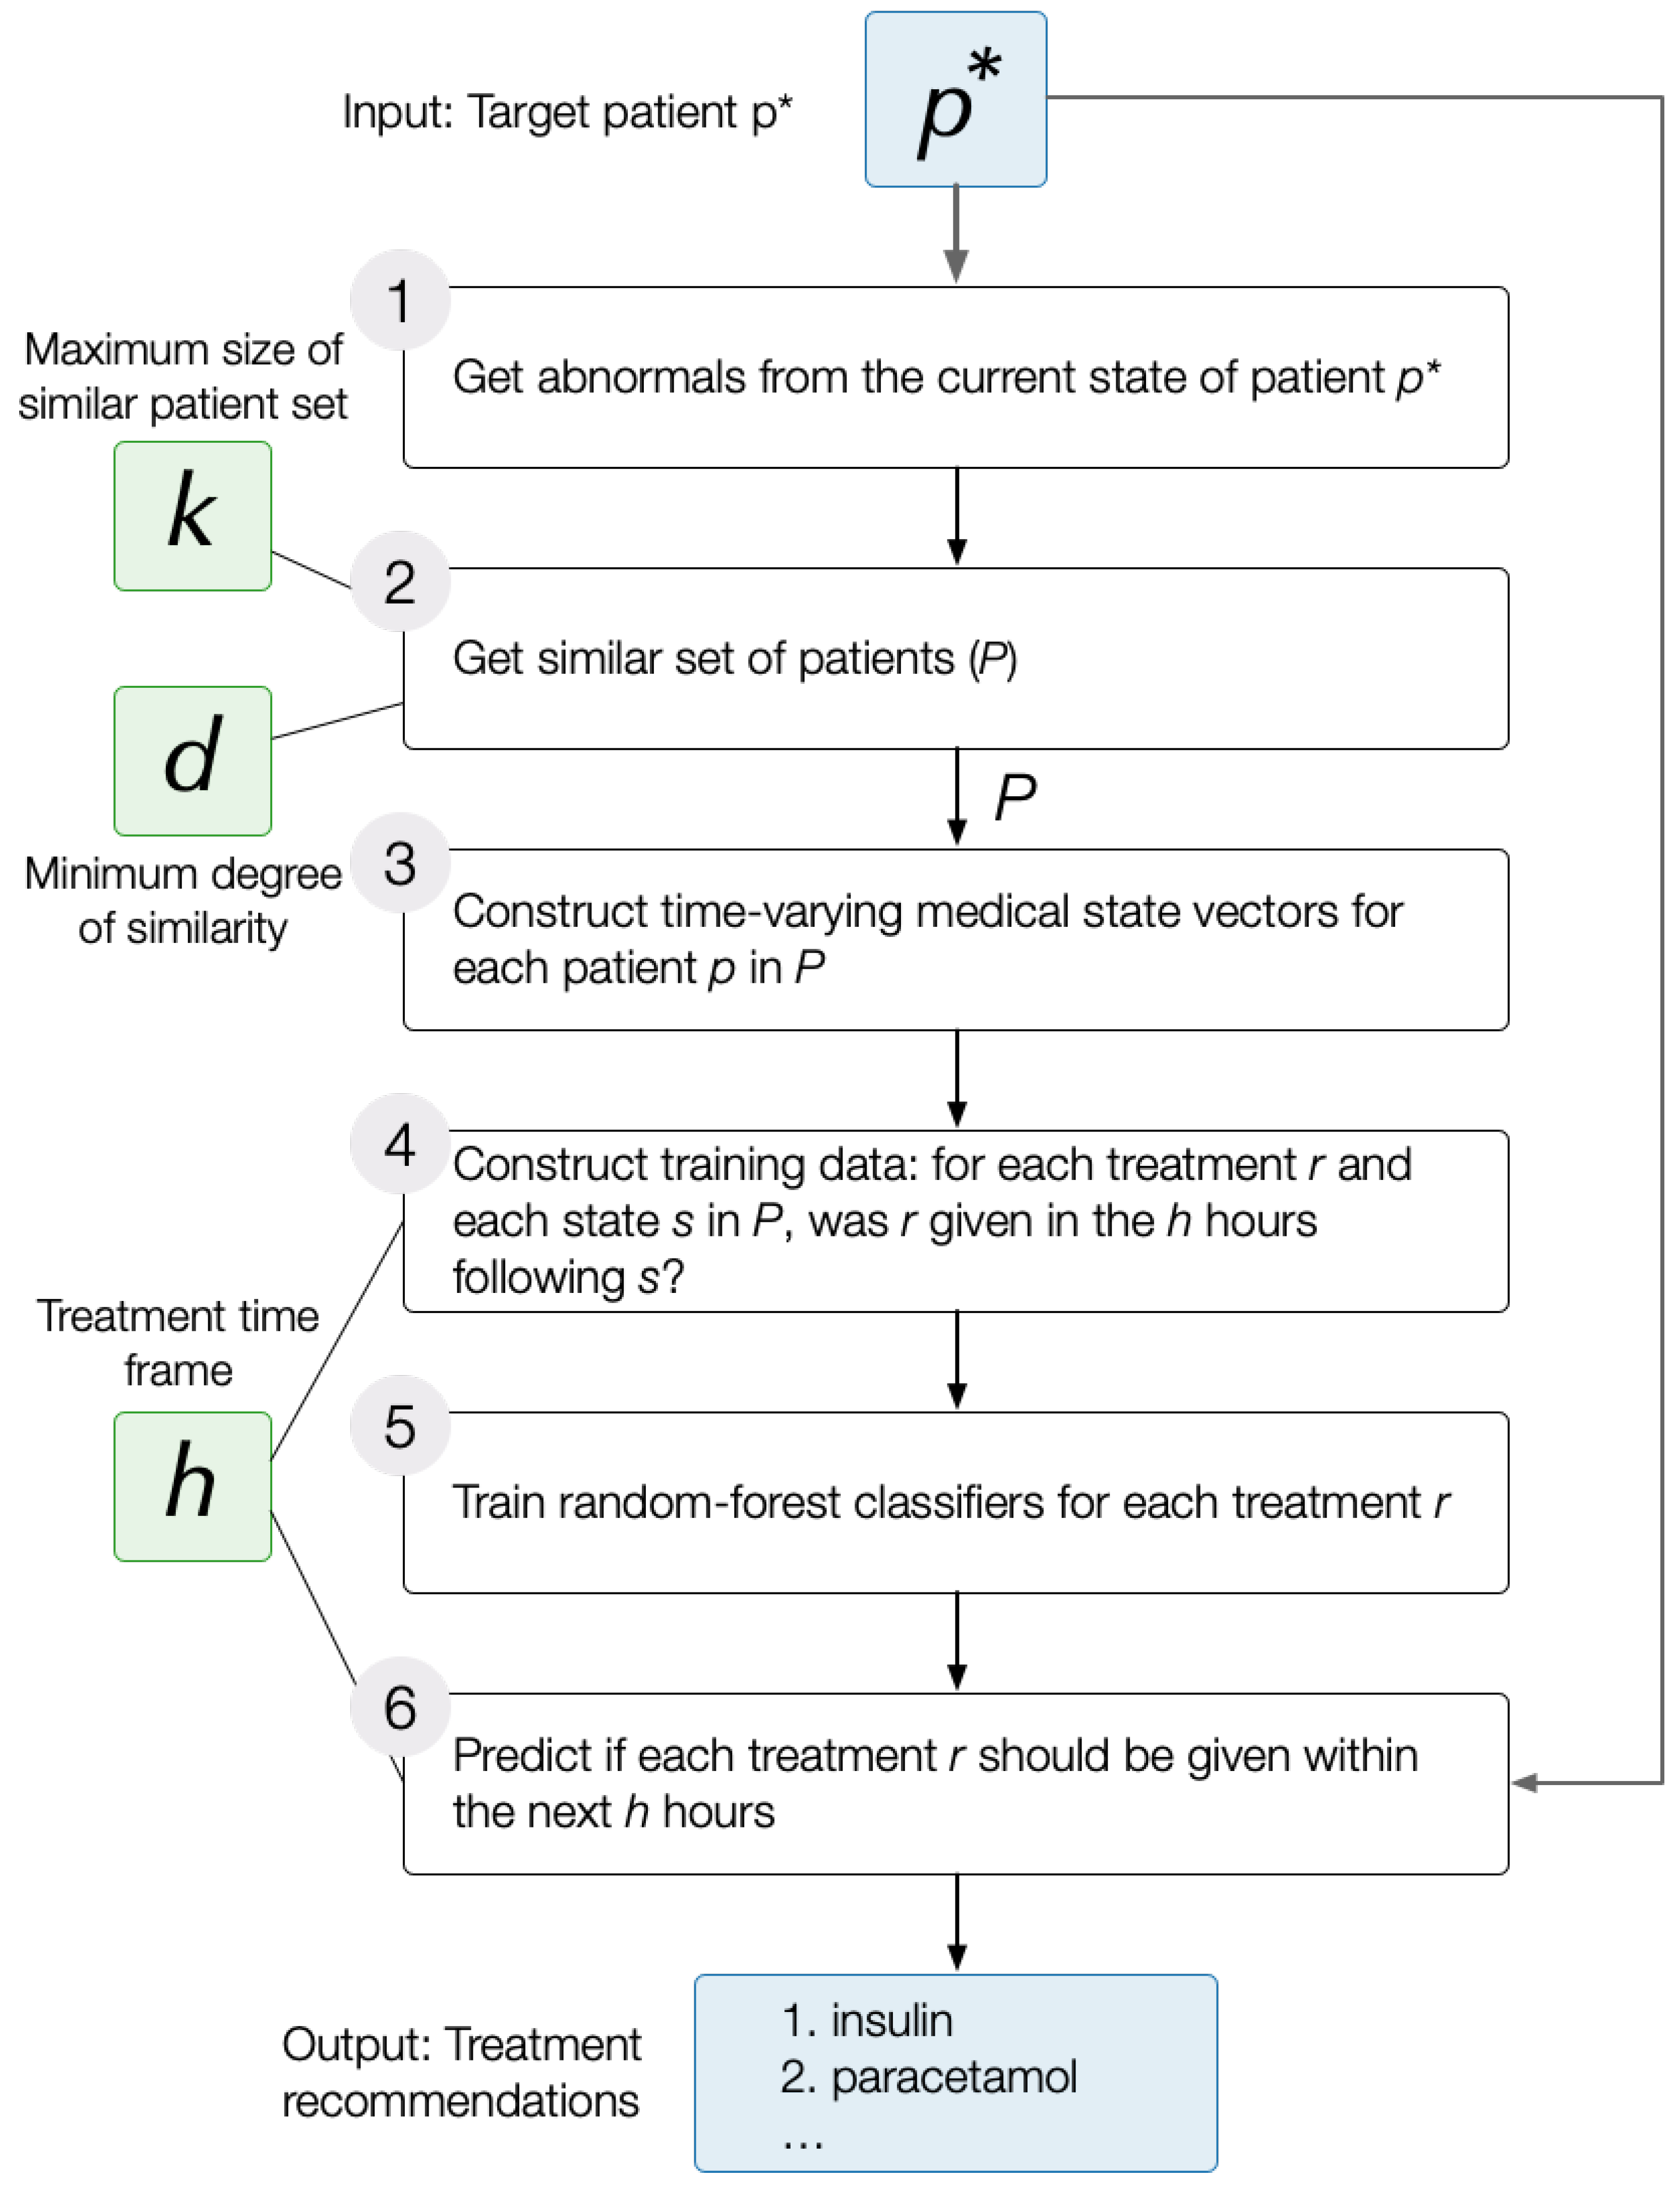
DataToCare is a generic ICU treatment recommendation system that predicts for a target patient a set of treatments ℞ using the following workflow:
Identify the aspects of the target patient’s current state, , that are abnormal. We use a data-driven approach to determine abnormality: we sort the values for any test or measurement (e.g., temperature) of discharged patients. Those below a low percentile cutoff are considered low abnormal or and those above a high percentile cutoff are considered high abnormal.
Extract a set of 200
relevant patients,
, that are similar to the target patient
, where similarity is determined based on the abnormals in state
(
Section 3.2).
Train a set of
independent treatment classifiers, one for each treatment
r in the set of treatments,
℞, administered to any patient in this set of relevant patients
(
Section 3.3 and
Section 3.4). Each classifier applies to the state
of each patient
p in
from the time of admission (
) to any later time (
). The classifier for treatment
r is trained based on whether
r was given within a time horizon of
h hours after
t or not.
Provide the list of predicted treatments for the target patient in state within time horizon h. Because conditions change quickly in an ICU setting, we focus on predictions within the next two hours.
The Use of Abnormalities to Characterize Patients. Patients are discharged from ICUs when they have been generally stabilized, even if they are not in perfect health. Our approach for determining normal vs. abnormal patient measurements discovers typical values for different measurements on discharge. Those measurements below most of those typical values are considered “low abnormal” (the lowest 10%), and those above most of those typical values are considered “high abnormal” (above the 90th percentile, the highest 10%). All others are “normal”.
Experts and skilled decision makers in high-pressure situations such as the ICU often use recognition-primed decision-making to match the current situation to similar typical cases where certain actions were appropriate or successful [
19]. By contrast, because
treatments often target current abnormalities, we posit that the treatments received by patients with similar abnormalities are likely to be the most relevant. Our experiments in
Section 5 show that this approach is particularly helpful for the rarest 40% of treatments.
1.2. Contributions
This paper makes the following contributions:
We describe the closely related prior work and compare our approach to state-of-the-art recommender systems having similar but not identical goals in
Section 2.
1.3. Statement of Significance
Problem: Clinical decision-making systems in the highly rushed intensive care scenario could benefit from an idea generator that is based on the practices of a leading hospital.
What is Already Known: There are models that predict a small set of treatments. In intensive care settings, these models predict prescriptions within a long horizon (24 h or more), limiting immediate ICU applicability.
What This Paper Adds: This study extends treatment prediction to a broad set of interventions (including rare ones) in the more useful (for ICUs) time frame of two hours. The technique is novel: it uses a data-driven abnormality-based approach to identify similar cases and predicts by building a machine learning model from those similar cases.
2. Related Work
We organize our related work discussion into three themes: (i) prior work with similar data cleaning and pre-processing techniques, (ii) specialized treatment prediction models that focus on a small set of clinical interventions or treatments and (iii) generic treatment recommendation systems.
Data Cleaning and Preprocessing. Purushotham et al. [
20] designed a pipeline to clean prescriptions from the MIMIC III database to feed into their deep learning models for common clinical prediction tasks, such as mortality prediction, length of stay prediction and ICD-9 code prediction. They focused particularly on standardizing the inconsistency in prescription units and dosages, which helped them to extract cleaner medication data, consisting of both generic and brand name medications, and increased their models’ performance. Similar to their model, our pipeline maps medications from MIMIC III to cleaned generic drug names.
Closely related, Wang et al. [
10] provide an open-source pipeline, MIMIC-Extract, that includes (among other functions) standardized data processing functions such as unit conversion, outlier detection, deduplication and missing data imputation for raw vital signs and lab results.
A study by Cui et al. [
21] on the automated fusion of multimodal electronic health records (EHRs) emphasized the importance of integrating diverse data types, such as tabular demographics, discrete medical codes, continuous monitoring data from ICU stays, and unstructured clinical notes, to improve various prediction tasks. Their approach uses a two-stage searchable module that optimizes feature selection and fusion operations, facilitating the effective processing of complex EHR data.
Outcome Prediction in ICU Settings. The following papers make predictions about patient outcomes in Intensive Care Unit settings. Lim et al. [
22] propose a technique to predict whether a patient will be readmitted within two days of discharge. Their technique used a consistent set of 30 variables comprising demographic features and laboratory models. Kim et al. [
23] use transformer models to predict the length of stay in Intensive Care Units for sepsis patients. Wang et al. [
24] predict mortality in septic shock cases based on 34 features having to do with blood test signs, age and surgical histories. They used a fusion model whose sub-models were tree/forest-based methods, Bayesian methods, and support-vector-based methods. Duggal et al. [
25] proposed a method to forecast the illness trajectory of COVID-19 patients using multinomial logistic models. Fabbr et al. [
26] showed a negative result. They showed that overnight stays prior to securing a bed in a hospital do not influence mortality.
Specialized Treatment Prediction Models in the ICU. Suresh et al. [
17] used data from different ICU sources (vitals, labs, notes, and demographics) to predict five kinds of treatments: invasive ventilation, non-invasive ventilation, vasopressors, colloid boluses, and crystalloid boluses. Their long short-term memory network (LTSM) approach focused on learning the onset and withdrawal of these treatments. The predictions are made with a six-hour time horizon to support clinically actionable planning. They outperform the convolutional neural networks method on the five treatments mentioned.
Catling and Wolff [
27] employed temporal convolutional networks (TCNs) to enhance the early prediction of critical care events by encoding longitudinal patient data. Their objective was to predict clinical interventions and mortality within a 1-6-hour window for ICU admissions. The TCN-based model demonstrated improved prediction accuracy over recurrent neural networks (RNNs) for certain events, especially when the prediction timeframe varied. Key metrics included a positive predictive value of 0.786 for up- and down-titrating FiO
2, 0.574 for extubation, 0.139 for intubation, 0.533 for starting noradrenaline, 0.441 for fluid challenge, and 0.315 for death, indicating the TCNs’ effectiveness in predicting various critical events.
DataToCare is complementary to the above research. DataToCare targets shorter prediction horizons (2–4 h) over a wide range of treatments and interventions. Unlike Suresh et al.’s model, DataToCare does not yet make detailed dosage or drug administration route recommendations, which remains an area for future development.
Generic Treatment Recommendation Systems. Doctor AI [
9] uses a generic predictive model based on a recurrent neural network (RNN). Using diagnosis, medication or procedure codes, Doctor AI’s RNN predicted (with high prediction performance) the diagnosis and medication categories for a subsequent visit.
Analogously to DoctorAI, Jin et al. [
28] proposed a framework based on LSTM, which uses temporal information of disease conditions, laboratory results, and treatment records of the patient to predict next-period prescriptions, where the next period is at least a day later. Wang et al. [
29] uses a supervised reinforcement learning with an RNN approach to predict prescriptions to be given a day into the future based on a patient’s state.
Bajor and Lasko [
30] predict the probable curative classes of medications that a patient is taking based on billing/diagnosis codes.
Hoang and Ho [
31] proposed neighbor-based recommendation approaches where two patients are neighbors based on longitudinal non-treatment features such as lab results, clinical notes, and demographics. Unfortunately, their F1-scores were low. The neighborhood/similarity patient network approach is nevertheless intuitively attractive (see also the review by Parimbelli et al. [
32]).
Chen et al. [
33] developed a framework that used temporal and heterogeneous doctor order information as an input for treatment pattern discovery. That study regards cerebral infarction and is evaluated on traditional Chinese medicine. Their approach shows great promise for the diseases they treat.
Using electronic health record (EHR) data and a drug–drug interaction data source, GAMENet [
34] proposed a method to recommend safe combinations of medications.
Shang et al. [
35] proposed a pre-training model named G-BERT, which uses medical code representations and the diagnosis of a patient visit to predict the prescriptions for that stay. Leap [
36] learns dependencies from disease diagnoses to medications to recommend treatments. These systems are designed to predict prescriptions for a time interval that is at least 24 h in the future or, in some cases, the next hospital visit. By contrast,
DataToCare’s concern is to predict treatments to be given in the next few hours, a critical need in the ICU setting based on abnormal measurements. In this way,
DataToCare complements the related work.
3. The Recommendation Pipeline
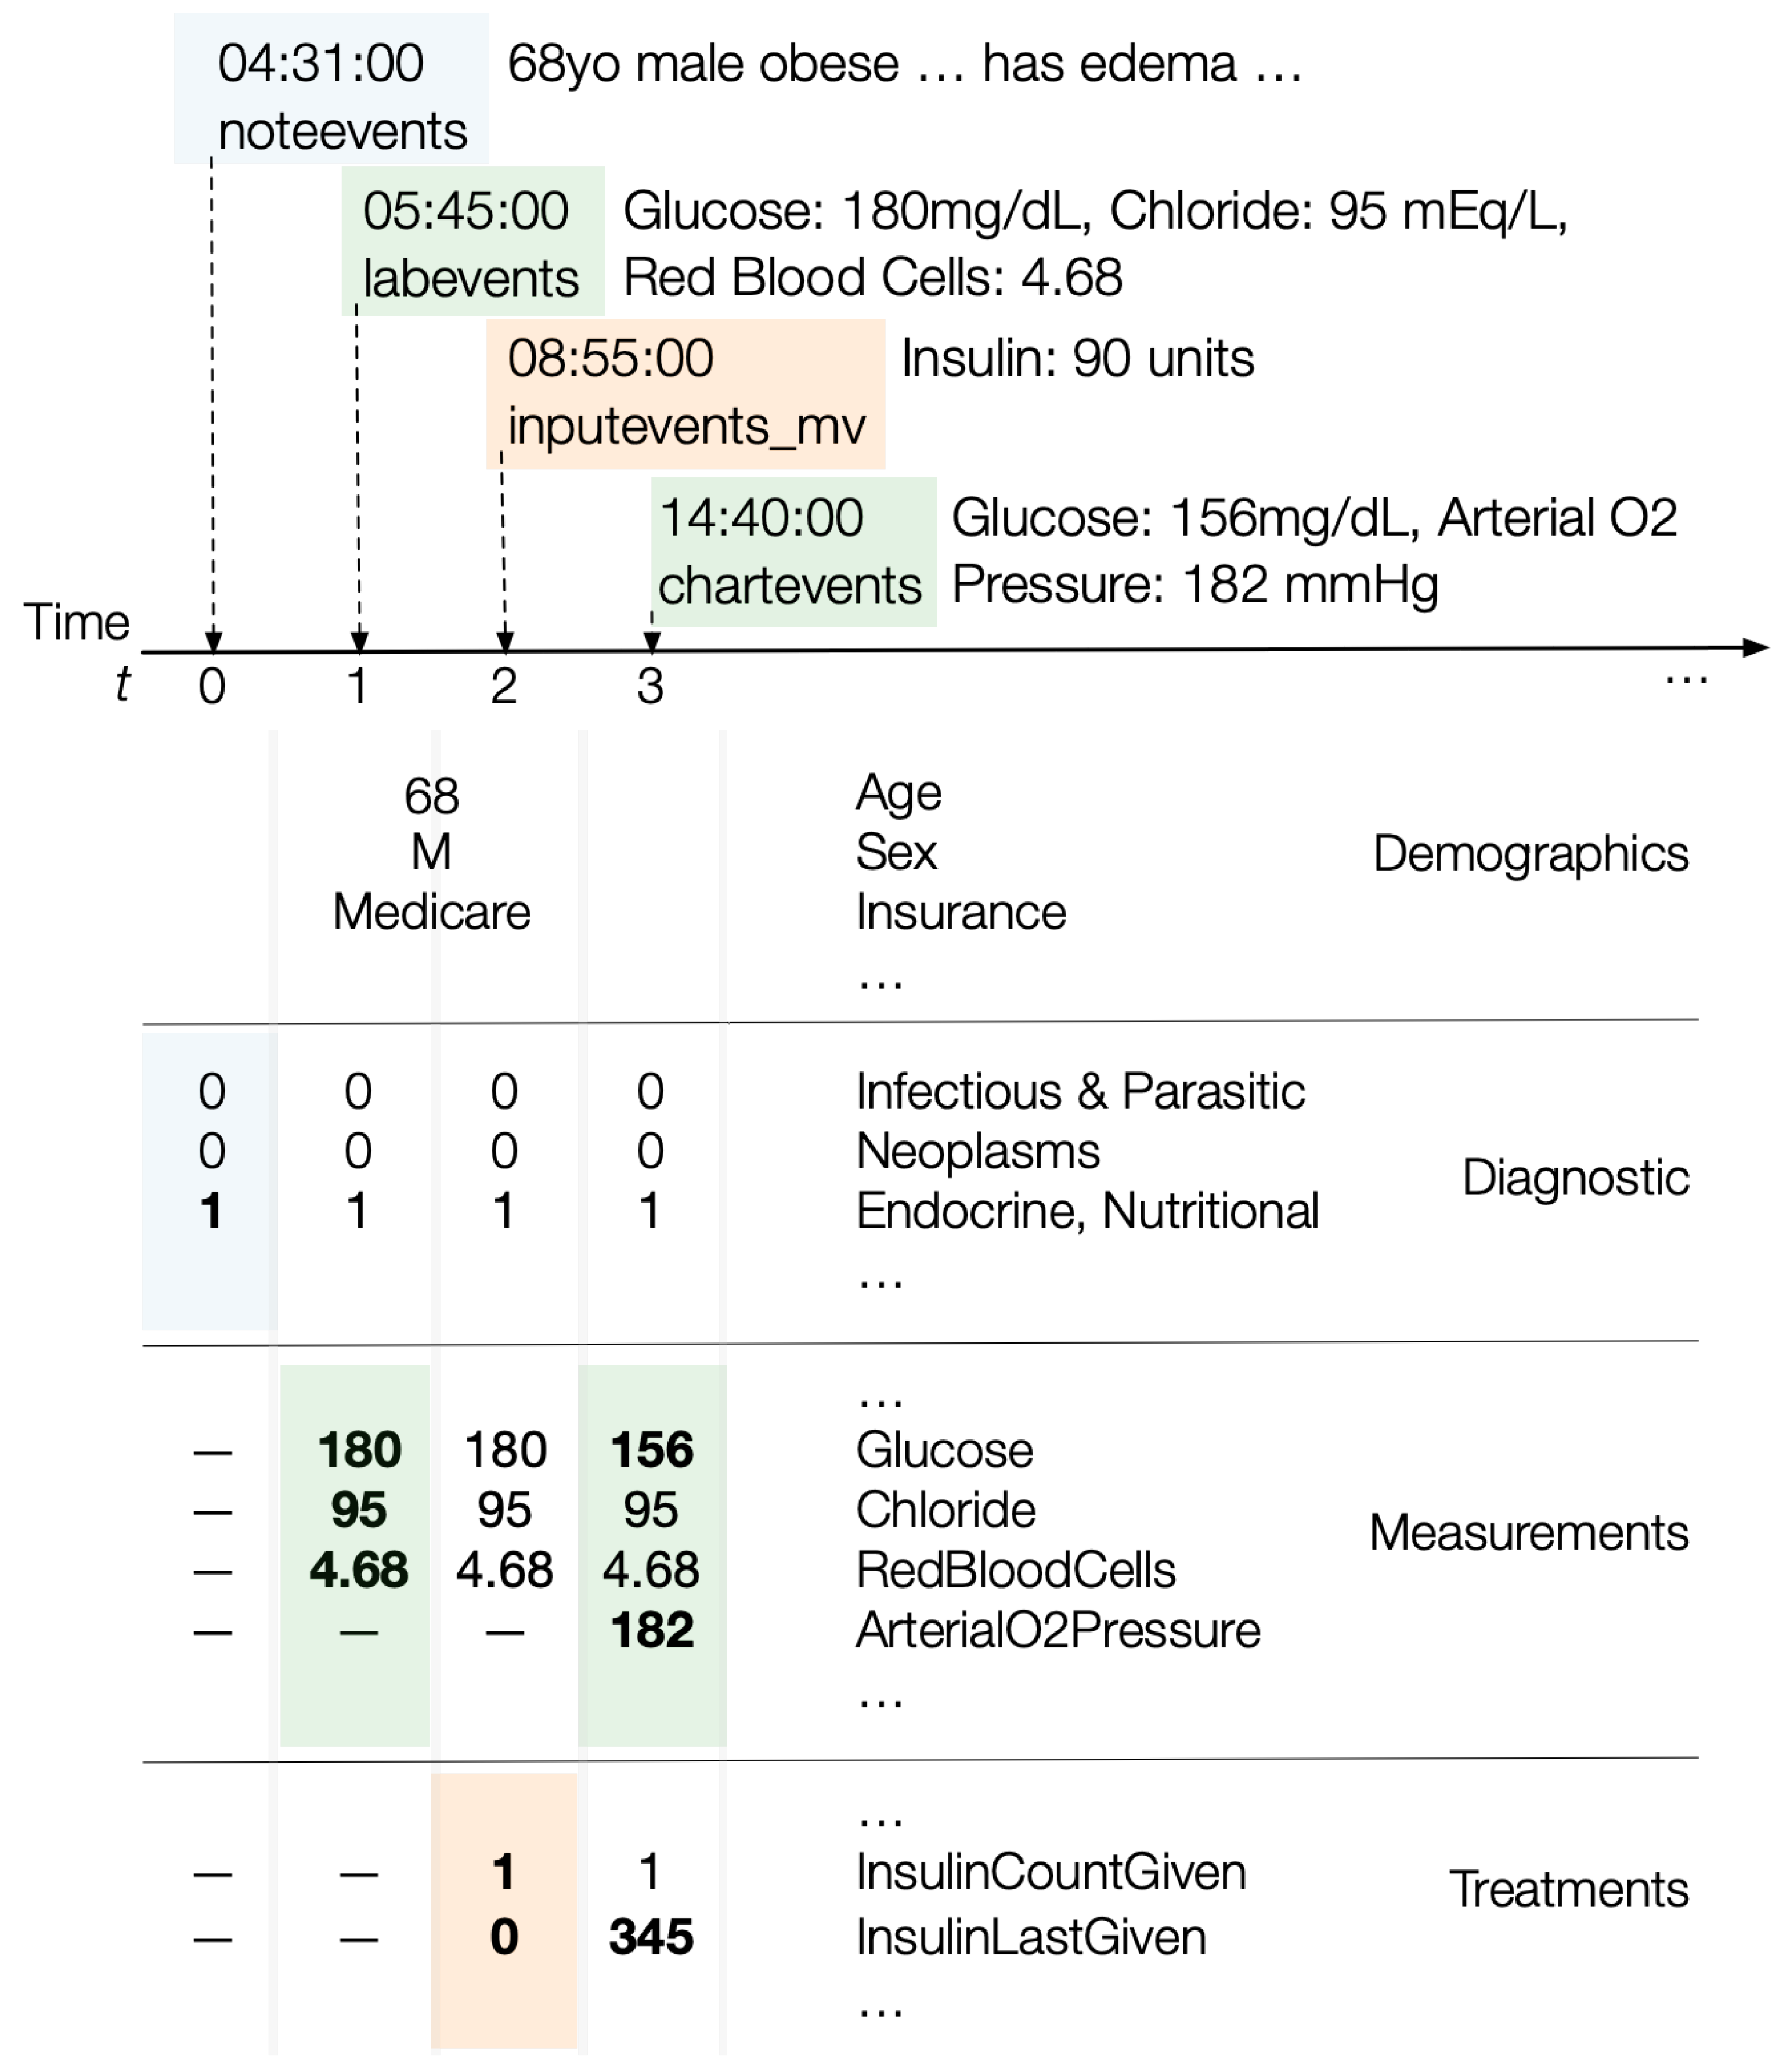
DataToCare takes as input a state vector representing a target patient ’s current medical state. contains (i) demographic information such as the target patient’s ethnicity, age, gender, and insurance, (ii) the diagnostic group to which the target patient belongs, (iii) lab results and measurements obtained up to the time of state such as a target patient’s latest blood glucose level or blood pressure reading, and (iv) for each treatment the target patient received since admission, how recently and how many times it was administered.
To form treatment recommendations for the target patient at some state , DataToCare uses the MIMIC-III dataset to find a set of relevant patients, , who have similar abnormal lab results or measurements at any time during their stay. We choose “any time” rather than the “same time” to allow a comparison of a target with similar patients who might be in a similar situation at various times during their Intensive Care Unit stay. We carry this out for two reasons: (i) the timing of the evolution of the illnesses of different patients may differ significantly, so the treatments to a patient who has similar abnormal measurements to the target patient on a different day may still give insight to the desired treatments of the target patient, and (ii) pragmatically, the larger pool gives us a larger effective data size.
For each treatment prescribed to any patient and a user-specified time horizon h, DataToCare builds an independent treatment classifier. This random forest classifier is trained on all the time-varying state vectors, , of the patients p in from admission to discharge or death. The goal of the classifier is to predict whether r was given within the following h hours. Here, h should be no smaller than the minimum response time in an ICU (one hour) and no larger than the maximum time of utility (24 h). We focus our effort on , because patient conditions change frequently in the ICU, so near-term predictions are the most useful.
DataToCare feeds the target patient state
into the treatment model for each treatment
r to determine whether
r should be given within the
h hours following
.
Figure 1 illustrates the simplified flow of the treatment prediction pipeline. The next subsections present detailed explanations of the processes.
3.1. Data Preparation
Preprocessing the MIMIC-III data entail selecting an appropriate data source, data-driven determination of abnormal values, and data normalization. We treat each in turn.
3.1.1. Dataset Selection
MIMIC-III is a dataset of patients admitted to the Beth Israel Deaconess Medical Center ICUs between 2001 and 2012 [
37]. The dataset has electronic health records that come from two different systems: data between 2001 and 2008 are from CareVue, while data between 2008 and 2012 are from MetaVision. Our pipeline uses the more recent MetaVision data because they contain fewer errors with respect to recorded treatments and patient events than the CareVue data. We did not use the mimic iv, the latest version with more Metavision data from 2008 to 2019, because we parsed the granular diagnosis information using doctor notes and the ICD codes, as described in the
Section 3.3.2 below. Currently, the note information for MIMIC-IV data is not publicly released yet [
38], but we expect to use our methods once the information is available.
The MetaVision data have records of 15,773 adult patients (aged 15 years and above), some of whom visited the hospital several times, yielding a total of 19,261 hospital admissions. Out of these admissions, 8060 admissions are to the Medical Intensive Care Unit (MICU) and 1074 of these admissions resulted in hospital deaths. More than 10% died within the first 24 h. MICU patients are often those with chronic clinical conditions and have a different profile than patients from neonatal, surgical or cardiac ICU. We focus on the MICU admissions, because that is the largest ICU.
3.1.2. Determining Low and High Abnormals
Most lab results and measurements are stored in two tables in the MIMIC-III dataset: labevents and chartevents. These values are either numerical, such as a patient’s diastolic blood pressure reading or categorical, such as the specific location of a patient’s bundle branch block (right or left branch).
For numerical measurements, we sort all values seen on discharge and consider all values between the 10% quantile and the 90% quantile as normal, values below the 10% quantile as low abnormal and values above the 90% quantile as high abnormal values. This data-driven approach for mapping numerical measurement values to an abnormal or a normal label captures the intuition that patients can be discharged with stable vital or other health indicator values even if those values are not typical of fully healthy individuals. We use this
abnormality map when processing medical patient states (
Section 3.3). We do not assign abnormal/normal labels to categorical measurements, though our method could incorporate such a labeling.
3.1.3. Treatment Mapping
Our source for treatment data is the inputevents_mv table. It contains all fluids and IV medications administered to MetaVision patients during their ICU stay. We cleaned and standardized medication data by mapping drug brand names to generic drug names. Medication name entries are often inaccurate due to spelling errors, the variety of brand names, and additional information such as details about dosage, form and route of administration. So it is necessary to resolve the various forms to standardized generic names before further processing.
Table 1 illustrates the data cleaning and mapping steps leading to the identification of one generic drug. As in all data cleaning efforts, the goal is to map many representations to the same generic result. The steps include removing dosage amounts, units (e.g., milligrams), and brand names.
3.2. Relevant Patient Set Construction
DataToCare constructs a set of relevant patients
to the target patient
in state
by ranking patients based on
degree of similarity,
d. If
is the set of measurements with low abnormal values, and
is the set of measurements with high abnormal values, then the degree of similarity between the target patient
and any patient
p is
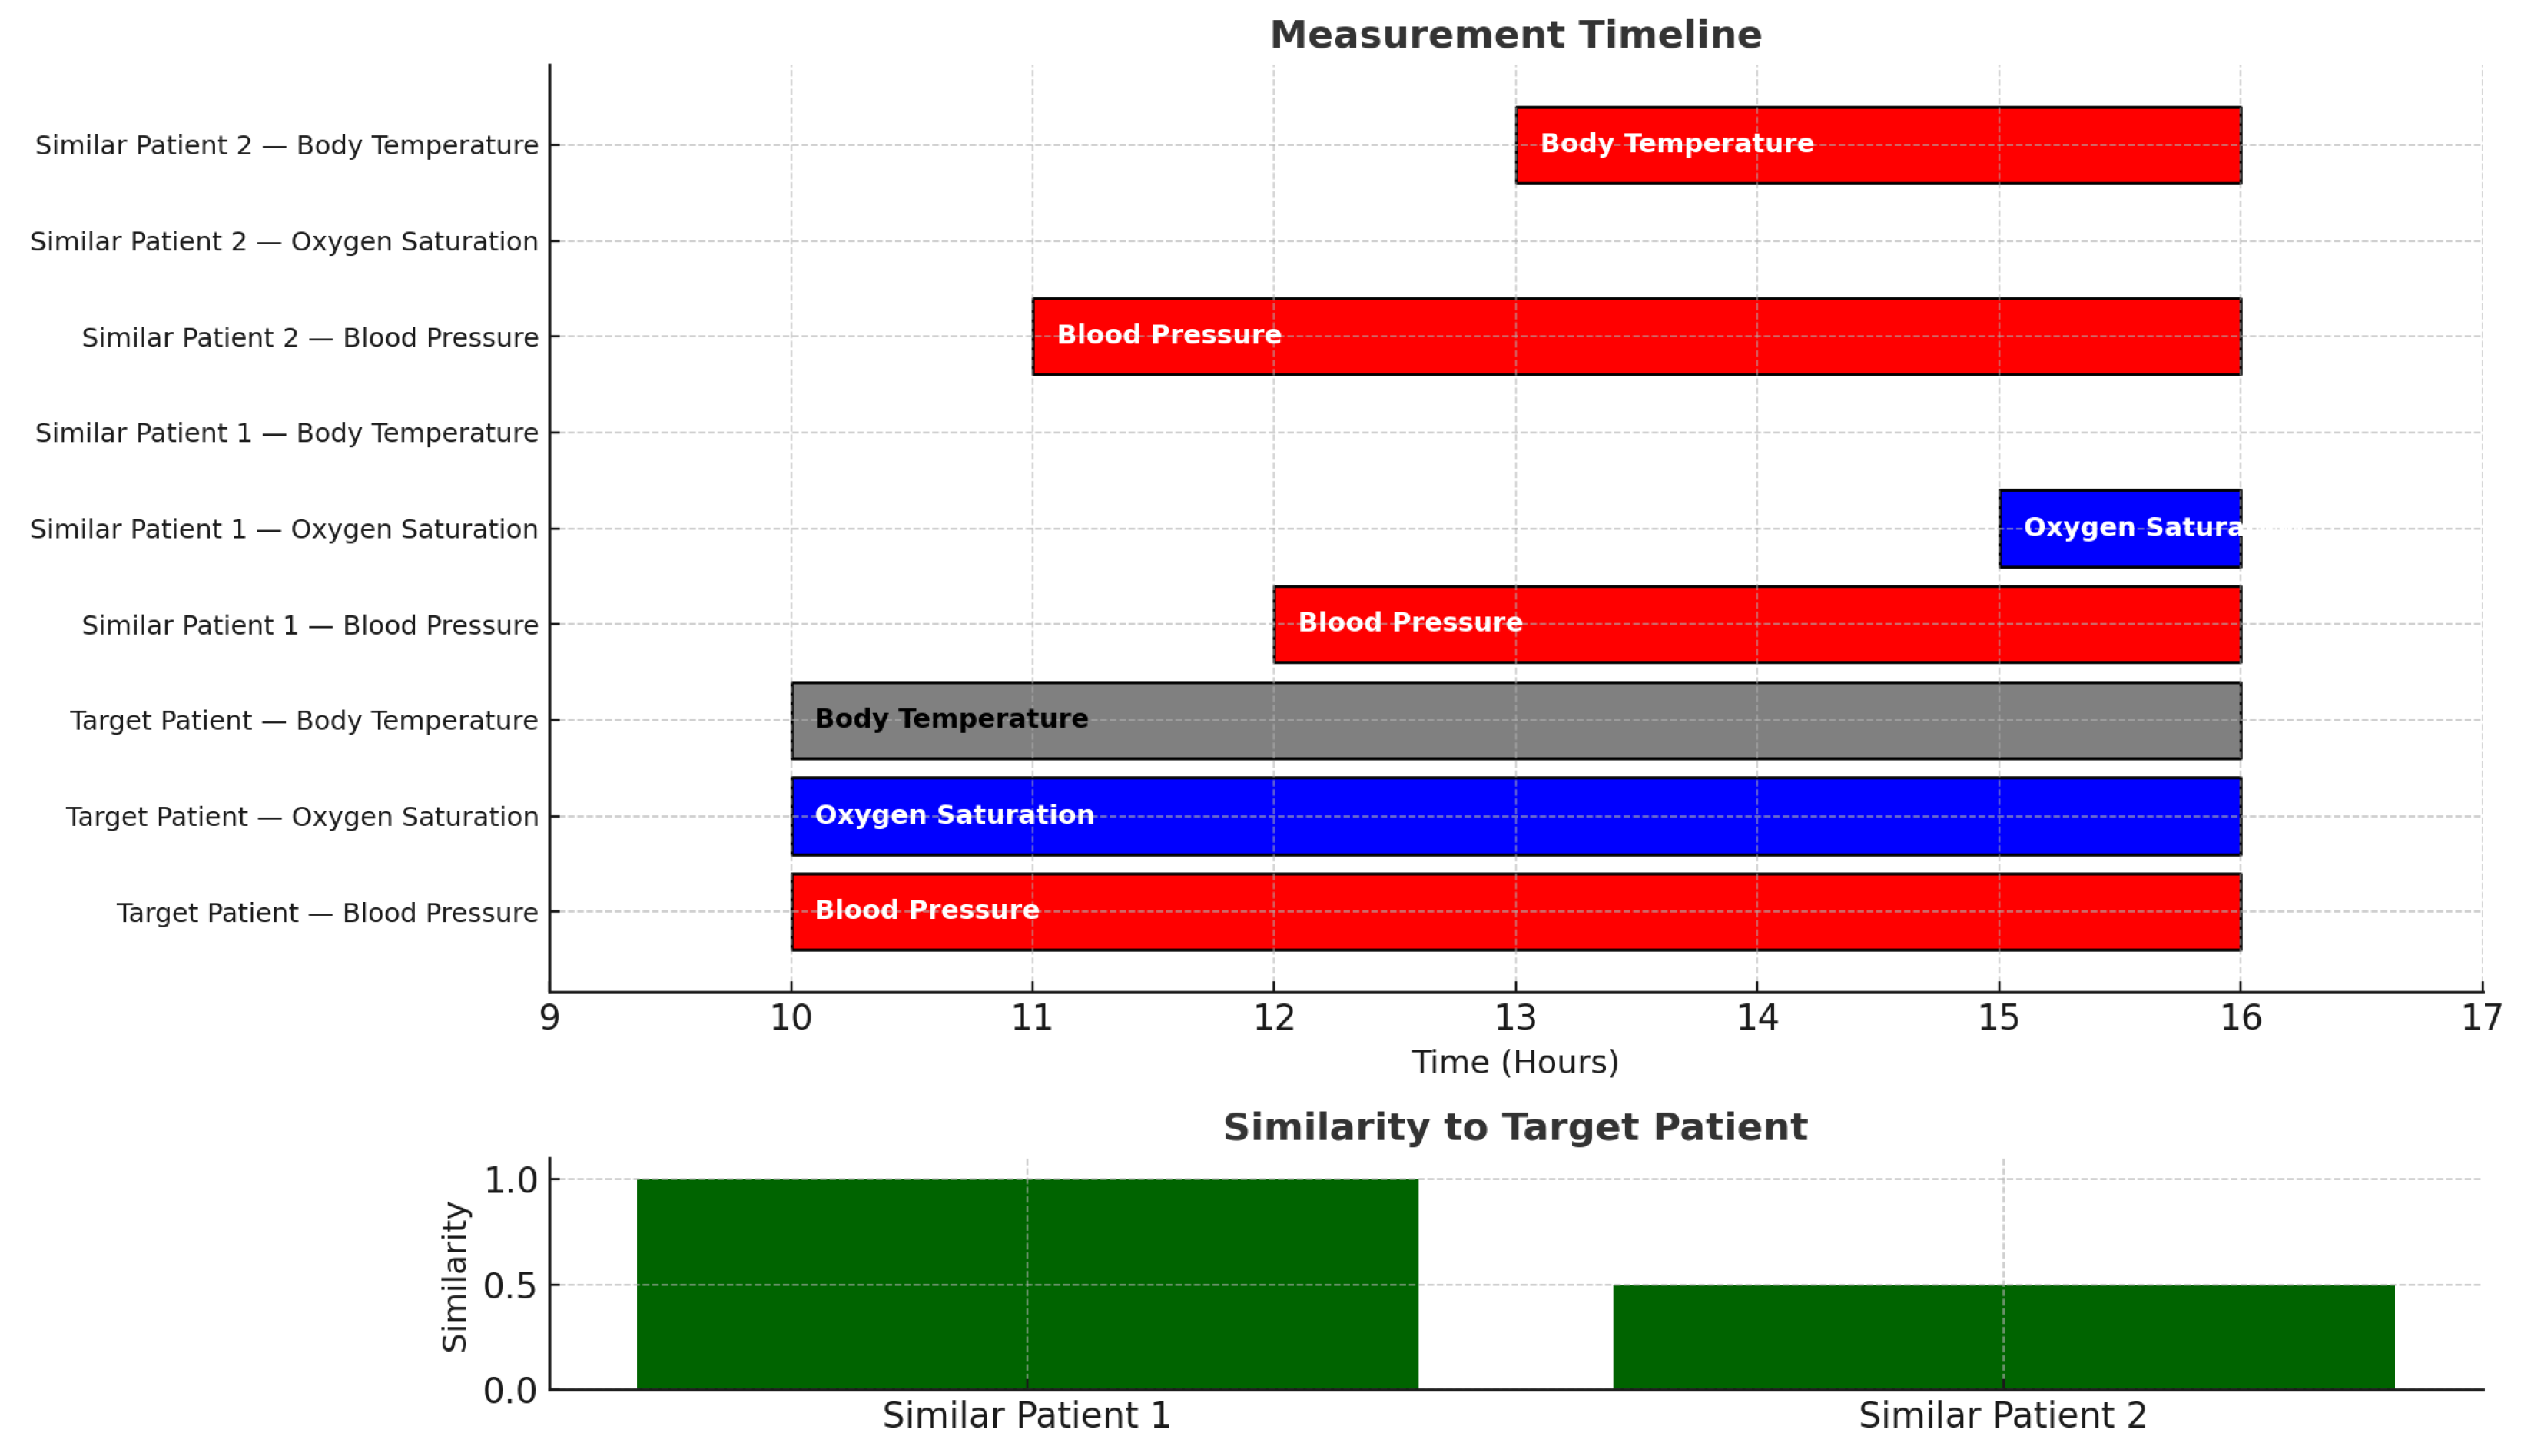
In our model, two patients can be considered similar even if timings do not match. For example, the GANNT chart of
Figure 2 shows a case in which a target patient
has abnormally high blood pressure and abnormally low oxygen saturation and normal body temperature. That target patient is very similar to a patient
who has high blood pressure and low oxygen saturation. Quantitatively, the degree of similarity is:
even though the time durations and start times do not match. Another patient
with high blood pressure and high body temperature has a degree of similarity of
to the target patient
.
Orthogonal to the similarity measure, the identification of relevant patients depends on which abnormals are associated with a patient in state s.
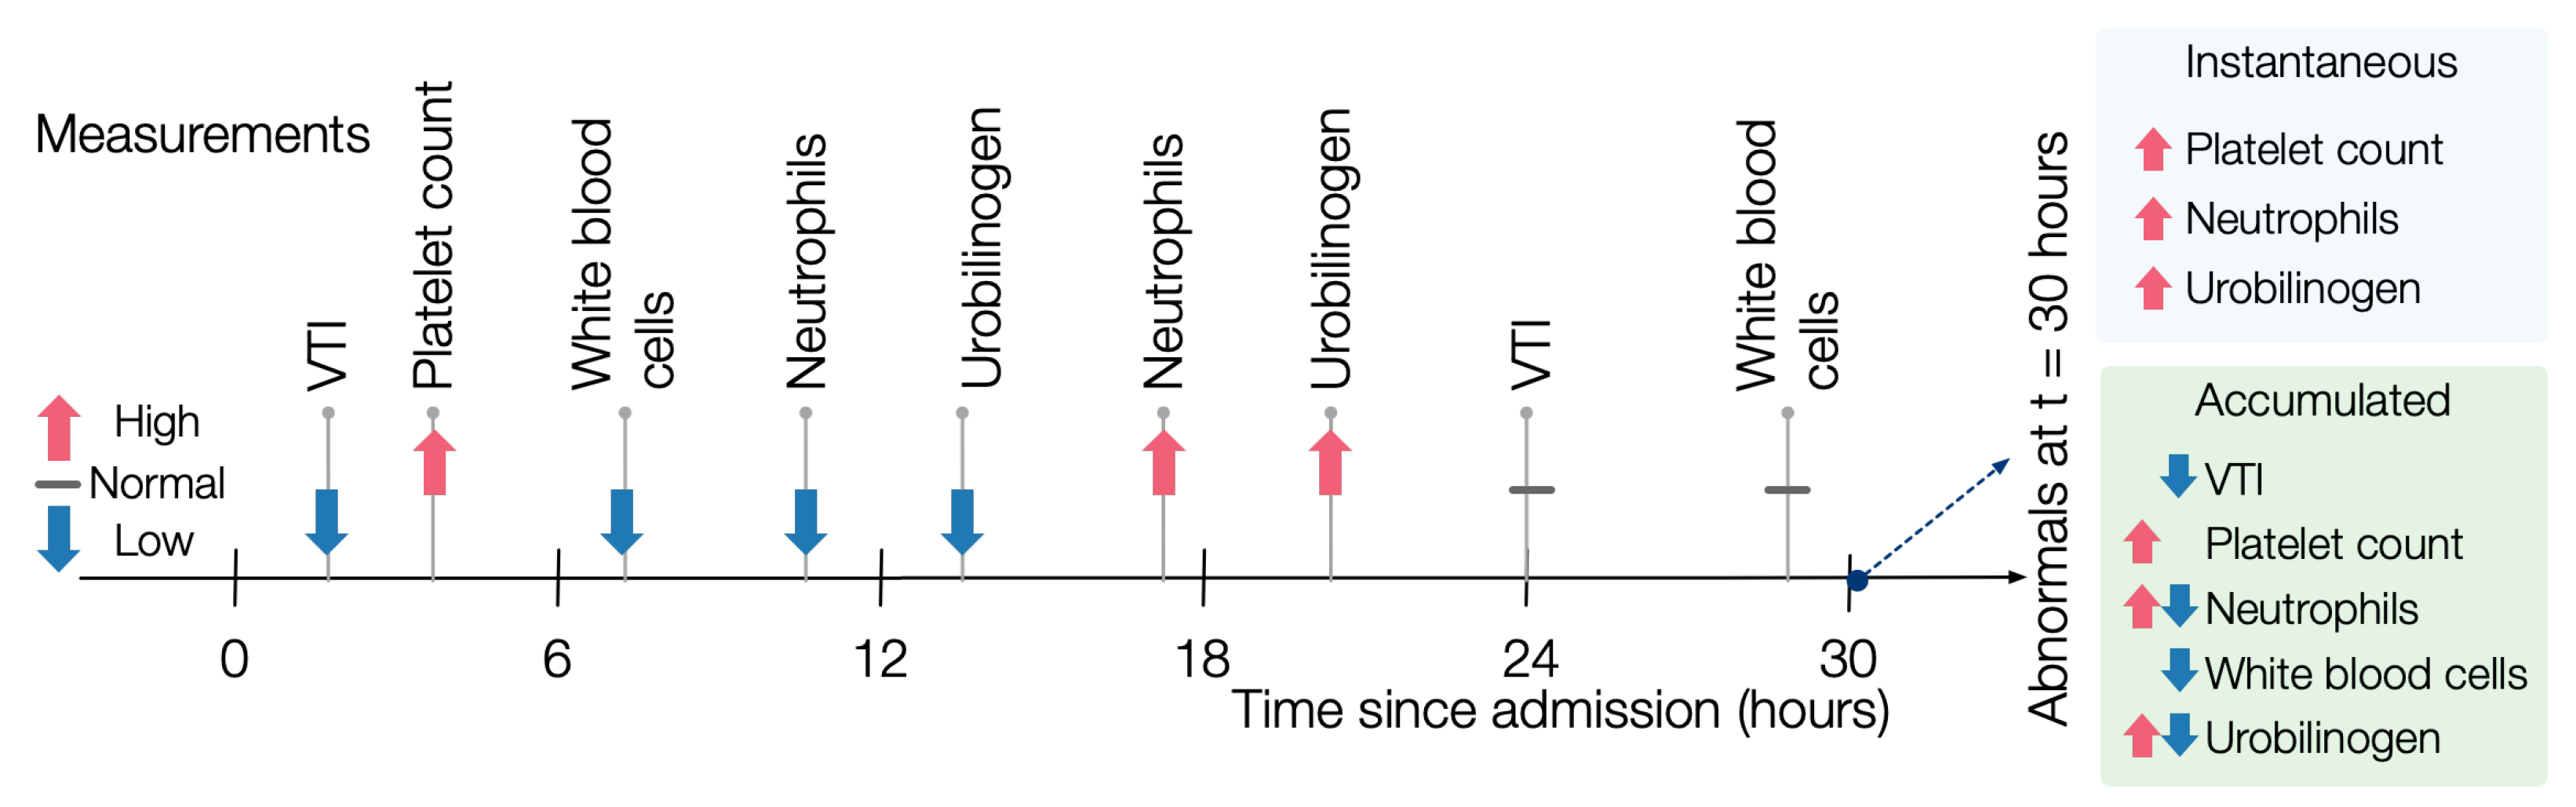
In an
instantaneous evaluation of abnormals, for each potentially similar patient, we find the abnormals that hold at each state, disregarding history. For example, in
Figure 3, at time 12, the patient has a low abnormal value of neutrophils. By contrast, at time 18, the patient has a high abnormal value, so the instantaneous value of neutrophils at time 18 is high.
In an
accumulated evaluation of abnormals, a measurement
m is high-abnormal (respectively, low-abnormal) for a patient
p if it was high-abnormal (respectively, low-abnormal) at any time during the ICU stay of
p. For example, the same patient as in
Figure 3 would have both low and high abnormal measurements for neutrophils.
In a slightly extended example, consider a situation in which patient p has a high temperature, a high white blood cell (WBC) count, and low blood pressure on day 2 and then a low temperature, low WBC count, and high blood pressure on day 5. If a target patient had a high temperature, high WBC count, and high blood pressure, then the instantaneous similarity score would be on day 2 and on day 5, but the accumulated similarity score would be 1 because p, at some point, had high temperature, WBC count and at some point high blood pressure, even though those occurred at different points.
The user can control (i) the size of the set
k of relevant patients to associate with a given target patient, (ii) whether to use similarity or not in the choice of that set, and (iii) if similarity is used, then whether to consider instantaneous vs. accumulated values. We discuss the impact of these choices on non-sequestered data in
Section 4.
3.3. Constructing Patient State Vectors
For each patient
p in the similar set of patients
,
DataToCare constructs a set of time-varying state vectors
with (1) demographic and diagnostic information as well as (2) measurements and treatments from the point of admission to the patient’s discharge or death. We will describe how
DataToCare builds each of the four components of the state vectors.
Figure 4 illustrates how updates to diagnostic information, lab results or measurements, or treatments update a patient’s state vector.
3.3.1. Demographic Data
We extract the following demographic features from the
table:
and
. Patient demographics carry essential constant information about the patient’s state, affecting the recommended treatments. For example, due to the significant difference in physiology and pharmacodynamics, helpful medications for elderly patients may differ from those for younger ones, as shown by Guidet et al. [
39,
40]. Sometimes, men and women receive different treatments for the same conditions, as shown by Reinikainen [
41]. Insurance type, which is often a proxy for a patient’s socioeconomic status, lifestyle, and therefore health outcomes, also (unjustly) plays a role in treatments given, as shown by Spencer et al. [
42].
3.3.2. Diagnostic State
The MIMIC-III table provides a list of a patient’s diagnostic codes on discharge. To determine a time during a patient’s stay when a specific diagnosis was made, we examine the medical staff’s notes in the table. Each note has an entry timestamp. We search each note to find a match for any of the diagnoses listed in the table. If found, we assume that the diagnosis was made at the time of the note’s entry. This gives us a time-varying diagnostic state for the patient.
We then map each of the 15,000 possible diagnostic codes to one of 19 higher-level ICD9 diagnostic groups. Thus, the entire diagnostic state is a 19 bit vector: a bit for each diagnostic group. For example, the bit vector [0101 0000 0000 0000 000] indicates that a patient was diagnosed with a disease in groups 2 (the neoplasm group) and 4 (the blood and blood forming organs disease group). An example of such a patient would be one with Hodgkin’s Lymphoma (group 2) and an iron-deficiency anemia (group 4). Since there are over 15,000 diagnostic codes, encoding only the top-level ICD9 codes reduces data sparsity, thus enhancing generalizability.
We treat diagnoses in a cumulative manner. At time t from admission, if a patient was diagnosed with a disease in group 2, then at all times , the diagnostic bit vector of the patient’s state will continue to have the second bit of the diagnostic state set to one.
3.3.3. Lab Results and Measurement State
The dimensions of this state vector consist of the intersection of two components: (i) the space of all measurements and lab results seen across all patients that are deemed relevant to the target patient in state ; (ii) measurements taken of up to and including the state . In total, includes 434 distinct lab test results and 763 unique chart event measurements, encompassing a broad range of clinical indicators.
For example, if consists of two patients and with measurements and lab results for and , respectively, and the target patient up until has measurements , then we consider the four measurements to be the universe of measurements. So depends on the measurements of relevant patients as well as the target patient.
DataToCare constructs a series of time-varying measurement and lab result vectors for each patient from the and tables. Each record in these tables is timestamped and DataToCare processes them sequentially in time order. At time , the vector at simply contains the values for any measurements or lab results for all times at or earlier with nulls for all other features. When the ith lab result or measurement record arrives, a new vector for time is constructed: any new values are inserted, and past values from the previous vector at time are retained. Thus, the measurement values associated with time are those that have accumulated up to .
3.3.4. Treatment State
The dimensions of the treatment state vectors define the space of all treatments given to any patient in the relevant set of patients
. In total, the treatment space consists of the 195 unique treatments observed in the dataset, constituting the dimensionality of the treatment state vector. If
consists of two patients
and
and
has received treatments
while
has received treatments
, then we consider the four treatments
to be the universe of possible treatments
℞.
We construct a series of time-varying treatment vectors for each patient from the inputevents_mv table. The treatment vectors are time-aligned with the measurement vectors described earlier. For each treatment , a treatment vector at time t encodes two values: (i) how many times the treatment was given until this moment in time and (ii) how recently the treatment was given in minutes.
3.3.5. Alternative Encodings of Vector States
We describe two different design alternatives for encoding a patient’s medical state. The experiments (
Section 4.1) determine the best among them.
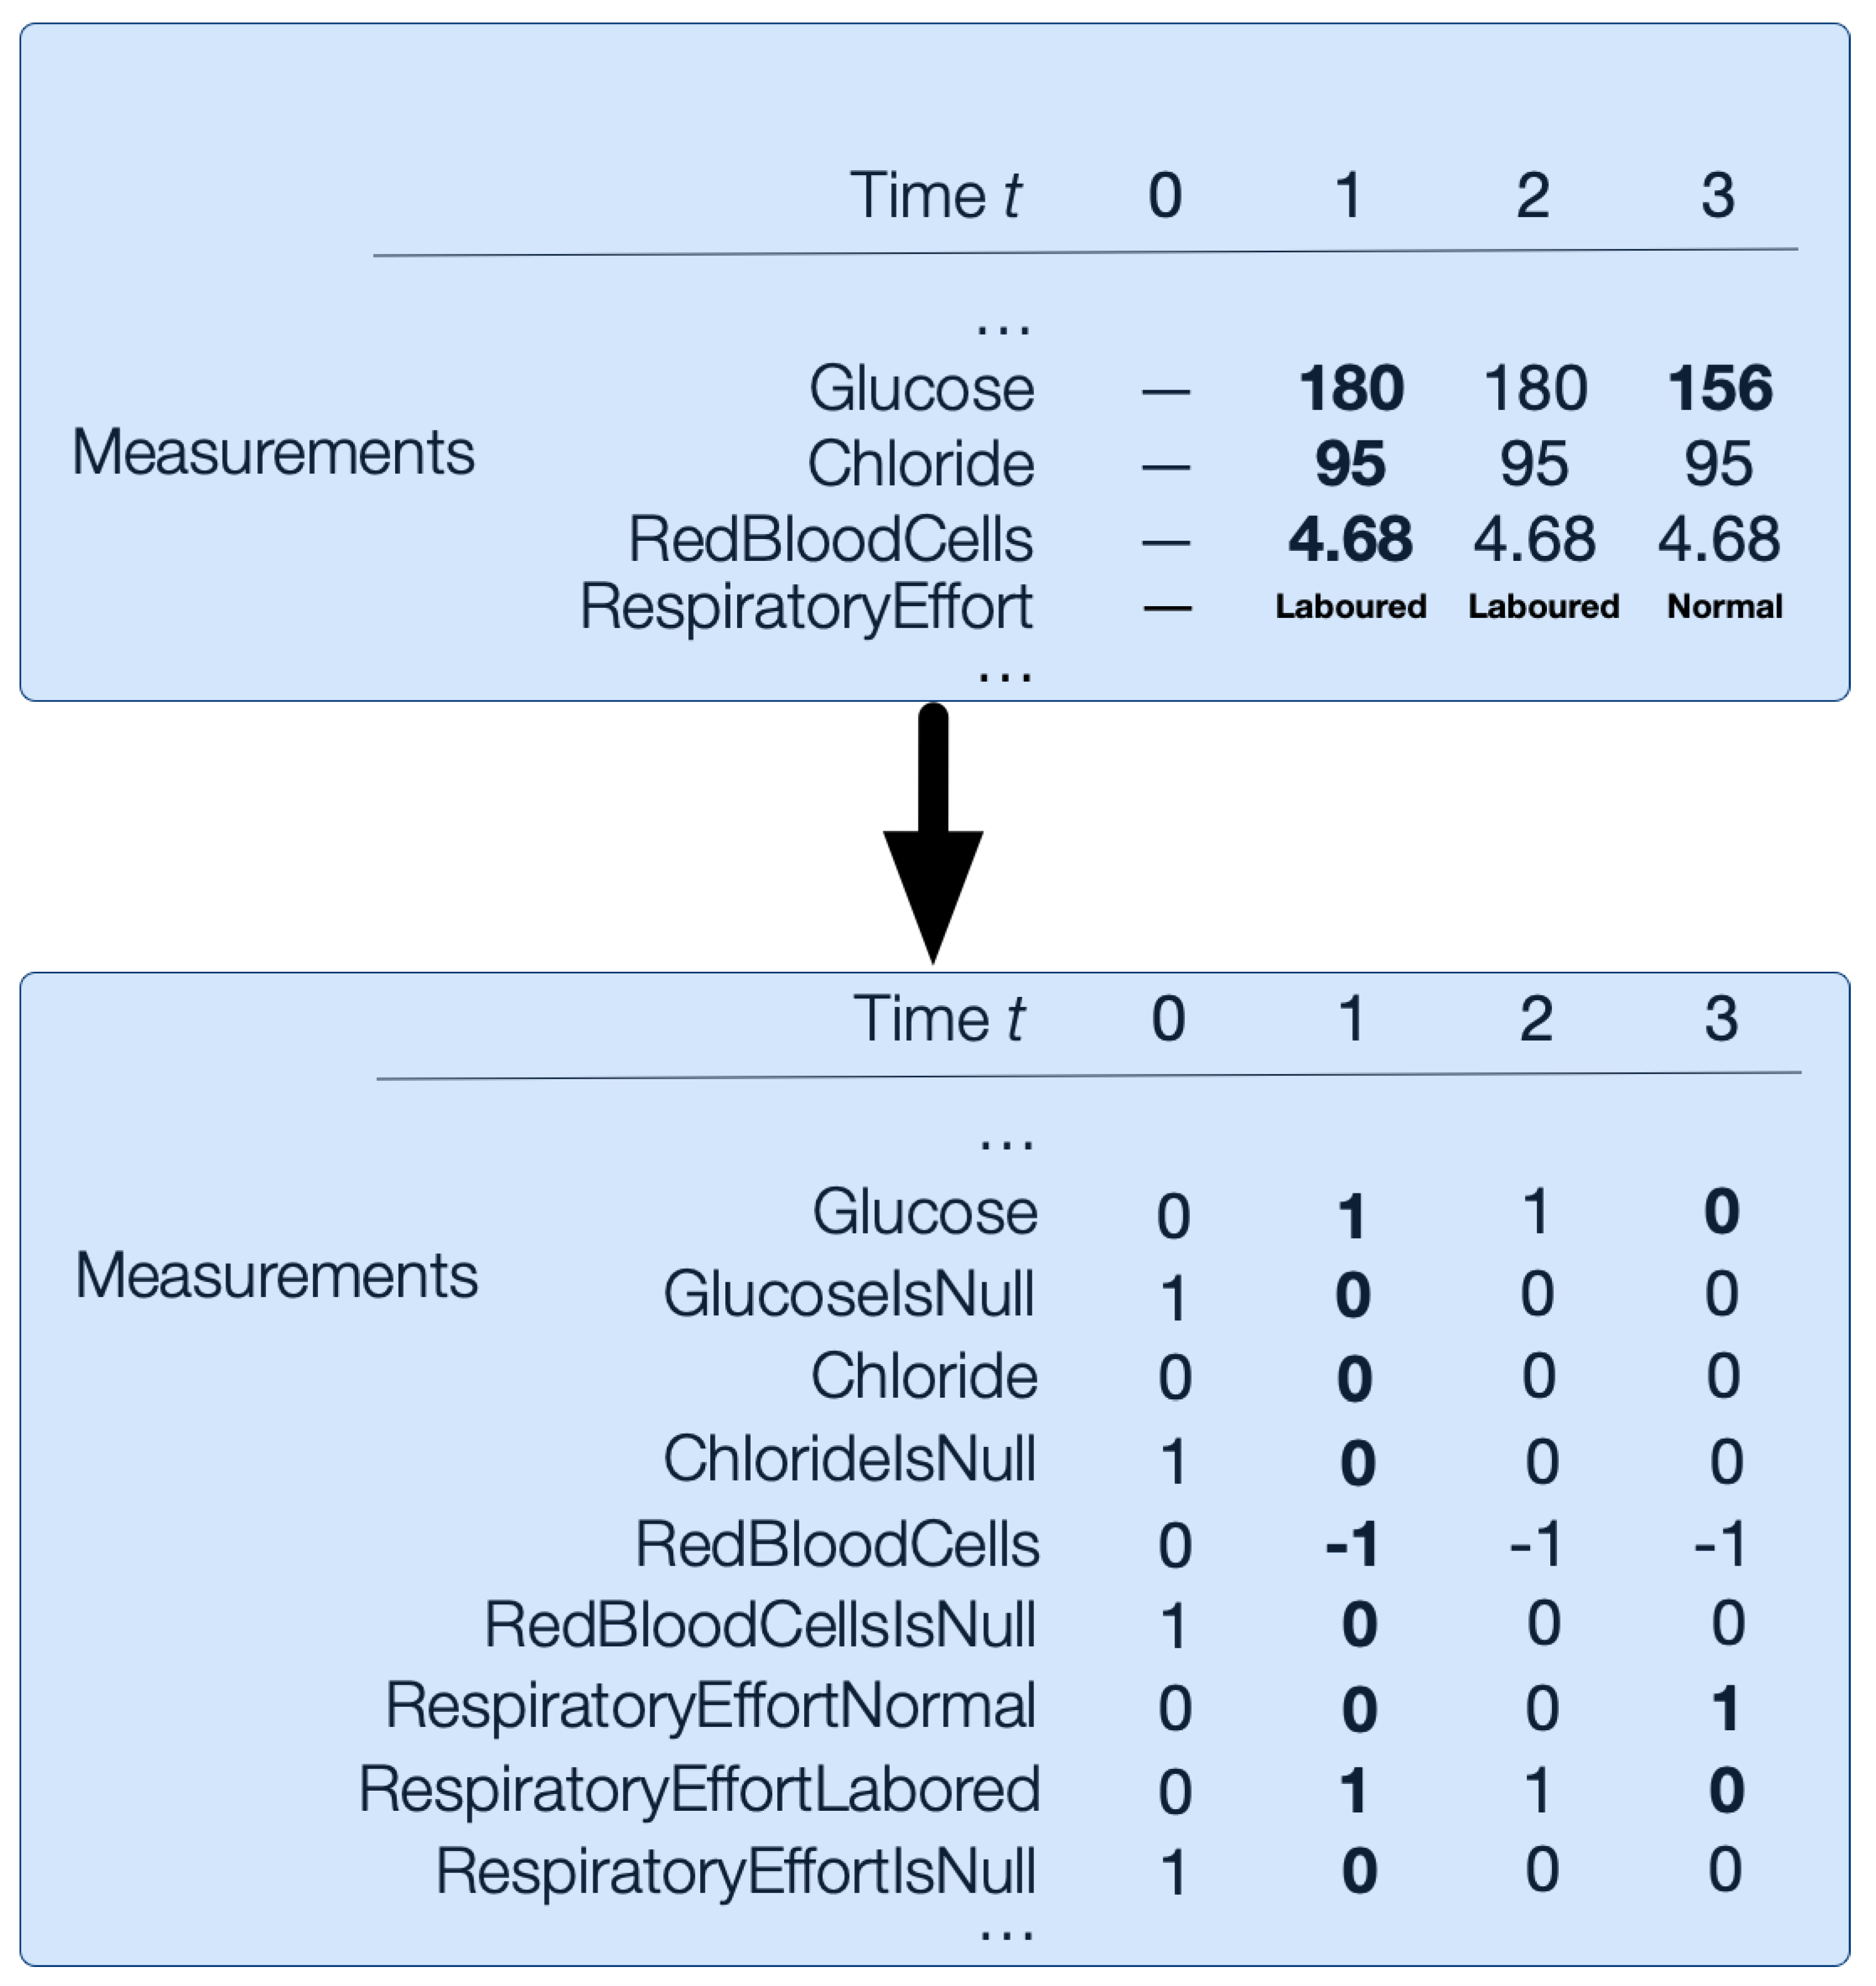
Abnormality-Hot Encoding
This encoding replaces each value in numerical measurement vectors from the input data with the following abnormality mapping: 1 for high abnormal values, 0 for normal values, and −1 for low abnormal values. Additionally, categorical vectors are one-hot encoded. For example, Respiratory Effort could be Normal or Labored, so it would be encoded in RespiratoryEffortNormal and RespiratoryEffortLabored length binary vectors; see
Figure 5. There is no imputation of nulls. Instead, we encode nulls with an additional binary
bit for every numerical and categorical measurement
m. For example,
is the binary variable for glucose measurements that are missing.
Figure 5 illustrates how the numerical and categorical vectors are transformed with abnormality-hot encoding.
Reduced Dimensionality
Starting with the high-dimensional abnormality-hot encoding of the data, reduced dimensionality applies UMAP dimensionality reduction [
43] to create separate embeddings for diagnosis, categorical, and numerical information.
3.4. Online Model Building and Treatment Recommendation
The steps above (plus the relevant patient selection methods described below in
Section 4.2 and
Section 4.3) give us, for each target patient
in state
, the relevant set of patients
and the set of treatments
℞ to consider. For each treatment
,
DataToCare constructs a random forest classifier using 100 trees that predicts whether
r will be prescribed in the next
h among the relevant patients
. The training set for the classifier corresponding to each
r (and each time horizon
h) is the set of all
dimensionality-reduced state vectors
for all the patients
.
Treatment Recommendation
DataToCare feeds the target patient’s dimensionality-reduced state vector into an independent model for each possible treatment r for time horizon , then DataToCare recommends all the treatments classified as ‘true’ within the time horizon . We select because in an ICU setting, patients are often unstable, so near-term recommendations are the most valuable.
4. Hyperparameter Tuning
The basic setup of our hyperparameter tuning experiments is to consider a group of target patients. For each target patient p at a given time t early in p’s stay in the MICU, we will find a set of patients that have a similar abnormality profile to p and use those patients to predict what to do with p in the next h. Hyperparamter tuning aims to answer the following questions:
Which encoding strategy for patient state leads to the best overall recommendation performance?
Based on the abnormalities of each target patient, which other patients should be considered “relevant”?
Out of a total of 8060 admissions to MICU patients, we sequestered a hold-out set of 800 patient admissions for our testing experiments in
Section 5. The data for these patients were not used in the hyperparameter tuning experiments in this section but form the basis of the results in the next section. We have removed the 155 patients from the non-sequestered data set whose hospital stay was longer than three months. We have carried this out because such patients have little relevance to most emergency room patients. For hyperparameter tuning, we use 300 patients randomly and uniformly as targets from the non-sequestered data set of 7105 patients.
For each such target patient, we selected a medical state randomly and uniformly that arose 12 to 24 h from the target patient’s admission into the MICU.
Note: Empirically, 12 h from admission is a sufficient time for the MIMIC-III database to capture a patient’s state: certain lab tests such as blood cultures can take a few hours. Conversely, because patients in the early hours after admission to the ICU tend to be less stable than later on, suggesting treatments in those early hours can greatly contribute to patient well-being. As electronic records become more real-time and available, our techniques could work even earlier.
We implemented the DataToCare pipeline in Python 3.8 using the standard libraries of sklearn, multiprocessing, and UMAP. The experiments ran on Ubuntu 20.04 with 32 GB memory, 12-Core CPU, and no GPU. The random forest was built from 100 tree classifiers for each treatment. UMAP used 15 neighbors with a minimum distance of 0.2 and 200 epochs, with the result that the number of dimensions decreased by roughly a factor of 10.
We measured prediction accuracy separately with respect to patients and with respect to treatments. In both cases, we used Precision, Recall, and F1-score.
Accuracy with respect to patients: We reported the average of these measures calculated on the number of patients in each experiment. Precision is defined as the number of treatments we correctly identified divided by all treatments predicted for a patient over the prediction time horizon. Recall is the number of treatments we accurately identified divided by the treatments actually given within the time horizon (regardless of whether they are in the universe of treatments given to similar patients). The F1-score is the harmonic mean of precision and recall. The F1-score is a good measure because of the highly imbalanced data: on average, there are only 2.48 treatments per patient within the time horizon (2 h), but there are 203 available treatments. The following example involving three patients illustrates how the average precision, recall, and F1-score will be calculated:
Patient P1: actual given treatments, 5; correctly predicted, 4; not predicted, 1; and wrongly predicted, 1.
Patient P2: actual given treatments, 7; correctly predicted, 5; not predicted, 2; and wrongly predicted, 4.
Patient P3: actual given treatments 3; correctly predicted, 1; not predicted, 2; and wrongly predicted, 2.
The metric of accuracy with respect to all three patients and all their treatments will be
Average Precision: (4 + 5 + 1)/(5 + 9 + 3) = 0.59
Average Recall: (4 + 5 + 1)/(5 + 7 + 3) = 0.67
Average F1-score:
Accuracy with respect to treatments: We calculate the accuracy measures precision /recall/F1-score cumulatively from the rarest to the most common (left-to-right). We carry this this to highlight how well the different methods predict rare treatments and how well they treat common ones. The following example illustrates how these cumulative measures are calculated. Treatments are listed in order, starting from the rarest.
Treatment T1 (rarest): given five times, predicted correctly three times, predicted incorrectly four times. Cumulative precision: 3/7. Cumulative recall: 3/5. Cumulative F1-score: 0.5.
Treatment T2: given 0 times, predicted correctly 0 times, predicted incorrectly 5 times. Cumulative precision: (3 + 0)/(7 + 5). Cumulative recall: (3 + 0)/(5 + 0). Cumulative F1-score: 0.35.
Treatment T3: given 14 times, predicted correctly 11 times, predicted incorrectly 5 times. Cumulative precision: (3 + 0 + 11)/(7 + 5 + 16). Cumulative recall: (3 + 0 + 11)/(5 + 0 + 14). Cumulative F1-score: 0.60.
We use the
cumulative F1-scores when we report our results on training and sequestered data in
Figure 6 and
Figure 7, respectively. For example, if T1 were, say, in the 20th percentile of frequency of application (among all the treatments administered to the 7105 patients of the non-sequestered data), T2 in the 25th, and T3 in the 28th, then there would be points at (20, 0.50), (25, 0.62), and (28, 0.68).
4.1. Encoding Variant Selection
The aim of this experiment is to select the best encoding variant for the representation of the medical state vector from the two possibilities from
Section 3.3.5: abnormality-encoded or dimensionality-reduced.
In this experiment, we evaluate the strategies abnormal-hot-accumulated (AHA) and abnormal-umap-accumulated (AUA), which differ only in their uses of encoding variant, while the other control parameters of time horizon
, and the use of abnormals for relevant patient evaluation (described below in
Section 4.3) are the same.
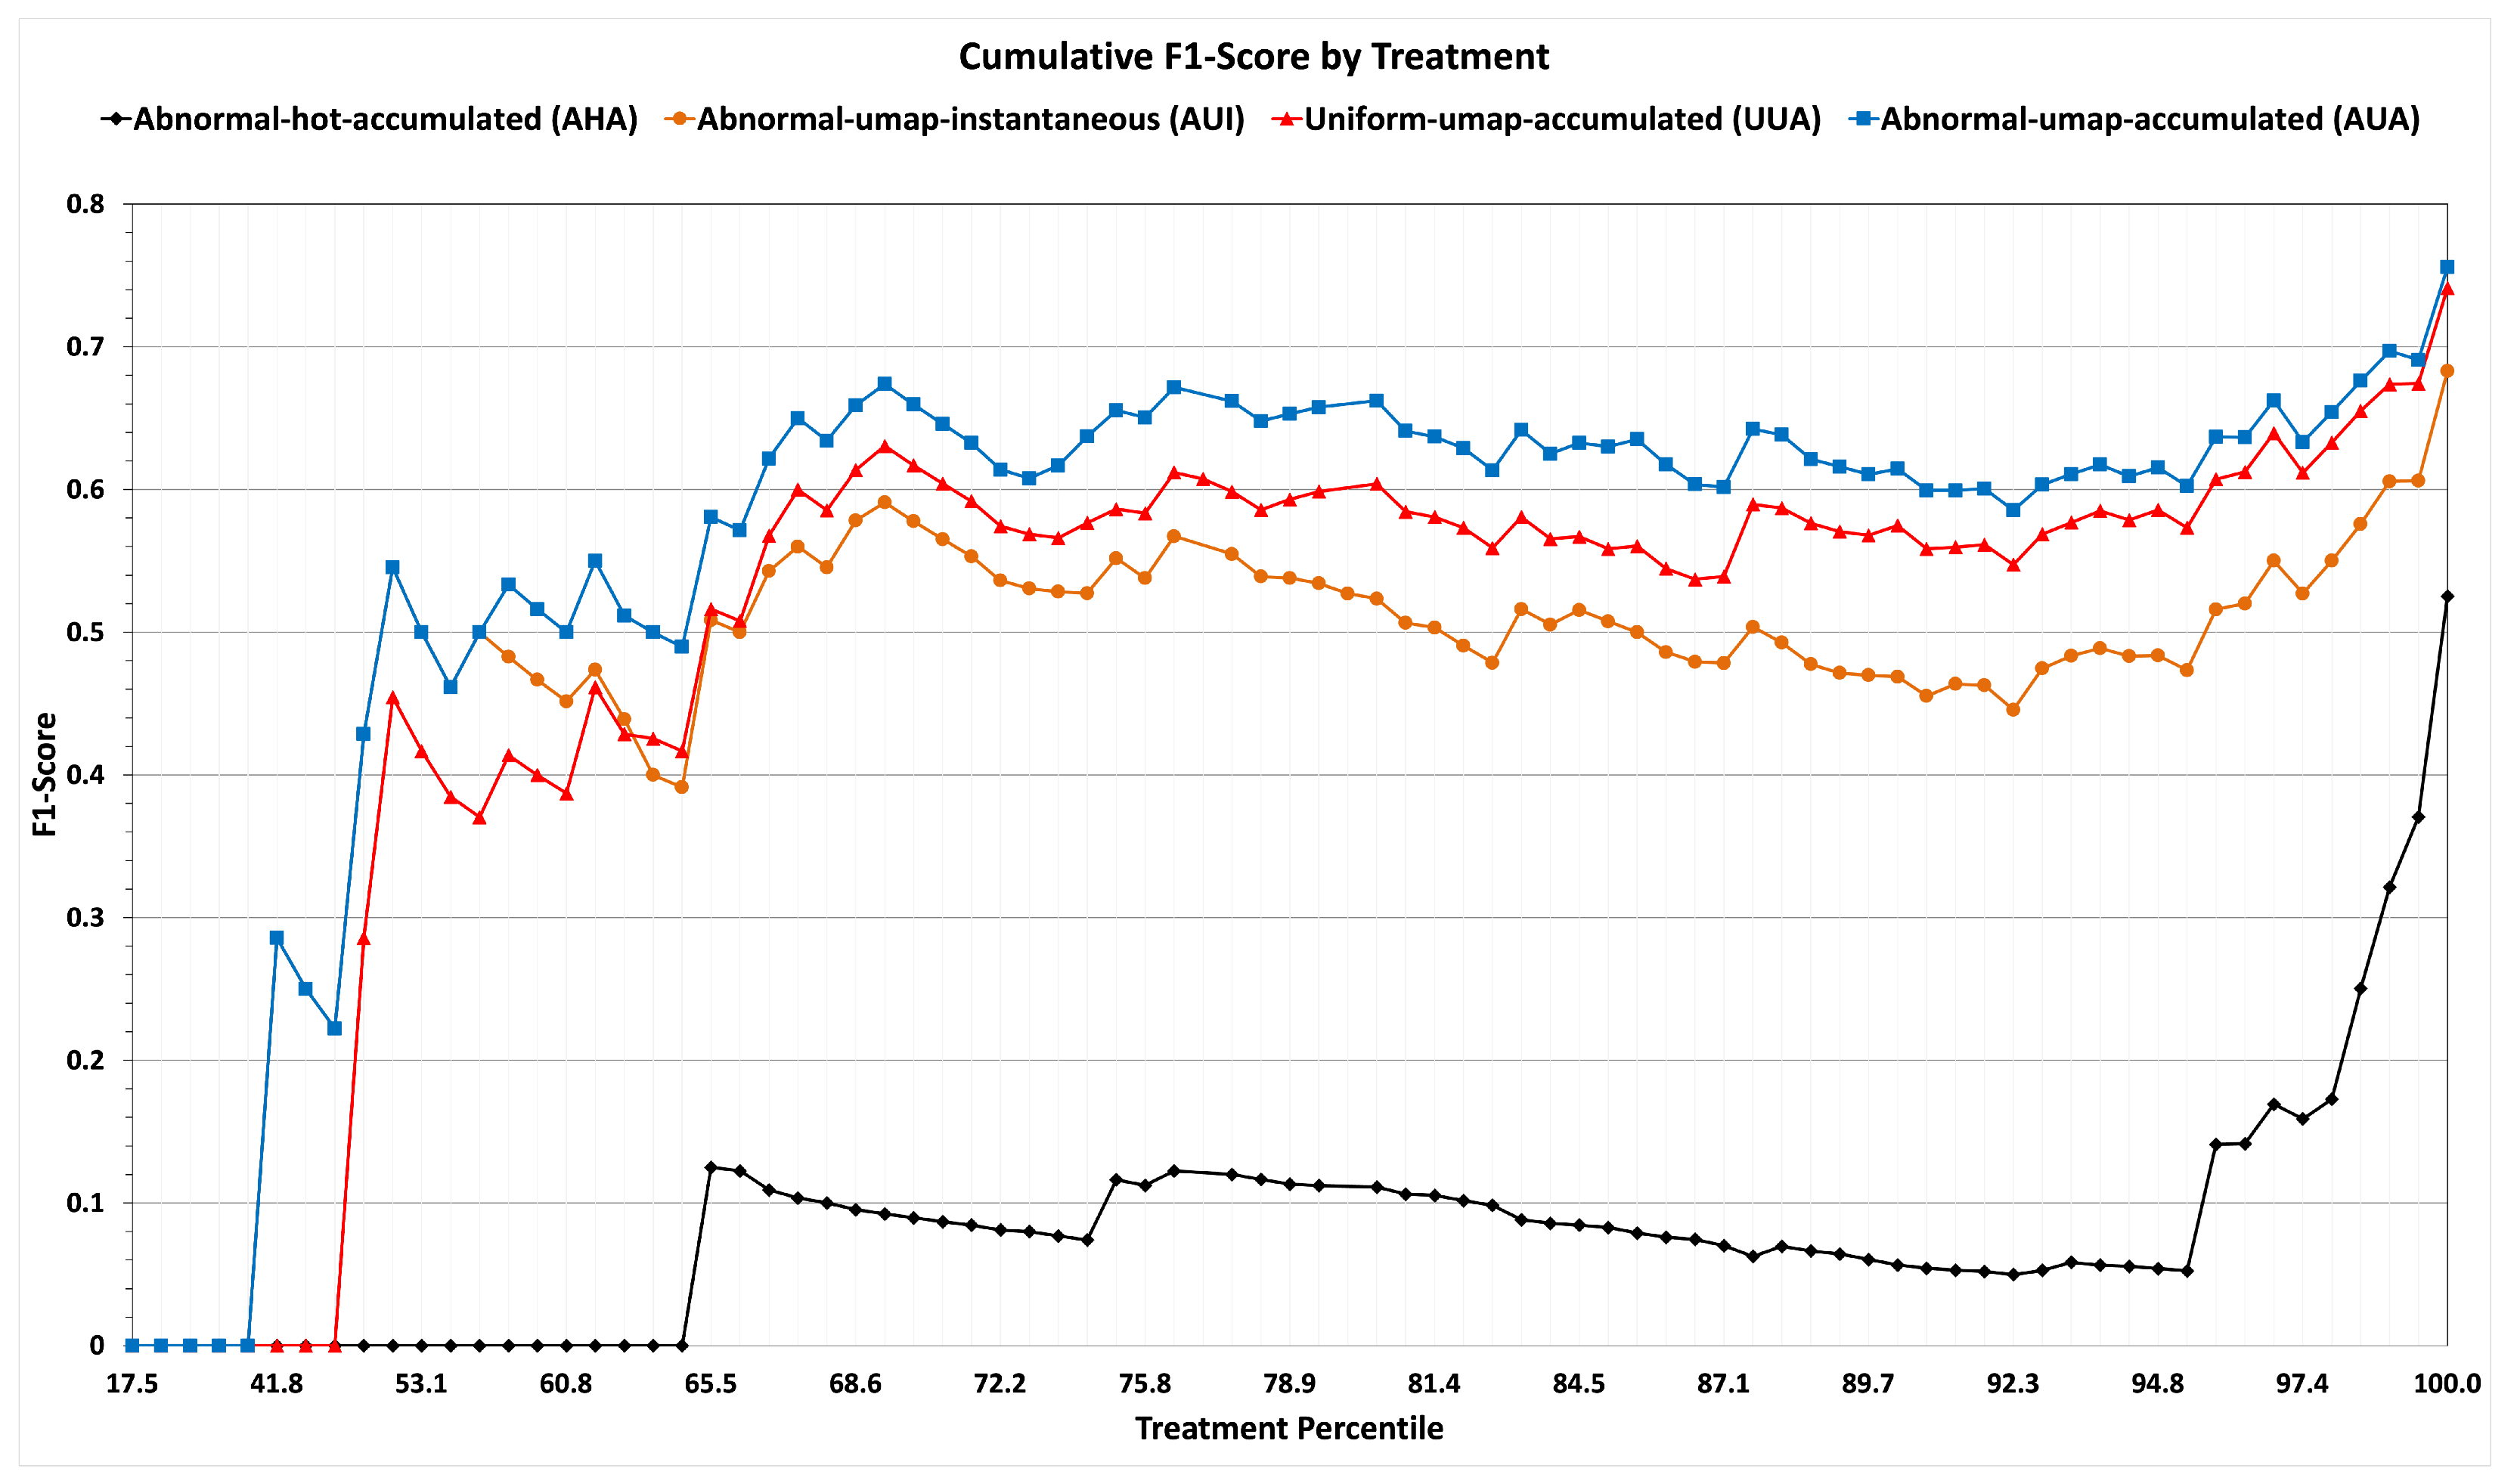
Table 2 and the line graphs (black for strategy AHA and blue for strategy AUA) of
Figure 6 show that dimensionality reduction leads to the best performance. Also, from
Figure 6, it is evident that on rare treatments with percentiles lower than 50, strategy AHA has a cumulative F1-score of zero.
Intuitively, dimensionality reduction performs well because many patient dimensions co-vary. This allows UMAP to embed more than 1000 dimensions into 20. An additional reason is that random forests work best for a modest number of dimensions. We use the dimensionality-reduced encoding variant for the remainder of the training experiments.
4.2. Instantaneous vs. Accumulated Abnormal Evaluation to Find Relevant Patients
In this tuning experiment, we evaluate the best strategy between the instantaneous (abnormal-umap-instantaneous strategy—AUI) and accumulated (abnormal-umap-accumulated strategy) use of abnormals for finding relevant patient strategies, as described in
Section 3.2. The different strategies could result in different sets of relevant patients.
We compare the instantaneous versus accumulated strategies AUI and AUA by holding all other parameters the same (reduced dimensionality,
, and Similarity Selection of relevant patients as in
Section 4.3).
Characterizing potentially relevant patients by their accumulated abnormals achieves a higher F1-score, as shown by the results summarized in the rows corresponding to strategies of AUI and AUA of
Table 2 and line graphs (green for strategy AUI and blue for strategy AUA) of
Figure 6.
4.3. Selection of the Relevant Set
This experiment determines how different criteria for the construction of relevant sets influence the treatment prediction performance described using the metrics (defined above) of accuracy concerning patients/treatments.
We tried the following two alternatives.
Relevant Patients Based on Similarity: For each target patient p, select at least 200 patients in descending order of similarity based on accumulated abnormal evaluation.
Relevant Patients Based on Uniform Choice: For each target patient p, randomly and uniformly select at least 200 patients, regardless of their similarities.
The intuition behind the Similarity Selection of relevant patients is that building a model for treatment recommendations for patient P based on patients having similar abnormals can lead to better predictions of treatments, especially rare ones.
The intuition behind uniform Random Selection of relevant patients is to eliminate bias.
The results show that the overall F1-score of Uniform Selection and Similarity Selection are very similar, as shown in Section
Table 2, where the strategy uniform-umap-accumulated (UUA) corresponds to Uniform Selection and the strategy abnormal-umap-accumulated (AUA) corresponds to Similarity Selection. This suggests that for common treatments, the uniform Random Selection of relevant patients is as good as Similarity Selection of relevant patients.
By contrast, the metric of accuracy by treatments summarized in
Figure 6 with line graphs (red for strategy UUA and blue for strategy AUA) shows that the Similarity Selection of relevant patients performs much better than Uniform Selection for rare treatments. In our dataset, among treatments in the lowest 75% of frequency with a mean number of 571 applications (which is 10 times less than the 5194 applications of frequent treatments), Similarity Selection achieves an accumulated F1-score of 66%, whereas Uniform Selection achieves an accumulated F1-score only of 59%. For the least frequent 50% of treatments, the F1-score when using Similarity Selection is 43%, while the F1-score when using Random Selection is 29%. Admittedly, neither method does very well for rare treatments, but Similarity Selection performs much better for such treatments.
5. Testing Experiment: Applying the Tuned Recommendation Pipeline to the Sequestered Data
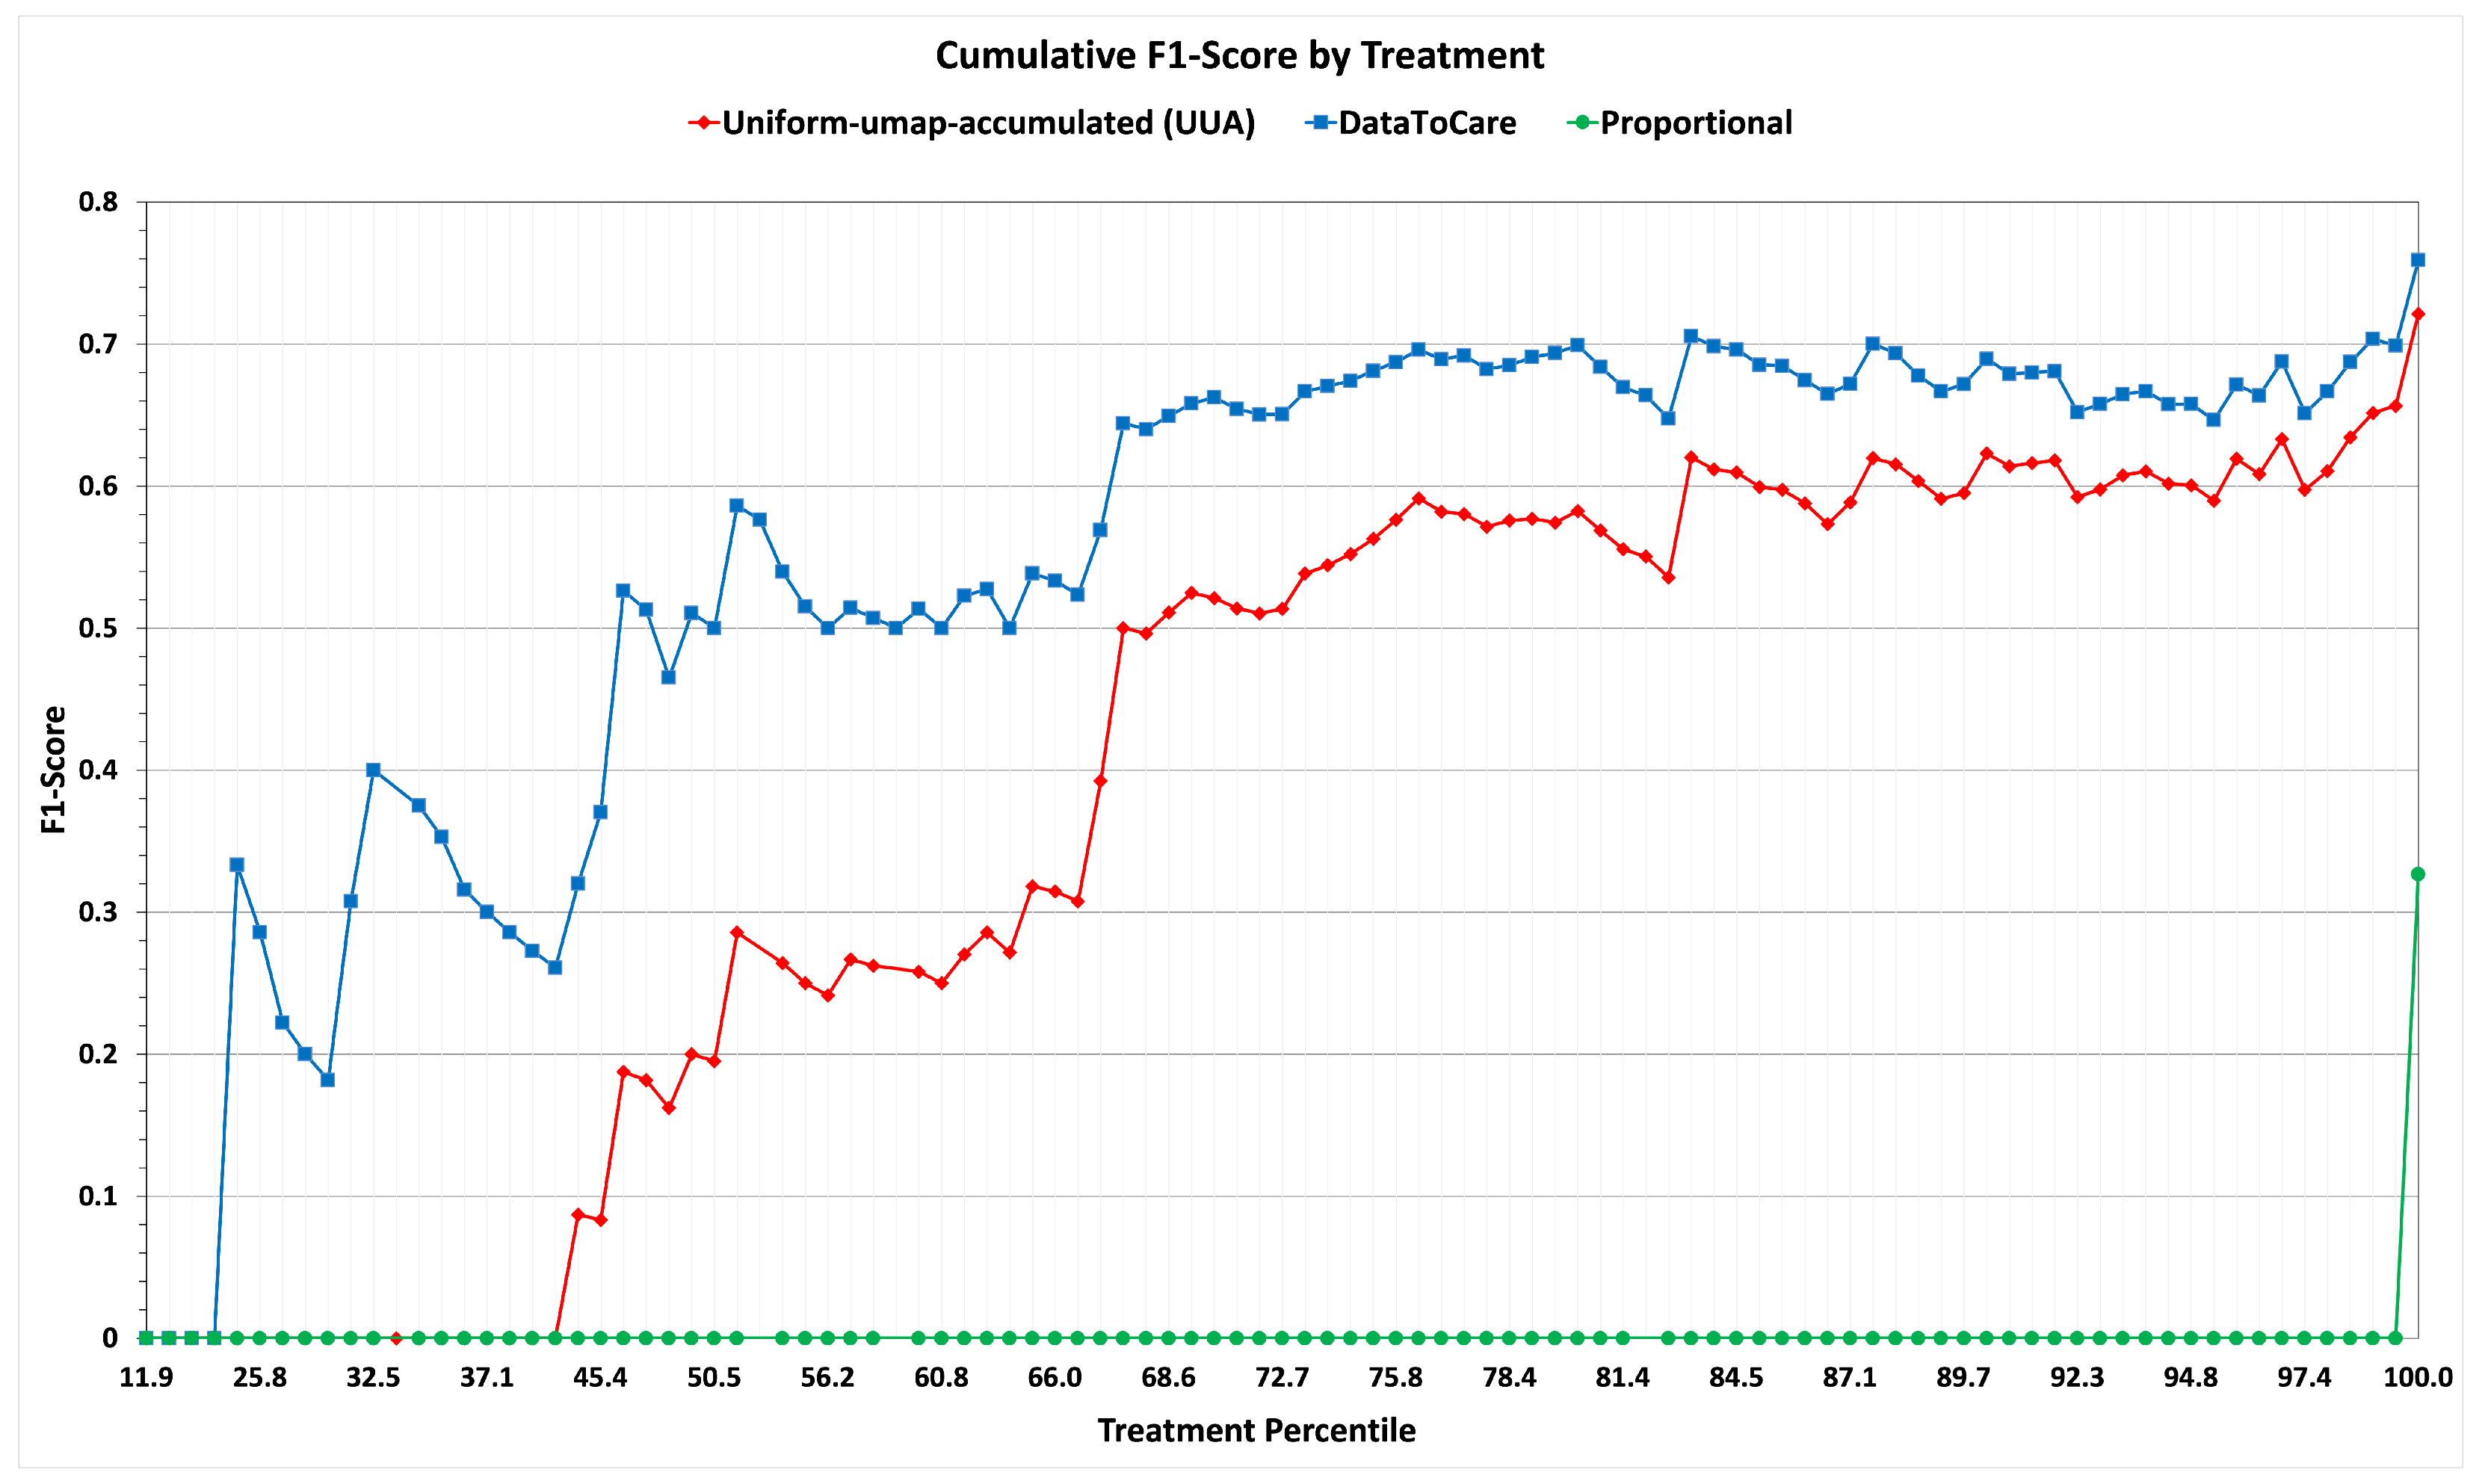
Having conducted hyperparameter tuning, we conducted a test on a set of 500 patients randomly selected from the patients remaining in our hold-out/sequestered set. The results summarizing the metrics of F1-score with respect to patients and F1-score with respect to treatments are summarized in
Table 3 and Graph
Figure 7. On both metrics, the results are consistent with those of the training experiment when using the abnormal-umap-accumulated strategy.
These results show the promise of DataToCare in providing precise treatment recommendations for short time horizons (2 h) when trained on 200 of the most similar patients ranked by similarity. For patients with rare abnormals, the “similar” patient scores may be lower than for patients with common abnormals.
We compare the results of our pipeline (the hypothesis) with a baseline mechanism that we call Proportional. The Proportional Relevant Selection strategy predicts a treatment with probability proportional to the overall probability of each treatment r over all patients in the non-sequestered set who stayed for 42 or fewer days (without regard to their similarity).
Specifically, consider a patient p who was admitted t hours ago. Proportional predicts that a treatment r should be given to p with a probability of (number of patients to whom r is given between t to hours after admission to the ICU) / (all patients ever admitted to the MICU and who have stayed for hours). Recall that .
In summary, we have a three-way comparison: (i) abnormal-umap-accumulated (AUA) Similarity Selection of relevant patients, (ii) uniform-umap-accumulated (UUA) selection of relevant patients, and (iii) proportional assignment of treatments. Variant (i) (DataToCare) outperforms (as measured by F1-score) the Alternative Variant for common treatments and even more for rare ones. Variant (ii) outperforms the baseline Proportional Variant (iii).
Some Prediction Examples
To illustrate a real-world use case, we present the profile of Patient X (a pseudonym used to preserve compliance with MIMIC-III data use agreements), a 74-year-old white male admitted to the ICU under Medicare coverage. By hour 15 of admission, when the system generated predictions, the patient exhibited signs of severe physiological instability. His base excess had dropped to and pH to 7.20, indicating significant metabolic acidosis. He was also hypoxemic, with oxygen saturation as low as 74% and elevated lactate levels (6.1 mmol/L). Glucose was critically high (a peak of 395 mg/dL), while renal function was altered, with creatinine ranging from 3.2 to 3.7 mg/dL and BUN exceeding 90. Liver enzymes, including AST, also showed marked elevation.
Given this clinical presentation, the system predicted a mix of continuations of treatment and new interventions. Notably, it recommended the continuation of regular insulin, norepinephrine, midazolam, vasopressin, and drotrecogin. For medications not yet administered at the time of prediction, such as fentanyl, dopamine, and dextrose, DataToCare suggested their use within a window of 1 to 4 h. Fentanyl, for example, was predicted and administered four hours later, while dopamine and dextrose were initiated within the next hour.
These predicted treatments spanned a wide range of usage frequencies in non-sequestered patient admissions, from very common to relatively rare. Drotrecogin, used in select cases of severe sepsis, is a rare treatment, appearing in only 81 treatment administrations and falling in the 24.7th percentile of treatment frequencies. In contrast, vasopressin and dopamine are used moderately (65.5 and 73.2 percentiles, with 1581 and 2442 applications). By contrast, common treatments such as regular insulin and midazolam rank above the 90th percentile, with 18,271 and 31,739 occurrences, respectively.
This case demonstrates DataToCare’s ability to recommend timely and contextually appropriate treatments ranging from common to rare. By forecasting likely interventions in advance, the system can support more responsive, proactive, and informed clinical care, particularly for complex and critically ill patients like this.
6. Physician Evaluation
Dr. Vahid Mohsenin of the Yale School of Medicine evaluated DataToCare and made the following comments:
“Intensive care medicine often requires rapid decision-making to respond to changing patient conditions, and Decision Support Systems (DSS) can play a vital role in this context. DataToCare is an innovative DSS that predicts treatments in the ICU by learning from similar cases and generating data-driven insights about patient abnormalities and potential treatment responses. Specifically, DataToCare can identify abnormalities, e.g., abnormal electrolyte levels due to metabolic acidosis, and recommend potential treatment responses, such as correcting electrolyte imbalances. The high precision and recall of DataToCare, in short time horizons, such as two hours, can assist the care team in responding to emerging conditions. Furthermore, the abnormality-driven criterion of the DataToCare algorithm has been shown to work best for uncommon conditions, abnormalities, and treatments where standard protocols may fall short. Data2Care shows the importance of real-world data and patient dynamic learning, which can complement knowledge-based and guideline-based expert systems. Data2Care, if used with data from top ICU practices, transfers the experience to other centers and helps a consensus-based decision-making process, potentially improving the quality of care for ICU patients”.
7. Conclusions and Future Work
Given a target patient p, DataToCare uses an abnormality-based data-driven criterion to identify patients relevant to p in some state, builds a machine learning model on those relevant patients for each treatment r, and applies that model to suggest whether to give treatment r to p in that state. Given that diagnoses are quite fluid early in a patient’s stay in the Intensive Care Unit, these suggestions show high precision and recall, particularly for short time horizons, such as two hours. Such a time horizon constitutes a useful time scale for the fast-paced environment of an ICU.
The abnormality-driven criterion to identify patients from which to build a machine learning model is of particular help when predicting rare treatments compared to a strategy using a uniform Random Selection of patients. For common treatments, a strategy using a uniform Random Selection of patients is nearly as good.
Some areas of future work include the following.
The current method does not take drug–drug interactions into account, but that is an important post-processing step: given the DataToCare’s recommendations and the current drugs being taken and any drug–drug interactions, the medical staff would need to consider whether a recommended drug that conflicts with a drug the patient is already taking should not be recommended or whether the already-taken drug should be removed.
Incorporating dosage in recommendations: Suggesting a dosage requires additional information, including pharmacokinetics, in the context of each patient’s conditions. While our goal has been to remind physicians of possibly unaddressed issues and the potentially best medicine, including the dosage is a worthwhile research question.
DataToCare currently predicts the next treatments to be given to a target patient. A useful generalization would be to use this same framework to predict the tests to give to that patient.
One of our reviewers suggested the following point for future work: In an Intensive Care Unit, or in any medical setting for that matter, future work might lead to suggestions of a specific treatment to increase or decrease a particular measured lab value or symptom based on established protocols. It would also be useful to suggest the sequence of treatments.
Author Contributions
Conceptualization, A.A., A.S., S.R. and D.S.; methodology, A.A., A.S., S.R. and D.S.; software, S.R., E.S. and Y.L.; validation, S.R., A.S. and D.S.; formal analysis, S.R., A.S., A.A. and D.S.; data curation, S.R., E.S. and Y.L.; writing—original draft preparation, All; writing—review and editing, S.R., A.S., A.A. and D.S.; visualization, S.R.; supervision, A.S., A.A. and D.S.; funding acquisition, A.A. and D.S. All authors have read and agreed to the published version of the manuscript.
Funding
This work was supported by the NYUAD Center for Interacting Urban Networks (CITIES), funded by Tamkeen under the NYUAD Research Institute Award CG001. Additional support came from NYU WIRELESS, grants 1R01GM121753 (U.S. NIH), 1934388 (U.S. NSF), and 1840761 (U.S. NSF).
Data Availability Statement
Acknowledgments
The authors would like to acknowledge the helpful feedback and guidance of Vahid Mohsenin and Andrey Zinchuk. Mohsenin, Critical Care & Sleep Medicine, Yale University School of Medicine, was also kind enough to point out the utility of DataToCare. Zinchuk, provided valuable insights. We would also like to thank the anonymous reviewers for their very helpful comments.
Conflicts of Interest
The authors declare no conflicts of interest.
References
- Daniel, M.; Hájek, P.; Nguyen, P.H. CADIAG-2 and MYCIN-like systems. Artif. Intell. Med. 1997, 9, 241–259. [Google Scholar] [CrossRef] [PubMed]
- Adlassnig, K.P.; Kolarz, G.; Scheithauer, W.; Effenberger, H.; Grabner, G. CADIAG: Approaches to computer-assisted medical diagnosis. Comput. Biol. Med. 1985, 15, 315–335. [Google Scholar] [CrossRef] [PubMed]
- Adlassng, K.P.; Akhavan-Heidari, M. Cadiag-2/gall: An experimental expert system for the diagnosis of gallbladder and biliary tract diseases. Artif. Intell. Med. 1989, 1, 71–77. [Google Scholar] [CrossRef]
- Mason, D.; Linkens, D.A.; Abbod, M.F.; Edwards, N.; Reilly, C. Automated delivery of muscle relaxants using fuzzy logic control. IEEE Eng. Med. Biol. Mag. 1994, 13, 678–685. [Google Scholar] [CrossRef]
- Presedo, J.; Vila, J.; Barro, S.; Palacios, F.; Ruiz, R.; Taddei, A.; Emdin, M. Fuzzy modelling of the expert’s knowledge in ECG-based ischaemia detection. Fuzzy Sets Syst. 1996, 77, 63–75. [Google Scholar] [CrossRef]
- Sutton, R.T.; Pincock, D.; Baumgart, D.C.; Sadowski, D.C.; Fedorak, R.N.; Kroeker, K.I. An overview of clinical decision support systems: Benefits, risks, and strategies for success. npj Digit. Med. 2020, 3, 17. [Google Scholar] [CrossRef]
- Liberati, E.; Ruggiero, F.; Galuppo, L.; Gorli, M.; Gonzalez Lorenzo, M.; Maraldi, M.; Ruggieri, P.; Polo Friz, H.; Scaratti, G.; Kwag, K.; et al. What hinders the uptake of computerized decision support systems in hospitals? A qualitative study and framework for implementation. Implement. Sci. 2017, 12, 113. [Google Scholar] [CrossRef]
- Pincay, J.; Terán, L.; Portmann, E. Health recommender systems: A state-of-the-art review. In Proceedings of the 2019 Sixth International Conference on eDemocracy & eGovernment (ICEDEG), Quito, Ecuador, 24–26 April 2019; IEEE: Piscataway, NJ, USA, 2019; pp. 47–55. [Google Scholar]
- Choi, E.; Bahadori, M.T.; Schuetz, A.; Stewart, W.F.; Sun, J. Doctor ai: Predicting clinical events via recurrent neural networks. In Proceedings of the Machine Learning for Healthcare Conference, Los Angeles, CA, USA, 19–20 August 2016; pp. 301–318. [Google Scholar]
- Wang, S.; McDermott, M.B.; Chauhan, G.; Ghassemi, M.; Hughes, M.C.; Naumann, T. Mimic-extract: A data extraction, preprocessing, and representation pipeline for mimic-iii. In Proceedings of the ACM Conference on Health, Inference, and Learning, Toronto, ON, Canada, 2–4 April 2020; pp. 222–235. [Google Scholar]
- Zhang, X.; Qian, B.; Cao, S.; Li, Y.; Chen, H.; Zheng, Y.; Davidson, I. INPREM: An Interpretable and Trustworthy Predictive Model for Healthcare. In Proceedings of the 26th ACM SIGKDD International Conference on Knowledge Discovery & Data Mining, Virtual Event, CA, USA, 6–10 July 2020; pp. 450–460. [Google Scholar]
- Rajkomar, A.; Oren, E.; Chen, K.; Dai, A.M.; Hajaj, N.; Hardt, M.; Liu, P.J.; Liu, X.; Marcus, J.; Sun, M.; et al. Scalable and accurate deep learning with electronic health records. npj Digit. Med. 2018, 1, 18. [Google Scholar] [CrossRef]
- Choi, E.; Bahadori, M.T.; Song, L.; Stewart, W.F.; Sun, J. GRAM: Graph-based attention model for healthcare representation learning. In Proceedings of the 23rd ACM SIGKDD International Conference on Knowledge Discovery and Data Mining, Halifax, NS, Canada, 13–17 August 2017; pp. 787–795. [Google Scholar]
- Ma, F.; Chitta, R.; Zhou, J.; You, Q.; Sun, T.; Gao, J. Dipole: Diagnosis prediction in healthcare via attention-based bidirectional recurrent neural networks. In Proceedings of the 23rd ACM SIGKDD International Conference on Knowledge Discovery and Data Mining, Halifax, NS, Canada, 13–17 August 2017; pp. 1903–1911. [Google Scholar]
- Nguyen, P.; Tran, T.; Wickramasinghe, N.; Venkatesh, S. Deepr: A Convolutional Net for Medical Records. IEEE J. Biomed. Health Inform. 2017, 21, 22–30. [Google Scholar] [CrossRef]
- Choi, E.; Bahadori, M.T.; Sun, J.; Kulas, J.A.; Schuetz, A.; Stewart, W. RETAIN: An Interpretable Predictive Model for Healthcare using Reverse Time Attention Mechanism. In Proceedings of the NIPS, Barcelona, Spain, 5–10 December 2016. [Google Scholar]
- Suresh, H.; Hunt, N.; Johnson, A.; Celi, L.A.; Szolovits, P.; Ghassemi, M. Clinical intervention prediction and understanding with deep neural networks. In Proceedings of the Machine Learning for Healthcare Conference, Boston, MA, USA, 18–19 August 2017; PMLR: New York, NY, USA, 2017; pp. 322–337. [Google Scholar]
- Esteban, C.; Staeck, O.; Baier, S.; Yang, Y.; Tresp, V. Predicting clinical events by combining static and dynamic information using recurrent neural networks. In Proceedings of the 2016 IEEE International Conference on Healthcare Informatics (ICHI), Chicago, IL, USA, 4–7 October 2016; IEEE: Piscataway, NJ, USA, 2016; pp. 93–101. [Google Scholar]
- Klein, G. A naturalistic decision making perspective on studying intuitive decision making. J. Appl. Res. Mem. Cogn. 2015, 4, 164–168. [Google Scholar] [CrossRef]
- Purushotham, S.; Meng, C.; Che, Z.; Liu, Y. Benchmarking deep learning models on large healthcare datasets. J. Biomed. Inform. 2018, 83, 112–134. [Google Scholar] [CrossRef] [PubMed]
- Cui, S.; Wang, J.; Zhong, Y.; Liu, H.; Wang, T.; Ma, F. Automated fusion of multimodal electronic health records for better medical predictions. In Proceedings of the 2024 SIAM International Conference on Data Mining (SDM), Houston, TX, USA, 8–20 April 2024; SIAM: Philadelphia, PA, USA, 2024; pp. 361–369. [Google Scholar]
- Lim, L.; Kim, M.; Cho, K.; Yoo, D.; Sim, D.; Ryu, H.G.; Lee, H.C. Multicenter validation of a machine learning model to predict Intensive Care Unit readmission within 48 hours after discharge. eClinicalMedicine 2025, 81, 103112. [Google Scholar] [CrossRef]
- Kim, J.; Kim, G.H.; Kim, J.W.; Kim, K.H.; Maeng, J.Y.; Shin, Y.G.; Park, S. Transformer-based model for predicting length of stay in intensive care unit in sepsis patients. Front. Med. 2025, 11, 1473533. [Google Scholar] [CrossRef] [PubMed]
- Wang, S.; Liu, X.; Yuan, S.; Bian, Y.; Wu, H.; Ye, Q. Artificial intelligence based multispecialty mortality prediction models for septic shock in a multicenter retrospective study. Npj Digit. Med. 2025, 8, 228. [Google Scholar] [CrossRef]
- Duggal, A.; Scheraga, R.; Sacha, G.L.; Wang, X.; Huang, S.; Krishnan, S.; Siuba, M.T.; Torbic, H.; Dugar, S.; Mucha, S.; et al. Forecasting disease trajectories in critical illness: Comparison of probabilistic dynamic systems to static models to predict patient status in the Intensive Care Unit. BMJ Open 2024, 14, e079243. [Google Scholar] [CrossRef]
- Fabbri, A.; Tascioglu, A.B.; Bertini, F.; Montesi, D. Overnight Stay in the Emergency Department and In-Hospital Mortality Among Elderly Patients: A 6-Year Follow-Up Italian Study. J. Clin. Med. 2025, 14, 2879. [Google Scholar] [CrossRef]
- Catling, F.J.; Wolff, A.H. Temporal convolutional networks allow early prediction of events in critical care. J. Am. Med. Inform. Assoc. 2020, 27, 355–365. [Google Scholar] [CrossRef]
- Jin, B.; Yang, H.; Sun, L.; Liu, C.; Qu, Y.; Tong, J. A treatment engine by predicting next-period prescriptions. In Proceedings of the 24th ACM SIGKDD International Conference on Knowledge Discovery & Data Mining, London, UK, 19–23 August 2018; pp. 1608–1616. [Google Scholar]
- Wang, L.; Zhang, W.; He, X.; Zha, H. Supervised reinforcement learning with recurrent neural network for dynamic treatment recommendation. In Proceedings of the 24th ACM SIGKDD International Conference on Knowledge Discovery & Data Mining, London, UK, 19–23 August 2018; pp. 2447–2456. [Google Scholar]
- Bajor, J.; Lasko, T. Predicting Medications from Diagnostic Codes with Recurrent Neural Networks. In Proceedings of the ICLR, Toulon, France, 24–26 April 2017. [Google Scholar]
- Hoang, K.H.; Ho, T.B. Learning and recommending treatments using electronic medical records. Knowl.-Based Syst. 2019, 181, 104788. [Google Scholar] [CrossRef]
- Parimbelli, E.; Marini, S.; Sacchi, L.; Bellazzi, R. Patient similarity for precision medicine: A systematic review. J. Biomed. Inform. 2018, 83, 87–96. [Google Scholar] [CrossRef]
- Chen, J.; Sun, L.; Guo, C.; Xie, Y. A fusion framework to extract typical treatment patterns from electronic medical records. Artif. Intell. Med. 2020, 103, 101782. [Google Scholar] [CrossRef]
- Shang, J.; Xiao, C.; Ma, T.; Li, H.; Sun, J. Gamenet: Graph augmented memory networks for recommending medication combination. AAAI Conf. Artif. Intell. 2019, 33, 1126–1133. [Google Scholar] [CrossRef]
- Shang, J.; Ma, T.; Xiao, C.; Sun, J. Pre-training of Graph Augmented Transformers for Medication Recommendation. In Proceedings of the IJCAI, Macao, China, 10–16 August 2019. [Google Scholar]
- Zhang, Y.; Chen, R.; Tang, J.; Stewart, W.F.; Sun, J. LEAP: Learning to prescribe effective and safe treatment combinations for multimorbidity. In Proceedings of the 23rd ACM SIGKDD International Conference on Knowledge Discovery and Data MINING, Halifax, NS, Canada, 13–17 August 2017; pp. 1315–1324. [Google Scholar]
- Johnson, A.; Pollard, T.; Shen, L.; Lehman, L.w.; Feng, M.; Ghassemi, M.; Moody, B.; Szolovits, P.; Celi, L.; Mark, R. MIMIC-III, a freely accessible critical care database. Sci. Data 2016, 3, 160035. [Google Scholar] [CrossRef] [PubMed]
- MIMIC-IV Documentation. Mimic-IV Note Information. Available online: https://mimic.mit.edu/docs/iv/modules/note/ (accessed on 30 May 2022).
- Guidet, B.; Vallet, H.; Boddaert, J.; De Lange, D.; Morandi, A.; Leblanc, G.; Artigas, A.; Flaatten, H. Caring for the critically ill patients over 80: A narrative review. Ann. Intensive Care 2018, 8, 114. [Google Scholar] [CrossRef] [PubMed]
- Guidet, B.; De Lange, D.; Christensen, S.; Moreno, R.; Fjølner, J.; Dumas, G.; Flaatten, H. Attitudes of physicians towards the care of critically ill elderly patients - a European survey. Acta Anaesthesiol. Scand. 2017, 62, 207–219. [Google Scholar] [CrossRef]
- Reinikainen, M.; Niskanen, M.; Uusaro, A.; Ruokonen, E. Impact of gender on treatment and outcome of ICU patients. Acta Anaesthesiol. Scand. 2005, 49, 984–990. [Google Scholar] [CrossRef]
- Spencer, C.S.; Gaskin, D.J.; Roberts, E.T. The quality of care delivered to patients within the same hospital varies by insurance type. Health Aff. 2013, 32, 1731–1739. [Google Scholar] [CrossRef]
- McInnes, L.; Healy, J.; Melville, J. UMAP: Uniform Manifold Approximation and Projection for Dimension Reduction. arXiv 2020, arXiv:1802.03426. [Google Scholar]
| Disclaimer/Publisher’s Note: The statements, opinions and data contained in all publications are solely those of the individual author(s) and contributor(s) and not of MDPI and/or the editor(s). MDPI and/or the editor(s) disclaim responsibility for any injury to people or property resulting from any ideas, methods, instructions or products referred to in the content. |
© 2025 by the authors. Licensee MDPI, Basel, Switzerland. This article is an open access article distributed under the terms and conditions of the Creative Commons Attribution (CC BY) license (https://creativecommons.org/licenses/by/4.0/).


 ,
, 
