Article

A Regret-Enhanced DEA Approach to Mapping Renewable Energy Efficiency in Asia’s Growth Economies

Department of Industrial Engineering and Management, National Kaohsiung University of Science and Technology, Kaohsiung City 807618, Taiwan
*
Author to whom correspondence should be addressed.
Algorithms 2025, 18(5), 297; https://doi.org/10.3390/a18050297
Submission received: 15 April 2025 / Revised: 15 May 2025 / Accepted: 19 May 2025 / Published: 20 May 2025

Abstract

:
Renewable energy (RE) is pivotal to achieving both environmental sustainability and long-term energy security, yet systematic evidence on the efficiency of RE investment across South and Southeast Asia remains sparse. This study introduces a rejoice–regret utility cross-efficiency DEA (RRUCE-DEA) framework that fuses conventional quantitative efficiency measurement with the behavioral insights of regret theory. Applying the model to 16 countries shows India as the benchmark for efficient RE investment allocation, followed closely by Pakistan and Indonesia. The Philippines, Malaysia, and Vietnam also post strong results, whereas Sri Lanka and Thailand reveal moderate performance with clear room for improvement. At the lower end of the spectrum, Cambodia, Myanmar, and Afghanistan encounter significant hurdles that must be overcome to achieve a successful clean energy transition. A sensitivity analysis further explores how variations in the regret aversion and rejoice–regret coefficients affect the RRUCE-DEA outcomes. The findings provide actionable guidance for policymakers and investors seeking to channel resources toward a cleaner, more sustainable regional energy portfolio.

1. Introduction

Renewable energy (RE) stands as a crucial cornerstone of a sustainable future, addressing both environmental concerns and energy security [1,2]. Its importance is underscored by its potential to mitigate climate change, reduce carbon emissions, and foster energy independence [3]. This has led to a remarkable surge in renewable energy investment worldwide, marking a transformative shift in the global energy landscape [4,5]. While renewable energy is widely recognized as a cornerstone of sustainable economic development, recent years have witnessed a noticeable shift in global energy strategies. Faced with energy security concerns, volatile fuel markets, and geopolitical instability, several countries have adopted a more pragmatic stance: temporarily reintegrating or extending the use of traditional fossil fuels such as natural gas and coal [6,7]. This trend underscores the complex trade-offs that many nations must manage between climate goals and short-term energy demands. Despite this shift, the strategic importance of renewable energy remains undiminished. Efficient investment in renewables continues to play a central role in long-term energy diversification and decarbonization pathways, especially in fast-growing regions like South and Southeast Asia. Therefore, understanding the relative efficiency of renewable energy investments remains vital for guiding sustainable policy design in an evolving energy landscape.
As governments, businesses, and individuals recognize the imperative to transition away from fossil fuels, investment in RE projects like solar, wind, and hydroelectric power has skyrocketed [5,8], as presented in Figure 1. According to the International Renewable Energy Agency (IRENA), global renewable energy capacity increased by 10.3% in 2021 alone, with investment reaching a record USD 303.5 billion [9]. As shown in Figure 2, the data underscore the increasing importance of renewable energy investments globally, with both established economies and emerging markets recognizing the benefits of transitioning to cleaner energy alternatives. It also emphasizes the crucial role China plays in shaping the renewable energy landscape. However, the varying trajectories of investment among the different categories highlight the complex interplay of economic, political, and environmental factors that influence decision making in the renewable energy sector. This robust momentum is mirrored in the South Asian context, where countries like India are emerging as renewable energy leaders. India, for instance, has set a goal to achieve 450 GW of RE capacity by 2030, with an investment goal of USD 500 billion [10]. This commitment has spurred a surge in solar installations and wind farms across the country, transforming its energy mix and reducing dependency on coal. Within South Asia, other nations are also making noteworthy strides. Bangladesh, despite facing energy poverty challenges, has embarked on an impressive journey by installing one of the largest solar home systems globally, benefiting millions of households [11]. In the Association of Southeast Asian Nations (ASEAN), this surge is particularly evident, reflecting a growing recognition of the imperative to diversify energy portfolios and promote sustainable growth [12]. As economies in the region continue to expand, the demand for energy is soaring, prompting many ASEAN member states to embrace renewable alternatives [13]. For instance, Thailand has emerged as a regional leader, with goals to generate 35% of its total energy from renewable sources by 2037 [14]. Similarly, Indonesia, with its abundant geothermal potential, is investing significantly in this clean energy source to meet its burgeoning energy demands while reducing its carbon footprint. According to data from the ASEAN Centre for Energy, the region’s total renewable energy capacity increased by over 60% between 2014 and 2019, underlining the substantial progress made [14].
However, challenges such as policy alignment, regulatory frameworks, and financing barriers persist, hampering the full realization of renewable energy potential. Collaborative efforts among ASEAN member states, along with support from international partners, are crucial in surmounting these hurdles and accelerating the transition [17]. However, challenges remain in terms of policy frameworks, grid integration, and technological advancements [18]. While the potential for renewable energy is vast, fostering a conducive investment environment and ensuring a seamless transition from conventional sources demand concerted efforts from governments, international organizations, and private sector stakeholders [8,19]. The role of investment efficiency assessment is paramount in ensuring the optimal allocation of resources and maximizing the impact of renewable energy initiatives [20]. As global focus shifts toward sustainable energy sources, understanding the effectiveness of renewable energy investments becomes essential for informed decision making. Investigations into renewable energy investments have emerged as a pivotal area of research, fueled by the global imperative for sustainable and cleaner energy solutions. Scholars have diligently examined various dimensions of this topic, shedding light on its economic, environmental, and societal implications [4,5,8,21,22,23,24,25,26,27,28].
In response, Data Envelopment Analysis (DEA) has been widely applied to assess energy efficiency and sustainability across different national and regional contexts, such as in Algeria, Turkey, Korea, East Asia, the Czech Republic, and China [29,30,31,32,33,34,35,36,37,38,39,40,41,42,43,44]. More recent international studies have expanded this approach by integrating behavioral insights into the DEA framework [45,46,47]. For instance, behavioral DEA models incorporating loss aversion or regret preferences have been applied to environmental regulation, carbon trading, and green investment evaluations [48,49,50,51]. These models acknowledge that decision makers often deviate from purely rational behavior, instead reacting based on anticipated emotions such as regret or rejoice. Regret theory, in particular, has been shown to provide a powerful behavioral dimension to performance evaluation [52,53], and its integration with DEA introduces a more holistic approach to decision making under uncertainty. Although these advances are notable, most of these applications focus on developed economies or firm-level analyses.
The present study contributes to this evolving literature by applying a rejoice–regret utility cross-efficiency DEA (RRUCE-DEA) model to the context of renewable energy investment efficiency in South and Southeast Asia—regions that have received limited attention in prior behavioral DEA research. Unlike previous studies that evaluate efficiency at a single-point frontier or focus on organizational units, this study incorporates cross-evaluation across multiple countries and explicitly embeds rejoice–regret behavioral responses in both input and output transformation. To the best of our knowledge, this is the first application of the RRUCE-DEA model to a multi-country assessment of RE investment efficiency in emerging Asian economies, offering both empirical benchmarks and methodological innovation.

2. Methodology

2.1. Bounded Rationality and Regret Theory

Bounded rationality, an idea put forth by Herbert A. Simon, posits that individuals arrive at decisions considering their constrained information and cognitive abilities [54]. This counters the prevalent assumption in economic frameworks where people are deemed entirely rational and adept at making reasoned choices [49]. An alternative perspective on rational decision making amidst uncertainty is offered by regret theory [53]. This viewpoint proposes that decisions are driven by the anticipation of regret that might arise from selecting an incorrect option. In the context of decision making in business, the regret minimization framework acts as a guiding principle, encouraging individuals to envision themselves in the future and make choices that minimize potential remorse.
Definition 1.
Risk-Adjusted Utility.
Let T be an alternative selected by the decision maker and let t be the consequence (or outcome) that results from choosing T . The risk-adjusted utility of selecting alternative T , denoted by u ( t ) , is defined as follows:
u t = t θ ,     0 < θ < 1
Here, the symbol θ represents the decision maker’s risk aversion coefficient. It controls the degree of concavity of the utility function and thereby captures the decision maker’s attitude toward risk. A smaller value of θ corresponds to higher risk aversion, meaning that the decision maker derives less additional utility from larger outcomes. When θ = 1 , the decision maker is risk-neutral, and when θ < 1 , diminishing marginal utility is observed. In this study, a typical value of θ = 0.88 is used, consistent with empirical findings in the regret theory literature [55].
Definition 2.
RegretRejoice Utility Function.
Let T 1 and T 2 be two alternatives leading to consequences t 1 and t 2 , respectively. The regret–rejoice utility function, denoted by r t 1 , t 2 , is defined as the emotional adjustment to utility when comparing t 1 against t 2 :
r t 1 , t 2 = R Δ t = 1 e λ u t 1 u t 2 = 1 e λ Δ u ,   λ > 0
where Δ u = u t 1 u t 2 = u ( Δ t ) , R Δ t is the regret–rejoice transformation function applied to a single scalar value. The parameter λ expresses the regret aversion coefficient of the decision maker. The larger the value of λ , the larger regret aversion of the decision maker. The value of r t 1 , t 2 expresses the regret value when u t 1 u t 2   o r   ( Δ u 0 ) . The parameter λ signifies the decision maker’s regret aversion coefficient. A higher λ value corresponds to a greater extent of regret aversion exhibited by the decision maker. The term r t 1 , t 2 denotes the measure of regret when the utility associated with choice T 1 is less than or equal to the utility linked with choice T 2 . Otherwise, it expresses the rejoice value. A value of 0.3 was assumed experimentally [55].
Definition 3.
Final Decision Utility.
Let T j be a set of alternatives for j = 1 , , m , each resulting in a consequence t j . The final decision utility of alternative T i , denoted by l t j , is defined as the sum of the risk-adjusted utility and the regret–rejoice utility relative to the best alternative in the set:
l t j = u t j + r t j , t *
where
t * = max 1 j m t j   a n d   r t j , t * 0
Remark 1.
The function R · captures the emotional response of the decision maker to the difference in utilities. It is monotonically increasing and concave, satisfying the following:
R Δ u = λ e λ Δ u > 0 R Δ u = λ 2 e λ Δ u < 0 R Δ u = 0
According to Definition 2, if Δ u > 0 , R Δ u is considered a gain or the rejoice utility of the decision maker selecting alternative T l instead of T k . The higher the value of the rejoice utility, the higher the value of Δ t . If Δ u < 0 , R Δ u is considered a loss or the regret utility of the decision maker selecting alternative T l instead of T k . The higher of the regret utility, the higher the value of Δ u .

2.2. Self-Efficiency Data Envelopment Analysis

The basic idea of DEA is to find a way to compare the efficiency of different decision-making units (DMUs). This is carried out by constructing a production frontier, which is the set of all DMUs that are technically efficient. A DMU is said to be technically efficient if it cannot produce more output without using more inputs or produces the same output with fewer inputs. According to CRR (Charnes, Cooper, and Rhodes) model, based on n inputs ( i = 1 I ) and m outputs ( j = 1 J ) , the self-technical efficiency ( E k ) of DMU k t h   ( k = 1 K ) is estimated by solving the model in Equation (6) [56]. In this model, y j k and x i k express the j t h output and i t h input of kth DMU, respectively. In addition, v j k and u i k express the weights with respect to the j t h output and the i t h input of the k th DMU.
max   E k = j = 1 J v j k y j k i = 1 I u i k x i k subject   to j = 1 J v j k y j l i = 1 I u i k x i l 1 l = 1 , , K u i k 0 i = 1 , , I ;   k = 1 , , K v j k 0 j = 1 , , J ;   k = 1 , , K
The CCR model is a simple and intuitive way to measure the efficiency of DMUs. However, it has some limitations. One limitation is that it assumes constant returns to scale (CRS). This may not be realistic in all cases, as some DMUs may be able to produce more output by increasing inputs at a decreasing rate. Therefore, another DEA model is proposed to estimate the efficiency of DMU based on slack measurement by Tone [57]. The slack-based measure (SBM) model, as formulated in Equation (7), assumes CRS, similar to the CCR model. However, a variable returns to scale (VRS) version of the SBM model can be obtained by incorporating a convexity constraint on the intensity variables, as introduced in Tone (2002) [58]. This makes it a better choice for situations where the assumption of CRS is not realistic. By solving the model in Equation (7), the k t h is considered SBM-efficient if β = 1 .
min   β = 1 1 I i = 1 I s i x i k 1 + 1 J j = 1 J s j + y j k subject   to x i k = i = 1 M σ k x i k + s i i = 1 , , I y j k = i = 1 M σ k y j k + s j + j = 1 , , J σ k , s i , s j + 0 i I , j J , k K
Here, s i , and s j + express the negative slack ( s i ) and positive slack ( s j + ) variables, respectively. The σ is a non-negative vector in R k to modify the production possibility set. However, these traditional DEA models sometimes provide an efficiency value of 1 for multiple DMUs at the same time.
Because the model in Equation (6) is a nonlinear programming model, it was converted into a linear programming model by Charnes and Cooper as follows [59]:
max   E k k = j = 1 J v j k y j k subject   to i = 1 I u i k x i k = 1 j = 1 J v j k y j l i = 1 I u i k x i l 0 l = 1 , , K u i k 0 i = 1 , , I ;   k = 1 , , K v j k 0 j = 1 , , J ;   k = 1 , , K
By solving the model in Equation (8), the optimized value of the objective function E k k * is the self-efficiency value of k t h DMU with the optimal solution v j k * and u i k * .

2.3. Cross-Efficiency DEA Model

A known limitation of standard DEA models is that multiple decision-making units (DMUs) may achieve an efficiency score of 1, resulting in limited discriminatory power. To address this issue and enhance differentiation among efficient units, the DEA approach was extended by incorporating cross-efficiency evaluation [60]. This method enables each DMU to be evaluated not only by its own optimal weights but also by the weights derived from peer DMUs. With the optimal solution v j k * and u i k * of k t h DMU, the cross-efficiency ( E k l ) of l t h DMU in peer evaluation with k t h DMU is defined as follows:
E k l = j = 1 J v j k * y j l i = 1 I u i k * x i l
Therefore, corresponding to k t h DMU, the model in Equation (9) can define one self-efficiency for k t h DMU and ( k 1 ) cross-efficiency for k t h DMU with the remaining DMUs. As a result, the cross-efficiency matrix ( Π ) and cross-efficiency of k t h DMU ( E ¯ k ) can be constructed as follows below:
Π = E 11 E K 1 E 1 K E K K E ¯ k = 1 K l = 1 K E k l k = 1 K

2.4. Regret Theory Extension of Cross-Efficiency DEA Model

2.4.1. Rejoice Utility Cross-Efficiency DEA Model

Assume D M U is the worst and reference DMU; the rejoice utility of D M U k corresponding to D M U is considered the gain value of D M U k . Based on the regret–rejoice utility structure introduced in Definition 2, the gain values for the rejoice utility DEA model are constructed using Equations (11) and (12). These gain values ( R J j k o u t p u t , R J i k i n p u t ) represent the psychological advantage of D M U k compared to the least-performing reference DMU across outputs and inputs.
R J j k o u t p u t = R y j k min k K y j k = 1 e λ y j k min k K y j k
R J i k i n p u t = R max k K x i k x i k = 1 e λ max k K x i k x i k
According to Remark 1, because y j k min k K y j k , R J j k o u t p u t = R y j k min k K y j k 0 is the gain value of decision maker selecting the D M U k instead of D M U corresponding to j t h output. Hence, the total gain value of the decision maker selecting the D M U k instead of D M U corresponding to all outputs can be considered j = 1 J v j k R J j k o u t p u t . On the other hand, because x i k max k K x i k , R J i k i n p u t = R max k K x i k x i k 0 is the gain value of the decision maker selecting the D M U k instead of D M U corresponding to i t h input. Hence, the total gain value of the decision maker selecting the D M U k instead of D M U corresponding to all inputs being considered i = 1 I u i k R J i k i n p u t . Therefore, the total gain value or rejoice utility of the decision maker selecting the D M U k instead of D M U corresponding to all inputs and outputs can be determined as follows:
R J k = j = 1 J v j k R J j k o u t p u t + i = 1 I u i k R J i k i n p u t
In general, decision makers prefer to maximize the total rejoice utility by finding the optimal weights v j k and u i k . Hence, the rejoice utility cross-efficiency DEA model can be constructed as follows below.
max   R J k = j = 1 J v j k R J j k o u t p u t + i = 1 I u i k R J i k i n p u t subject   to j = 1 J v j k y j k = E k k * k = 1 , , K i = 1 I u i k x i k = 1 k = 1 , , K j = 1 J v j l y j l i = 1 I u i l x i l 0 l = 1 , , K u i k 0 i = 1 , , I ;   k = 1 , , K v j k 0 j = 1 , , J ;   k = 1 , , K

2.4.2. Regret Utility Cross-Efficiency DEA Model

Assume D M U + is the best and reference DMU; the regret utility of D M U k corresponding to D M U + is considered the loss value of D M U k . According to Definition 2, the loss values ( R E j k o u t p u t , R E i k i n p u t ) of the output utility ( y j k ) and input utility ( x i k ) of D M U k are determined as follows:
R E j k o u t p u t = R y j k max k K y j k = 1 e λ y j k max k K y j k
R E i k i n p u t = R min k K x i k x i k = 1 e λ min k K x i k x i k
According to Remark 1, because y j k max k K y j k , R E j k o u t p u t = R y j k max k K y j k 0 is the loss value of the decision maker selecting the D M U k instead of D M U + corresponding to j t h output. Hence, the total loss value of the decision maker selecting the D M U k instead of D M U + corresponding to all outputs can be considered j = 1 J v j k R E j k o u t p u t . On the other hand, because min k K x i k x i k , R E i k i n p u t = R min k K x i k x i k 0 is the loss value of the decision maker selecting the D M U k instead of D M U + corresponding to i t h input. Hence, the total loss value of the decision maker selecting the D M U k instead of D M U + corresponding to all inputs can be considered i = 1 I u i k R E i k i n p u t . Therefore, the total loss value or rejoice utility of the decision maker selecting the D M U k instead of D M U + corresponding to all inputs and outputs can be determined as follows:
R E k = j = 1 J v j k R E j k o u t p u t + i = 1 I u i k R E i k i n p u t
Because j = 1 J v j k R E j k o u t p u t 0 and i = 1 I u i k R E i k i n p u t 0 , R E k 0 . In the other words, the less total regret utility there is, the bigger R E k is. In general case, decision makers prefer to minimize the total regret utility or maximize the value of R E k by finding the optimal weights v j k and u i k . Hence, the rejoice utility cross-efficiency DEA model can be constructed as follows below.
max   R E k = j = 1 J v j k R E j k o u t p u t + i = 1 I u i k R E i k i n p u t subject   to j = 1 J v j k y j k = E k k * k = 1 , , K i = 1 I u i k x i k = 1 k = 1 , , K j = 1 J v j l y j l i = 1 I u i l x i l 0 l = 1 , , K u i k 0 i = 1 , , I ;   k = 1 , , K v j k 0 j = 1 , , J ;   k = 1 , , K

2.4.3. Rejoice–Regret Utility Cross-Efficiency DEA Model

To obtain the maximize total the gain value and minimize the total loss value, Equations (13) and (17) are integrated into the rejoice–regret utility of D M U k as expressed below:
Q k = φ R J k + 1 φ R E k = φ j = 1 J v j k R J j k o u t p u t + i = 1 I u i k R J i k i n p u t + 1 φ j = 1 J v j k R E j k o u t p u t + i = 1 I u i k R E i k i n p u t = j = 1 J v j k φ R J j k o u t p u t + 1 φ R E j k o u t p u t + i = 1 I u i k ( φ R J i k i n p u t + 1 φ R E i k i n p u t ) = j = 1 J v j k φ 1 e λ y j k min k K y j k + 1 φ 1 e λ y j k max k K y j k + i = 1 I u i k φ 1 e λ max k K x i k x i k + 1 φ 1 e λ min k K x i k x i k
where φ is the rejoice–regret coefficient, which reflects the rejoice–regret psychological preference of decision makers. If 0 φ < 0.5 , the regret loss is more concerning to decision makers. If 0.5 < φ 1 , the rejoice gain is more concerning to decision makers. If φ = 0.5 , the regret loss and the rejoice gain are equally concerning to decision makers.
Therefore, the rejoice–regret utility cross-efficiency DEA (RRUCE DEA) model can be presented below.
max   Q k = j = 1 J v j k φ 1 e λ y j k min k K y j k + 1 φ 1 e λ y j k max k K y j k + i = 1 I u i k φ 1 e λ max k K x i k x i k + 1 φ 1 e λ min k K x i k x i k subject   to j = 1 J v j k y j k = E k k * k = 1 , , K i = 1 I u i k x i k = 1 k = 1 , , K j = 1 J v j l y j l i = 1 I u i l x i l 0 l = 1 , , K u i k 0 i = 1 , , I ;   k = 1 , , K v j k 0 j = 1 , , J ;   k = 1 , , K

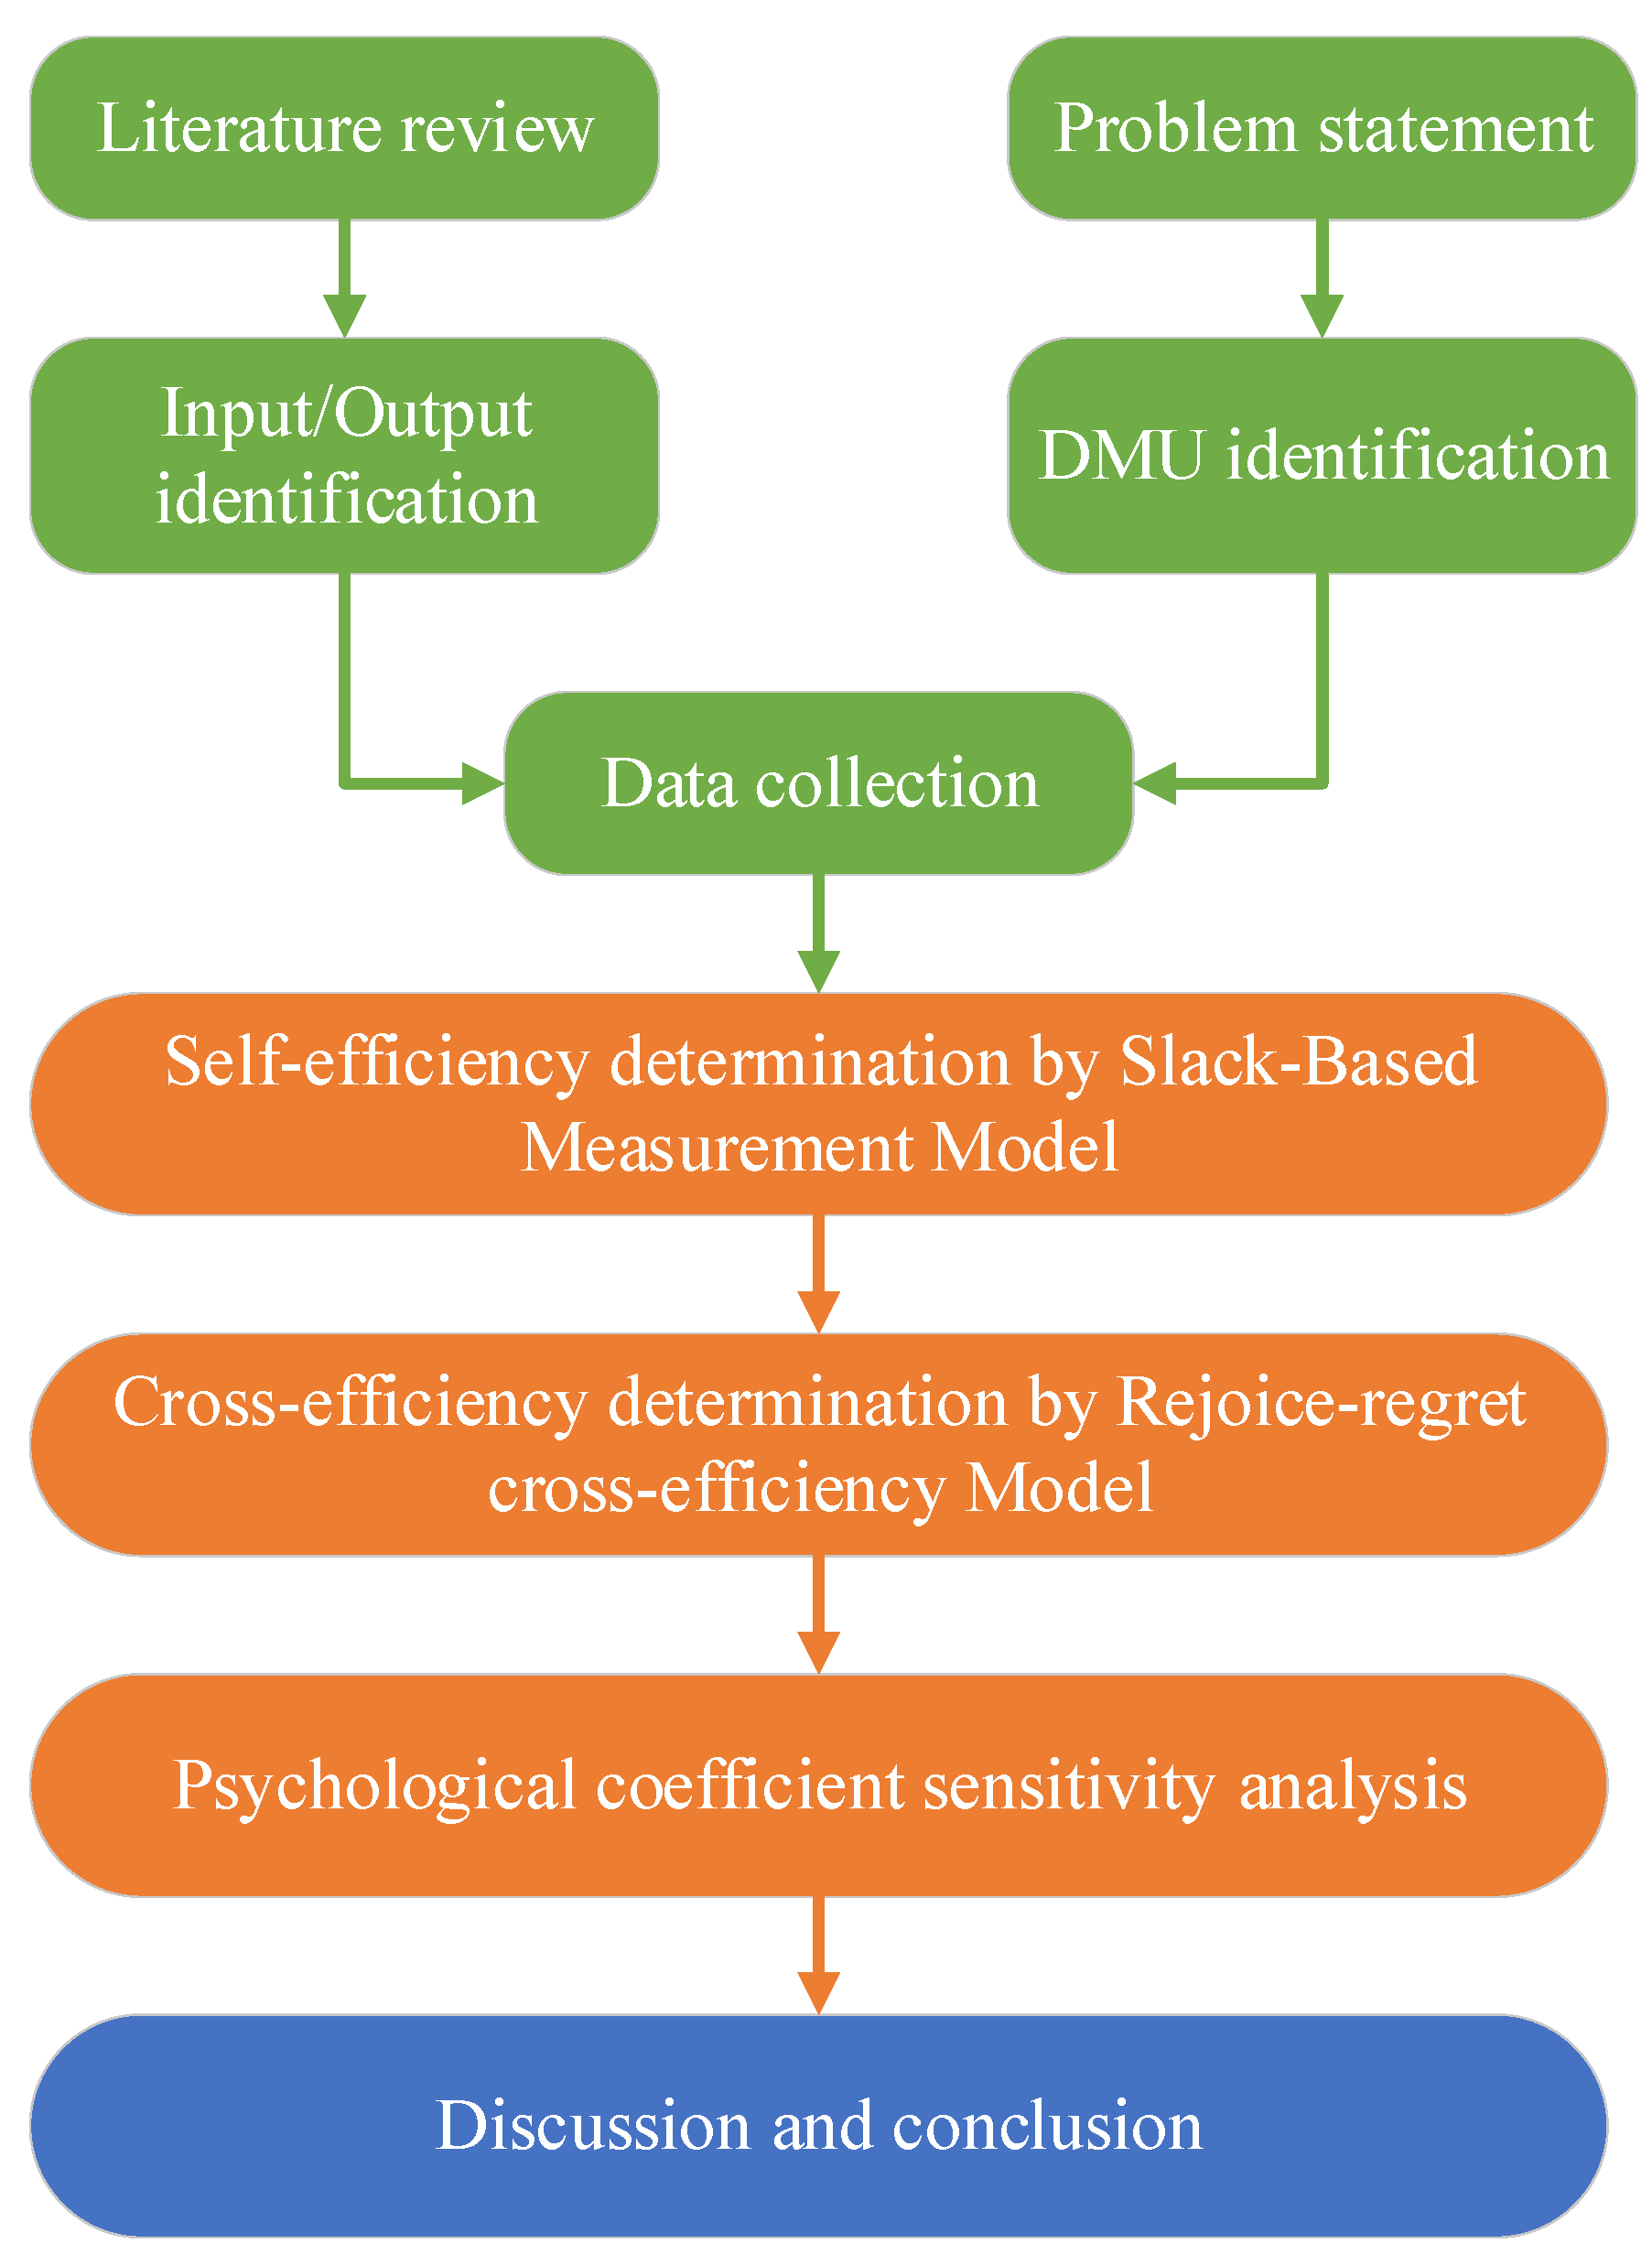
2.5. The Proposed Evaluation Framework

To perform the evaluations that apply the RRUCE DEA model, a framework is proposed and illustrated as shown in Figure 3. In the framework, the first steps are to define the research problem and review the relevant literature. Based on those processes, lists of DMUs, inputs, and outputs are defined. Then, the process of collecting data of the DMUs corresponding to the outputs and inputs is performed. In the next step, the self-efficiency of the DMUs is calculated by the SBM model in Equation (7). After the values of self-effectiveness are determined, the RRUCE DEA model in Equation (20) is applied to calculate the cross-effectiveness of DMUs under the influence of decision makers’ psychological behaviors. The psycho-behavioral coefficients in the RRUCE DEA model were then subjected to sensitivity analysis. Ultimately, the discussions and conclusions are constructed based on the computing results.

3. Results

Investing in renewable energy projects is seen as the main solution to the problem of sustainable development worldwide. However, each region and each country have their own policies and development conditions. This leads to differences in efficiency of RE investments across countries. The economies of South and Southeast Asia are among the fastest growing economies in the world, in which security and sustainable development of energy are important conditions to ensure stability in economic growth. Therefore, this study aims to evaluate the efficiency of RE investments in South and Southeast Asia by applying the proposed framework, which was mentioned in Section 2. According to the proposed framework, this study considers sixteen countries in South Asia (SA) and Southeast Asia (SEA), which are shown in Table 1, as DMUs of DEA models. Because RE investment data for Singapore and Brunei Darussalam were not found, this study cannot view these two countries as DMUs.
The choice of input and output indicators for evaluating RE investment efficiency has been guided by prior empirical studies applying DEA in the energy and sustainability contexts. As inputs, public flows to renewable energy (financial investment), energy intensity (efficiency of energy use), and transmission loss (infrastructure quality) have been widely used to capture the key cost and performance factors associated with energy systems. These indicators have been employed in prior DEA studies such as by Liu et al. (2023) [61], Moon and Min (2017) [62], and Zhang et al. (2022) [63], which assess technical and environmental efficiency in national energy sectors.
On the output side, commonly used performance indicators include renewable energy supply, consumption, electricity generation percentage, installed renewable capacity, and non-renewable emissions avoided—all of which reflect the effectiveness and impact of renewable energy investments. These indicators are consistent with studies such as Kim et al. (2015) [31], Mousavi-Avval et al. (2011) [64], and Wang at al. (2025) [65], which emphasize output-driven measures of sustainability in DEA applications. The selected indicators and their units are summarized in Table 2.
For inputs, this study considers the public flows to renewable energy (million 2020 USD), the energy intensity (MJ per 2017 USD PPP), and transmission loss (million kWh). The public flows to renewable energy represent the amount of financial support, investment, or funding provided by government agencies or public institutions to promote and develop renewable energy projects. Public flows to renewable energy are crucial for advancing the adoption of clean and sustainable energy sources such as wind, solar, hydroelectric, and geothermal power. These funds can be used for research and development, subsidies, grants, or direct investments in renewable energy infrastructure and technologies. Energy intensity is a measure of the energy efficiency of an economy or a specific process. The use of purchasing power parity-adjusted dollars accounts for differences in price levels between countries, allowing for a more accurate comparison of energy efficiency across different regions. Lower energy intensity indicates a more energy-efficient economy, meaning that less energy is needed to generate a given level of economic activity. The transmission loss is a measure of the electrical energy lost as it travels through power transmission and distribution systems. These losses occur due to factors such as resistance in power lines and transformers, which convert high-voltage electricity to lower-voltage electricity for distribution to homes and businesses. The losses are primarily in the form of heat and are an inherent part of the electricity distribution process. Reducing transmission losses is essential for improving the overall efficiency of an electrical grid and ensuring that a higher percentage of generated electricity reaches end-users with minimal waste. These measurements play a significant role in assessing and improving the sustainability and efficiency of energy systems, as well as tracking the financial support allocated to renewable energy initiatives.
For outputs, measurements related to energy sources and renewable electricity generated, as well as the number of emissions displaced, were selected as the outputs of DEA models in this study. Specifically, these outputs are the renewable energy supply (TJ), the renewable energy consumption (TJ), the renewable electricity generation (%), the installed renewable electricity capacity (MW), and the non-renewable emissions replaced (million tons CO2eq). Renewable energy supply refers to the total amount of energy generated from renewable sources during a specific period. RE sources include solar, wind, hydroelectric, geothermal, and biomass energy. This measurement provides an indication of the contribution of RE to the overall energy mix in a region or country. Renewable Energy Consumption represents the amount of energy derived from RE sources that is used or consumed within a specific timeframe. Renewable energy consumption considers not only the energy generated but also how much of it is utilized for various purposes such as electricity generation, heating, and transportation. Renewable electricity generation is a percentage that indicates the proportion of electricity generated from RE sources compared to the total electricity generated in a specific region or country. This measurement is a key indicator of a region’s progress toward sustainable and clean energy production. Installed renewable electricity capacity refers to the total maximum electrical power output that can be generated by renewable energy sources. This capacity includes all the renewable energy infrastructure, such as solar panels, wind turbines, hydropower plants, and geothermal facilities, that have been installed and are operational. Non-renewable emissions replaced represent the reduction in greenhouse gas emissions, typically measured in millions of tons of carbon dioxide equivalent (CO2eq), achieved by replacing non-RE sources (e.g., fossil fuels) with RE sources. This measurement quantifies the environmental benefits of transitioning to cleaner energy sources and is often used to highlight the positive impact of RE adoption on reducing carbon emissions and mitigating climate change.
Data for countries corresponding to inputs and outputs are collected from open data sources of non-governmental organizations such as the International Renewable Energy Agency (IRENA) [9,66], the International Energy Agency (IEA) [15,16], Central Intelligence Agency (CIA) [67], ASIAN development bank (ADB) [68], and ASEAN Centre for Energy (ACE) [69]. The evaluation data are summarized in Table 3 below.

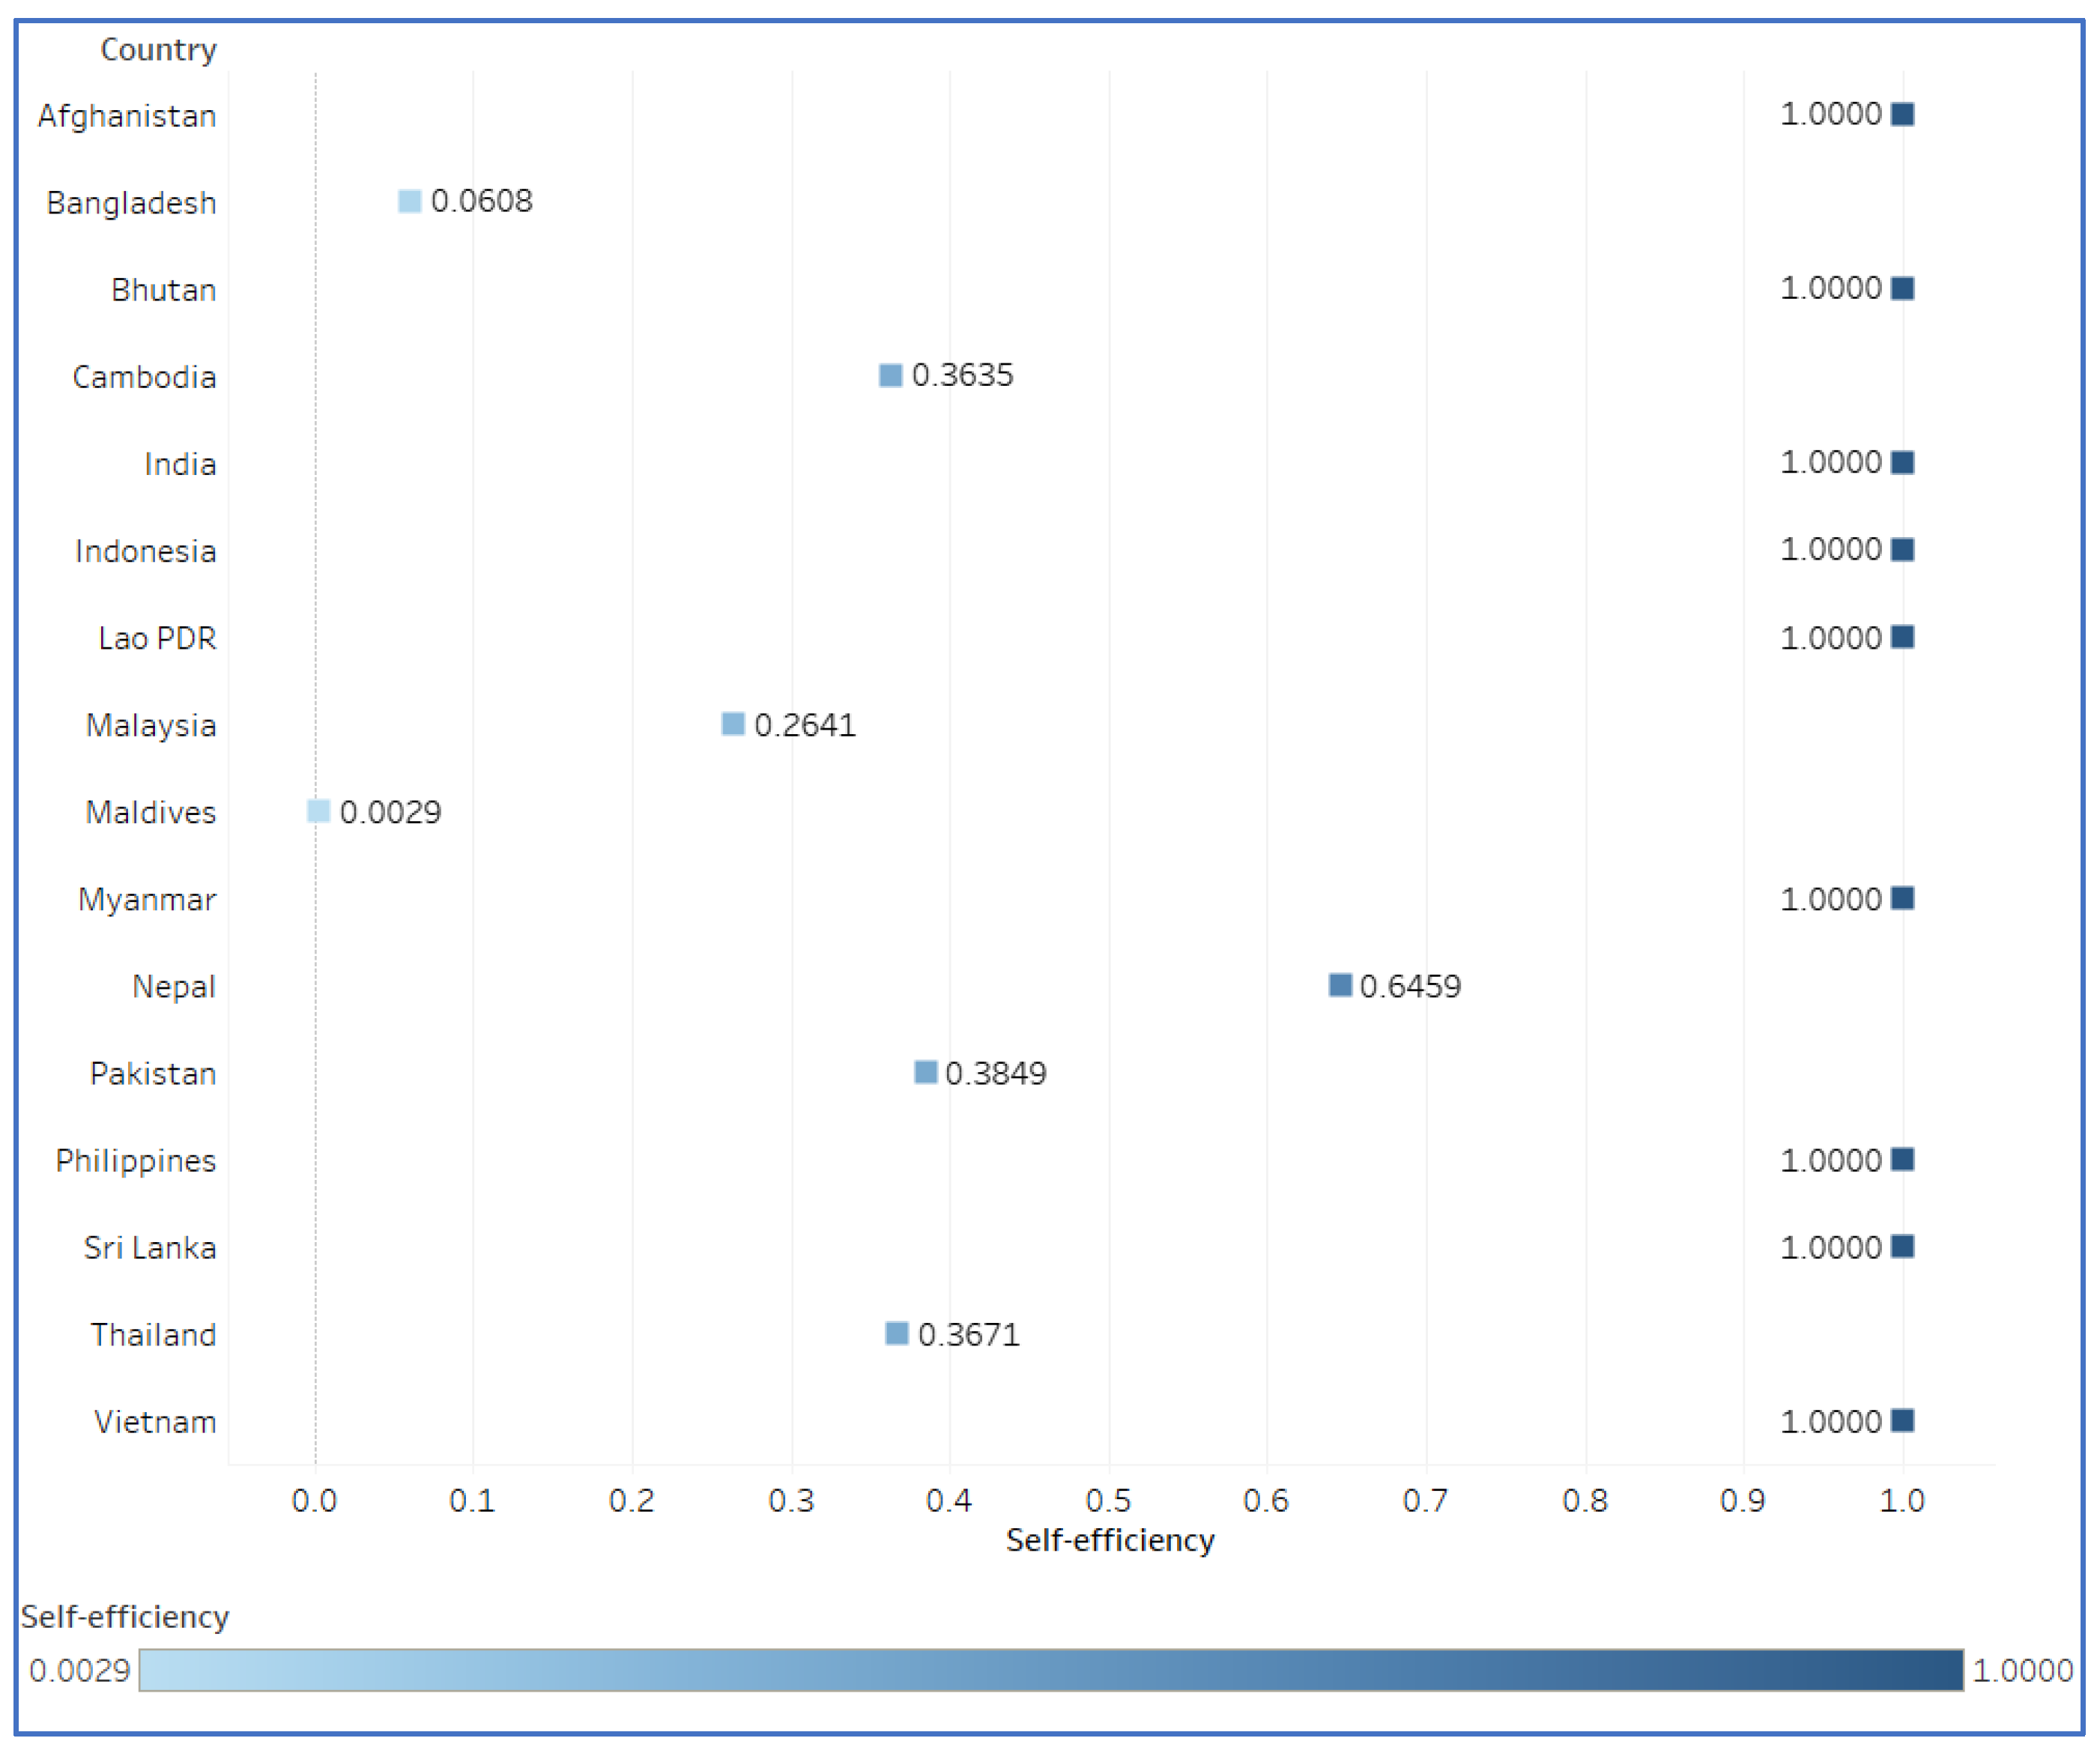
3.1. Self-Efficiency Determination by SBM Model

To be able to apply the RRCUE model, the self-efficiency of the DMUs needs to be determined. So, in this section, the SBM model in Equation (8) is solved to determine the self-efficiency values as presented in Figure 4.
Among the highlighted nations, several, including Afghanistan, Bhutan, Indonesia, Myanmar, Lao PDR, the Philippines, India, Sri Lanka, and Vietnam, exhibit exemplary self-efficiency scores of 1, signifying optimal resource utilization in their renewable energy investments. These countries have effectively balanced inputs and outputs, ensuring that their efforts yield maximum returns in terms of renewable energy generation and sustainability. In contrast, countries like Bangladesh, Malaysia, the Maldives, Pakistan, and Thailand display varying degrees of lower self-efficiency, indicating potential opportunities for enhancing their resource allocation strategies for renewable energy projects. Thus, in this step, two groups are identified as efficient and non-efficient groups. However, to determine the specific rankings under the influence of psychological behavioral factors, the rejoice–regret cross-efficiency of the countries is calculated in the following section.

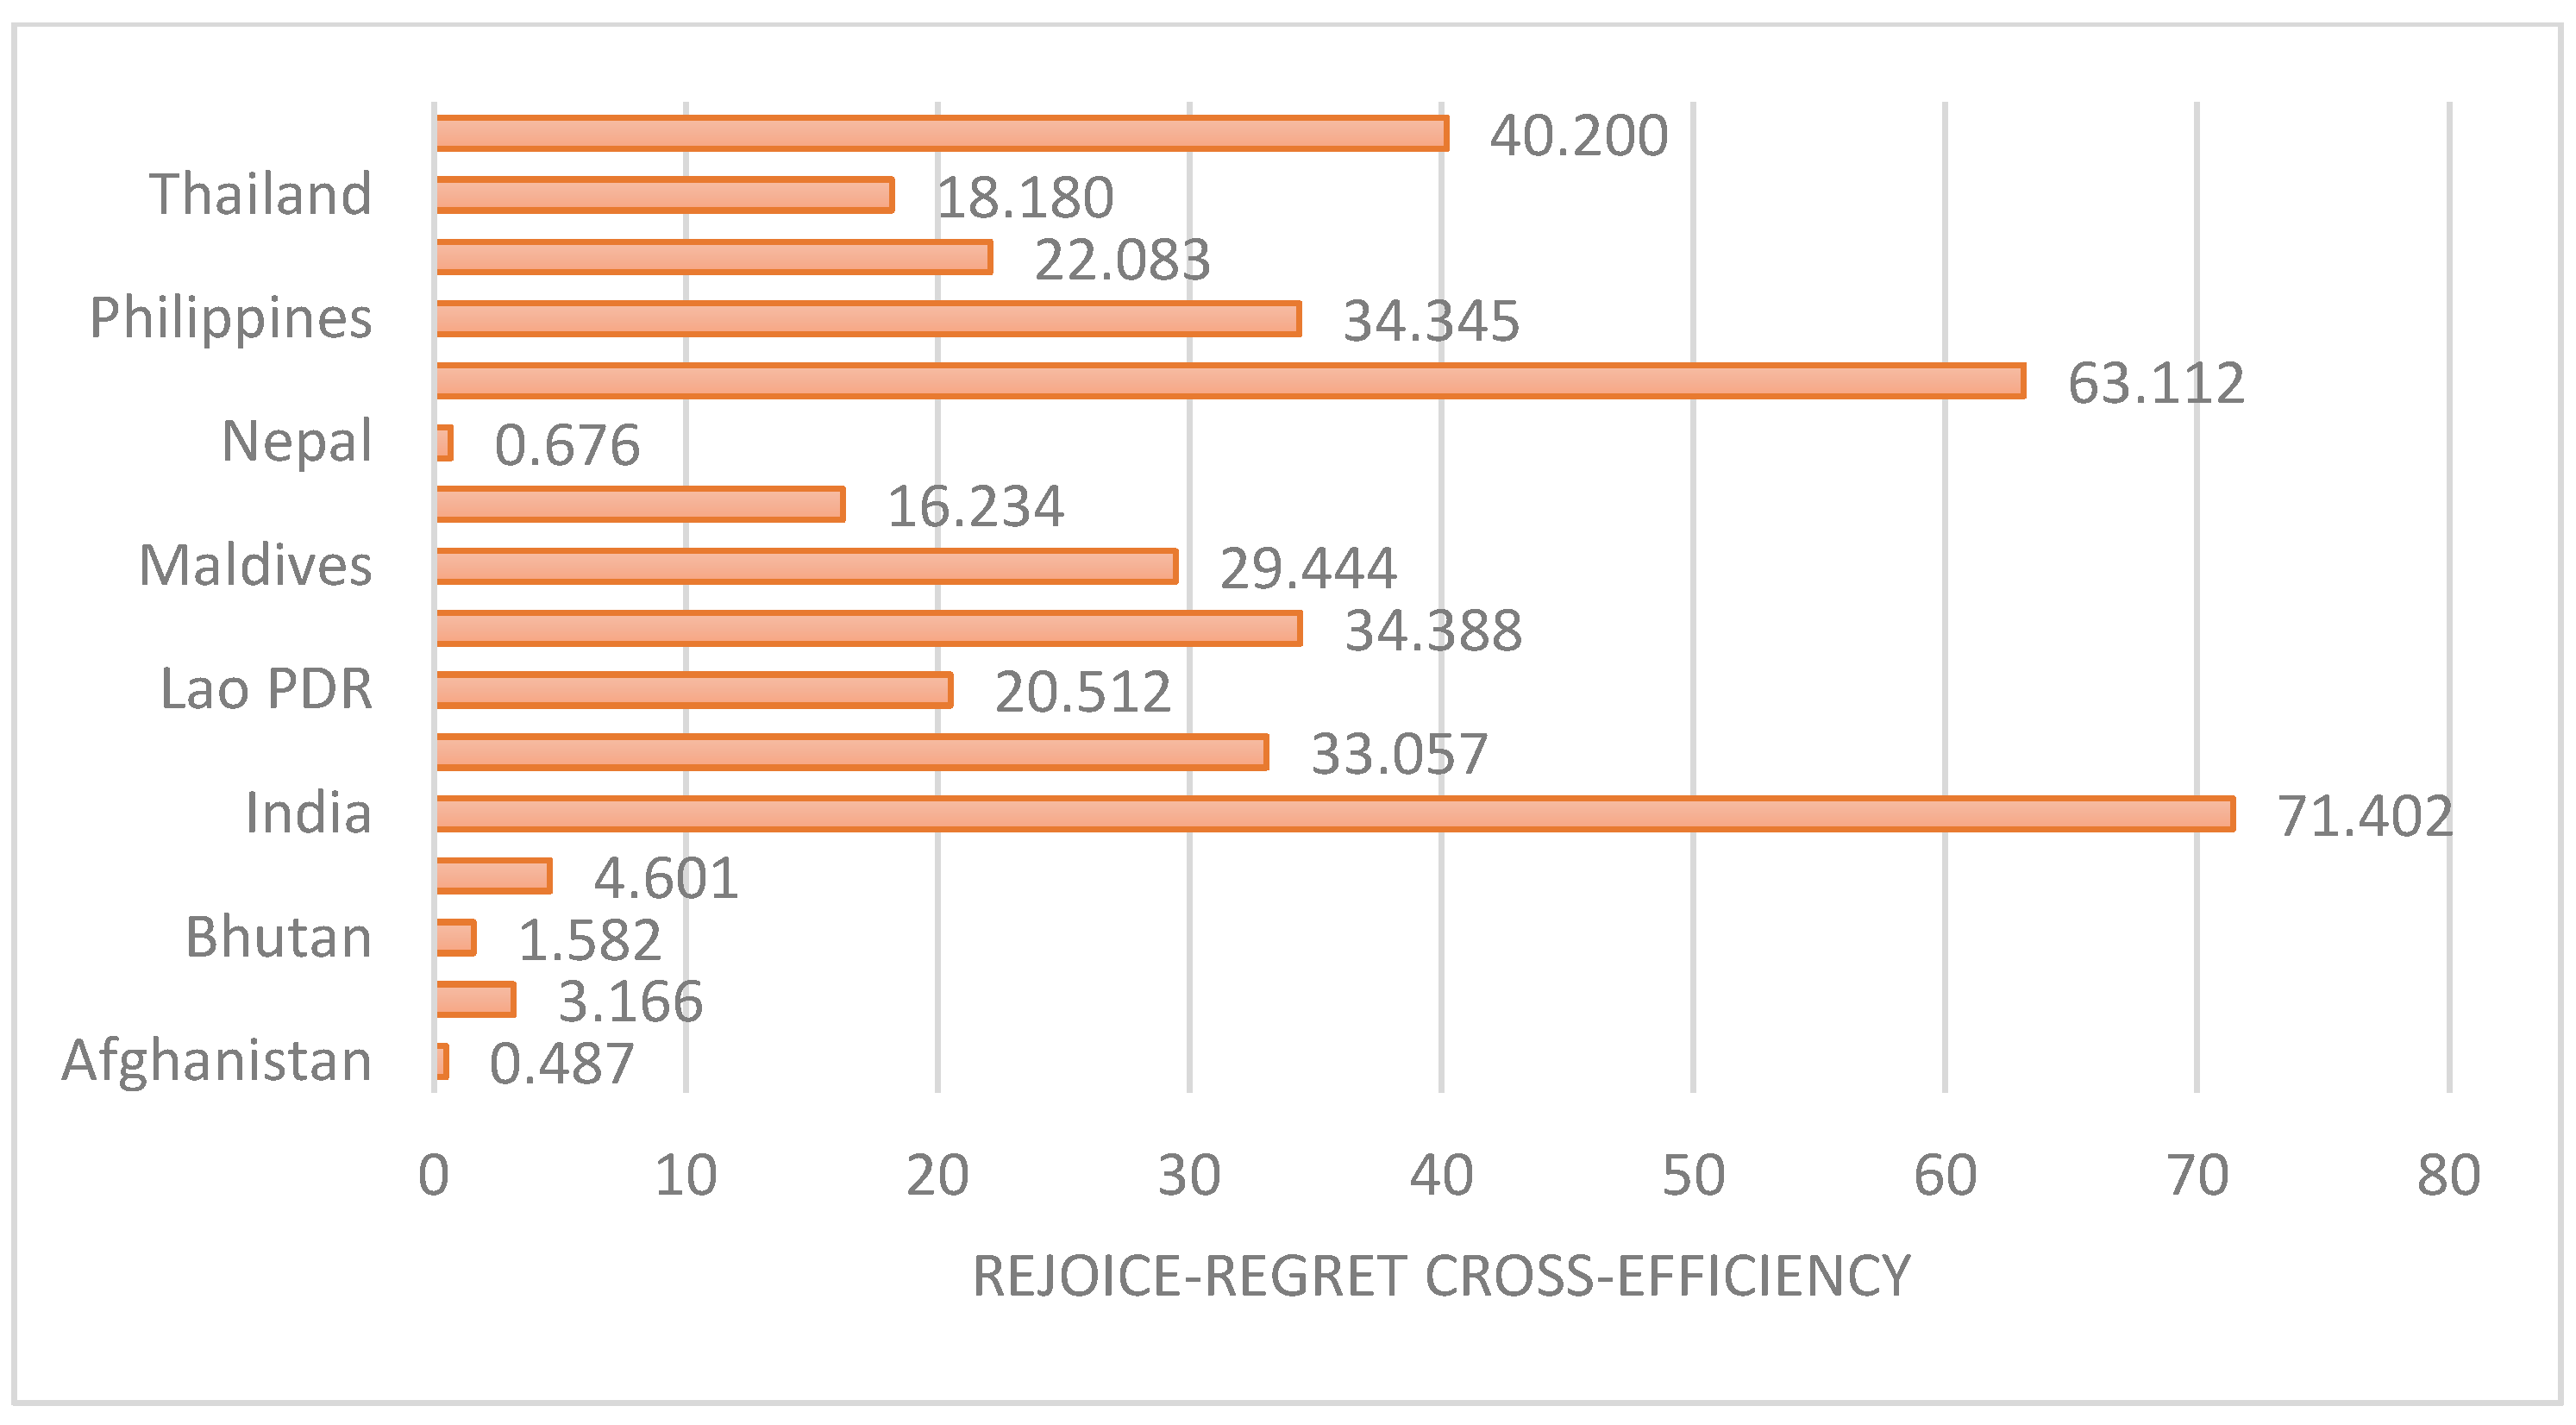
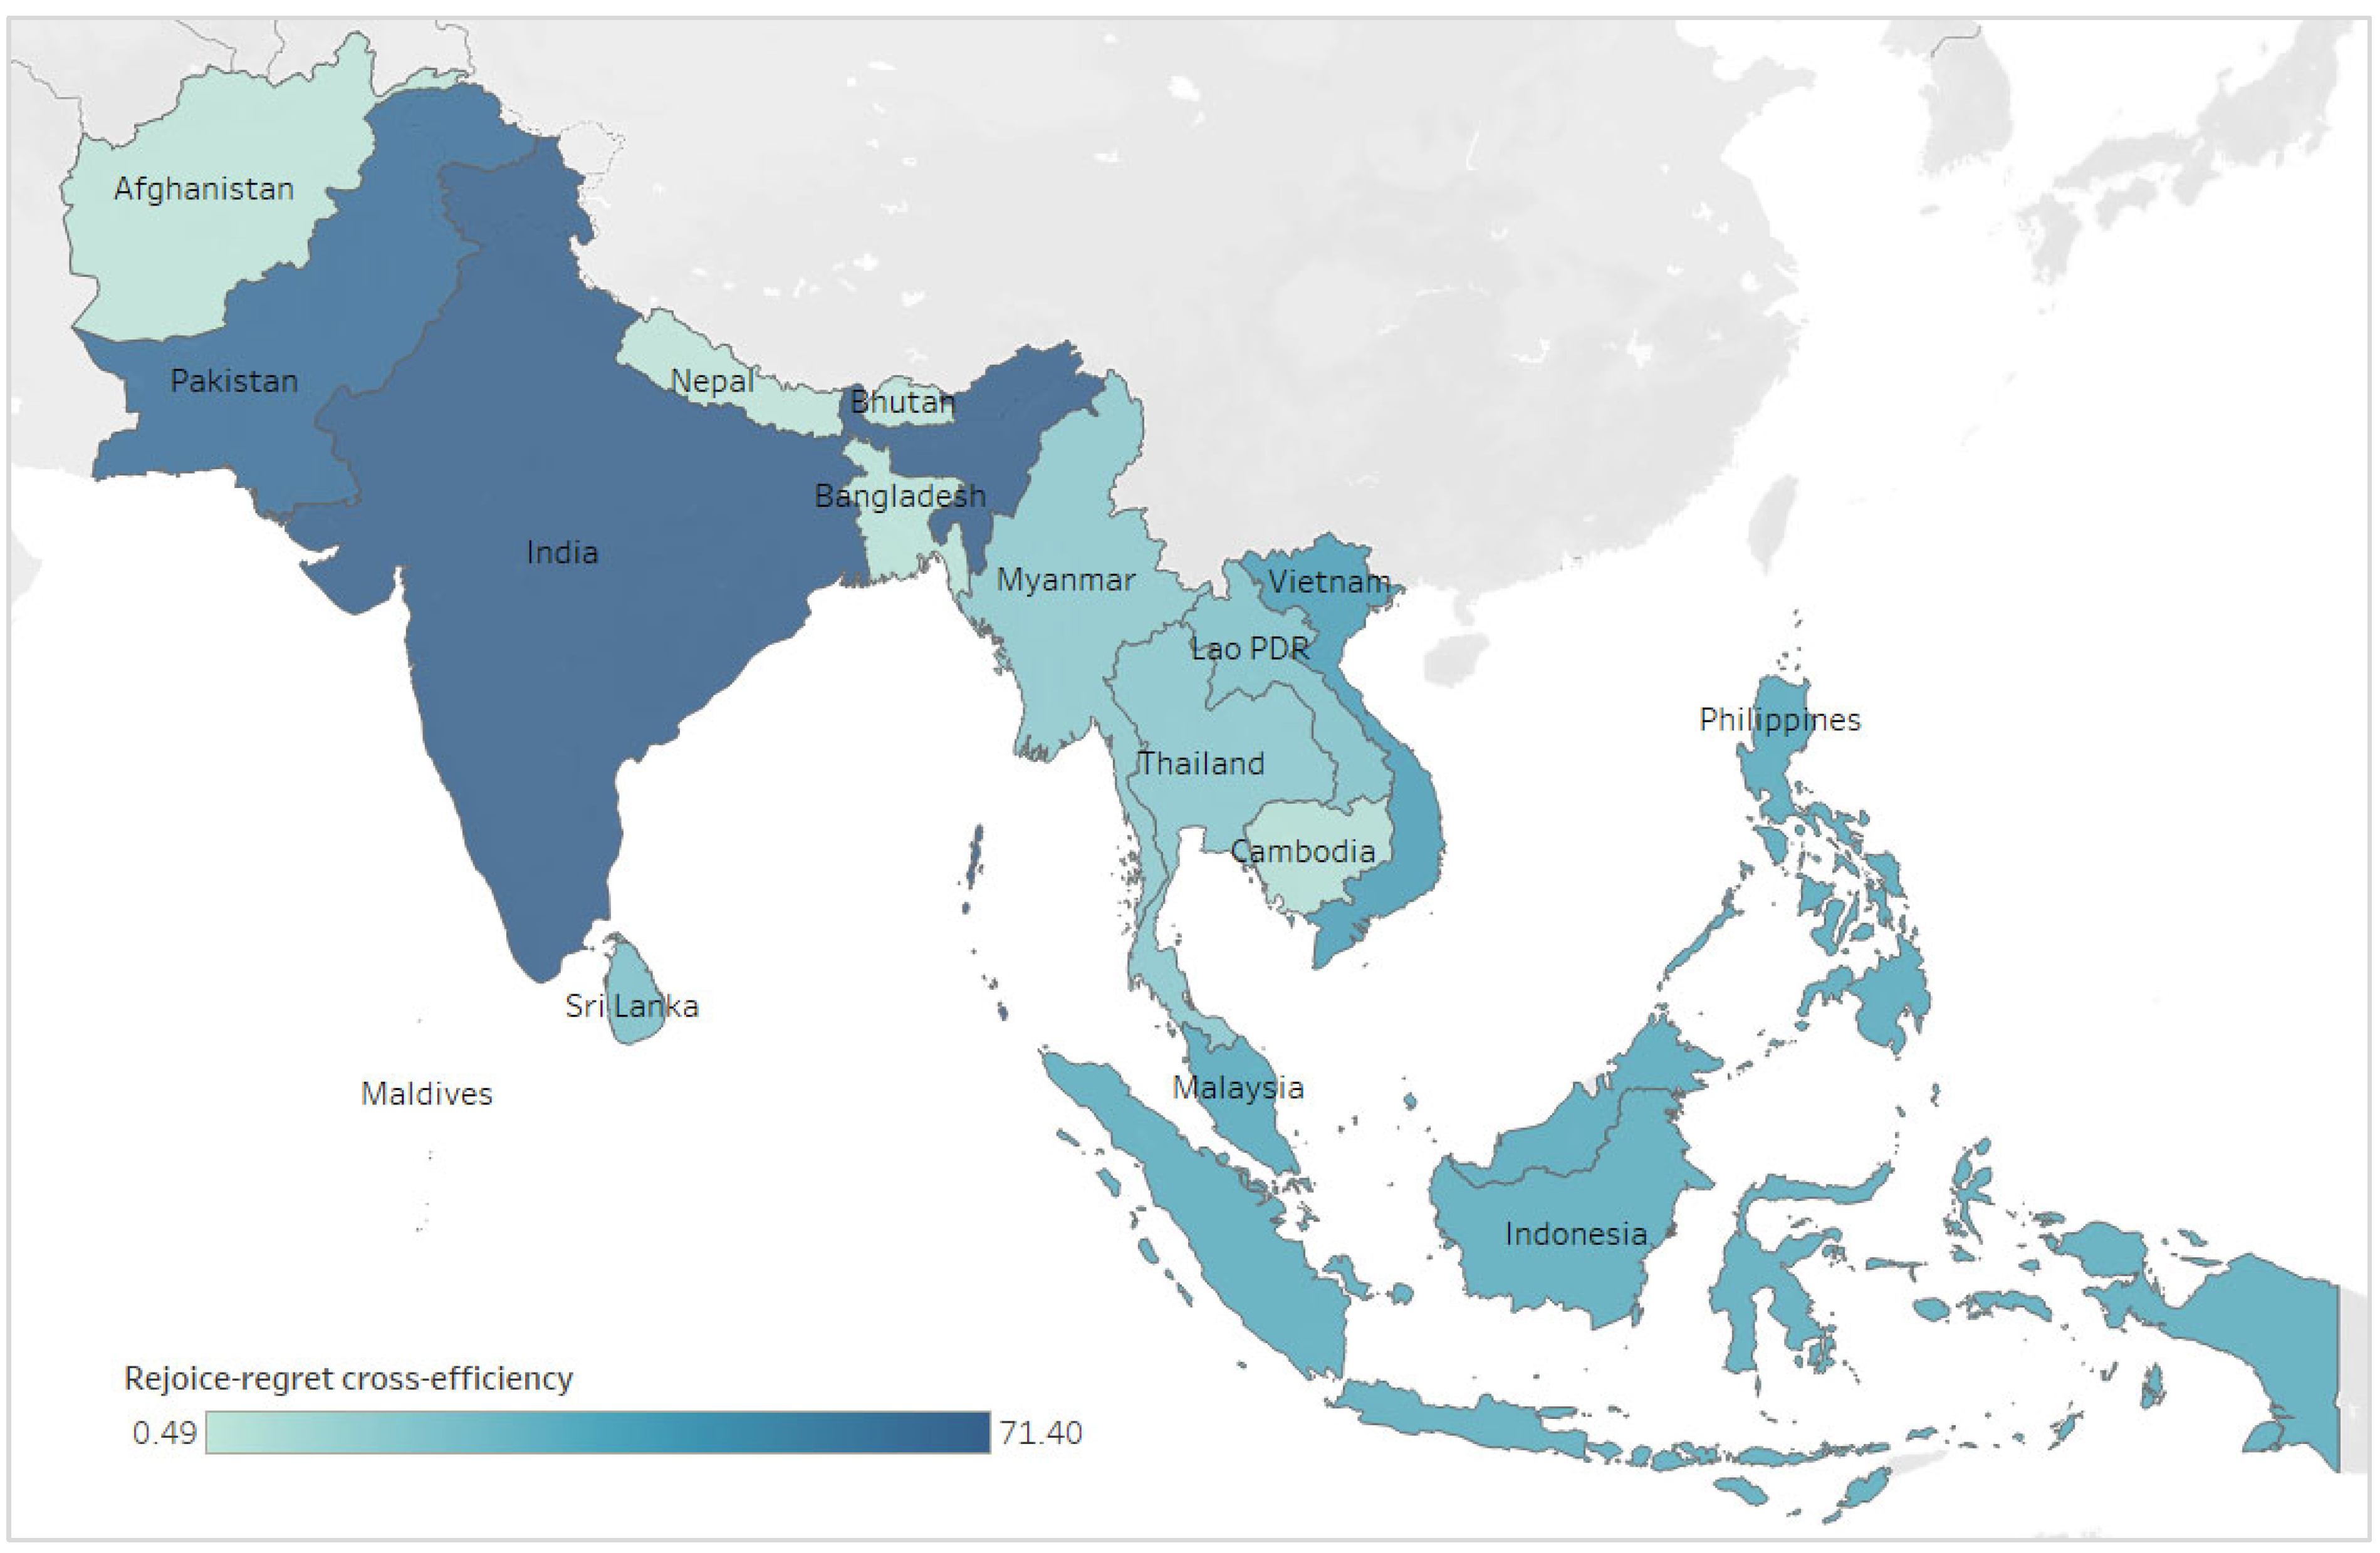
3.2. Rejoice–Regret Cross-Efficiency Determination by RRUCE Model

Based on the self-efficiency obtained, in this section, the rejoice–regret cross-efficiency values of countries are calculated by the RRUCE model. To solve this problem, the RRUCE model in Equation (20) is programmed in the environment of Lingo 11 solver. When the RRUCE model reaches the optimal objective function, the optimal weight ( v j k * and u i k * ) matrices, under the general regret aversion coefficient ( λ = 0.3 ) and equally rejoice–regret coefficient ( φ = 0.5 ) , are constructed as shown in Table 4. According to Equation (9), the rejoice–regret cross-efficiency matrix is constructed as shown in Table 5.
Ultimately, the rejoice–regret cross-efficiency of k t h DMU can be calculated according to Equation (10). Figure 5 presents the results with λ = 0.3 and φ = 0.5 . The results for renewable energy investment efficiency in South and Southeast Asian countries paint a fascinating picture of how efficiently these nations are harnessing their resources to drive sustainable energy development. As shown in Figure 6, India stands out prominently with the highest cross-efficiency score, emphasizing its remarkable ability to allocate resources efficiently for renewable energy investments. This top-ranking performance highlights India’s pivotal role as a regional leader in the pursuit of sustainable energy sources. Pakistan, closely following India, also distinguishes itself with a strong cross-efficiency score, underlining its commitment to sustainable energy development. Pakistan’s notable performance reinforces its position as one of the top-performing countries in the region in terms of RE investment efficiency. Indonesia’s presence in the top tier further underscores its significance in the regional renewable energy landscape. Its third-place ranking reflects a commitment to optimizing resource allocation for renewable energy projects and contributes to the broader sustainability efforts in the region.
The Philippines, Malaysia, and Vietnam, with cross-efficiency scores in the mid-range, showcase commendable efforts in renewable energy investment efficiency. While they may not lead the pack, they exhibit an effective allocation of resources and commitment to clean energy transitions. Sri Lanka and Thailand, with moderate cross-efficiency scores, signify their ongoing efforts to enhance renewable energy investment efficiency. These countries are well positioned to improve their strategies and further contribute to sustainable energy development. However, it is important to acknowledge the challenges faced by some countries in the region. Cambodia, Myanmar, and Afghanistan, with relatively low cross-efficiency scores, clearly have room for substantial improvements in their approaches to renewable energy investments. Addressing these challenges will be crucial for their sustainable energy transitions and achieving environmental goals. These cross-efficiency results serve as a valuable benchmark for policymakers and stakeholders in South and Southeast Asia. By learning from the successes of top-performing nations and addressing identified challenges, all countries in the region can make informed decisions to accelerate their transition to cleaner and more sustainable energy systems. This collective effort not only enhances energy security and environmental sustainability locally but also contributes significantly to global endeavors to combat climate change.

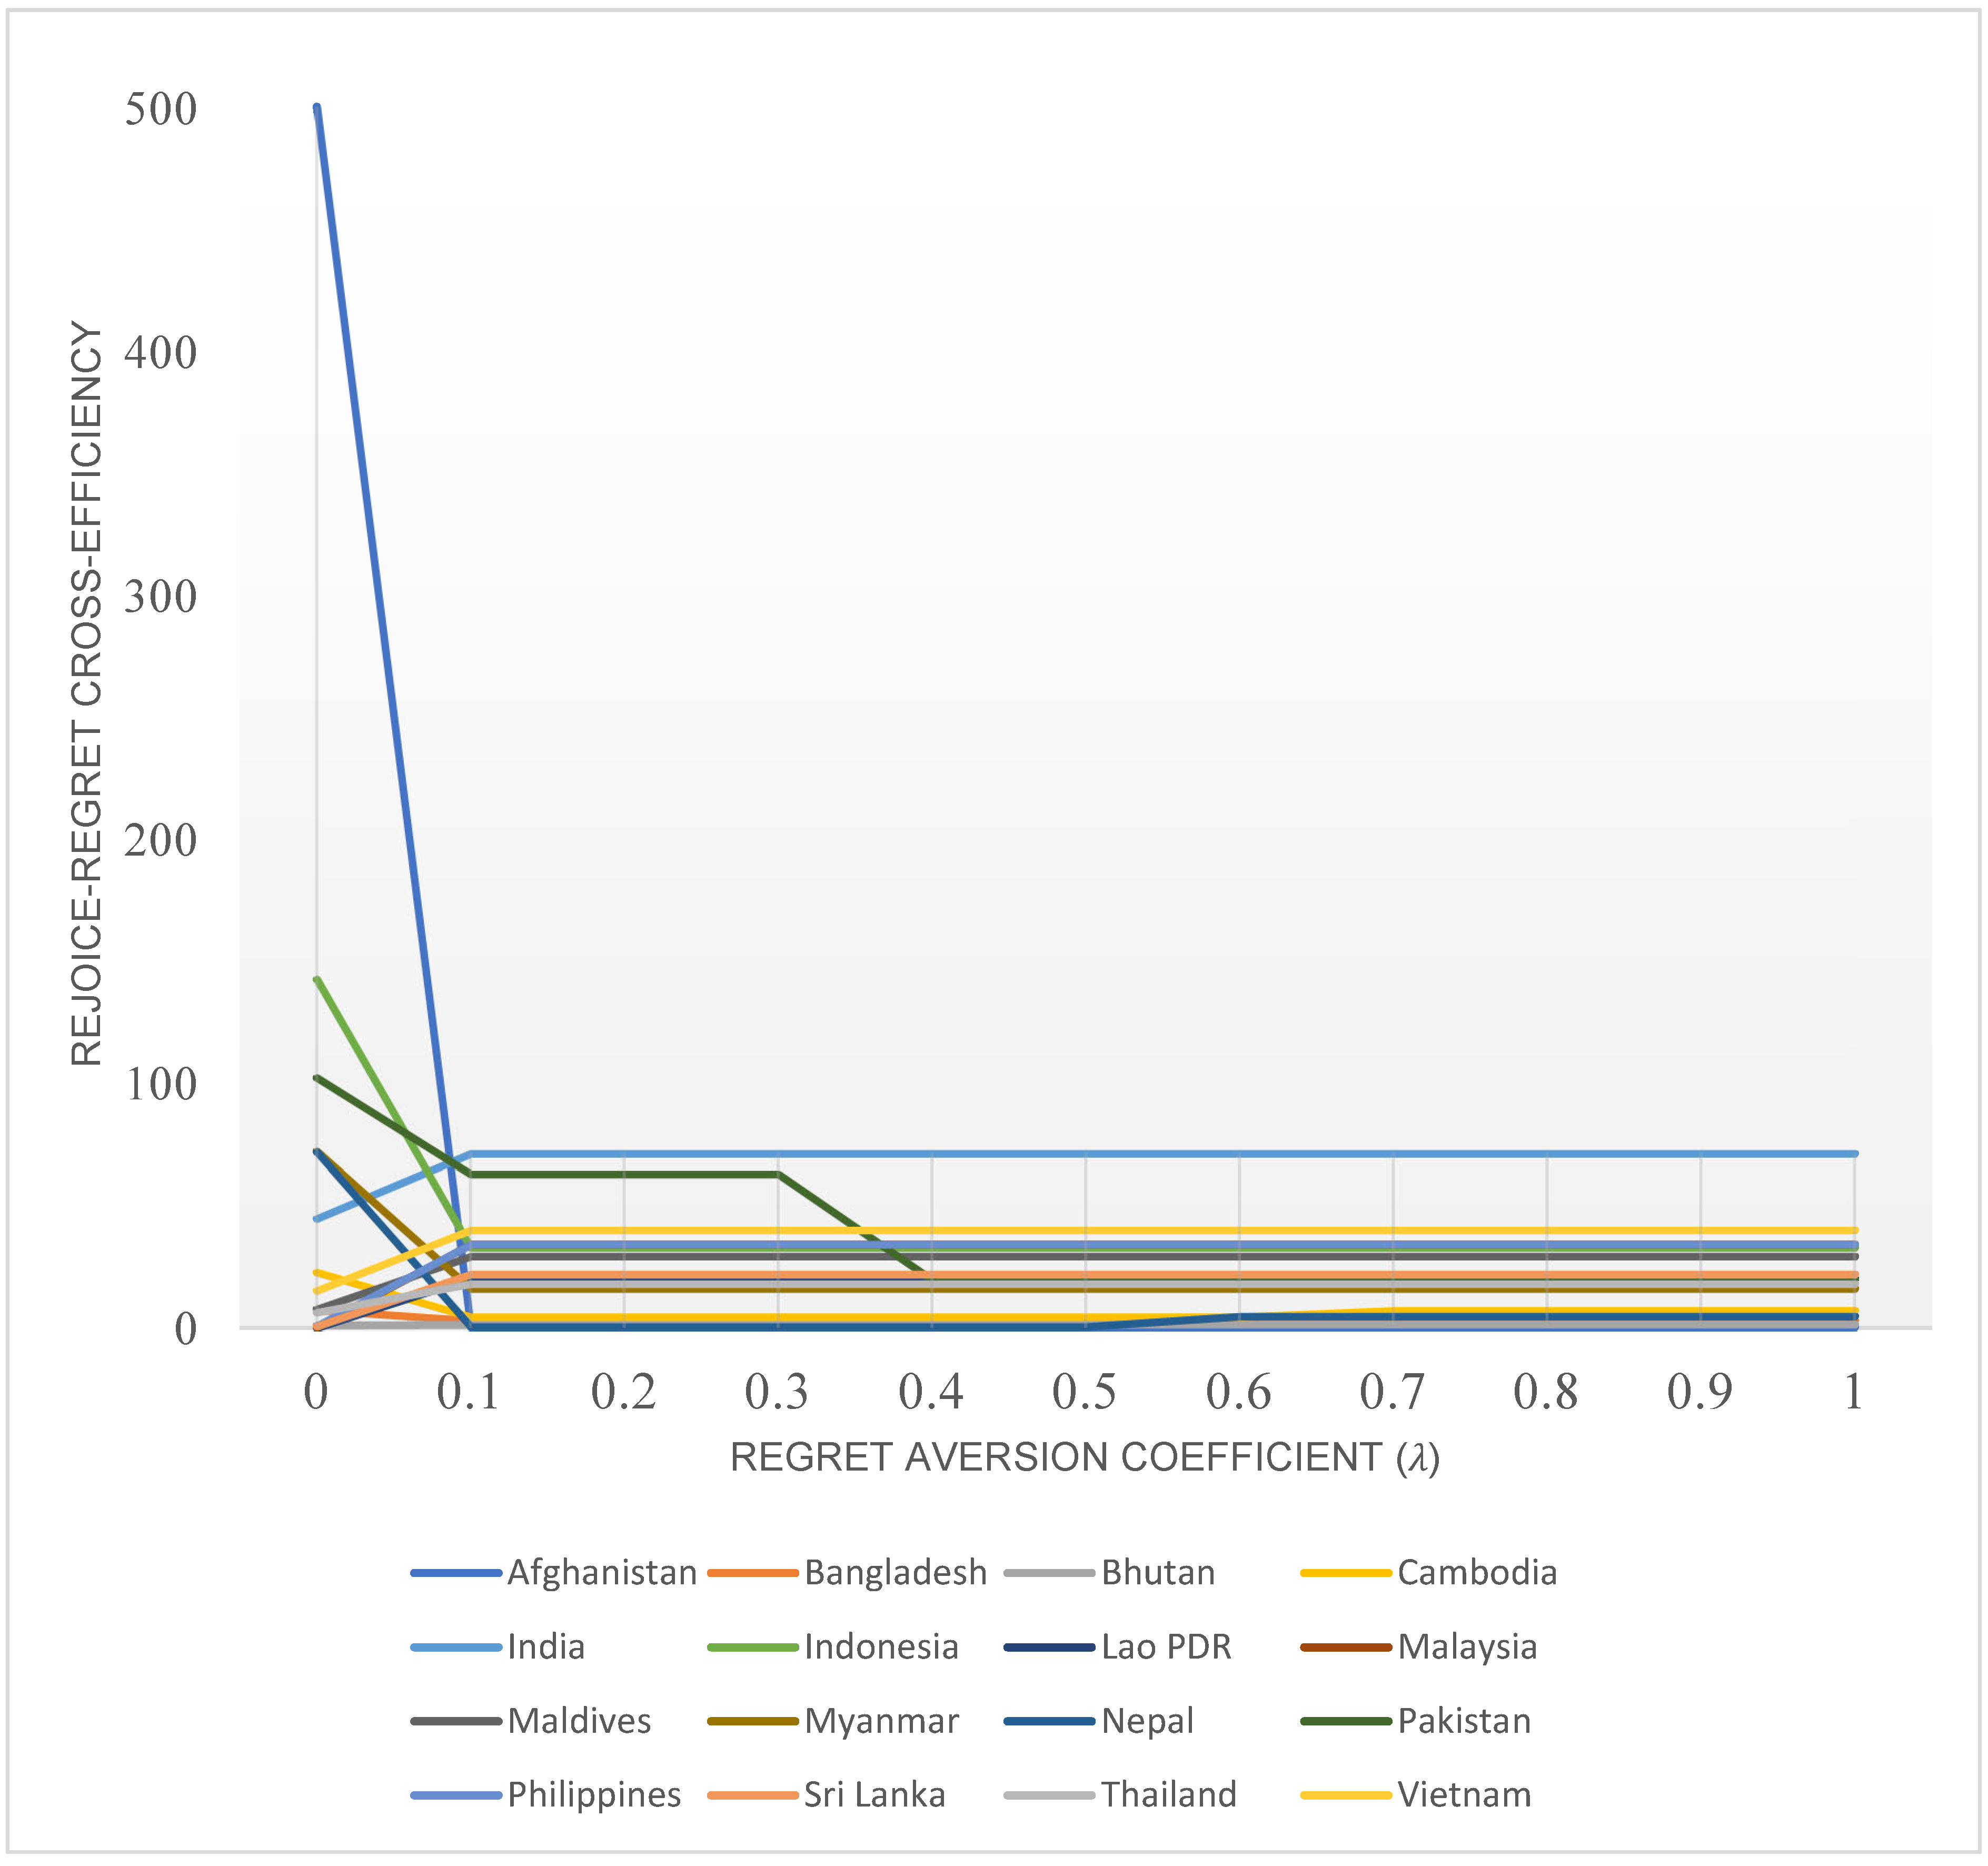
3.3. Sensitivity Analysis

The objective of this section is to clarify how psychological behavioral coefficients impact the results of cross-efficiency assessment in the RRUCE DEA model. For this purpose, the RRUCE model will be solved iteratively for different values of regret aversion coefficient ( λ ) and equally rejoice–regret coefficient ( φ ) . Firstly, with φ = 0.5 , the rejoice–regret cross-efficiency is calculated with different values of λ . As illustrated in Figure 7, the results show that the regret aversion coefficient has almost no significant impact on rejoice–regret cross-efficiency except when it reaches a value of 0. In other words, only when the decision maker has absolutely no regrets in the decision-making process will the evaluation results of the RRUCE model exist with significant differences. This demonstrates the ability of the RRUCE DEA model to reflect whether or not the decision maker is regret-averse.
On the other hand, with λ =0, the results show that cross-efficiency fluctuates significantly when φ ≥ 0.5, as shown in Figure 8. In other words, the RRUCE model will support very different decisions if the decision maker is increasingly concerned with regret losses rather than with rejoice gains. Through sensitivity analysis of the decision maker’s psychological behavior coefficients, the proposed RRUCE DEA model is capable of effectively reflecting the decision maker’s obsession with regret losses.

4. Managerial Implementation

The findings of this study offer practical guidance for improving RE investment efficiency, particularly in countries with lower performance such as Cambodia, Myanmar, and Afghanistan. For these nations, targeted policy interventions are essential. Governments should prioritize the development of stable and transparent regulatory frameworks to reduce investment risks and attract capital. Institutional reforms that streamline permits, guarantee grid access, and introduce performance-based incentives—such as feed-in tariffs or competitive auctions—can enhance the attractiveness of RE markets. In addition, public sector leadership should be strengthened through increased investment in energy infrastructure and the use of blended finance or public–private partnerships, as seen in successful cases like India and Vietnam. Beyond national strategies, regional collaboration offers significant potential. Countries with strong performance can contribute through structured knowledge-sharing programs, South–South cooperation initiatives, and technical assistance platforms coordinated by ASEAN or SAARC. Establishing twinning partnerships between high- and low-efficiency countries may facilitate targeted support in areas such as regulatory design, grid management, and financing mechanisms. Moreover, human capital development should be prioritized by investing in technical training, vocational education, and institutional capacity building. Finally, improved data transparency and energy monitoring systems will be critical for informed planning and continuous performance evaluation. Collectively, these strategies not only support national RE targets but also contribute to a more integrated and sustainable regional energy transition.

5. Conclusions

This study applied the rejoice–regret utility cross-efficiency DEA (RRUCE-DEA) model to evaluate the behavioral-adjusted efficiency of renewable energy (RE) investments in 16 South and Southeast Asian countries. By integrating the traditional DEA framework with regret theory, the analysis captured both technical efficiency and the psychological preferences of decision makers. A structured evaluation process was followed, from data acquisition and technical efficiency assessment using the slack-based measure (SBM) model to behavioral cross-efficiency analysis and sensitivity testing based on varying regret and rejoice preferences.
As a theoretical contribution, this study demonstrates how the RRUCE-DEA model can be applied to energy investment analysis by incorporating behavioral dimensions. It does not introduce a new model per se but rather adapts an existing behavioral DEA approach to the context of renewable energy evaluation. Practically, this study offers a decision-support tool for policymakers by highlighting both the performance and behavioral vulnerabilities in investment decisions. This study also contributes empirically by benchmarking a relatively large set of countries using eight carefully selected indicators, which reflect both financial input and environmental output dimensions of RE development.
The analysis revealed that India, Pakistan, and Indonesia ranked highest in behavioral efficiency, suggesting strong alignment between investment and performance. Conversely, countries like Cambodia, Myanmar, and Afghanistan exhibited lower cross-efficiency scores. For these countries, policy recommendations include the adoption of more transparent regulatory frameworks, investment in transmission infrastructure, and targeted regional knowledge transfer programs. Mid-performing countries such as the Philippines, Malaysia, and Vietnam are encouraged to refine their energy investment strategies by addressing remaining inefficiencies and enhancing grid integration capabilities.
Nonetheless, several limitations must be acknowledged. First, the selection of the psychological parameters λ (regret aversion) and φ (rejoice–regret balance) may involve subjectivity, although literature-informed values were used. Future research could address this by conducting empirical surveys or scenario testing to better calibrate these coefficients. Second, while the study includes eight quantitative indicators, it does not explicitly account for country-specific differences in energy mix structures, consumer demand profiles, or availability of domestic fuel resources, all of which may influence the investment environment and the technical feasibility of RE deployment. These factors should be considered in future extensions, potentially through hybrid modeling or sector-specific adjustments. Third, while a cross-sectional design was adopted, longitudinal analysis would provide a more dynamic view of evolving investment efficiency and behavioral shifts over time.

Author Contributions

Conceptualization, Y.-C.Y. and C.-N.W.; methodology, N.-L.N.; validation, Y.-C.Y. and C.-N.W.; formal analysis, N.-L.N.; investigation, N.-L.N.; data curation, Y.-C.Y.; writing—original draft preparation, Y.-C.Y. and N.-L.N.; writing—review and editing, N.-L.N.; visualization, N.-L.N.; supervision, C.-N.W.; project administration, C.-N.W.; funding acquisition, C.-N.W. All authors have read and agreed to the published version of the manuscript.

Funding

This article is partially supported by the project of NSTC 113-2622-E-992-012.

Institutional Review Board Statement

Not applicable.

Informed Consent Statement

Not applicable.

Data Availability Statement

All data are presented in the article.

Conflicts of Interest

The authors declare no conflicts of interest.

References

  1. Chiaramonti, D.; Maniatis, K. Security of supply, strategic storage and Covid19: Which lessons learnt for renewable and recycled carbon fuels, and their future role in decarbonizing transport? Appl. Energy 2020, 271, 115216. [Google Scholar] [CrossRef]
  2. Hwangbo, S.; Heo, S.; Yoo, C. Development of deterministic-stochastic model to integrate variable renewable energy-driven electricity and large-scale utility networks: Towards decarbonization petrochemical industry. Energy 2022, 238, 122006. [Google Scholar] [CrossRef]
  3. Rathore, N.S.; Panwar, N.L. Renewable Energy Sources for Sustainable Development; New India Publishing: New Delhi, India, 2007. [Google Scholar]
  4. Ilbahar, E.; Kahraman, C.; Cebi, S. Risk assessment of renewable energy investments: A modified failure mode and effect analysis based on prospect theory and intuitionistic fuzzy AHP. Energy 2022, 239, 121907. [Google Scholar] [CrossRef]
  5. Curtin, J.; McInerney, C.; Gallachóir, B.Ó.; Hickey, C.; Deane, P.; Deeney, P. Quantifying stranding risk for fossil fuel assets and implications for renewable energy investment: A review of the literature. Renew. Sustain. Energy Rev. 2019, 116, 109402. [Google Scholar] [CrossRef]
  6. Konoplyanik, A.A. Challenges and potential solutions for Russia during global gas transformation and “Green Revolution”. Energy Policy 2022, 164, 112870. [Google Scholar] [CrossRef]
  7. Kumari, P.; Shankar, A.; Alghafes, R.; Broccardo, L.; Walsh, S.T. Exploring the Interrelationship Between Energy, Geopolitical Risk, and Bitcoin Based Green Business Strategies. Bus. Strategy Environ. 2025; early access. [Google Scholar] [CrossRef]
  8. Jankauskas, V.; Rudzkis, P.; Kanopka, A. Risk factors for stakeholders in renewable energy investments. Energetika 2014, 60, 113–124. [Google Scholar] [CrossRef]
  9. IRENA. Renewable Energy Statistics; International Renewable Energy Agency (IRENA): Abu Dhabi, United Arab Emirates, 2024. [Google Scholar]
  10. Sindhu, S.; Nehra, V.; Luthra, S. Investigation of feasibility study of solar farms deployment using hybrid AHP-TOPSIS analysis: Case study of India. Renew. Sustain. Energy Rev. 2017, 73, 496–511. [Google Scholar] [CrossRef]
  11. Paul, S.K.; Chowdhury, P.; Moktadir, M.A.; Lau, K.H. Supply chain recovery challenges in the wake of COVID-19 pandemic. J Bus. Res. 2021, 136, 316–329. [Google Scholar] [CrossRef]
  12. Georgieva, K. Global Challenges Facing ASEAN and Policy Priorities. International Monetary Fund. Available online: https://www.imf.org/en/News/Articles/2022/11/13/sp111322-md-global-challenges-facing-asean-and-policy-priorities (accessed on 2 February 2023).
  13. ACE. ASEAN Energy Investment 2024; ASEAN Centre of Energy (ACE): Jakarta, Indonesia, 2024. [Google Scholar]
  14. ACE; IRENA. Renewable Energy Outlook for Asean: A Remap; International Renewable Energy Agency (IRENA): Abu Dhabi, United Arab Emirates; ASEAN Centre for Energy (ACE): Jakarta, Indonesia, 2016. [Google Scholar]
  15. IEA. Energy Statistics Data; International Energy Agency (IEA): Paris, France, 2022. [Google Scholar]
  16. IEA. World Energy Investment 2022; International Energy Agency (IEA): Paris, France, 2022. [Google Scholar]
  17. UNTCAD. ASEAN Investment Report 2022: Pandemic Recovery and Investment Facilitation; United Nations Conference on Trade and Development (UNCTAD): Geneva, Switzerland, 2022. [Google Scholar]
  18. Tian, J.; Yu, L.; Xue, R.; Zhuang, S.; Shan, Y. Global low-carbon energy transition in the post-COVID-19 era. Appl. Energy 2022, 307, 118205. [Google Scholar] [CrossRef]
  19. Gunny, A.A.N.; Shahimin, M.F.M.; Mohamed, A.R.; Jalil, M.F.A. Current Status of Renewable Energy Development. In Renewable Energy from Bio-Resources in Malaysia; Springer: Singapore, 2022; pp. 1–19. [Google Scholar]
  20. Zhong, J.; Hu, X.; Yuksel, S.; Dincer, H.; Ubay, G.G. Analyzing the Investments Strategies for Renewable Energies Based on Multi-Criteria Decision Model. IEEE Access 2020, 8, 118818–118840. [Google Scholar] [CrossRef]
  21. Hoang, A.T.; Sandro, N.; Olcer, A.I.; Ong, H.C.; Chen, W.H.; Chong, C.T.; Thomas, S.; Bandh, S.A.; Nguyen, X.P. Impacts of COVID-19 pandemic on the global energy system and the shift progress to renewable energy: Opportunities, challenges, and policy implications. Energy Policy 2021, 154, 112322. [Google Scholar] [CrossRef] [PubMed]
  22. Owen, A.D. Renewable energy: Externality costs as market barriers. Energy Policy 2006, 34, 632–642. [Google Scholar] [CrossRef]
  23. Prest, R.; Daniell, T.; Ostendorf, B. Using GIS to evaluate the impact of exclusion zones on the connection cost of wave energy to the electricity grid. Energy Policy 2007, 35, 4516–4528. [Google Scholar] [CrossRef]
  24. Sánchez-Lozano, J.M.; García-Cascales, M.S.; Lamata, M.T. Comparative TOPSIS-ELECTRE TRI methods for optimal sites for photovoltaic solar farms. Case study in Spain. J. Clean. Prod. 2016, 127, 387–398. [Google Scholar] [CrossRef]
  25. Sandberg, A.; Klementsen, E.; Muller, G.; de Andres, A.; Maillet, J. Critical Factors Influencing Viability of Wave Energy Converters in Off-Grid Luxury Resorts and Small Utilities. Sustainability 2016, 8, 1274. [Google Scholar] [CrossRef]
  26. Adefarati, T.; Bansal, R.C. Reliability, economic and environmental analysis of a microgrid system in the presence of renewable energy resources. Appl. Energy 2019, 236, 1089–1114. [Google Scholar] [CrossRef]
  27. Reddy, S.; Painuly, J.P. Diffusion of renewable energy technologies—Barriers and stakeholders’ perspectives. Renew. Energy 2004, 29, 1431–1447. [Google Scholar] [CrossRef]
  28. Sen, S.; Ganguly, S. Opportunities, barriers and issues with renewable energy development–A discussion. Renew. Sustain. Energy Rev. 2017, 69, 1170–1181. [Google Scholar] [CrossRef]
  29. Boudghene Stambouli, A. Algerian renewable energy assessment: The challenge of sustainability. Energy Policy 2011, 39, 4507–4519. [Google Scholar] [CrossRef]
  30. Ozcan, M. Assessment of renewable energy incentive system from investors’ perspective. Renew. Energy 2014, 71, 425–432. [Google Scholar] [CrossRef]
  31. Kim, K.-T.; Lee, D.J.; Park, S.-J.; Zhang, Y.; Sultanov, A. Measuring the efficiency of the investment for renewable energy in Korea using data envelopment analysis. Renew. Sustain. Energy Rev. 2015, 47, 694–702. [Google Scholar] [CrossRef]
  32. Chang, Y.; Fang, Z.; Li, Y. Renewable energy policies in promoting financing and investment among the East Asia Summit countries: Quantitative assessment and policy implications. Energy Policy 2016, 95, 427–436. [Google Scholar] [CrossRef]
  33. Dvořák, P.; Martinát, S.; der Horst, D.V.; Frantál, B.; Turečková, K. Renewable energy investment and job creation; a cross-sectoral assessment for the Czech Republic with reference to EU benchmarks. Renew. Sustain. Energy Rev. 2017, 69, 360–368. [Google Scholar] [CrossRef]
  34. Liu, X.; Zeng, M. Renewable energy investment risk evaluation model based on system dynamics. Renew. Sustain. Energy Rev. 2017, 73, 782–788. [Google Scholar] [CrossRef]
  35. Budak, G.; Chen, X.; Celik, S.; Ozturk, B. A systematic approach for assessment of renewable energy using analytic hierarchy process. Energy Sustain. Soc. 2019, 9, 37. [Google Scholar] [CrossRef]
  36. Kul, C.; Zhang, L.; Solangi, Y.A. Assessing the renewable energy investment risk factors for sustainable development in Turkey. J. Clean. Prod. 2020, 276, 124164. [Google Scholar] [CrossRef]
  37. Chebotareva, G.; Strielkowski, W.; Streimikiene, D. Risk assessment in renewable energy projects: A case of Russia. J. Clean. Prod. 2020, 269, 122110. [Google Scholar] [CrossRef]
  38. Hashemizadeh, A.; Ju, Y.; Bamakan, S.M.H.; Le, H.P. Renewable energy investment risk assessment in belt and road initiative countries under uncertainty conditions. Energy 2021, 214, 118923. [Google Scholar] [CrossRef]
  39. Igliński, B.; Pietrzak, M.B.; Kiełkowska, U.; Skrzatek, M.; Kumar, G.; Piechota, G. The assessment of renewable energy in Poland on the background of the world renewable energy sector. Energy 2022, 261, 125319. [Google Scholar] [CrossRef]
  40. Le, M.-T.; Nhieu, N.-L. An Offshore Wind–Wave Energy Station Location Analysis by a Novel Behavioral Dual-Side Spherical Fuzzy Approach: The Case Study of Vietnam. Appl. Sci. 2022, 12, 5201. [Google Scholar] [CrossRef]
  41. Le, M.-T.; Nhieu, N.-L.; Pham, T.-D.T. Direct-Use Geothermal Energy Location Multi-Criteria Planning for On-Site Energy Security in Emergencies: A Case Study of Malaysia. Sustainability 2022, 14, 15132. [Google Scholar] [CrossRef]
  42. Mohd Chachuli, F.S.; Ahmad Ludin, N.; Md Jedi, M.A.; Hamid, N.H. Transition of renewable energy policies in Malaysia: Benchmarking with data envelopment analysis. Renew. Sustain. Energy Rev. 2021, 150, 111456. [Google Scholar] [CrossRef]
  43. Halkos, G.E.; Tzeremes, N.G. Analyzing the Greek renewable energy sector: A Data Envelopment Analysis approach. Renew. Sustain. Energy Rev. 2012, 16, 2884–2893. [Google Scholar] [CrossRef]
  44. Rodríguez-Lozano, G.; Cifuentes-Yate, M. Efficiency assessment of electricity generation from renewable and non-renewable energy sources using Data Envelopment Analysis. Int. J. Energy Res. 2021, 45, 19597–19610. [Google Scholar] [CrossRef]
  45. Bouyssou, D. Using DEA as a tool for MCDM: Some remarks. J. Oper. Res. Soc. 2017, 50, 974–978. [Google Scholar] [CrossRef]
  46. Cook, W.D.; Seiford, L.M. Data envelopment analysis (DEA)—Thirty years on. Eur. J. Oper. Res. 2009, 192, 1–17. [Google Scholar] [CrossRef]
  47. Azadeh, A.; Rahimi-Golkhandan, A.; Moghaddam, M. Location optimization of wind power generation–transmission systems under uncertainty using hierarchical fuzzy DEA: A case study. Renew. Sustain. Energy Rev. 2014, 30, 877–885. [Google Scholar] [CrossRef]
  48. Wang, C.-N.; Nhieu, N.-L.; Nguyen, H.-P.; Wang, J.-W. Simulation-Based Optimization Integrated Multiple Criteria Decision-Making Framework for Wave Energy Site Selection: A Case Study of Australia. IEEE Access 2021, 9, 167458–167476. [Google Scholar] [CrossRef]
  49. Pittenger, L.M.; Glassman, A.M.; Mumbower, S.; Merritt, D.M.; Bollenback, D. Bounded Rationality: Managerial Decision-Making and Data. J. Comput. Inf. Syst. 2022, 63, 890–903. [Google Scholar] [CrossRef]
  50. Wang, C.-N.; Nguyen, T.-D.; Nhieu, N.-L.; Hsueh, M.-H. A Novel Psychological Decision-Making Approach for Healthcare Digital Transformation Benchmarking in ASEAN. Appl. Sci. 2023, 13, 3711. [Google Scholar] [CrossRef]
  51. Turk, S.; Koc, A.; Sahin, G. Multi-criteria of PV solar site selection problem using GIS-intuitionistic fuzzy based approach in Erzurum province/Turkey. Sci. Rep. 2021, 11, 5034. [Google Scholar] [CrossRef] [PubMed]
  52. Bell, D.E. Regret in decision making under uncertainty. Oper. Res. 1982, 30, 961–981. [Google Scholar] [CrossRef]
  53. Ramos, G.M.; Daamen, W.; Hoogendoorn, S. A state-of-the-art review: Developments in utility theory, prospect theory and regret theory to investigate travellers’ behaviour in situations involving travel time uncertainty. Transp. Rev. 2014, 34, 46–67. [Google Scholar] [CrossRef]
  54. Simon, H. Bounded rationality in social science: Today and tomorrow. Mind Soc. 2000, 1, 25–39. [Google Scholar] [CrossRef]
  55. Kahneman, D. Prospect theory: An analysis of decisions under risk. Econometrica 1979, 47, 278. [Google Scholar] [CrossRef]
  56. Charnes, A.; Cooper, W.W.; Rhodes, E. Measuring the efficiency of decision making units. Eur. J. Oper. Res. 1978, 2, 429–444. [Google Scholar] [CrossRef]
  57. Tone, K. A slacks-based measure of efficiency in data envelopment analysis. Eur. J. Oper. Res. 2001, 130, 498–509. [Google Scholar] [CrossRef]
  58. Tone, K. A slacks-based measure of super-efficiency in data envelopment analysis. Eur. J. Oper. Res. 2002, 143, 32–41. [Google Scholar] [CrossRef]
  59. Charnes, A.; Cooper, W.W. Programming with linear fractional functionals. Nav. Res. Logist. Q. 1962, 9, 181–186. [Google Scholar] [CrossRef]
  60. Liu, J.; Shao, L.; Jin, F.; Tao, Z. A Multi-Attribute Group Decision-Making Method Based on Trust Relationship and DEA Regret Cross-Efficiency. IEEE Trans. Eng. Manag. 2022, 71, 824–836. [Google Scholar] [CrossRef]
  61. Liu, Z.; Xu, J.; Wei, Y.; Hatab, A.A.; Lan, J. Nexus between green financing, renewable energy generation, and energy efficiency: Empirical insights through DEA technique. Environ. Sci. Pollut. Res. 2023, 30, 61290–61303. [Google Scholar] [CrossRef] [PubMed]
  62. Moon, H.; Min, D. Assessing energy efficiency and the related policy implications for energy-intensive firms in Korea: DEA approach. Energy 2017, 133, 23–34. [Google Scholar] [CrossRef]
  63. Zhang, R.; Wei, Q.; Li, A.; Ren, L. Measuring efficiency and technology inequality of China’s electricity generation and transmission system: A new approach of network Data Envelopment Analysis prospect cross-efficiency models. Energy 2022, 246, 123274. [Google Scholar] [CrossRef]
  64. Mousavi-Avval, S.H.; Rafiee, S.; Jafari, A.; Mohammadi, A. Optimization of energy consumption for soybean production using Data Envelopment Analysis (DEA) approach. Appl. Energy 2011, 88, 3765–3772. [Google Scholar] [CrossRef]
  65. Wang, C.-N.; Nguyen, H.-K.; Nhieu, N.-L. Integrating prospect theory with DEA for renewable energy investment evaluation in South America. Renew. Energy 2025, 247, 123018. [Google Scholar] [CrossRef]
  66. IRENA. Renewable Energy Country Profiles; International Renewable Energy Agency (IRENA): Abu Dhabi, United Arab Emirates, 2022. [Google Scholar]
  67. The World Factbook; Central Intelligence Agency (CIA): Langley, VA, USA, 2023.
  68. ADB Data Library; Asian Development Bank: Mandaluyong, Philippines, 2022.
  69. ACE. The 5th ASEAN Energy Outlook (AEO5); ASEAN Center for Energy (ACE): Jakarta, Indonesia, 2017. [Google Scholar]
Figure 1. Renewables’ share of total energy supply [15].
Algorithms 18 00297 g001
Figure 2. Global renewable energy investment [16].
Algorithms 18 00297 g002
Figure 3. The proposed evaluation framework using RRUCE model.
Algorithms 18 00297 g003
Figure 4. Self-efficiency of South and Southeast Asia countries in RE investment.
Algorithms 18 00297 g004
Figure 5. Rejoice–regret cross-efficiency ( λ = 0.3 , φ = 0.5 ) .
Algorithms 18 00297 g005
Figure 6. Map of rejoice–regret cross-efficiency in South and Southeast Asia.
Algorithms 18 00297 g006
Figure 7. The change in cross-efficiency according to λ .
Algorithms 18 00297 g007
Figure 8. The change in cross-efficiency according to φ .
Algorithms 18 00297 g008
Table 1. Investigated DMUs.
No.CountryRegionAlpha-3 Code
1AfghanistanSAAFG
2BangladeshSABGD
3BhutanSABTN
4CambodiaSEAKHM
5IndiaSAIND
6IndonesiaSEAIDN
7Lao PDRSEALAO
8MalaysiaSEAMYS
9MaldivesSAMDV
10MyanmarSEAMMR
11NepalSANPL
12PakistanSAPAK
13PhilippinesSEAPHL
14Sri LankaSALKA
15ThailandSEATHA
16VietnamSEAVNM
Table 2. Investigated inputs and outputs of DEA models.
MeasurementInput/OutputNotationUnit
Public Flows to Renewable EnergyInputIP1Million USD
Energy IntensityInputIP1MJ per 2017 USD PPP
Transmission LossInputIP1Million kWh
Renewable Energy SupplyOutputOP1TJ
Renewable Energy ConsumptionOutputOP2TJ
Renewable Electricity GenerationOutputOP3%
Installed renewable Electricity CapacityOutputOP4MW
Non-renewable Emissions ReplacedOutputOP5Million Tons CO2eq
Table 3. Evaluation data.
CountryInputOutput
Public Flows to RE 2020Energy IntensityTransmission LossRE SupplyRenewable Energy ConsumptionRenewable Electricity GenerationInstalled Renewable Electricity CapacityNon-Renewable Emissions Replaced
AF49.262.4061.636,77724,98279.5387.70.9
BG23.132.369537.0536,582540,8601.8744.00.7
BT0.757.9160.057,149131,124100.02335.49.6
KH27.944.681187.0171,746180,98359.01748.64.2
IN1677.244.28270,701.09,072,44910,196,47018.9147,170.6281.8
ID418.113.1625,080.02,221,2602,317,27818.111,537.346.5
LA0.444.352262.090,940252,88469.38934.329.9
MY3.874.2512,124.0166,883281,39117.88898.221.5
MV22.062.6821.03364225.832.50.0
MM63.263.5821.0496,449488,91046.43443.66.3
NP59.385.231183.0480,625493,046100.02096.26.4
PK870.534.5917,389.0874,7211,020,57129.812,887.434.2
PH1.722.689994.0799,202879,52721.97312.318.2
LK0.581.781337.0162,464183,00151.32720.45.4
TH54.824.5213,286.0705,237810,78618.812,197.225.9
VN166.914.9215,479.0862,5191,163,84342.842,728.583.5
Table 4. Optimal input and output weight matrix for of DMUs ( u i k *   a n d   v j k * ) .
CountryIP1IP2IP3OP1OP2OP3OP4OP5
AFG000.0162000.012600
BGD000.000100000
BTN00.1264000000
KHM000.0008000.006200
IND0.00060000000.0035
IDN00000000
LAO000.0004000.014400
MYS000.000100000
MDV0.04530000000
MMR0.01580000000
NPL00.19120000.006500
PAK0.00110000000
PHL000.000100000
LKA000.000700000
THA000.000100000
VNM000.000100000
Table 5. Rejoice–regret cross-efficiency matrix.
CountryAFGBGDBTNKHMINDIDNLAOMYSMDVMMRNPLPAKPHLLKATHAVNM
AFG1.000.001.290.040.000.000.020.000.211.710.070.000.000.030.000.00
BGD0.650.061.030.160.040.100.040.010.0225.560.440.050.090.130.060.06
BTN2.620.061.001.000.350.451.260.330.171.031.510.510.652.280.330.69
KHM9.440.0012.200.360.000.010.220.012.0316.170.620.010.020.280.010.02
IND0.110.1975.810.891.000.66404.9433.100.010.590.640.2363.1455.522.812.98
IDN6.740.6410.751.630.381.000.450.160.18266.924.590.570.901.370.600.63
LAO42.100.0154.391.620.000.021.000.059.0472.102.760.060.071.250.050.09
MYS4.610.6524.861.730.431.051.270.260.23264.874.740.671.001.560.690.86
MDV0.083.5826.780.990.930.8588.0311.140.001.181.270.1878.3248.332.271.07
MMR0.102.969.710.780.690.6826.345.490.001.001.030.1359.2135.691.640.66
NPL1.120.030.430.430.150.190.540.140.070.440.650.220.280.970.140.29
PAK0.177.6857.402.132.001.82188.6923.870.012.542.730.38167.88103.594.862.29
PHL4.610.6424.831.730.431.051.270.260.23264.554.740.671.001.560.690.85
LKA2.960.4115.971.110.280.680.820.170.15170.093.040.430.641.000.450.55
THA2.440.3413.140.920.230.560.670.140.12140.032.510.350.530.820.370.45
VNM5.390.7529.072.030.501.231.490.310.27309.645.540.781.171.820.811.00
Disclaimer/Publisher’s Note: The statements, opinions and data contained in all publications are solely those of the individual author(s) and contributor(s) and not of MDPI and/or the editor(s). MDPI and/or the editor(s) disclaim responsibility for any injury to people or property resulting from any ideas, methods, instructions or products referred to in the content.

