Article

Modeling of Global and Individual Kinetic Parameters in Wheat Straw Torrefaction: Particle Swarm Optimization and Its Impact on Elemental Composition Prediction

by
Ismael Urbina-Salas
1,2,
David Granados-Lieberman
3,
Martín Valtierra-Rodríguez
4,
Claudia Adriana Ramírez-Valdespino
5 and
David Aarón Rodríguez-Alejandro
1,*
1
Departamento de Ingeniería Mecánica, Universidad de Guanajuato, Carr. Salamanca-Valle de Santiago km 3.5 + 1.8, Salamanca 36885, Guanajuato, Mexico
2
ENAP-Research Group, Departamento de Ingeniería Mecatrónica, Tecnológico Nacional de México, ITS Guanajuato (ITESG), Carr. Guanajuato a Puentecillas km 10.5, Guanajuato 36262, Guanajuato, Mexico
3
ENAP-Research Group, Departamento de Ingeniería Electromecánica, Tecnológico Nacional de México, ITS Irapuato (ITESI), Carr. Irapuato-Silao km 12.5, El Copal, Irapuato 36821, Guanajuato, Mexico
4
ENAP-Research Group, Facultad de Ingeniería, Universidad Autónoma de Querétaro (UAQ), Campus San Juan del Río, Río Moctezuma 249, Col. San Cayetano, San Juan del Río 76807, Queretaro, Mexico
5
Centro de Investigación en Materiales Avanzados (CIMAV), Miguel de Cervantes 120, Complejo Industrial Chihuahua, Chihuahua 31136, Chihuahua, Mexico
*
Author to whom correspondence should be addressed.
Algorithms 2025, 18(5), 283; https://doi.org/10.3390/a18050283
Submission received: 2 April 2025 / Revised: 2 May 2025 / Accepted: 7 May 2025 / Published: 13 May 2025
(This article belongs to the Special Issue Artificial Intelligence Algorithms in Sustainability)

Abstract

:
With the growing demand for sustainable energy solutions, biomass torrefaction has emerged as a crucial technology for converting agricultural waste into high-value biofuels. This work develops dual kinetic modeling using global and individual parameters combined using particle swarm optimization (PSO) to predict energy densification based on elemental composition (CHNO) and high heating values (HHVs). The global parameters are calculated from experiments conducted at 250 °C, 275 °C, and 300 °C, and the individual parameters are obtained by adjusting experimental points at each temperature. A two-step kinetic model was used and optimized to achieve exceptional adjustment accuracy (98.073–99.999%). The experiments were carried out in an inert atmosphere of nitrogen with a heating rate of 20 °C/min and a 100 min residence time. The results obtained demonstrate a crucial trade-off: while individual parameters provide superior accuracy (an average fit of 99.516%) for predicting degradation by weight loss, global parameters offer better predictions for elemental composition, with average errors of 2.129% (carbon), 1.038% (hydrogen), 9.540% (nitrogen), and 3.997% (oxygen). Furthermore, it has been found that by determining the kinetic parameters at a torrefaction temperature higher than the maximum peak observed in the derivative thermogravimetric (DTG) curve (275 °C), it is possible to predict the behavior of the process within the 250–325 °C range with an R-squared value corresponding to an error lower than 3%. This approach significantly reduces the number of required experiments from twelve to only four by relying on a single isothermal condition for parameter estimation.

1. Introduction

Currently, clean energy sources are being utilized to reduce the environmental challenges caused by the extensive use of fossil fuels. Therefore, biomass residues have high potential as a sustainable alternative [1,2]. There are different processes employed to transform biomass into energy, including biochemical and thermochemical processes [3]. The first process is carried out through the degradation of organic matter by microorganisms. In contrast, the second is carried out under different pressure and temperature conditions to obtain solids, liquids, and gases through thermal decomposition. The main thermochemical technologies for preheating biomass are torrefaction and pyrolysis; in these processes, the material is degraded in an oxygen-free environment, at atmospheric pressure, and at reaction temperatures between 200 and 350 °C in the case of torrefaction [4,5], and between 350 and 700 °C for pyrolysis [6]. These processes not only remove moisture from the lignocellulosic biomass but also include the devolatilization, depolymerization, and carbonization of cellulose, hemicellulose, and lignin [7,8], as well as increase their calorific value. Different heating rates are usually established before reaching the treatment temperature, depending on the objective. Lin et al. [9] reported and used the different heating rates in torrefaction. Kinetic analysis is used to study the decomposition behavior of biomass under various thermal treatments, where high temperatures accelerate the kinetic rate of the reaction by increasing the synthesis gas and decreasing tar formation [10]. To measure weight loss characteristics, thermogravimetric analysis (TGA) is used [11], which allows the percentage of weight loss due to decomposition and dehydration of the biomass to be determined [12]. Basically, TGA measures the total content of solids and volatiles generated during the thermochemical process. Isothermal and non-isothermal decomposition are the two processes of biomass degradation [13]. Depending on these two factors, different approaches or models are used, including single-step, two-step, multi-step, and multicomponent models [14]. Kinetics and thermochemical models show that, at high temperatures, product evolution increases, the heating rate influences the thermochemical process evolution, and the mass and energy yield of the products are significantly influenced by both temperature and residence time [15]. This generally improves the properties of the solid fuel by removing moisture from the biomass and increasing the energy [16]. The literature presents studies that predict the devolatilization processes and the elemental content of carbon (C), hydrogen (H), nitrogen (N), and oxygen (O) in the biomass during thermal treatment using the two-step model [14,17]. Furthermore, several authors introduce the indices of decarbonization (DC), dehydrogenation (DH), and deoxygenation (DO) [18] to analyze the weight loss of C, H, N, and O [19,20], as well as the evolution of the high heating value (HHV) of biomass during the treatment [21]. The quality of the product that has been through a thermal process is given in terms of the HHV and a lower atomic ratio of H/C and O/C [22,23].
During thermochemical processes, complex chemical reactions, thermal degradation, and heat and mass transfer coexist [24]. This complexity requires precision in reactor design modeling, as well as techno-economic and environmental assessment [25]. Conventional techniques for modeling pyrolysis and torrefaction consist of thermodynamic analyses [26], kinetic analyses, computational fluid dynamics (CFD) [27], and process simulation such as Aspen Plus [4]. For theoretical studies, thermodynamic analysis is simple and efficient but has limitations. It is ineffective for designing a reactor for real-world applications, as it requires several assumptions [28]. In kinetic analysis, the complexity of the reaction rates requires many assumptions [14]. To perform an accurate simulation, fluid dynamics (CFD) models require a high computational load [29]. Therefore, a mathematical model is required to design and optimize the thermal conversion process reliably and accurately, given its complexity, the involvement of nonlinear parameters, and the high-dimensional conversion processes [30].
To address these disadvantages, Machine Learning (ML) is used, which is a subclass of artificial intelligence (AI), a technology that allows a machine to learn and is used in the optimization of thermochemical conversion processes and the prediction of their efficiency [31]. Advantages of ML-based models include that they do not require extensive knowledge and information about the process, but they only require a dataset of experimental measurements [32]. In solid yield prediction, real-time monitoring, and control, ML has recently been shown to be a solution for thermochemical conversion processes. Among the most common ML algorithms in the literature on optimization and prediction for thermochemical analysis, elemental analysis, and high calorific value problems, the following stand out: least squares regression (LSR) [33], Sum of Squared Error (SSE) [34], Nelder–Mead [35,36,37], CFD simulation [27], and particle swarm optimization (PSO) [13,38,39]. A powerful advantage of these algorithms is the ability to make predictions about global and individual Arrhenius parameters. The first algorithm consists of obtaining a set of Arrhenius parameters for each study temperature, while the second one obtains a set of Arrhenius parameters from a set of temperatures. In both cases, the experimental data are adjusted using a two-step kinetic model during a non-isothermal torrefaction process [40]. In this research, the main goal is to determine the impact of studying Arrhenius constants under the individual and global parameters scheme for elemental analysis, HHVs, atomic O/C and H/C ratios, and energy density in the wheat straw torrefaction process. In [33], the LSR method is used to predict a set of global Arrhenius parameters over a temperature range of 200–300 °C for different types of biomass, adjusting 31 experimental data points. In [17], the SSE algorithm performs individual parameter adjustment with 25 experimental data points in a temperature range of 220–300 °C for spruce and birch biomass. The Nelder–Mead algorithm is the most common kinetic parameter adjustment algorithm. It is used in [10] to predict a set of global Arrhenius parameters in a temperature range of 210–380 °C for juniper, adjusting nine experimental data points with a two-step kinetic model with an error of less than 2%. In [19], the Nelder–Mead algorithm is used to perform global parameter adjustment with 15 experimental data points in a temperature range of 210–290 °C in Eucalyptus grandi; in [14,21], the Nelder–Mead algorithm is used to perform a global parameter adjustment for poplar and fir with 30 experimental data points in a temperature range of 200–230 °C; and in [41], the Nelder–Mead algorithm is used with the Matlab function lsqcurvefit to perform individual parameter adjustment with a set of 48 experimental data points. In [42], a study of global and individual parameter adjustment for poplar and xylan is carried out in a temperature range of 200–240 °C using the Nelder–Mead algorithm with a set of 24 experimental points. In [8], individual parameter adjustment is performed for wood with 48 experimental data points in a temperature range of 200–300 °C using CFD software solved with the fourth-order Runge-Kutta method implemented in FORTRAN. The PSO algorithm is implemented in [13,40] to perform an individual parameter adjustment of 28 and 80 experimental data points for each study of xylan and sorghum distillation residues in a temperature range of 200–300 °C in both cases. Several studies of different biomasses at isothermal torrefaction temperatures have been analyzed using the two-step kinetic model to predict the solid biofuel yield using different algorithms. Table 1 lists some case studies of yield prediction under different parameter schemes.
Therefore, this research contributes to the assessment using the two-step kinetic model coupled with the PSO algorithm to predict biomass yield by making a comparison between two strategies: (1) individual parameters based on a single temperature and (2) global parameters considering four temperatures with the aim of reducing the amount of experimental data required to obtain a high-certainty predictive model of the energy densification that occurs during biomass torrefaction.

2. Materials and Methods

2.1. Experimental Procedure

This section describes the materials used in this research work and their physicochemical characterization: the proximate analysis, elemental composition, and the higher heating value (HHV) of raw wheat straw, as shown in Figure 1.

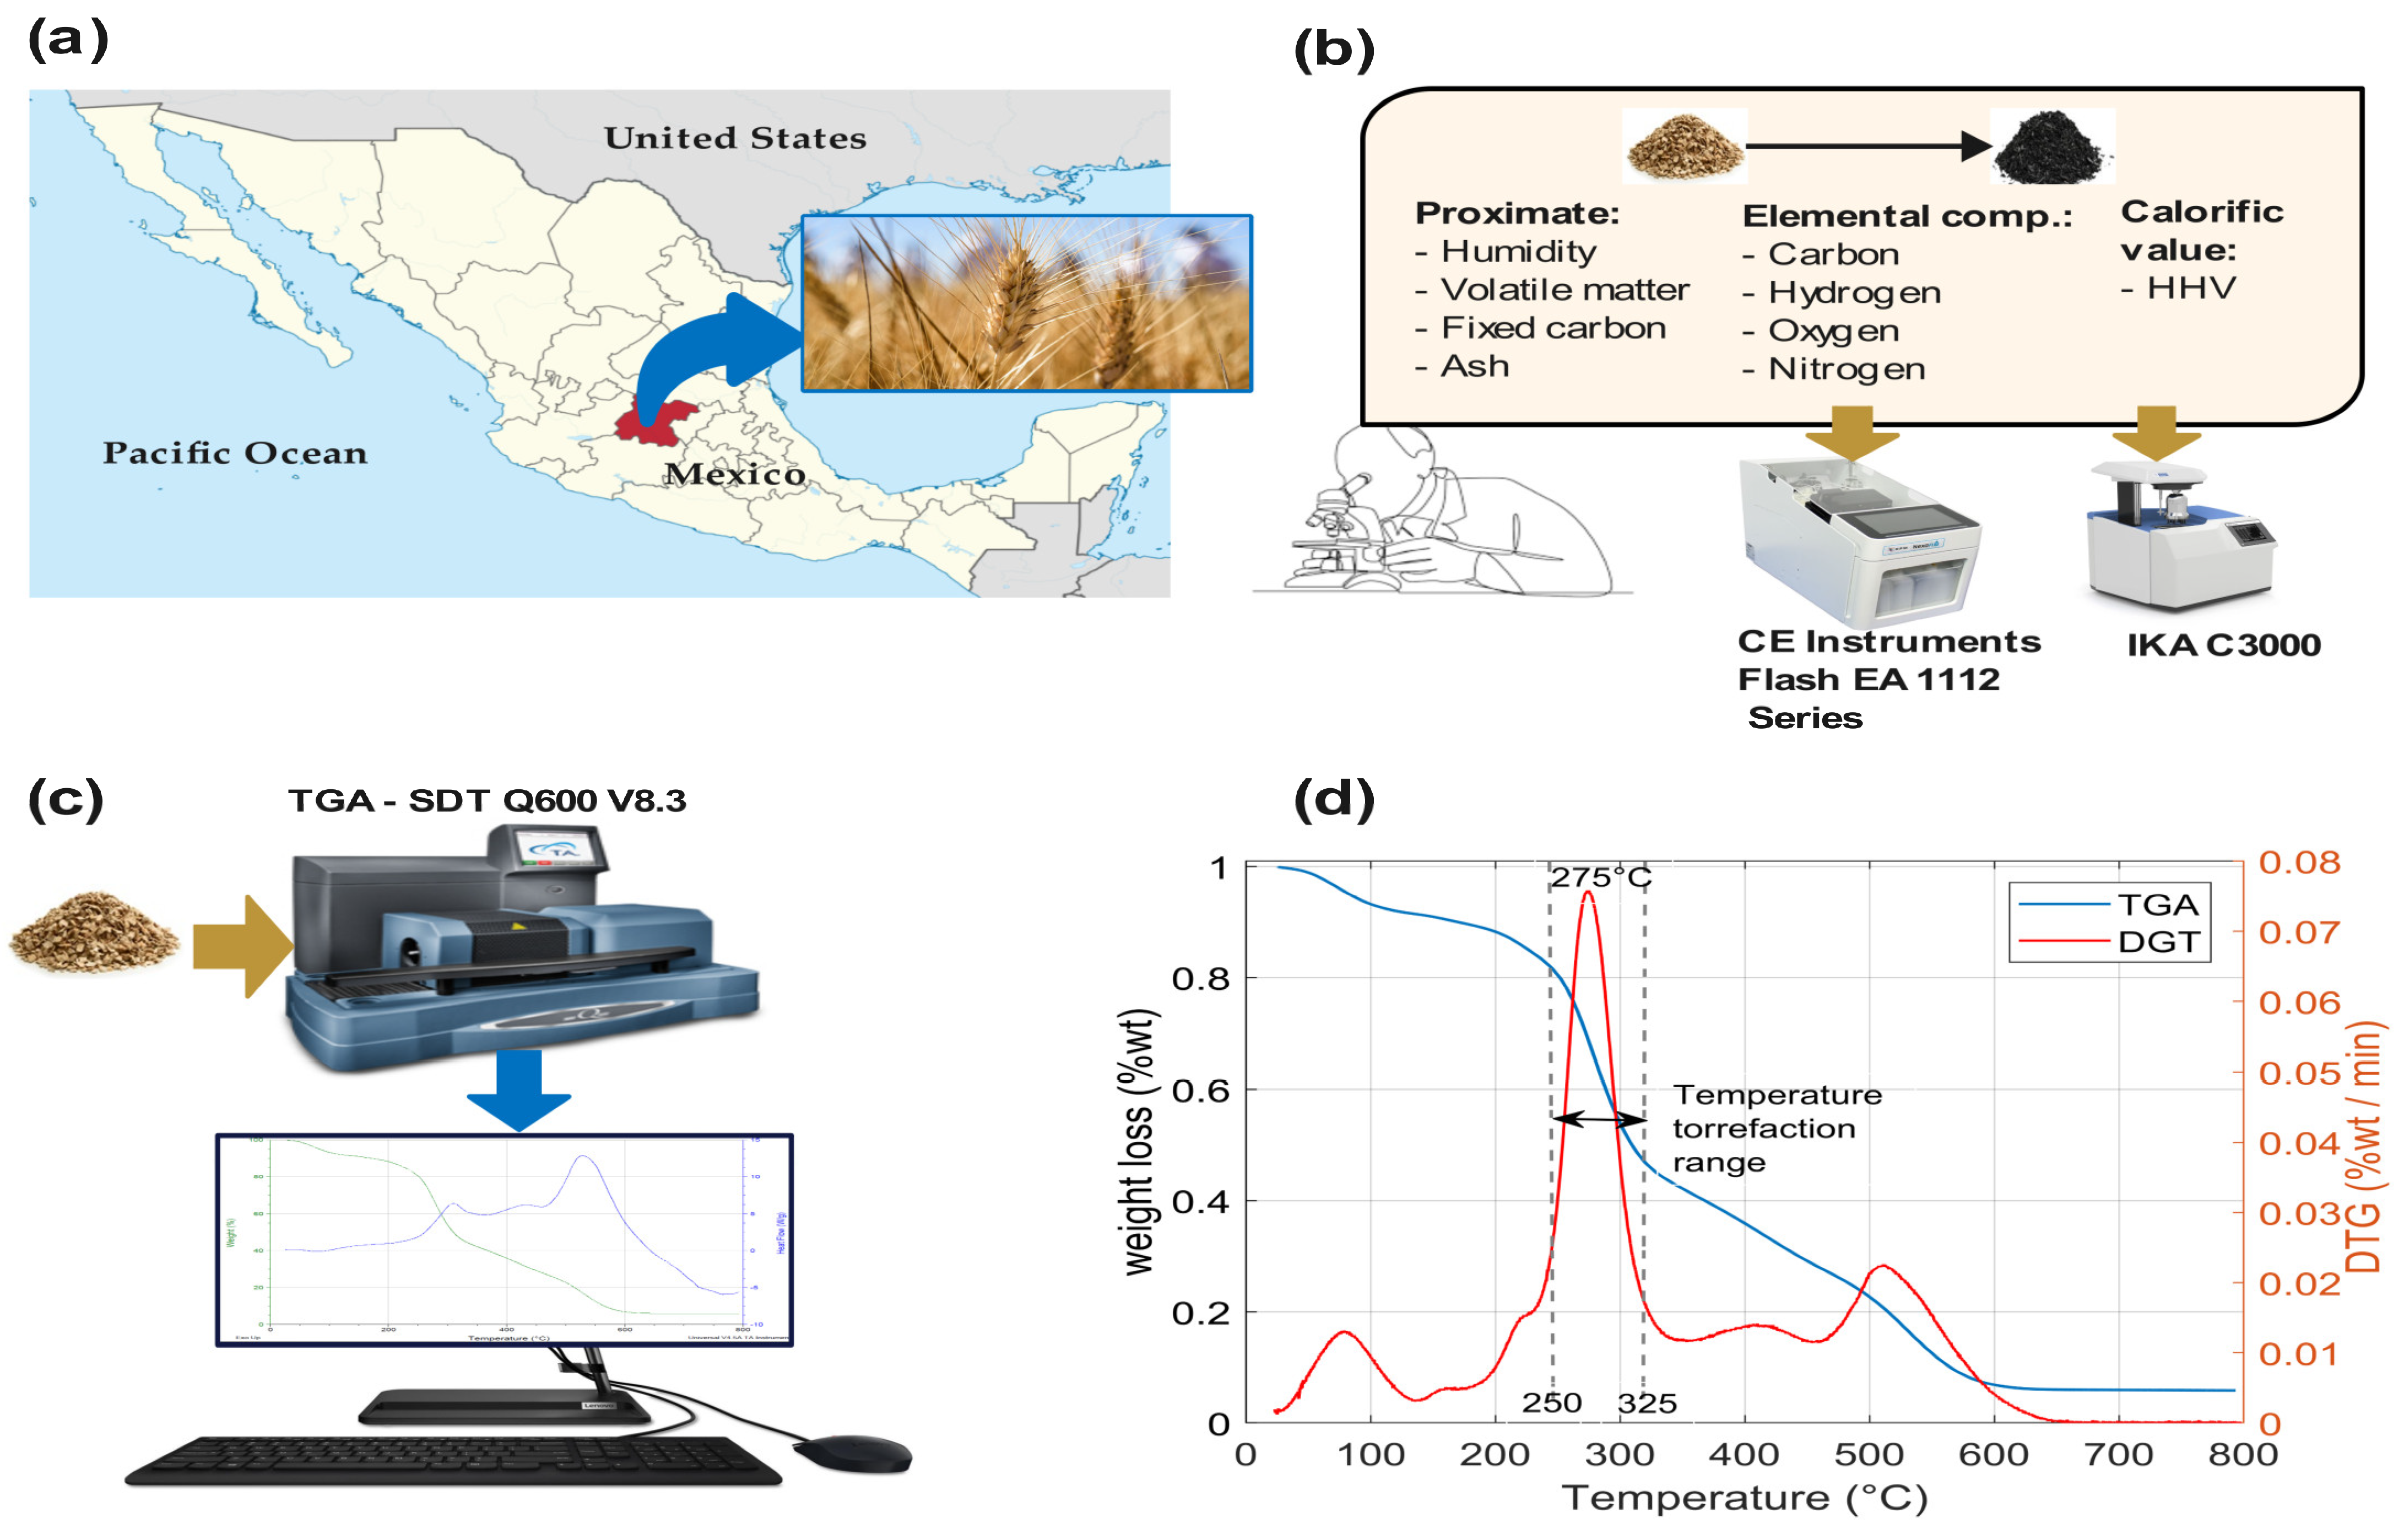
2.1.1. Feedstock and Preparation

The wheat harvest in Guanajuato has maintained one of the highest yields in the 2014–2024 decade, with 6.4 tons per hectare, achieving an average harvest of more than 400,000 tons annually, making it the third highest producing state in Mexico. This has led government institutions to promote and incentivize innovative initiatives to utilize the 30% of wheat straw that is not used for livestock in sustainable technologies within the circular economy. This is the main reason why this biomass was selected as the raw material for the development of this study. The biomass sample was collected in the city of Pénjamo (the largest wheat producer in Guanajuato), with crop fields located at the geographic coordinates 20°25′52″ N 101°43′20″ W during the autumn–winter harvest cycle [43].

2.1.2. Property Characterization

The wheat straw was ground to a uniform powder and sieved with a No. 20 mesh sieve. A thermogravimetric analysis (TGA) study of wheat straw was carried out using an SDT Q600 V8.3 device (manufactured by TA Instruments, New Castle, DE, USA-United States of America). The proximate analysis was based on the standard procedure of the American Society for Testing and Materials. The elemental composition was measured with a Thermo Scientific iCAP™ 7400 ICP-OES analyzer (manufactured by PerkinElmer, Waltham, MA, USA). The HHV was measured in a bomb calorimeter (IKA C3000, manufactured by Parr Instrument Company, Moline, IL, USA). The results of the analysis of the raw wheat straw are detailed in Table 2.

2.1.3. Thermogravimetric Analysis

Figure 1c shows the thermogravimetric analysis (TGA) and derived thermogravimetric analysis (DTG) of wheat straw. A TGA study was carried out on wheat straw using an SDT Q600 V8.3 device. TGA and TDG curves of pyrolysis were obtained with 35.555 mg of wheat straw at a heating rate of 10 °C/min in air, at temperatures of 25–800 °C, with a residence time of 80 min. Figure 1d shows that the pyrolysis process of wheat straw ranged between 25 and 800 °C. In the TGA curve (blue), the dehydration stage occurs from 25 and 150 °C, the decomposition of proteins and carbohydrates occurs between 150 and 400 °C, the decomposition of lipids occurs from 400 to 600 °C, and finally, the decomposition of other components occurs from 600 to 800 °C. After 600 °C, there are no changes in the wheat straw, leaving only fixed carbon. Abrupt changes in biomass occur during the protein and carbohydrate decomposition stage. The DTG curve (red) shows pronounced thermal decomposition, marking the limits of the wheat straw torrefaction process between 250 and 325 °C.

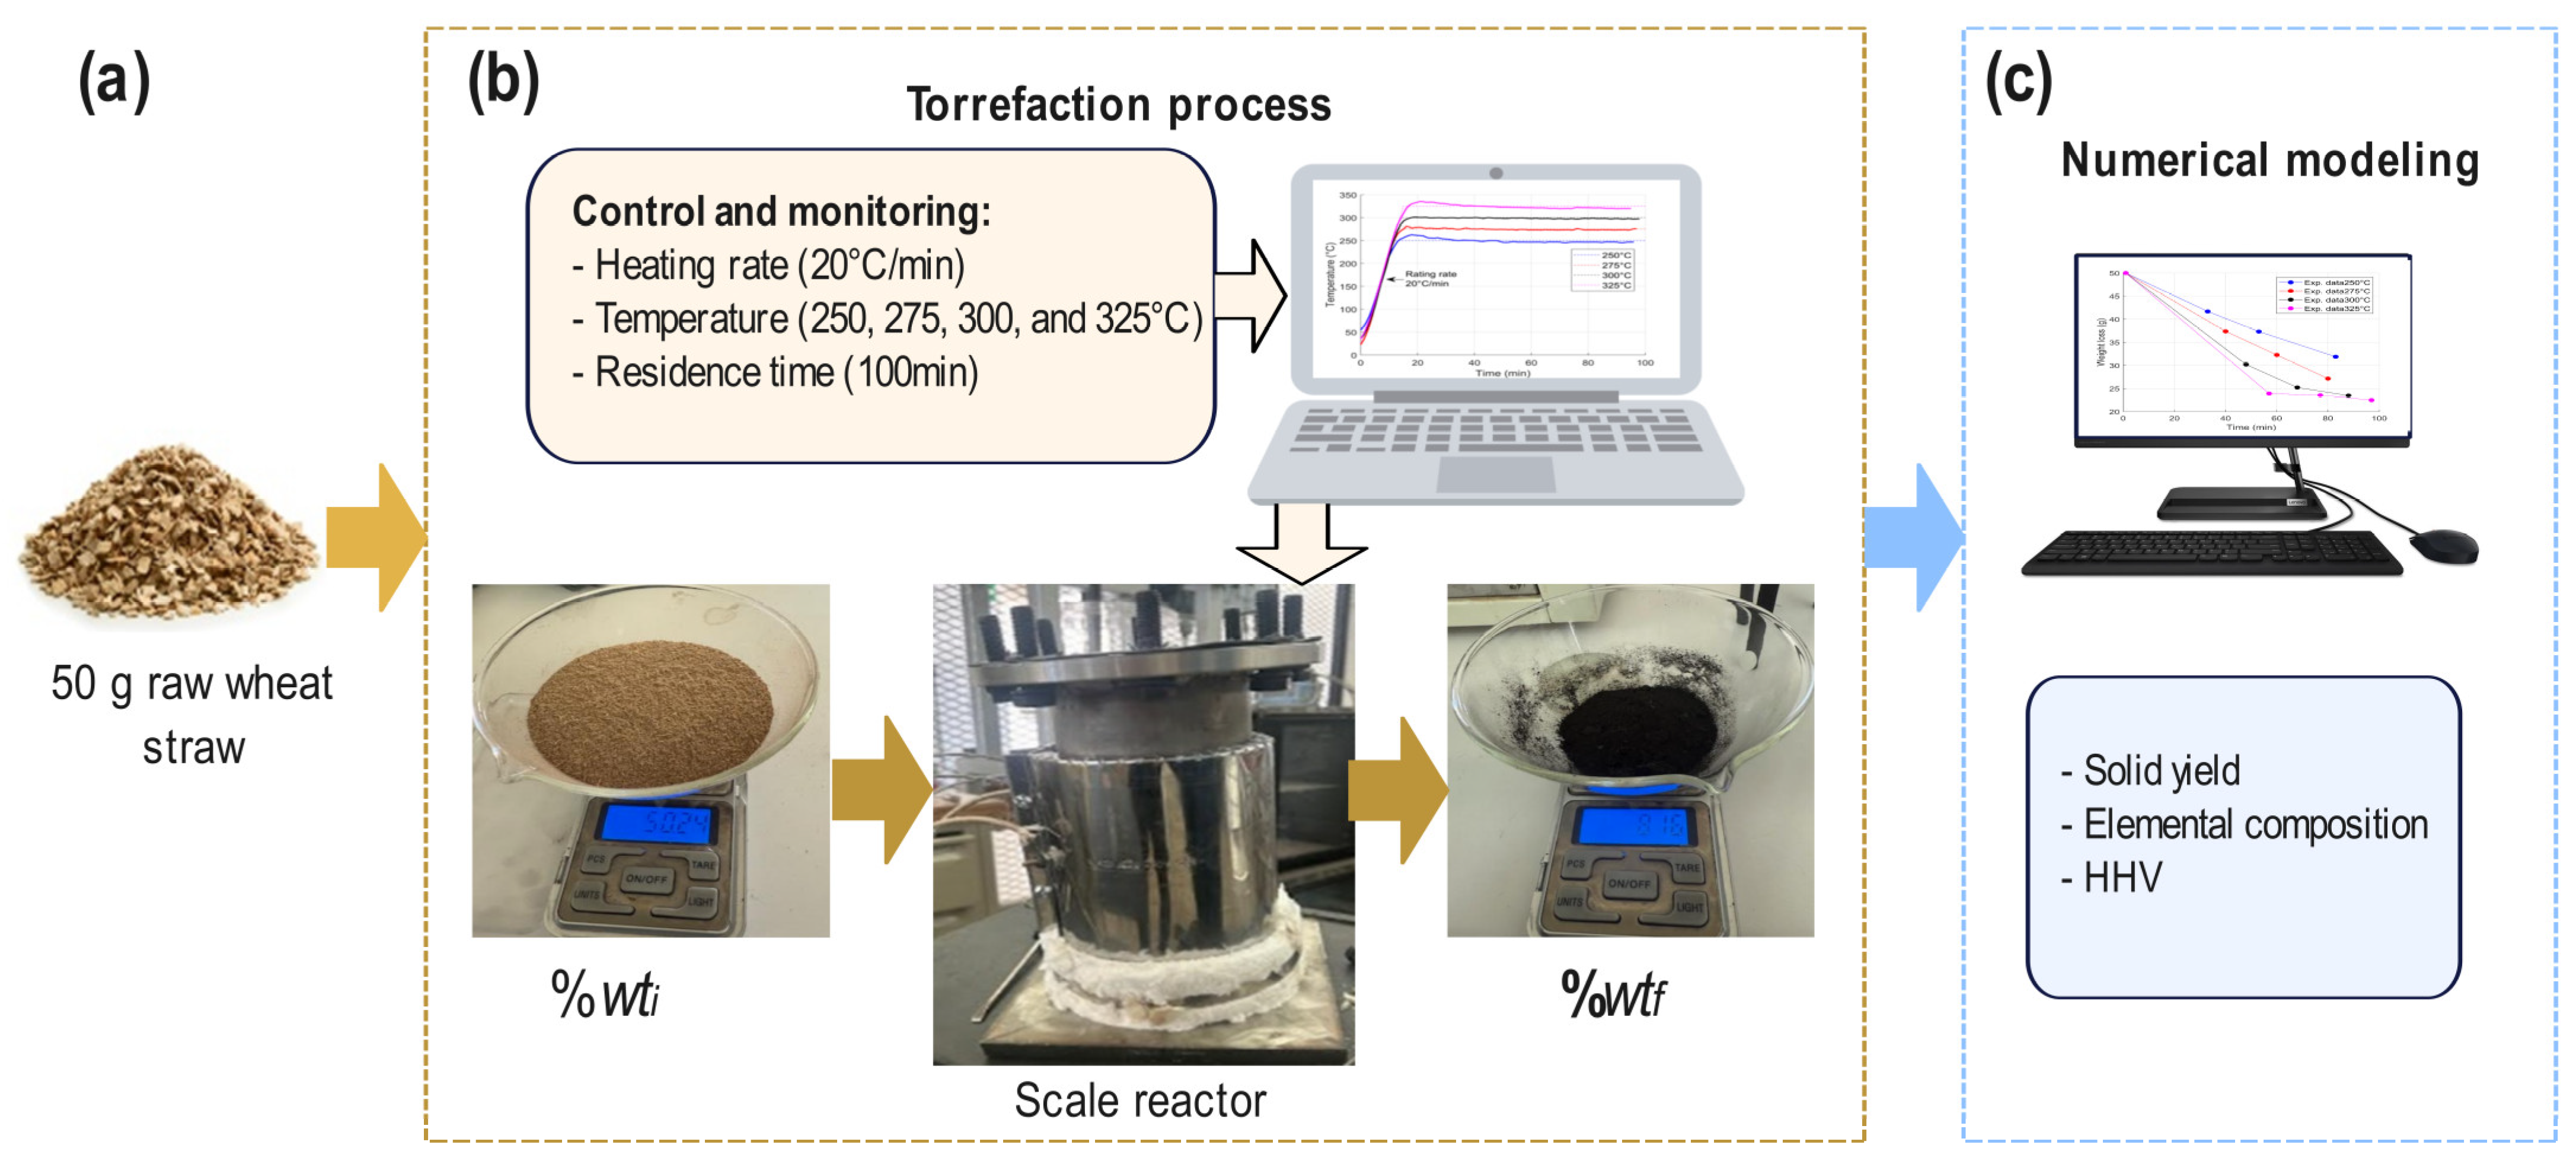
2.1.4. Torrefaction Experiments

Figure 2 shows the proposed experimental torrefaction methodology, which is based on three phases: (a) raw material, (b) torrefaction process, and (c) numerical modeling. First, the raw material used is wheat straw biomass, which has been ground into a fine powder to be sieved, weighed, and standardized into 50 g samples (%wti) for each test. Then, the conditions of the experiment are established, such as the duration of the test or residence time, the heating rate, and the maximum isothermal temperatures. To eliminate any trace of air (oxidizing agent) from entering the reactor, nitrogen (N2) is injected at a flow rate of 50 mL/min before starting the experiment for 5 min. Once the residence time is completed, after the experiment is carried out, the sample is removed from the reactor and weighed to obtain the final percentage of weight loss of the sample (%wtf). Four isothermal torrefaction temperatures were established for the design of the experiments proposed in this work, ranging from 250 to 275, 300, and 325 °C, at a heating rate of 20 °C/min. A residence time of 100 min was established. For the torrefaction process, a scale reactor was used, which has a K thermocouple that is used as a sensor to control and monitor the temperature. An Arduino UNO board (manufactured by Smart Projects, Scarmagno, Italy), a MAX6675 module (manufactured by Maxim Integrated Products, Sunnyvale, CA, USA) as an instrumentation stage between Arduino and the sensor, a 3500 W 220 VAC clamp resistor, an Autonics SPC1-50 power controller (manufactured by Autonics, Seoul, Republic of Korea), and a first-order Smith predictive control system with a delay (at 225 s) implemented in Matlab® software were used version 2021a. The experimental results were stored in a database for further numerical modeling, which will be discussed in the next section.

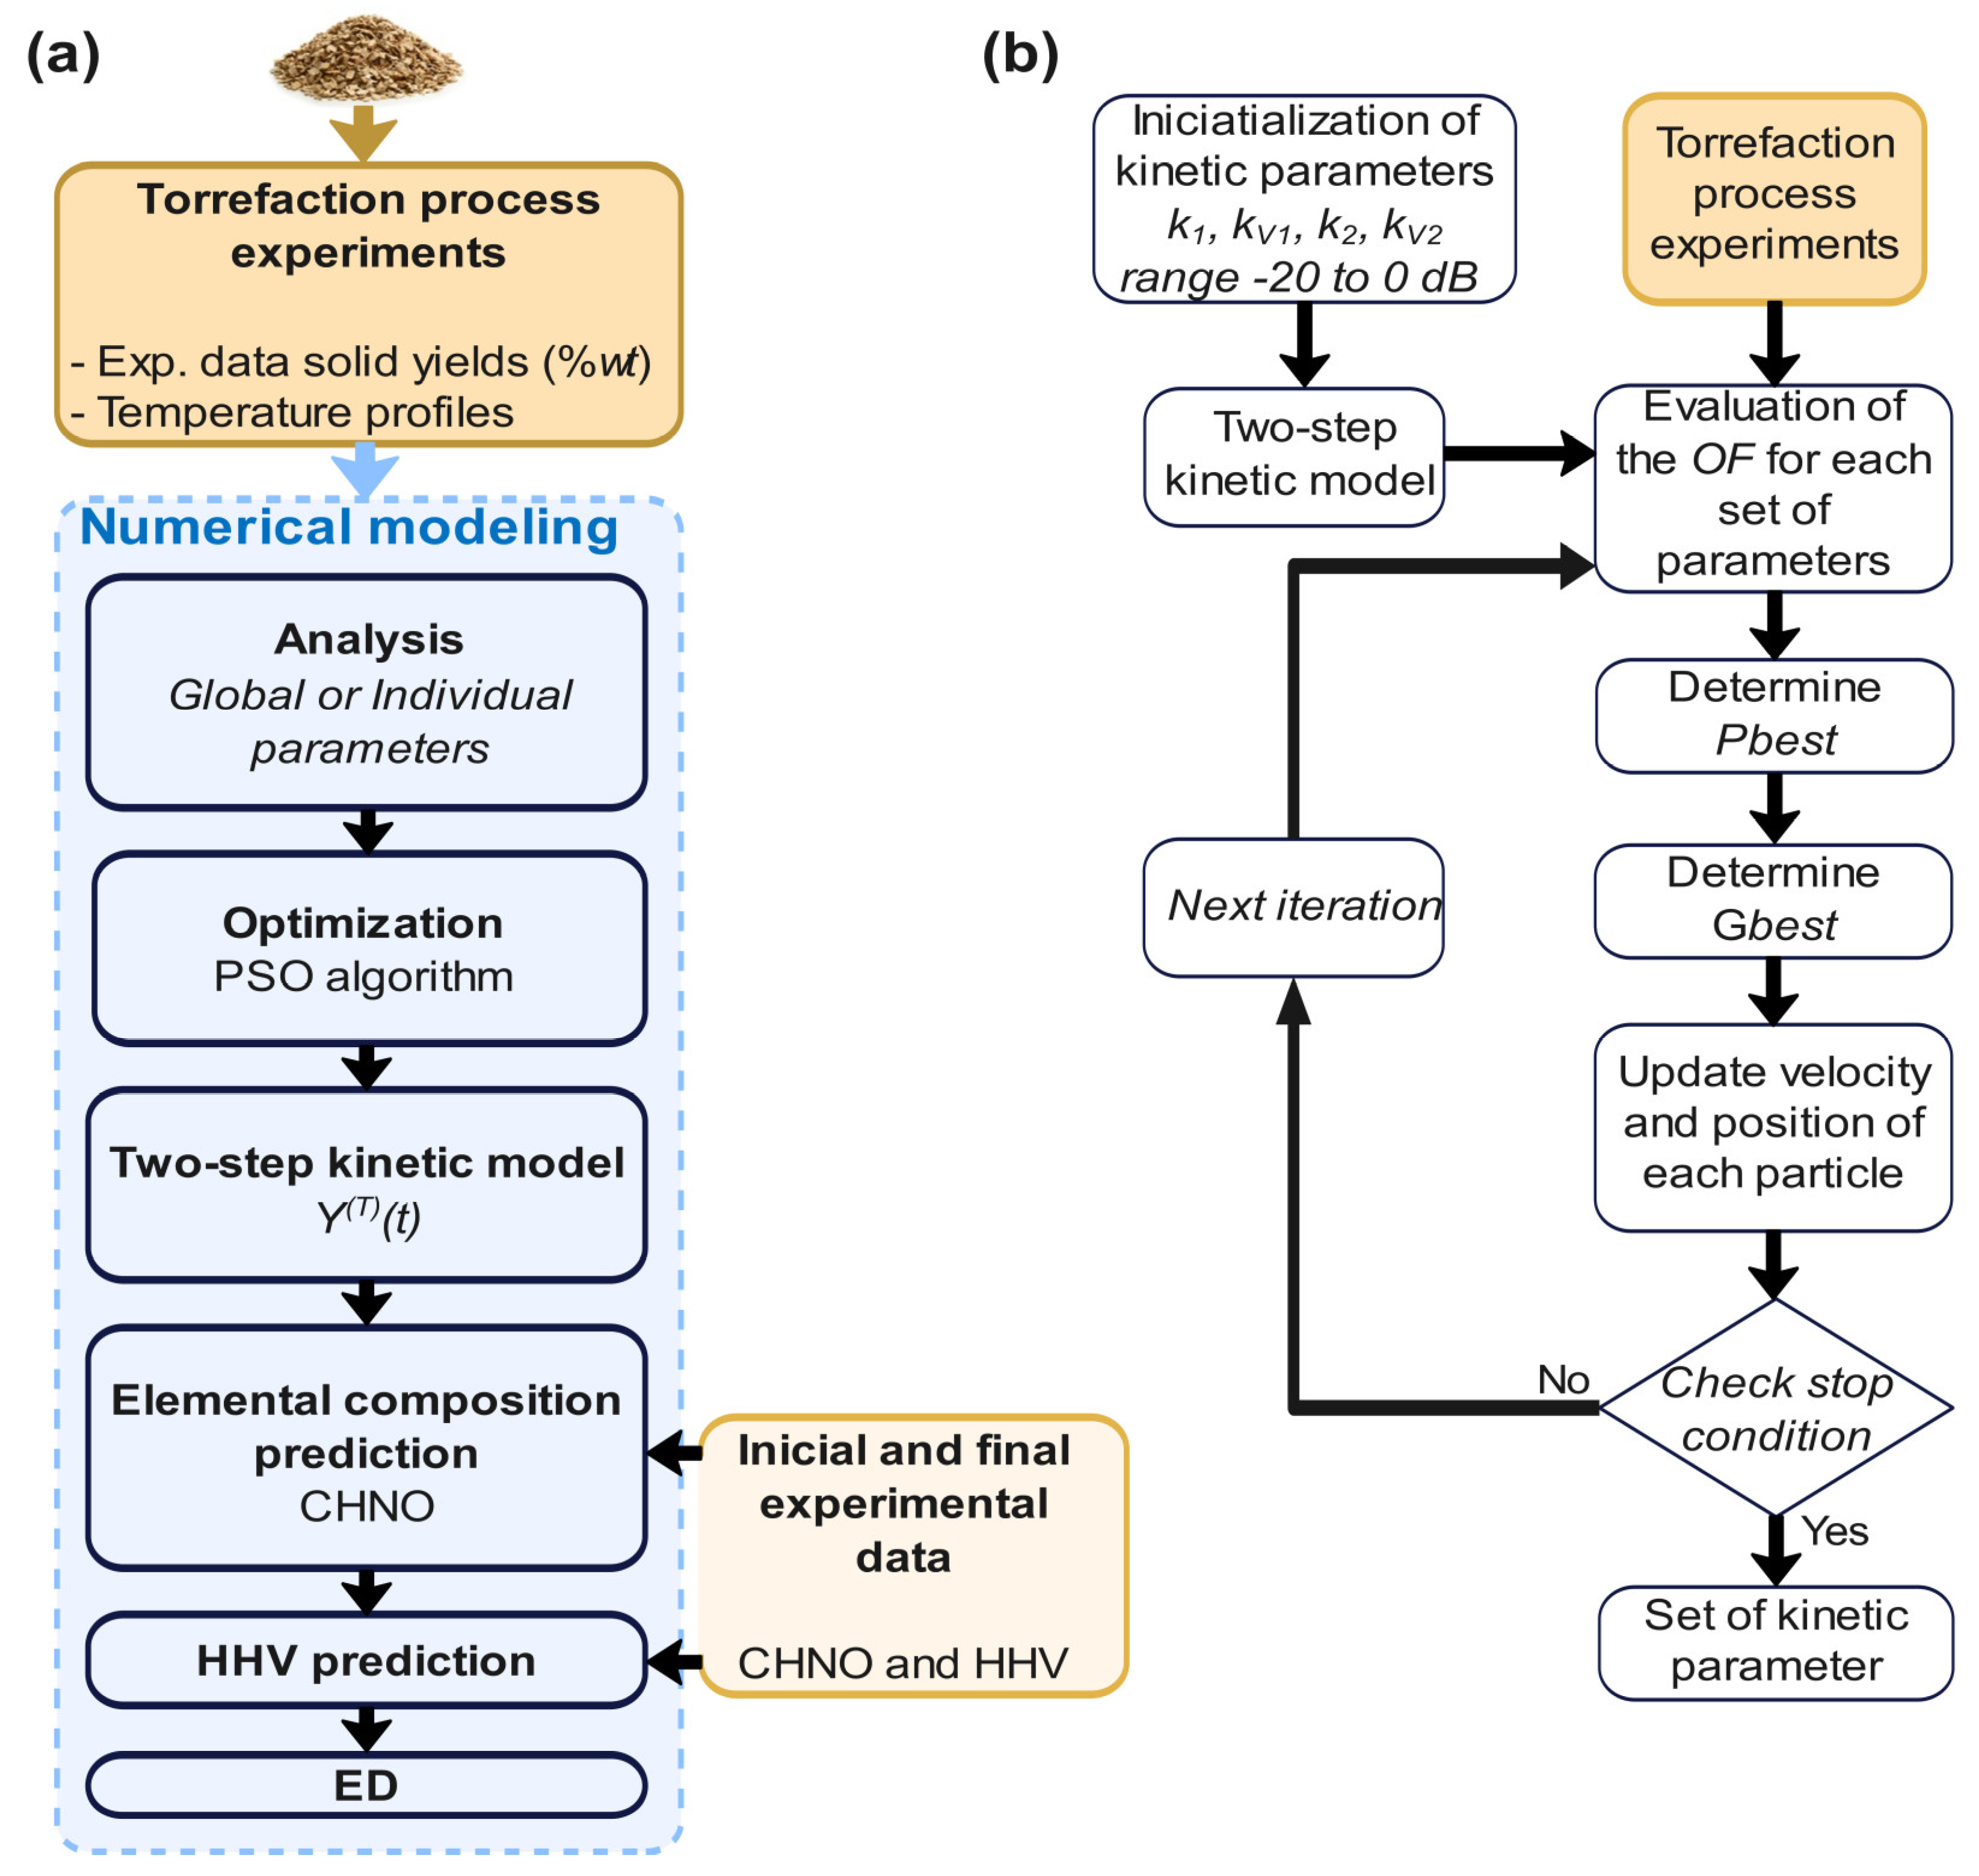
2.2. Numerical Modeling

For this research, a heating rate of 20 °C/min, torrefaction temperatures of 250, 275, 300, and 325 °C, and a 100 min residence time were established. Three weight loss (wt) points were obtained for each temperature. The weight loss data were unified according to the %wt = m/mo ratio. Solid yield kinetic modeling was performed using a two-step kinetic model and the PSO algorithm, through two Arrhenius kinetic parameter approaches: (1) global and (2) individual. To predict the solid yield, a set of Arrhenius parameters is obtained: for the first case, it is obtained from the four torrefaction temperatures, and in the second case, it is obtained for each temperature. Using the wheat straw yield fitting data and elemental composition data (of raw and torrefied biomass), the elemental component prediction analysis is performed during the 100 min residence time, as well as the prediction of the HHV and densification energy (DE). In the following subsections, the following mathematical models are explained: (1) the two-step kinetic model, (2) the elemental composition model, (3) HHV prediction, (4) densification energy, and (5) the particle swarm optimization (PSO) mathematical model.

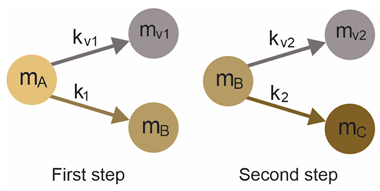
2.2.1. Two-Step Kinetic Model

To describe the mechanism of biomass decomposition during the isothermal pyrolysis and torrefaction process, a two-step kinetic model was developed [44]. This model is presented in Equation (1). The pseudo-components represent the raw biomass (mA), the intermediate product (mB), and the torrefied biomass (mC). The volatile compounds are represented by the pseudo-components mVA and mVB. At the beginning of the treatment process (at t = 0), mA represents 100% of the solid yield, i.e., the raw biomass. As the temperature increases, the intermediate product mB appears and the volatile component mV1 is released. Subsequently, the solid residue mC is generated, and the volatile compound mV2 is released. The sum (mT = mA + mB + mC) of the pseudo-components mA, mB, and mC describes the solid yield during the residence time of the pyrolysis and torrefaction process [42,45,46]. The scheme of the model is presented below:
Algorithms 18 00283 i001
Where, the constants k1, k2, kV1, and kV2 (at min−1) obey the Arrhenius law of Equation (1) and are also called “kinetic parameters”. Where the pre-exponential parameter is A0 (min−1), the activation energy is Ea (J·mol−1), the absolute temperature T (K), and the universal gas constant R = 8.314 J·K−1·mol−1, respectively.
k = A 0 exp E a R T
Assuming that the reactions are first order, the Arrhenius constants for solid and volatile yields can be described as follows:
Y A T t = d m A d t = m A k 1 + k V 1
Y B T t d m B d t 1 A B k 2 + k V 2
Y C T t d m C d t 2 B
Y V 1 T t = d m V 1 d t = k V 1 m A
Y V 2 T t = d m V 2 d t = k V 2 m B
The kinetic parameters of Equation (2) are adjusted according to a range of 0 to −20 to 0 dB [10]. This aspect will be discussed in greater detail below. The Arrhenius law in Equation (1) describes the thermal degradation of wheat straw during the heating process. The model considers two zones: the heating rate and the pyrolysis or torrefaction temperature. Four experimental weight loss points are obtained for each treatment temperature in order to adjust them to the two-step kinetic model and the particle swarm optimization (PSO) algorithm in the case of individual parameters. Sixteen experimental data points were used for the global parameters.
Solving the ordinary differential equation provides the evolution of the weight of each pseudo-component as a function of time. The instantaneous solid yield, Y(T)(t) for any temperature T, can be calculated according to Equation (7):
Y T t = m A t + m B t + m C t m 0 × 100

2.2.2. Elemental Composition Model

In this study, the matrix (of the form AX = b) of Equation (8) is used to calculate the elemental composition (C, H, N, and O):
Y A 250 Y A 275 Y A 300 Y A 325 Y B 250 Y B 275 Y B 300 Y B 325 Y C 250 Y C 275 Y C 300 Y C 325 j × C A C B C C H A H B H C N A N B N C O A O B O C j = C S 250 C S 275 C S 300 C S 325 H S 250 H S 275 H S 300 H S 325 N S 250 N S 275 N S 300 N S 325 O S 250 O S 275 O S 300 O S 325 j
where A, B, and C represent the pseudo-components, and S is the torrefied biomass. Y(T) is the weight fraction of the solid yield, and X(T) is the elemental content at temperature T.
With information on the initial raw biomass and the final product of the torrefied biomass, both the weight loss fraction and the elemental analysis, it is possible to estimate the pseudo-components of the elemental composition for any study temperature and time point. The sum of the pseudo-components (A, B, and C) must be 100% at any given time [17,19]. The restrictions of Equations (9) and (10) help the algorithm of Equation (9) to converge better.
C B > C A H B < H A O B < O A
C C > C B H C < H B O C < O B

2.2.3. Higher Heating Value (HHV) Prediction

Knowing the instantaneous element, the dynamics of HHV behavior can be determined. The correlation of Equation (11) [47,48] is used to establish the HHV during the torrefaction process. The concentrations of carbon, hydrogen, and oxygen represent the weight percentages of carbon, hydrogen, and oxygen on an ash-free dry basis [21]; the concentration of nitrogen is small enough to be considered zero. Predicting the HHV (MJ/kg) is important because it provides insight into the potential of torrefied biomass as a solid fuel, as well as the quality of the process.
H H V = 1.3675 + 0.3137 × C + 0.7009 × H + 0.0318 × O

2.2.4. Energy Densification (ED)

Energy densification (ED) is calculated according to Equation (12), which relates the HHV of biomass at any point of the torrefaction process to the HHV of the raw biomass [11,33,49]. ED is considered an index of energy density improvement that examines the effectiveness of torrefaction.
E D = H H V t o r r e f i e d H H V r a w

2.2.5. Particle Swarm Optimization (PSO) Mathematical Model

The particle swarm optimization (PSO) algorithm is a metaheuristic technique commonly used in high-dimensional search spaces for nonlinear problems [40,50]. Based on the Arrhenius Equation (1), it is assumed that the factors A0 and Ea are independent of temperature. The calculation of Arrhenius kinetic parameters in a thermal degradation process using a two-step kinetic model is a complex problem that depends on the integrals of Equations (1)–(6), making the PSO algorithm a robust strategy for finding global optima for different isothermal temperatures. The PSO algorithm is initialized with a random number of particles defined within a search space. This search space will be defined in a range from −20 to 0 dB for the Arrhenius kinetic constants for wheat straw. The selection of this range for the kinetic constants is established to give greater importance to the most significant reactions occurring within the torrefaction process. In linear terms, according to Equation (1), by applying the natural logarithm on both sides of the equation, this range represents a variation of two orders of magnitude, which is consistent with the influence of different reaction stages observed experimentally and with typical values reported in the literature [10,14,19,42] for similar reactions within the proposed torrefaction temperature range. For each iteration, the PSO finds an optimal solution, and the particles are updated to their best local position (pbest) and their best global position (gbest). When these optimal values are found, the particles update their position and velocity according to Equations (13) and (14).
v i l + 1 = ω × Δ v i l + c 1 r a n d ( ) p b e s t i x i l + c 2 r a n d ( ) g b e s t i x i l
x i l + 1 = x i l + v i l + 1
Here, vi and xi are the velocity and position of the ith particle. The variable ω indicates the adjustment rate of the position change, j is the number of iterations performed by the algorithm, and the cognitive and social learning factors are the variables c1 and c2. Finally, rand() is a random number between 0 and 1.
As the objective function (OF) of the PSO algorithm, the least squares method is applied. This OF is used to predict the weight loss curve, according to Equation (15).
O F T = j = 1 n T G A exp , j T T G A cal , j T 2
Here, T is the isothermal torrefaction temperature; T G A exp , j T is the jth experimental data point for a sample of the percentage weight loss of wheat straw at a given temperature; T G A c a l , j T is the calculated percentage weight loss of the sample; and n symbolizes the number of data points measured experimentally.
To determine the degree of similarity between the weight loss curve calculated using the PSO algorithm and the actual weight loss curve obtained from experimental data, Equation (16), known as the quality of fit (fit), is used.
f i t % = 1 O F n T G A e x p ( ) m a x × 100 %
Here, T G A e x p ( ) m a x is the maximum weight loss percentage of the sample in the experiment.

2.2.6. Model Validation Metrics

To calculate relative errors, global errors (EGlobal) and individual errors (EIndividual) are implemented in Equations (17) and (18), respectively. Here, PREF represents the reference of real parameters for each elemental component at different temperatures. PGlobal and PIndividual are the elemental components calculated after the torrefaction process.
% E G l o b a l = P G l o b a l P R E F P R E F 100 %
% E I n d i v i d u a l = P I n d i v i d u a l P R E F P R E F 100 %

2.3. Mathematical Modeling Methodology

Figure 3 shows the numerical prediction section. To set up the PSO algorithm, the initial parameters selected were set to 500 particles, 500 iterations, and the search space was for the lower bound of A0 = 9 × 10⁴ and Ea = 9 × 10³ and at the upper bound of A0 = 9 × 1080 and Ea = 9 × 10⁶, for each of the Arrhenius ki constants. To obtain the adjustment curves for each proposed temperature, the PSO algorithm is studied in terms of accuracy by estimating the objective function (1.551 × 10⁻¹²), estimating computational efficiency by measuring the algorithm’s execution time (10.145 min), and estimating convergence efficiency with the adjustment (99.99996887%), and this methodology is shown in Figure 3. The initial search range of the PSO was adjusted to generate real values of k1, kV1, k2, and kV2 for wheat straw between −20 and 0 dB (0 > ki > −20 dB, where i = 1, 2, V1, and V2).
The numerical prediction section addresses four cases in this work: searching for Arrhenius parameters that help to establish degradation curves by weight loss at different isothermal torrefaction temperatures, finding the elemental composition (CHNO), predicting the higher heating value (HHV), and determining the densification energy (DE) of wheat straw.
In one approach, using “global Arrhenius parameters”, which consist of adjusting sixteen experimental values of the percentage weight loss for the study temperatures (250, 275, 300, and 325 °C), four experimental values for each isothermal temperature are determined, using the particle swarm optimization (PSO) algorithm. Considering the weight loss yields and the initial and final elemental analysis of wheat straw, it is possible to calculate the elemental component matrix X(T) as described in (8) for any instant of time, obtain the yields per temperature, and, consequently, perform predictions of the elemental components of the matrix and the HHV of Equation (11). A relationship is found between the atomic ratios of H/C and O/C and the torrefaction temperature.
On the other hand, when using “individual Arrhenius parameters”, the process is similar to that of global parameters, with the difference that, with the PSO algorithm, the Arrhenius parameters are obtained for each isothermal study temperature. Once a weight loss degradation curve is obtained for each temperature, the predictions of elemental components, the HHV, and ED are calculated.
Once the parameters and the Arrhenius kinetic constants are determined through individual or global analysis, the percentage weight loss functions, determined from Equation (8), are calculated for each isothermal torrefaction temperature. Using the percentage weight loss data and the initial and final values of the elemental analysis, the percentages of CHNO present in the wheat straw during the torrefaction process are predicted using Equation (9), and then the HHV and ED are predicted using Equations (11) and (12).

3. Results

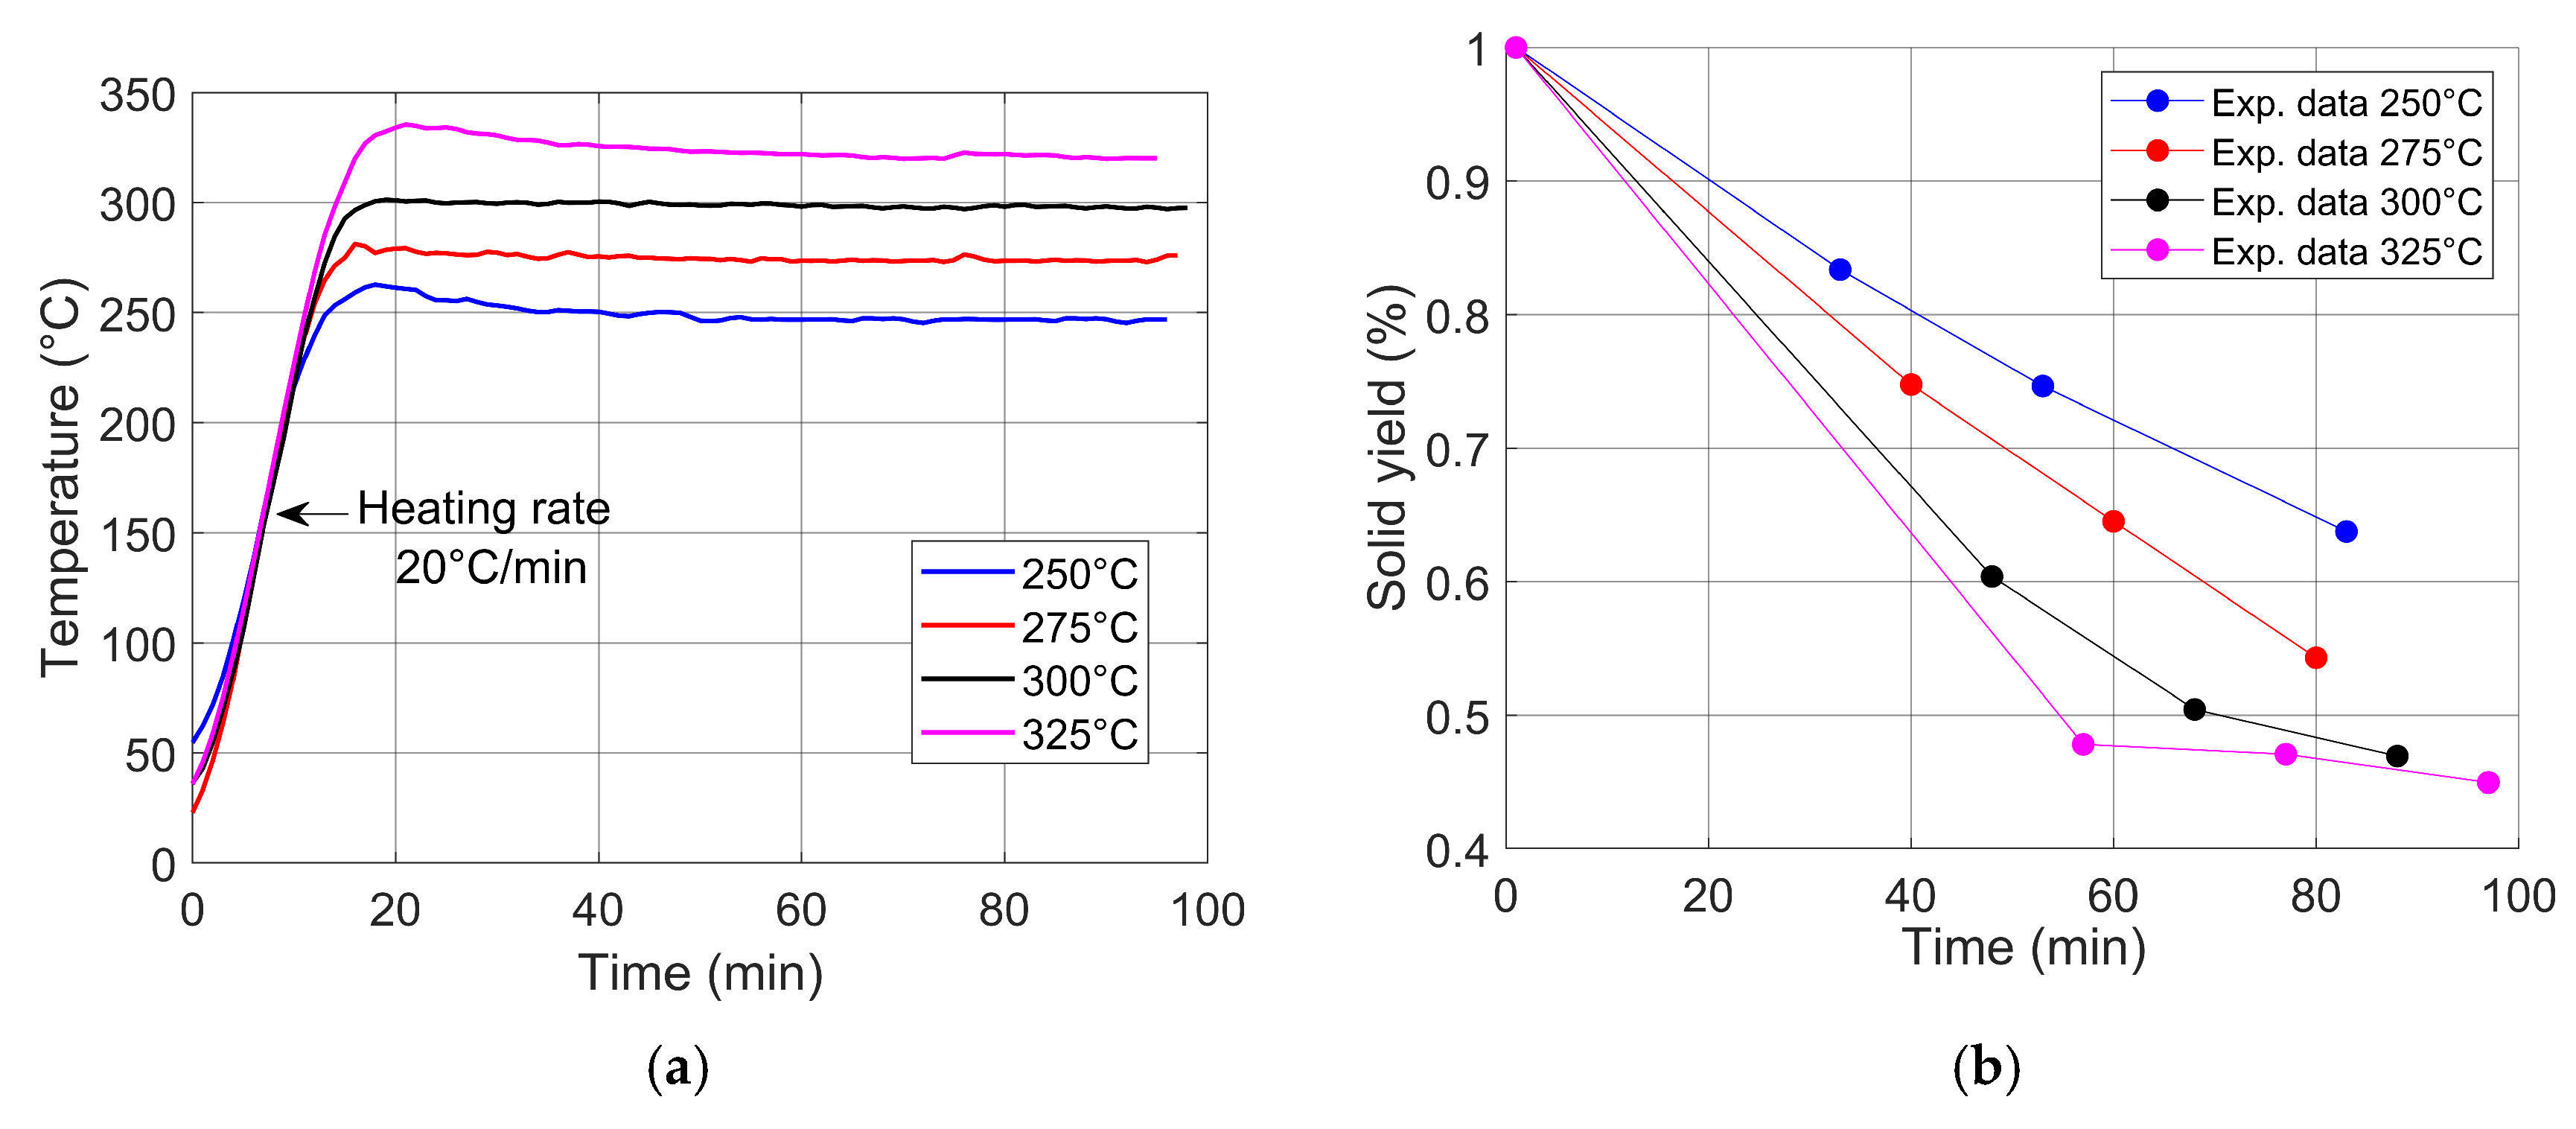
3.1. Isothermal Torrefaction

An isothermal torrefaction process was carried out to study wheat straw from room temperature to 250, 275, 300, and 325 °C. Figure 4 shows the data from the experiment. Figure 4a shows the graphs of the heating curves at a heating rate of 20 °C/min, while Figure 4b shows the weight data measured at different time intervals of an initial mass of 50 g. The following conditions were used: at 250 °C, blue line: 41.680 g at 33 min, 37.320 g at 53 min, and 31.380 g at 83 min; at 275 °C, red line: 37.375 g at 40 min, 32.262 g at 60 min, and 27.150 g at 80 min; at 300 °C, black line: 30.190 g at 48 min, 25.220 g at 68 min, and 23.470 g at 88 min; and at 325 °C, magenta line: 23.910 g at 57 min, 23.540 g at 77 min, and 22.480 g at 97 min. The m/mo ratio was used to normalize weight loss performance, representing the final weight (m) and the initial weight (mo). This indicates that there is a close relationship between temperature and weight loss; in other words, the higher the temperature, the greater the weight loss.

3.2. Properties of Torrefied Biomass

Table 3 shows the experimental data from the elemental analysis of raw and torrefied wheat straw at different isothermal temperatures. This is important for evaluating the quality of the process through energy densification. The elemental analysis shows a reduction in the proportion of oxygen in the biomass. Due to the change in elements during torrefaction, the table shows that the atomic ratios of O/C and H/C decreased.

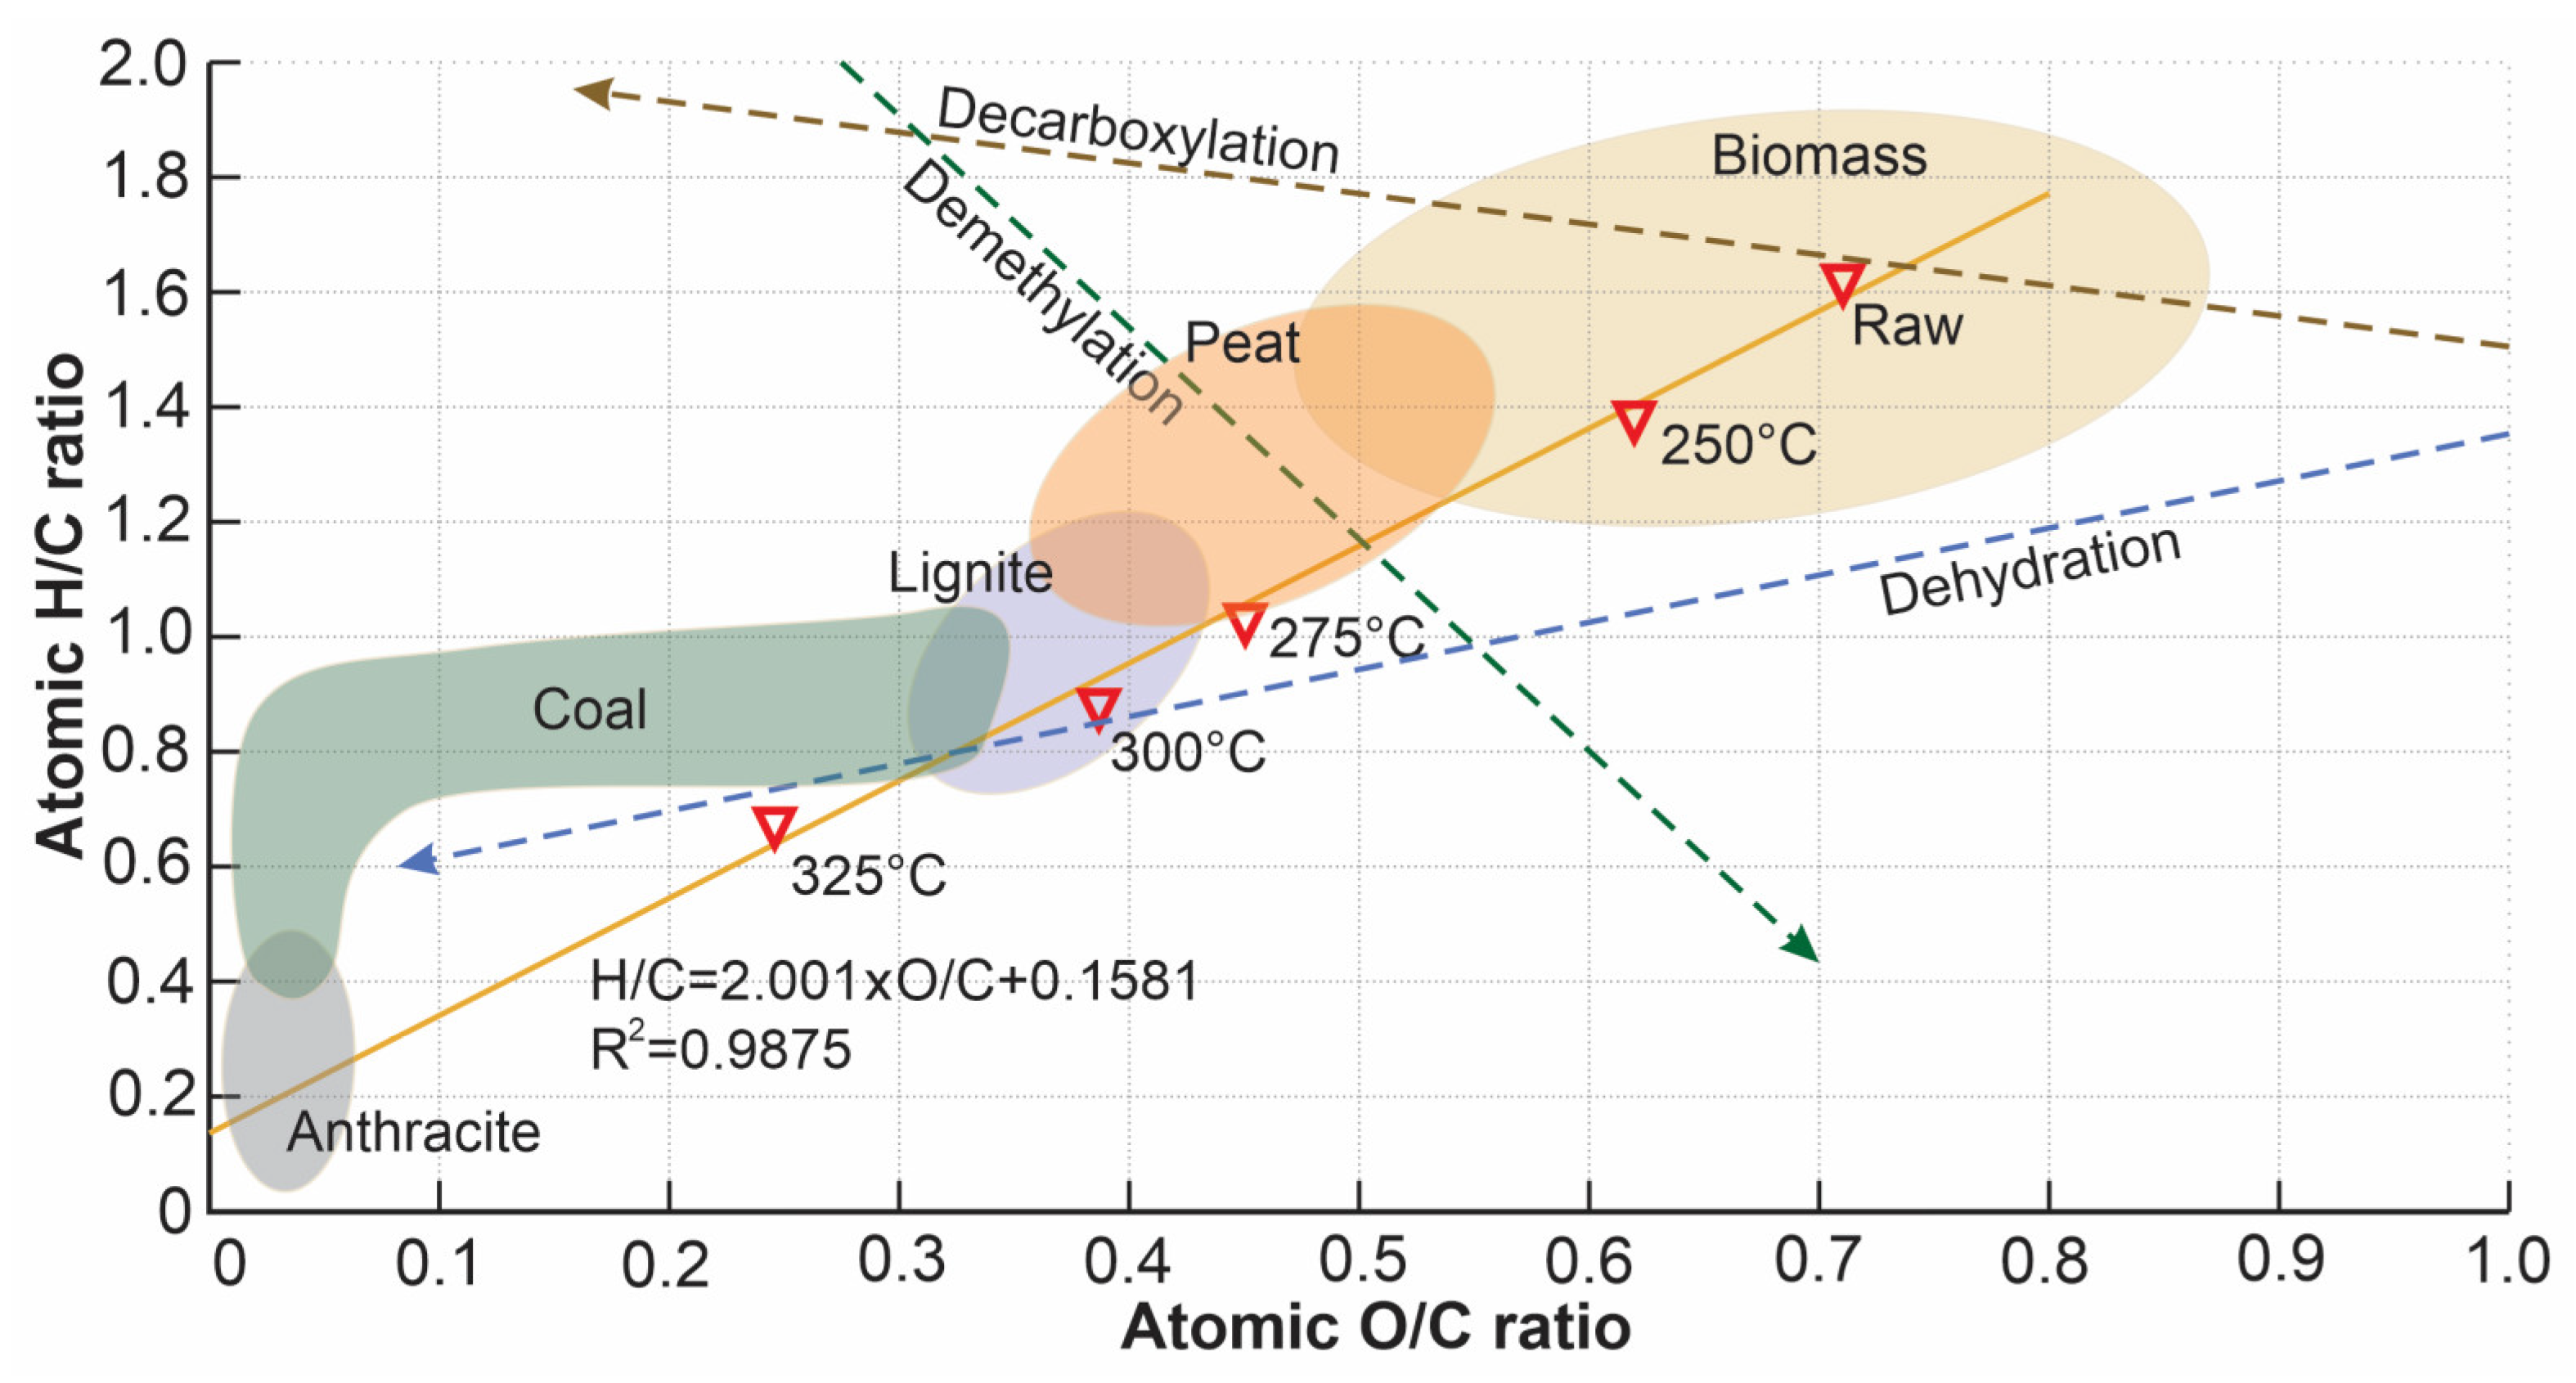
3.2.1. Van Krevelen Diagram

Atomic ratios H/C and O/C are indices that provide insight into the energy density of a torrefied biomass. Figure 5 shows a Van Krevelen diagram of the atomic ratios H/C (aromaticity) versus O/C (polarity) for each torrefaction temperature. Both atomic ratios decrease as the temperature increases, which means a degradation of carboxyl and hydroxyl groups. Some standard regions are illustrated to make a comparison between the product of torrefied wheat straw and some solid fuels; this provides information for understanding the reaction pathways. In this case, a process of dehydration occurs, combined with the cleavage of weak linkages between small substituents and the leading polymer chains [51].
The temperature ratio datasets are correlated, giving a coefficient of determination of 0.987. The slope of the correlation is 2.001, indicating that at higher torrefaction temperatures, the impact on the H/C and O/C ratio is greater by a factor of 2.0.

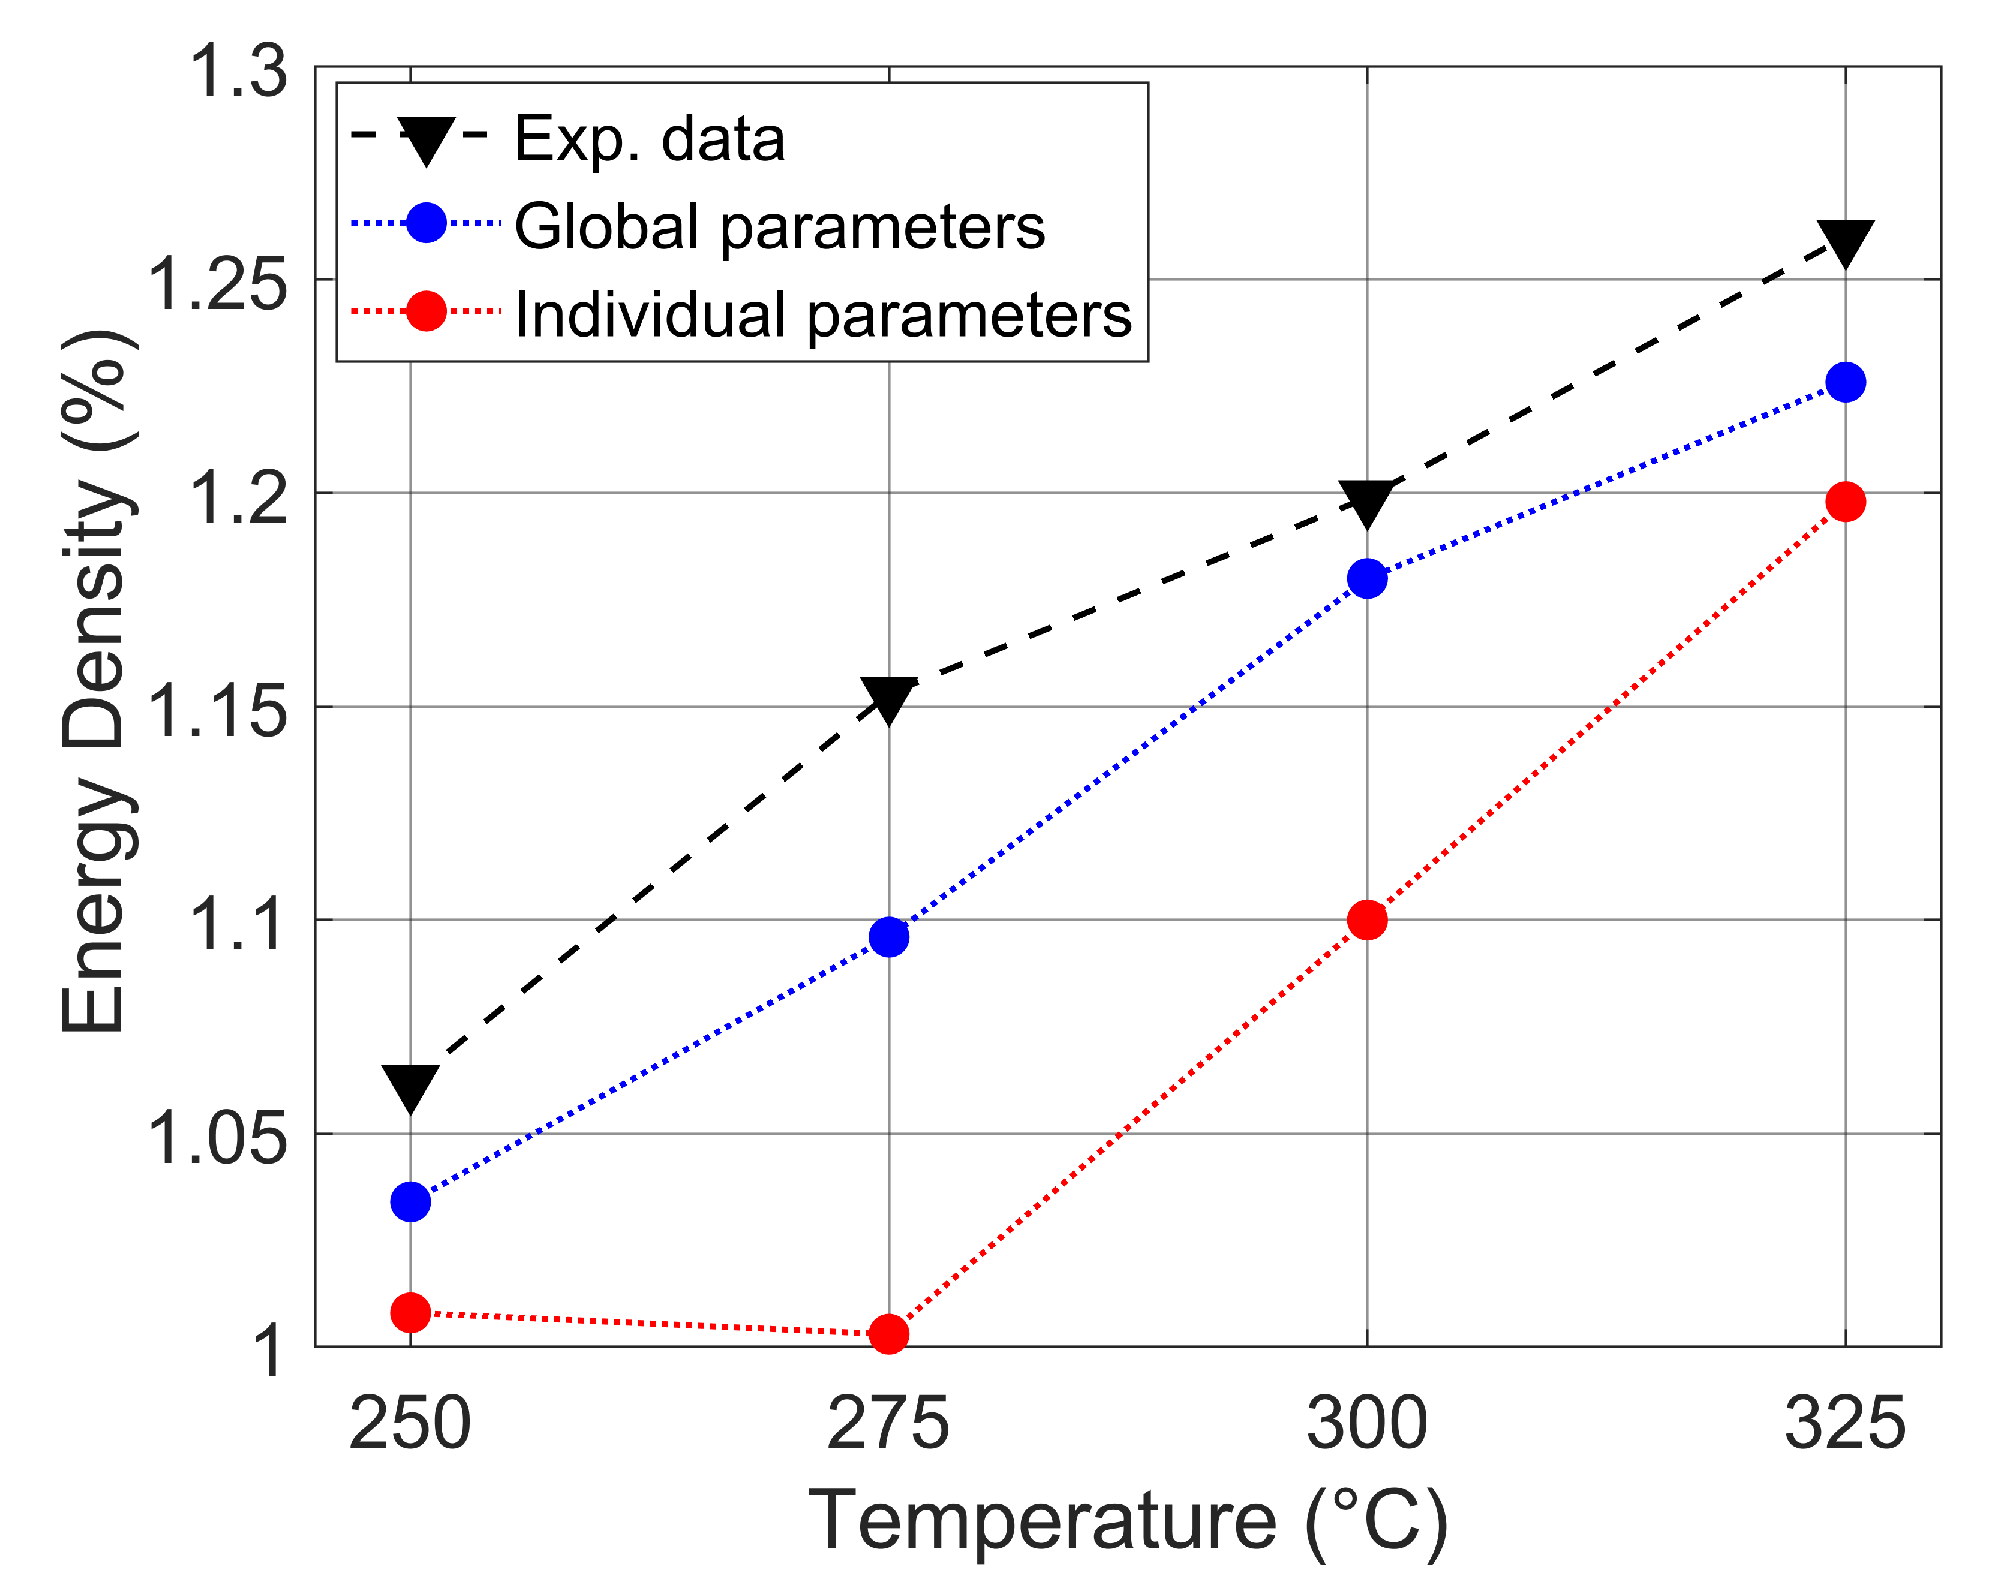
3.2.2. Energy Densification Results

The energy density of wheat straw increases as the isothermal torrefaction temperature increases. The O/C and H/C atomic ratios are low as the temperature increases. In addition, it has a low moisture content. Figure 6 shows the energy density ratios at torrefaction temperatures of 250, 275, 300, and 325 °C. The black represents the data obtained experimentally, with 1.034–1.259%; the blue curves were obtained from the analysis of the global parameters, with 1.034–1.226%; and the red curves were obtained from the individual parameters, with 1.009–1.198%. There is a close relationship between the torrefaction temperature and energy density. From the curves, the analysis used individual parameter deviations from the experimental data to a greater degree, with a mean relative error of 7.788, while when using global parameters, the mean relative error is 2.945. This is mainly due to the dependence of energy density on HHVs. At 275 °C, the error is significant due to errors in the prediction based on the analysis of the elemental components.

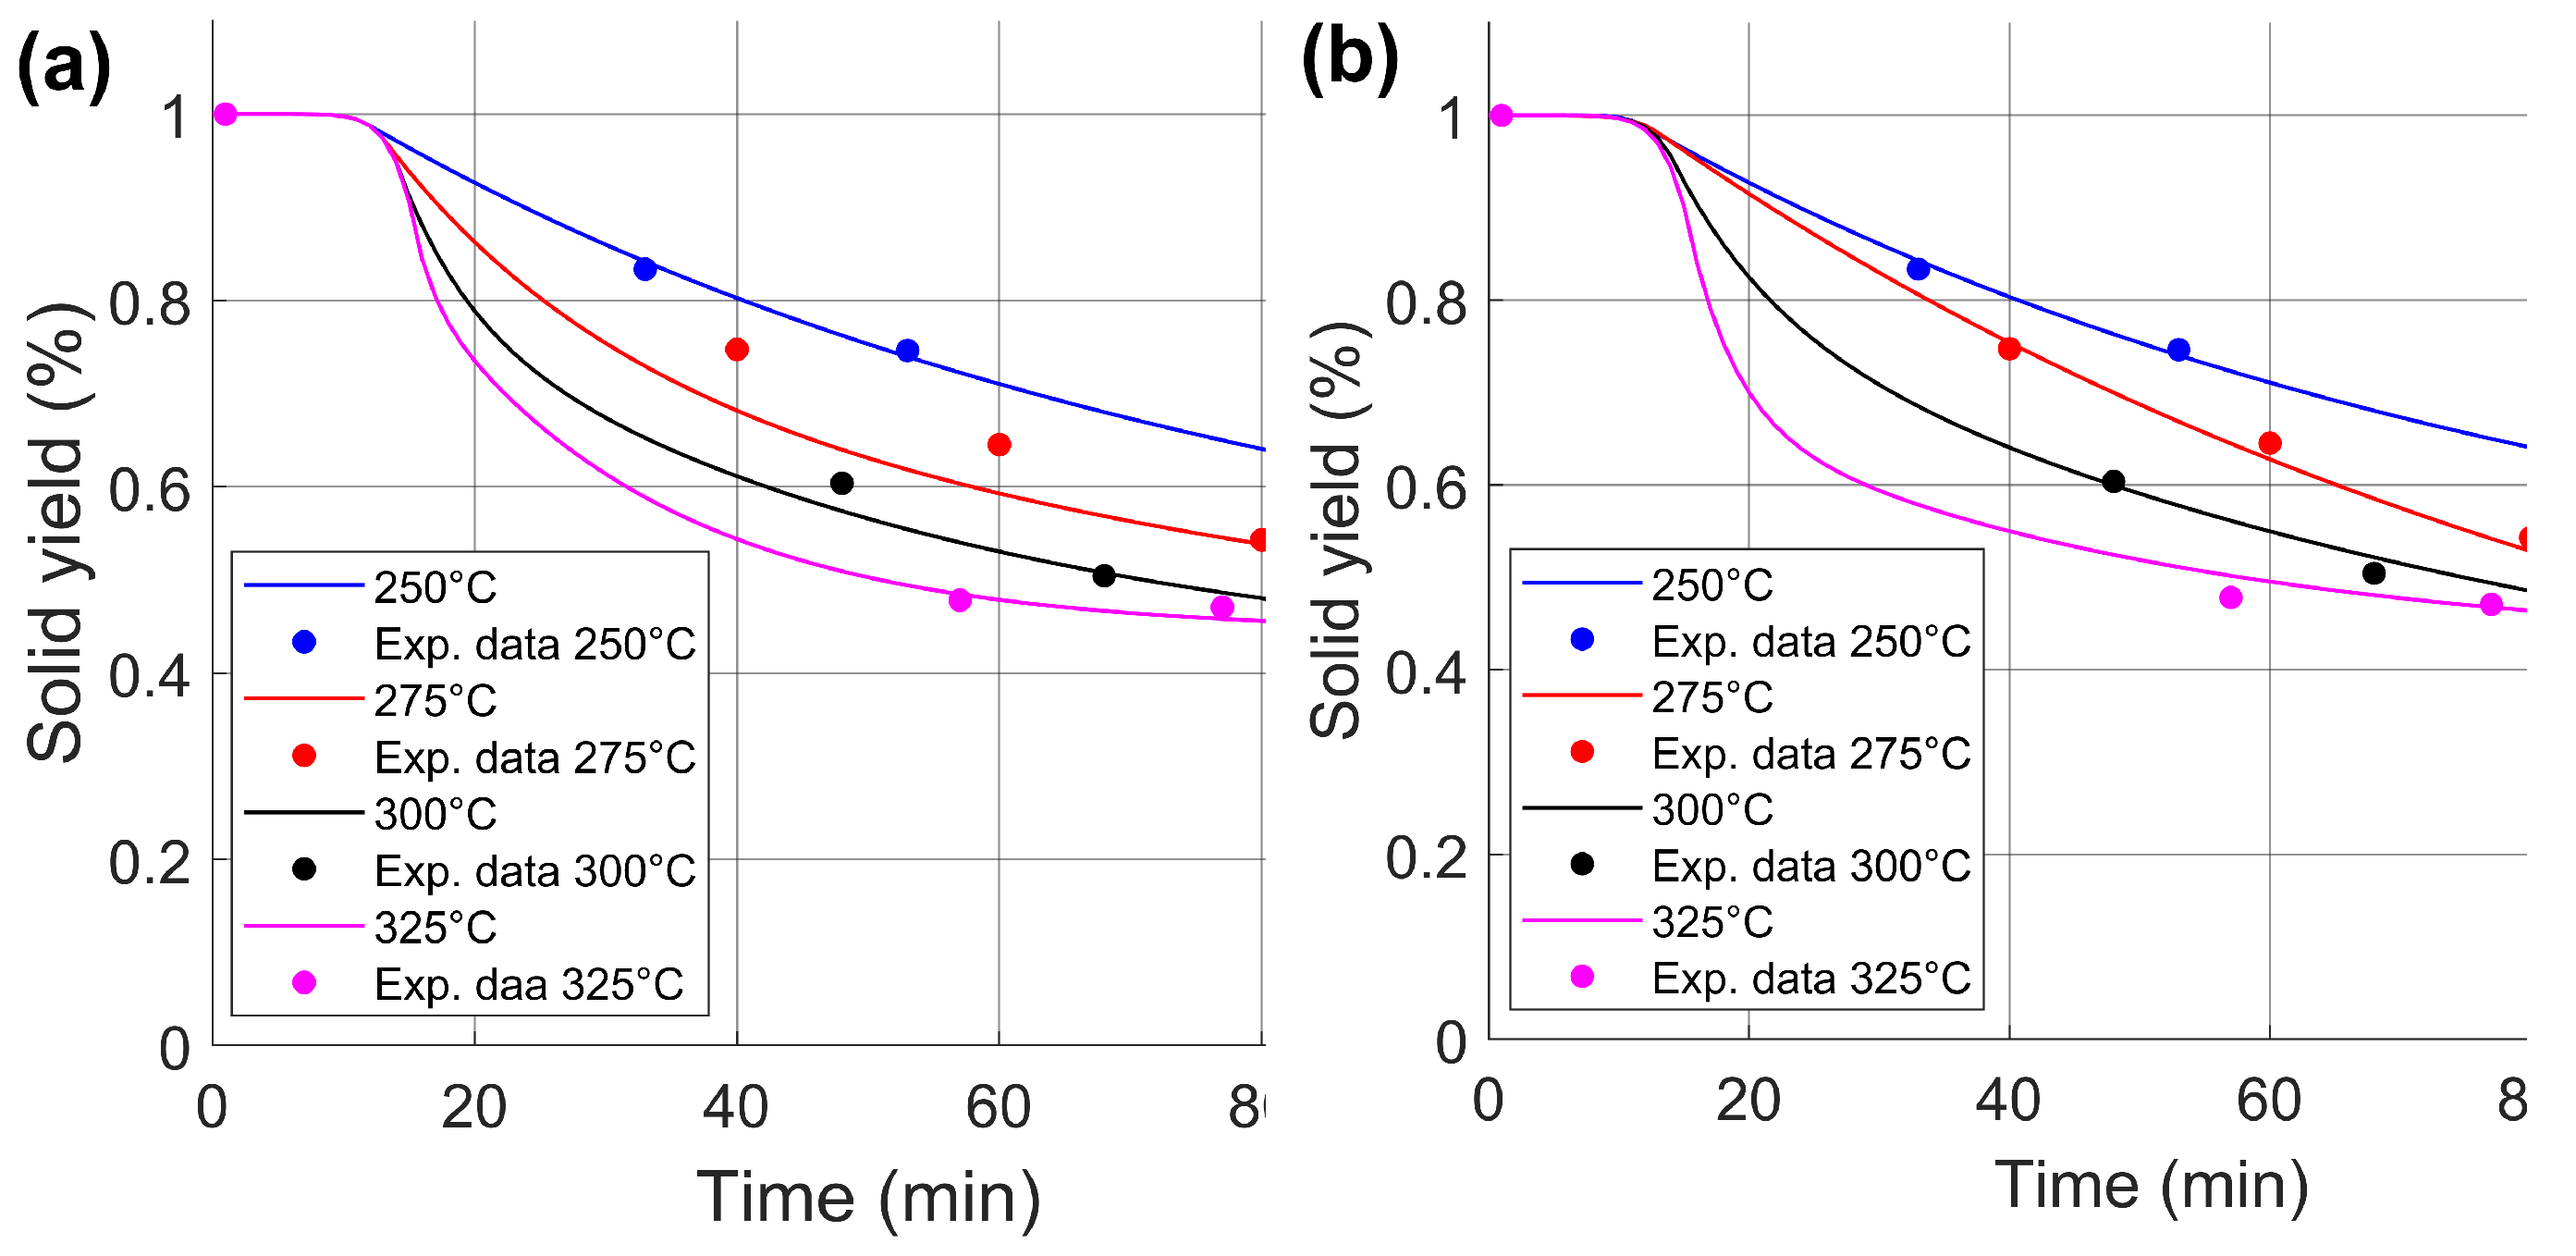
3.3. Torrefaction Kinetics Using PSO Algorithm

Global and individual parameters were obtained from the experimental results to compare their suitability, as shown in Table 4. The global parameter fitted is 99.99996887%, indicating an acceptable fit of the sixteen experimental data points to the two-step kinetic model. This means there is good predictive behavior for the torrefaction process at 250, 300, and 325 °C. However, for 275 °C, a major error is found, as shown in Figure 7a. For individual parameters, the error decreases significantly, as shown in Figure 7b; the fit is 99.99996187%, 98.07280000%, 99.99999997%, and 99.99048931% for 250, 275, 300, and 325 °C, respectively. Therefore, there is a better fit for individual Arrhenius parameters than for the global ones. However, the cumulative error when combining the individual parameters could be greater than that of the global one.
The model is validated by correlating the calculated torrefied mass with the experimental data, as shown in Figure 8. The global parameters maintained an R2 of 0.9998. For the individual parameters, an R2 of 0.9963 is obtained. This indicates that the correlation between the predicted weight loss and the experimental data provides better results for the global parameters.

3.4. Prediction of Properties of Torrefied Biomass

This section discusses how the two-step kinetic model and experimental results were used to predict the final properties of the torrefied biomass.

3.4.1. Elemental Composition Prediction

Based on the elemental composition data in Table 3, the composition of the torrefied biomass can be predicted for any isothermal temperature and point in time using Equation (8). The Matlab function fmincon was used to perform the prediction, as well as the restriction Equations (9) and (10).
Figure 9 shows the results of elemental composition profiles predicted according to the two-step kinetic model during the torrefaction of wheat straw for the case of global parameters. The blue line represents the torrefaction temperature of 250 °C, the red line, 275 °C, the black line, 300 °C, and the magenta line, 325 °C. The carbon content is enriched, the hydrogen and oxygen contents are reduced, and the nitrogen content increases. It can be seen that at higher torrefaction temperatures, the slopes of the elemental contents of the torrefied biomass increase or decrease sharply. This is due to the close relationship between temperature and the elemental content present in the biomass. In Figure 9d, corresponding to the nitrogen estimation, a reduction can be observed around minute 20, during the transition from the heating rate to the isothermal temperature. This is mainly because the PSO algorithm, when finding global parameters, presents errors in some areas of the solid yield fit due to experimental values obtained, as well as to the solution itself found by the algorithm at different temperatures. Despite these inconsistencies, the solution provides an approximate estimate of the behavior of nitrogen throughout the torrefaction process. Furthermore, these estimated inconsistencies in the nitrogen prediction at different torrefaction temperatures, according to Equation (11), do not influence the HHV prediction since nitrogen is not considered in the equation.
Using the data in Table 5, the relative error of each elemental component is calculated: 2.129% for carbon, 1.038% for hydrogen, 9.540% for nitrogen, and 3.977% for oxygen.
Figure 10 shows the results of the predicted elemental composition profiles for individual parameters. The blue line represents the torrefaction temperature of 250 °C, the red line, 275 °C, the black line, 300 °C, and the magenta line, 325 °C. The carbon and nitrogen content increases, while the hydrogen and oxygen content decreases. According to Equations (18) and (19), the prediction of the elemental composition of the final analysis has a relative error of 4.899% for carbon content, 6.371% for hydrogen content, 9.844% for nitrogen content, and 5.988% for oxygen content.
According to Table 5, considering the initial state of the wheat straw and the four isothermal torrefaction temperatures, the results provide the following predictions: for the global parameters, there is a maximum error of 37.052% for nitrogen at a temperature of 325 °C, a minimum error of 0.124% for oxygen in the raw biomass, and an average error of 4.171%, with a standard deviation of 7.871%; for the individual parameters, there is a maximum error of 36.693% for hydrogen at a temperature of 275 °C, a minimum error of 0.141% for carbon at a temperature of 325 °C, and an average error of 6.775%, with a standard deviation of 8.308%, for relative errors. As can be seen, both analyses show similar results. This is expected in the case of individual parameter analysis, as it presents better fits in the weight loss curves, which directly affects the prediction of the elemental components. However, the results show that global parameter adjustment is a valid option for estimating the elemental components in wheat straw.
However, in some cases, the errors obtained through global adjustments are larger than those obtained by individual adjustments. One advantage of the proposal is that with a small amount of experimental data at different temperatures, a good fit is achieved with the two-step kinetic model. In contrast, for example, in the case of global parameters, the adjustments were made in [19] with 30 data points, in [21] with 28 data points, and in [33] with 31 data points. In the case of individual parameters, the adjustments were implemented in [17] with 25 data points, in [14] with 48 data points, and in [41] with 124 data points. It was demonstrated that the prediction of a set of global parameters that satisfy the two-step kinetic model and the adjustment of the Arrhenius curves between −20 to 0 dB reduces the propagation of errors.

3.4.2. HHV Prediction

The results of the HHV prediction of wheat straw at different torrefaction temperatures (250, 275, 300, and 325 °C) are presented in Figure 11. The HHV is obtained from the elemental composition using the empirical Equation (10). The torrefaction treatment shows a dependence between temperature and time in the HHV analysis from raw material to the torrefied biomass. Global parameters are shown in Figure 11a, where the results range from 18.905 to 23.191 MJ·kg−1. Regarding individual parameters, in Figure 11b, the HHV results are between 19.724 and 23.615 MJ·kg−1. In both cases, the interval from 0 to 17 min corresponds to the time in which the heating rate (20 °C/min) reaches the torrefaction temperature. Subsequently, the HHV began to increase due to changes in the elemental composition of the wheat straw as the temperature increased. The results show that the carbon content increases while the oxygen content decreases.
Table 6 shows the values obtained from experimental data for raw biomass (18.535 MJ·kg−1) and torrefied biomass at the different study temperatures. In addition, the predicted HHVs are shown using global and individual parameter analysis. The relative errors between the experimental data and those obtained with the global and individual parameters were estimated to validate the prediction results. The results showed that the maximum relative error occurs at 275 °C in the individual parameters, with a value of 7.389. In contrast, the minimum relative error corresponds to the global parameters, with a value of 0.415 at 300 °C. The average relative error for the global parameters is 1.350, and for the individual parameters, it is 3.683. This is because the predictions for the global parameters show lower errors in elemental composition analysis.
It was found that by determining the kinetic parameters at a torrefaction temperature higher than the maximum peak observed in the derivative thermogravimetric (DTG) curve (275 °C), it is possible to predict the behavior of the process within the 250–325 °C range with an R-squared value corresponding to an error lower than 3%. This approach significantly reduces the number of required experiments from twelve to only four by relying on a single isothermal condition for parameter estimation.

4. Conclusions

Torrefaction has been proposed as an effective thermal pretreatment process for the thermochemical conversion of biomass. To optimize this process and predict the quality of biochar, a dual kinetic model based on Arrhenius law was developed to describe the torrefaction of wheat straw at different temperatures. The schemes using global and individual parameters were compared and used to predict the evolution of the elemental composition (CHNO) and the higher heating value (HHV) of the resulting biochar.
The results demonstrate that the proposed model accurately reproduces the experimental profiles, showing strong agreement between the predicted and observed values of elemental composition and HHV. During the torrefaction process, the O/C and H/C atomic ratios decreased as the temperature increased, followed by a dehydration process, causing an increase in energy densification when the temperature is higher.
Furthermore, it was found that by determining the kinetic parameters at a torrefaction temperature higher than the maximum peak observed in the derivative thermogravimetric (DTG) curve (i.e., 275 °C), it is possible to predict the behavior of the process within the 250–325 °C range with an R-squared value corresponding to an error lower than 3%. This approach significantly reduces the number of required experiments—from twelve to only four—by relying on a single isothermal condition for parameter estimation. Such a strategy enhances experimental efficiency and reinforces the model’s robustness for process design and optimization.
Biomass torrefaction can have environmental benefits in relation to carbon sequestration. Furthermore, the reduction in experiments to obtain the kinetic model, as was developed in the present study, drives economic benefits because the experimentation costs could be up to 75% less.

Limitations and Future Prospects

For future work, the proposed methodology will be applied to different types of biomass to establish a comparison with this and the new results obtained. Experiments will be conducted under different case studies in pyrolysis and co-pyrolysis, including heating rates and a wide range of temperatures (300–600 °C).

Author Contributions

I.U.-S. conducted the investigation and formal analysis, D.G.-L. and M.V.-R. established the methodology for the analysis, optimization, and prediction; C.A.R.-V. contributed to writing the first draft of the paper; D.A.R.-A. and D.G.-L. established the methodology for the analysis of the integrated system, supervised the project, and wrote the final version of the paper. All authors have read and agreed to the published version of the manuscript.

Funding

This research received no external funding.

Data Availability Statement

The original contributions presented in the study are included in the article; further inquiries can be directed to the corresponding author.

Acknowledgments

D. A. Rodriguez-Alejandro, D. Granados-Lieberman, M. Valtierra-Rodríguez, and C.A. Ramírez-Valdespino gratefully acknowledge the financial support of the Secretariat of Science, Humanities, Technology and Innovation (SECIHTI), Mexico, under its SNII program. I. Urbina-Salas also acknowledges the financial support of SECIHTI, under its national scholarship program under Grant No. 843043 (CVU-331945).

Conflicts of Interest

The authors declare no conflicts of interest. The funders had no role in the design of the study; in the collection, analyses, or interpretation of the data; in the writing of the manuscript; or in the decision to publish the results.

Abbreviations

The following abbreviations are used in this manuscript:
PSOParticle Swarm Optimization
CCarbon
HHydrogen
OOxygen
NNitrogen
HHVHigh Heating Value
TGAThermogravimetric Analysis
DTGDerived Thermogravimetric Analysis
DCDecarbonization
DHDehydrogenation
DODeoxygenation
CFDComputational Fluid Dynamics
MLMachine Learning
AIArtificial Intelligence
LSRLeast Squares Regression
SSESum of Squares Regression
EDEnergy Densification
TTemperature

Nomenclature

The following nomenclature is used in this manuscript:
kiArrhenius constant (min−1)
AoPre-exponential parameter (min−1)
EaActivation energy (J·mol−1)
RUniversal constant (8.314 J·K−1·mol−1)
Y(T)Solid yield and volatiles
mMass (g)
v i l + 1 Velocity of the ith particle
x i l + 1 Position of the ith particle
lIterations
ithith particles
wRate of adjustment of the change in position
c1 and c2Cognitive and social learning factors
rand()Random number
OFObjective function
T G A exp , j ( T ) jth experimental data
T G A cal , j ( T ) jth calculated data
nNumber of data points
fitFit quality
%EPercentage of relative error
PGlobalGlobal parameters
PIndiviadualIndividual parameters

References

  1. Naveed, M.H.; Gul, J.; Khan, M.N.A.; Naqvi, S.R.; Štěpanec, L.; Ali, I. Torrefied biomass quality prediction and optimization using machine learning algorithms. Chem. Eng. J. Adv. 2024, 19, 100620. [Google Scholar] [CrossRef]
  2. Kota, K.B.; Shenbagaraj, S.; Sharma, P.K.; Sharma, A.K.; Ghodke, P.K.; Chen, W.H. Biomass torrefaction: An overview of process and technology assessment based on global readiness level. Fuel 2022, 324, 124663. [Google Scholar] [CrossRef]
  3. Mpungu, I.L.; Maube, O.; Nziu, P.; Mwasiagi, J.I.; Dulo, B.; Bongomin, O. Optimizing Waste for Energy: Exploring Municipal Solid Waste Variations on Torrefaction and Biochar Production. Int. J. Energy Res. 2024, 2024, 4311062. [Google Scholar] [CrossRef]
  4. Gonzales, T.D.S.; Monteiro, S.; Lamas, G.C.; Rodrigues, P.P.; Siqueira, M.B.; Follegatti-Romero, L.A.; Silveira, E.A. Simulation and Thermodynamic Evaluation of Woody Biomass Waste Torrefaction. ACS Omega 2025, 10, 3585. [Google Scholar] [CrossRef]
  5. Safar, M.; Chen, W.H.; Raclavska, H.; Juchelkova, D.; Prokopova, N.; Rachmadona, N.; Khoo, K.S. Overview of the use of additives in biomass torrefaction processes: Their impact on products and properties. Fuel 2024, 374, 132419. [Google Scholar] [CrossRef]
  6. Zhang, C.; Ho, S.H.; Chen, W.H.; Xie, Y.; Liu, Z.; Chang, J.S. Torrefaction performance and energy usage of biomass wastes and their correlations with torrefaction severity index. Appl. Energy 2018, 220, 598–604. [Google Scholar] [CrossRef]
  7. García Nieto, P.J.; García-Gonzalo, E.; Paredes-Sánchez, J.P.; Bernardo Sánchez, A.; Menéndez Fernández, M. Predictive modelling of the higher heating value in biomass torrefaction for the energy treatment process using machine-learning techniques. Neural Comput. Appl. 2019, 31, 8823–8836. [Google Scholar] [CrossRef]
  8. Basu, P.; Sadhukhan, A.K.; Gupta, P.; Rao, S.; Dhungana, A.; Acharya, B. An experimental and theoretical investigation on torrefaction of a large wet wood particle. Bioresour. Technol. 2014, 159, 215–222. [Google Scholar] [CrossRef]
  9. Lin, B.J.; Colin, B.; Chen, W.H.; Pétrissans, A.; Rousset, P.; Pétrissans, M. Thermal degradation and compositional changes of wood treated in a semi-industrial scale reactor in vacuum. J. Anal. Appl. Pyrolysis 2018, 130, 8–18. [Google Scholar] [CrossRef]
  10. Rodríguez-Alejandro, D.A.; Nam, H.; Granados-Lieberman, D.; Wang, S.; Hwang, S.C.; Nam, H.; Capareda, S.C. Experimental and numerical investigation on a solar-driven torrefaction reactor using woody waste (Ashe Juniper). Energy Convers. Manag. 2023, 288, 117114. [Google Scholar] [CrossRef]
  11. Wnorowska, J.; Ciukaj, S.; Kalisz, S. Thermogravimetric analysis of solid biofuels with additive under air atmosphere. Energies 2021, 14, 2257. [Google Scholar] [CrossRef]
  12. Parthasarathy, P.; Alherbawi, M.; Pradhan, S.; Al-Ansari, T.; Mackey, H.R.; McKay, G. Pyrolysis characteristics, kinetic, and thermodynamic analysis of camel dung, date stone, and their blend using thermogravimetric analysis. Biomass Convers. Biorefinery 2022, 1–18. [Google Scholar] [CrossRef]
  13. Yen, S.W.; Chen, W.H.; Chang, J.S.; Eng, C.F.; Raza Naqvi, S.; Show, P.L. Torrefaction thermogravimetric analysis and kinetics of sorghum distilled residue for sustainable fuel production. Sustainability 2021, 13, 4246. [Google Scholar] [CrossRef]
  14. Lin, B.J.; Silveira, E.A.; Colin, B.; Chen, W.H.; Lin, Y.Y.; Leconte, F.; Petrissans, M. Modeling and prediction of devolatilization and elemental composition of wood during mild pyrolysis in a pilot-scale reactor. Ind. Crops Prod. 2019, 131, 357–370. [Google Scholar] [CrossRef]
  15. Chai, M.; Xie, L.; Yu, X.; Zhang, X.; Yang, Y.; Rahman, M.M.; Cai, J. Poplar wood torrefaction: Kinetics, thermochemistry and implications. Renew. Sustain. Energy Rev. 2021, 143, 110962. [Google Scholar]
  16. Zhang, S.; Chen, T.; Xiong, Y.; Dong, Q. Effects of wet torrefaction on the physicochemical properties and pyrolysis product properties of rice husk. Energy Convers. Manag. 2017, 141, 403–409. [Google Scholar] [CrossRef]
  17. Bach, Q.V.; Chen, W.H.; Chu, Y.S.; Skreiberg, Ø. Predictions of biochar yield and elemental composition during torrefaction of forest residues. Bioresour. Technol. 2016, 215, 239–246. [Google Scholar] [CrossRef]
  18. Xu, J.; Huang, M.; Hu, Z.; Zhang, W.; Li, Y.; Yang, Y.; Ma, Z. Prediction and modeling of the basic properties of biomass after torrefaction pretreatment. J. Anal. Appl. Pyrolysis 2021, 159, 105287. [Google Scholar] [CrossRef]
  19. Silveira, E.A.; Luz, S.M.; Leão, R.M.; Rousset, P.; Caldeira-Pires, A. Numerical modeling and experimental assessment of sustainable woody biomass torrefaction via coupled TG-FTIR. Biomass Bioenergy 2021, 146, 105981. [Google Scholar]
  20. Silveira, E.A.; Lamas, G.C.; Rodrigues, P.P.D.O.; Souto, N.P.; Chaves, B.S.A.; Galvão, L.G.O.; de Paula Protásio, T. Effect of torrefaction severity on the energy recovery from amazonian wood residues for decentralized energy conversion systems. Biomass Bioenergy 2025, 193, 107515. [Google Scholar] [CrossRef]
  21. Lin, B.J.; Silveira, E.A.; Colin, B.; Chen, W.H.; Pétrissans, A.; Rousset, P.; Pétrissans, M. Prediction of higher heating values (HHVs) and energy yield during torrefaction via kinetics. Energy Procedia 2019, 158, 111–116. [Google Scholar] [CrossRef]
  22. Adeleke, A.A.; Odusote, J.K.; Ikubanni, P.P.; Lasode, O.A.; Malathi, M.; Paswan, D. Essential basics on biomass torrefaction, densification and utilization. Int. J. Energy Res. 2021, 45, 1375–1395. [Google Scholar] [CrossRef]
  23. Santos, D.C.; Evaristo, R.B.; Dutra, R.C.; Suarez, P.A.; Silveira, E.A.; Ghesti, G.F. Advancing Biochar Applications: A Review of Production Processes, Analytical Methods, Decision Criteria, and Pathways for Scalability and Certification. Sustainability 2025, 17, 2685. [Google Scholar] [CrossRef]
  24. Chen, W.H.; Lin, B.J.; Lin, Y.Y.; Chu, Y.S.; Ubando, A.T.; Show, P.L.; Pétrissans, M. Progress in biomass torrefaction: Principles, applications and challenges. Prog. Energy Combust. Sci. 2021, 82, 100887. [Google Scholar] [CrossRef]
  25. Okolie, J.A.; Epelle, E.I.; Nanda, S.; Castello, D.; Dalai, A.K.; Kozinski, J.A. Modeling and process optimization of hydrothermal gasification for hydrogen production: A comprehensive review. J. Supercrit. Fluids 2021, 173, 105199. [Google Scholar] [CrossRef]
  26. Ascher, S.; Watson, I.; You, S. Machine learning methods for modelling the gasification and pyrolysis of biomass and waste. Renew. Sustain. Energy Rev. 2022, 155, 111902. [Google Scholar] [CrossRef]
  27. Sangare, D.; Bostyn, S.; Moscosa-Santillan, M.; Gökalp, I. Hydrodynamics, heat transfer and kinetics reaction of CFD modeling of a batch stirred reactor under hydrothermal carbonization conditions. Energy 2021, 219, 119635. [Google Scholar] [CrossRef]
  28. Patra, T.K.; Sheth, P.N. Biomass gasification models for downdraft gasifier: A state-of-the-art review. Renew. Sustain. Energy Rev. 2015, 50, 583–593. [Google Scholar] [CrossRef]
  29. Chen, W.H.; Lin, Y.X.; Chiou, Y.B.; Lin, Y.L.; Wang, X.D. A computational fluid dynamics (CFD) approach of thermoelectric generator (TEG) for power generation. Appl. Therm. Eng. 2020, 173, 115203. [Google Scholar] [CrossRef]
  30. Perera, S.M.; Wickramasinghe, C.; Samarasiri, B.K.T.; Narayana, M. Modeling of thermochemical conversion of waste biomass—A comprehensive review. Biofuel Res. J. 2021, 8, 1481–1528. [Google Scholar] [CrossRef]
  31. Naqvi, S.R.; Ullah, Z.; Taqvi, S.A.A.; Khan, M.N.A.; Farooq, W.; Mehran, M.T.; Štěpanec, L. Applications of machine learning in thermochemical conversion of biomass-A review. Fuel 2023, 332, 126055. [Google Scholar]
  32. Tang, Q.; Chen, Y.; Yang, H.; Liu, M.; Xiao, H.; Wang, S.; Naqvi, S.R. Machine learning prediction of pyrolytic gas yield and compositions with feature reduction methods: Effects of pyrolysis conditions and biomass characteristics. Bioresour. Technol. 2021, 339, 125581. [Google Scholar] [CrossRef] [PubMed]
  33. Gul, S.; Ramzan, N.; Hanif, M.A.; Bano, S. Kinetic, volatile release modeling and optimization of torrefaction. J. Anal. Appl. Pyrolysis 2017, 128, 44–53. [Google Scholar] [CrossRef]
  34. Bates, R.B.; Ghoniem, A.F. Biomass torrefaction: Modeling of reaction thermochemistry. Bioresour. Technol. 2013, 134, 331–340. [Google Scholar] [CrossRef]
  35. Lagarias, J.C.; Reeds, J.A.; Wright, M.H.; Wright, P.E. Convergence properties of the Nelder-Mead simplex method in low dimensions. SIAM J. Optim. 1998, 9, 112–147. [Google Scholar] [CrossRef]
  36. Wu, Z.; Zhu, G.; Peng, M.; Zhu, Y.; Miao, W.; Li, D.; Chen, F. Kinetic analysis and calculation correction methods for moisture evaporation rate in pine lignocellulosic biomass. Case Stud. Therm. Eng. 2024, 61, 104985. [Google Scholar] [CrossRef]
  37. Luersen, M.A.; Le Riche, R. Globalized Nelder–Mead method for engineering optimization. Comput. Struct. 2004, 82, 2251–2260. [Google Scholar] [CrossRef]
  38. Chen, W.H.; Eng, C.F.; Lin, Y.Y.; Bach, Q.V. Independent parallel pyrolysis kinetics of cellulose, hemicelluloses and lignin at various heating rates analyzed by evolutionary computation. Energy Convers. Manag. 2020, 221, 113165. [Google Scholar] [CrossRef]
  39. Xu, L.; Jiang, Y.; Wang, L. Thermal decomposition of rape straw: Pyrolysis modeling and kinetic study via particle swarm optimization. Energy Convers. Manag. 2017, 146, 124–133. [Google Scholar] [CrossRef]
  40. Chen, W.H.; Eng, C.F.; Lin, Y.Y.; Bach, Q.V.; Ashokkumar, V.; Show, P.L. Two-step thermodegradation kinetics of cellulose, hemicelluloses, and lignin under isothermal torrefaction analyzed by particle swarm optimization. Energy Convers. Manag. 2021, 238, 114116. [Google Scholar] [CrossRef]
  41. Shang, L.; Ahrenfeldt, J.; Holm, J.K.; Barsberg, S.; Zhang, R.Z.; Luo, Y.H.; Henriksen, U.B. Intrinsic kinetics and devolatilization of wheat straw during torrefaction. J. Anal. Appl. Pyrolysis 2013, 100, 145–152. [Google Scholar] [CrossRef]
  42. Silveira, E.A.; Lin, B.J.; Colin, B.; Chaouch, M.; Pétrissans, A.; Rousset, P.; Pétrissans, M. Heat treatment kinetics using three-stage approach for sustainable wood material production. Ind. Crops Prod. 2018, 124, 563–571. [Google Scholar] [CrossRef]
  43. National Digital Strategy Coordination of Mexico. 2025. Available online: https://www.gob.mx/siap/ (accessed on 1 April 2025).
  44. Di Blasi, C.; Lanzetta, M. Intrinsic kinetics of isothermal xylan degradation in inert atmosphere. J. Anal. Appl. Pyrolysis 1997, 40, 287–303. [Google Scholar] [CrossRef]
  45. Tian, X.; Dai, L.; Wang, Y.; Zeng, Z.; Zhang, S.; Jiang, L.; Ruan, R. Influence of torrefaction pretreatment on corncobs: A study on fundamental characteristics, thermal behavior, and kinetic. Bioresour. Technol. 2020, 297, 122490. [Google Scholar] [CrossRef]
  46. Bates, R.B.; Ghoniem, A.F. Biomass torrefaction: Modeling of volatile and solid product evolution kinetics. Bioresour. Technol. 2012, 124, 460–469. [Google Scholar] [CrossRef] [PubMed]
  47. Sheng, C.; Azevedo, J.L.T. Estimating the higher heating value of biomass fuels from basic analysis data. Biomass Bioenergy 2005, 28, 499–507. [Google Scholar] [CrossRef]
  48. Mendonça, I.F.; do Vale, G.S.; Evaristo, R.B.; Dutra, R.C.; de Oliveira Rodrigues, P.P.; Silveira, E.A.; Ghesti, G. Optimizing torrefaction of banana waste (peels and rachis) for sustainable biocoal production in rural communities. Biomass Bioenergy 2025, 196, 107726. [Google Scholar] [CrossRef]
  49. Ozonoh, M.; Oboirien, B.O.; Daramola, M.O. Optimization of process variables during torrefaction of coal/biomass/waste tyre blends: Application of artificial neural network & response surface methodology. Biomass Bioenergy 2020, 143, 105808. [Google Scholar]
  50. Liu, J.L.; Lin, J.H. Evolutionary computation of unconstrained and constrained problems using a novel momentum-type particle swarm optimization. Eng. Optim. 2007, 39, 287–305. [Google Scholar] [CrossRef]
  51. Martínez, M.G.; Couce, A.A.; Dupont, C.; da Silva Perez, D.; Thiéry, S.; Meyer, X.M.; Gourdon, C. Torrefaction of cellulose, hemicelluloses and lignin extracted from woody and agricultural biomass in TGA-GC/MS: Linking production profiles of volatile species to biomass type and macromolecular composition. Ind. Crops Prod. 2022, 176, 114350. [Google Scholar] [CrossRef]
Figure 1. (a) A map of Mexico highlighting Guanajuato state as a producer of wheat, (b) chemical analysis of wheat straw, (c) Thermo Fisher Scientific TGA equipment for studying wheat straw, and (d) TGA and TDG curves of wheat straw pyrolysis at a heating rate of 10 °C/min in air, at temperatures of 25–800 °C, with a residence time of 80 min.
Algorithms 18 00283 g001
Figure 2. Torrefaction experiments: (a) raw wheat straw, (b) torrefaction process, and (c) numerical modeling.
Algorithms 18 00283 g002
Figure 3. Numerical prediction methodology: (a) numerical modeling and (b) PSO algorithm.
Algorithms 18 00283 g003
Figure 4. Experimental data: (a) temperature curves at a heating rate of 20 °C/min, with isothermal temperatures of 250, 275, 300, and 325 °C; (b) solid yield at different temperatures and torrefaction times.
Algorithms 18 00283 g004
Figure 5. Van Krevelen diagram of torrefied biomass.
Algorithms 18 00283 g005
Figure 6. The energy density of wheat straw at different torrefaction temperatures.
Algorithms 18 00283 g006
Figure 7. Solid yield prediction curves and normalized solid yield experimental data of wheat straw at different study temperatures under the schemes of (a) global parameters and (b) individual parameters.
Algorithms 18 00283 g007
Figure 8. Correlation plots of experimental and calculated weight loss data: (a) fit by global kinetic parameters and (b) fit by individual parameters.
Algorithms 18 00283 g008
Figure 9. Prediction curves of the dynamics of the elemental composition percentage for global parameters: (a) carbon, (b) hydrogen, (c) oxygen, and (d) nitrogen.
Algorithms 18 00283 g009
Figure 10. Prediction curves of the dynamics of the elemental composition percentage for individual parameters: (a) carbon, (b) hydrogen, (c) oxygen, and (d) nitrogen.
Algorithms 18 00283 g010
Figure 11. Study of HHV prediction curves for wheat straw at different torrefaction temperatures: (a) global kinetic parameters and (b) individual parameters.
Algorithms 18 00283 g011
Table 1. Summary of global and individual kinetic parameter studies on two-step isothermal torrefaction models.
BiomassTemperature and Residence TimeOptimization AlgorithmAnalysis of Kinetic ParametersPseudo-Comp.
Description
Ref.
Ashe Juniper210–380 °C,
for 160 min
Nelder–MeadGlobalSolid yield and elemental composition prediction[10]
Eucalyptus Grandis210–290 °C,
for 80 min
Nelder–MeadGlobalSolid yield and elemental composition prediction[19]
Xylan200–300 °C,
for 120 min
PSOIndividualSolid yield[40]
Sorghum200–300 °C,
for 60 min
PSOIndividualSolid yield[13]
Poplar and
Fir
200–300 °C,
for 1740 min
Nelder–MeadGlobalSolid yield and elemental composition prediction[14]
Poplar200–230 °C,
for 1740 min
Nelder–MeadGlobalSolid yield and elemental composition prediction[21]
Poplar and Xylan200–240 °C,
for 600 min
Nelder–MeadGlobal and IndividualSolid yield[42]
Beech, Pine, Wheat, and
Willow
200–300 °C,
for 300 min
Least Squares RegressionGlobalSolid yield and elemental composition prediction[33]
Spruce and Birch220–300 °C,
for 120 min
Sum of Squares ErrorsIndividualSolid yield and elemental composition prediction[17]
Wheat Straw250–300 °C,
for 100 min
Nelder–Mead
lsqcurvefit
IndividualSolid yield[41]
Table 2. Properties of raw wheat straw (dry basis *).
BiomassWheat StrawAnalytic Method
Proximate analysis (%wt)
Humidity8.590 ± 0.568ASTM E871-82
Volatile matter (VM)69.930 ± 0.256ASTM E872-82
Fixed carbon (FC)18.250 ± 1.670ASTM E1775
Ash3.220 ± 0.351
Elemental composition (%wt)
Carbon46.205Thermo Scientific
iCAP 7400 ICP-OES analyzer
Hydrogen6.275
Oxygen (by difference)43.908
Nitrogen3.612
HHV (MJ·kg−1, *)18.535 ± 0.436ASTM D5865
Table 3. Elemental analysis of wheat straw torrefaction.
Temperature (°C)Ultimate Analysis (%wt), Dry-Ash-FreeHHV
(MJ·kg−1)
O/CH/C
CHNO a
raw46.2056.2753.61243.90818.535 ± 0.4360.7131.623
25049.5735.7153.72140.99119.689 ± 0.7590.6201.383
27557.0894.8933.80634.21221.373 ± 0.0440.4501.028
30060.1274.4134.76130.69922.239 ± 0.0870.3830.881
32568.5964.0077.92222.47523.341 ± 0.1560.2460.701
a by difference.
Table 4. Global and individual Arrhenius kinetic parameters obtained from PSO.
Algorithm PSOTemperatures (°C)Arrhenius
Constants (s−1)
Arrhenius ParametersFit (%)
A (s−1)Ea (kJ·mol−1)
Global Parameters250, 275,
300, and 325
k11.141 × 10111.310 × 10599.99996887
kV19.789 × 1058.087 × 104
k29.724 × 1069.762 × 104
kV26.763 × 1058.557 × 104
Individual
Parameters
250k12.401 × 10111.350 × 10599.99996187
kV19.199 × 1058.066 × 104
k24.426 × 1071.036 × 105
kV27.338 × 1071.075 × 105
275k19.058 × 10101.432 × 10598.07280000
kV12.785 × 1035.713 × 104
k29.706 × 1048.003 × 104
kV24.218 × 1049.595 × 104
300k15.178 × 10101.289 × 10599.99999997
kV15.490 × 1046.870 × 104
k23.770 × 1091.297 × 105
kV22.222 × 1047.035 × 104
325k19.283 × 1057.746 × 10499.99048931
kV12.651 × 1057.451 × 104
k27.643 × 1071.104 × 105
kV21.603 × 1024.830 × 104
Table 5. Elemental analysis prediction results.
Analysis
Elemental
PREFPGlobalPIndividualEGlobalEIndividualPREFPGlobalPIndividualEGlobalEIndividual
Temp (°C)Carbon (%wt)Hydrogen (%wt)
Raw46.20546.09050.0420.2498.3046.2756.3005.8570.3936.655
25049.57349.95151.8890.7634.6715.7155.6415.3341.2976.674
27557.08955.73750.8082.36911.0024.8934.9795.6451.76115.367
30060.12762.96360.3524.7170.3754.4134.3574.5041.2642.063
32568.59666.84968.4992.5470.1414.0074.0263.9630.4761.095
Nitrogen (%wt)Oxygen (%wt)
Raw3.6123.6483.5890.9890.65043.90843.96340.5120.1247.733
2503.7213.6133.9292.9085.59940.99140.79538.8480.4785.227
2753.8063.9523.7273.8422.07434.21235.33239.8203.27316.392
3004.7614.6224.5612.9094.20430.69928.05730.5838.6060.379
3257.9224.9875.01537.05236.69322.47524.13922.5227.4020.207
Table 6. HHV analysis prediction results.
HHV (MJ·kg−1)Relative Errors (%)
Temp (°C)RefGlobalIndividualGlobalIndividual
raw18.53518.90519.7241.9956.417
25019.68919.55219.8840.6950.989
27521.37320.73219.7943.0017.389
30022.23922.33121.6940.4152.449
32523.34123.19123.6150.6421.172
Disclaimer/Publisher’s Note: The statements, opinions and data contained in all publications are solely those of the individual author(s) and contributor(s) and not of MDPI and/or the editor(s). MDPI and/or the editor(s) disclaim responsibility for any injury to people or property resulting from any ideas, methods, instructions or products referred to in the content.

