Abstract
Numerous universities and national laboratories in the United States have collaboratively established a Common Component Architecture (CCA) forum to conduct research on parallel component technology. Given the overhead associated with component connection and management, performance optimization is of utmost importance. Current research often employs static load-balancing strategies or centralized dynamic approaches for load-balancing in parallel component applications. By analyzing the operational mechanism of CCA parallel components, this paper introduces a dynamic and distributed load-balancing method for such applications. We have developed a class library of computing nodes utilizing an object-oriented approach. The resource-management node deploys component applications onto sub-clusters generated by an aggregation algorithm. Dependency among different component calls is determined through data flow analysis. We maintain the load information of computing nodes within the sub-cluster using a distributed table update algorithm. By capturing the dynamic load information of computing nodes at runtime, we implement a load-balancing strategy in a distributed manner. Our dynamic and distributed load-balancing algorithm is capable of balancing component instance tasks across different nodes in a heterogeneous cluster platform, thereby enhancing resource utilization efficiency. Compared to existing static or centralized load-balancing methods, the proposed method demonstrates superior performance and scalability.
1. Introduction
Parallel computing is essential for tackling numerous complex computational tasks. It finds extensive application in sectors such as aerospace, weather forecasting, molecular dynamics simulations, and other critical areas that impact the national economy and public welfare. Due to its intricate structure and extensive codebase, the development efficiency of parallel computing software has garnered increasing attention. Traditional methods, which rely on hand-crafted code written by domain-specific scientists, present several challenges. These include prolonged development times, inconsistent quality, and difficulties in maintenance and reuse. In response to these issues, in 1998, several US universities and research laboratories collaboratively established the Common Component Architecture (CCA) forum. Since its inception, the forum has been dedicated to researching parallel component technologies to address these challenges [1].
Subsequently, researchers from Britain, France, Italy, China, and other countries have also directed their focus towards parallel component technology research [2,3,4,5]. Component technology, initially developed for serial software, has been integrated into the development process of parallel software. This integration facilitates the efficient development and performance optimization of parallel software by establishing a corresponding component model, architectural specification, and operational framework. In these studies, the CCA specification has emerged as the foundation for many other parallel component technologies due to its standardized and straightforward nature.
A parallel component is a software component designed to encapsulate the functionality of parallel computing. Parallel software demands high performance. However, the application of parallel components introduces overhead in component connection and management, making the optimization of application performance crucial. Current techniques for optimizing performance in parallel component applications primarily utilize performance prediction, adaptation, and load-balancing methods [6]. Load-balancing methods aim to distribute the workload evenly across different computing nodes on the execution platform, thereby enhancing resource utilization, throughput, and the overall performance of the system. Figure 1 illustrates an example of load-balancing on a heterogeneous cluster platform. In this example, different task blocks, each represented by a distinct color, are assigned to various nodes for execution.
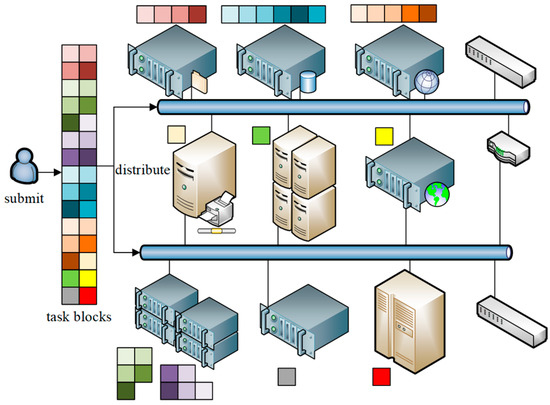
Figure 1.
Load-balancing on a heterogeneous cluster platform. Squares of varying colors symbolize distinct categories of data.
Load-balancing methods for parallel component applications are often adapted from existing strategies used for general parallel applications. These strategies can be broadly categorized into two types: static and dynamic. A static load-balancing strategy utilizes known task information to allocate tasks to different hardware resources before execution, with the load distribution remaining constant during runtime [7]. In contrast, dynamic load-balancing adapts task allocation to meet changing demands based on dynamically generated task information and the current loads on computing nodes. Dynamic load-balancing can be implemented in a centralized or distributed manner. In centralized load-balancing, a designated computing node serves as the management node, responsible for maintaining global load information and making load-balancing decisions [8]. Conversely, in distributed load-balancing, each computing node makes local decisions and shares load information, collectively contributing to global load-balancing [9]. When selecting the target node for load migration, common algorithms include the polling algorithm [10], the performance-first algorithm [11], and the fastest response time algorithm [12]. In existing methods, the load-balancing of parallel component applications typically employs either a static load-balancing strategy or a centralized dynamic strategy [13]. The static strategy cannot cope well with load changes during runtime. The centralized dynamic strategy imposes a significant burden on the management node, potentially causing it to become a bottleneck in the system and negatively impacting overall performance.
This paper investigates the operational mechanisms of CCA parallel components and introduces a dynamic, distributed method for load-balancing in parallel component applications, termed Parallel Component Dynamic and Distributed Balance (PCDDB). We have developed a class library of computing nodes utilizing an object-oriented mechanism and defined the relevant interfaces within this library for load-balancing. These interfaces are compiled to create local computing-resource proxies for each computing node. In our proposed approach, the business component is generated by compiling the business interface and then deployed by the resource-management node within a sub-cluster. The sub-cluster is formed using an aggregation algorithm and represents a group of computing nodes with favorable communication conditions. We determine the dependencies between different component calls through data flow analysis. During application runtime, parallel component instances are treated as tasks to be assigned. We maintain the load information of the relevant nodes on the execution platform using a distributed table-update algorithm. When new tasks are identified, the task allocation request is circulated among the computing nodes within a sub-cluster. Each node can opt to receive tasks from the task allocation request based on its current load. We then locally generate and execute these component instances. By capturing the dynamic load information of the computing nodes at runtime and implementing the load-balancing strategy in a distributed manner, we achieve superior load-balancing results with reduced overhead. This approach outperforms existing methods in terms of performance and scalability.
2. Materials and Methods
2.1. Computing Resource Management Based on an Object-Oriented Mechanism
Parallel component applications are frequently deployed on heterogeneous cluster platforms. A heterogeneous cluster consists of several computing nodes with varying configurations, all interconnected through a network. To effectively manage the computing resources within the cluster and balance the load, the PCDDB method utilizes a computing resource management approach grounded in an object-oriented mechanism.
Each node can be conceptualized as an object, employing object-oriented techniques. A node possesses several computing-resource attributes that directly influence its performance, such as the number of CPU cores, CPU clock frequency, memory capacity, and network bandwidth. Additionally, it includes attributes essential for managing these nodes, such as the hostname and IP address. For each attribute, the corresponding setter and getter methods are implemented, leveraging a reflection mechanism. Nodes with different attributes and methods may vary; for instance, a node equipped with a GPU might include an attribute for the number of CUDA cores, along with setter and getter methods to access this attribute. For nodes sharing the same attributes, we have abstracted their common characteristics and defined a general computing node class.
For instance, a “Workstation” class can be defined to represent a group of workstations with identical configurations. When we want to add a new node to a cluster, we simply instantiate an object of the appropriate computing node class. Beyond the set and get methods, additional methods can be defined within a computing node class to facilitate node management. All computing node classes inherit from a common base class, which is designated as an abstract type. This base class encapsulates the common attributes and methods shared by all computing node classes, effectively abstracting the most fundamental characteristics of a computing node. Figure 2 illustrates an example of a defined hierarchy for computing node classes.
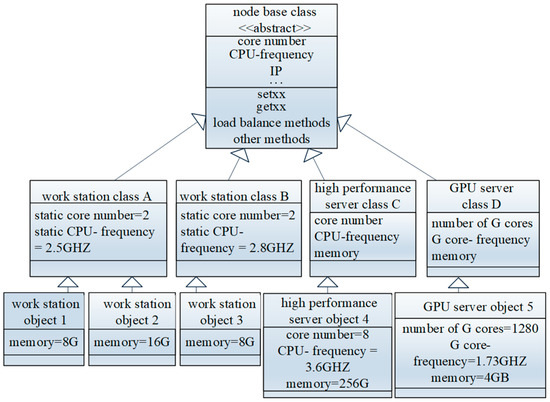
Figure 2.
Class tree of computing nodes.
For the overall heterogeneous cluster, we have selected a high-performance server to serve as the resource-management node, where a cluster resource manager is deployed. This cluster resource manager establishes a class library to manage all computing node classes. When a new node is added to the cluster, the cluster resource manager queries the CPU frequency, memory capacity, and other computing resource information of the node. Utilizing this information, it searches for the corresponding class within the class library. If it identifies a class with attributes that match the new node, it employs the Babel compilation tool [14] to generate a component instance (object) of this class, which is then sent to the newly added node. This component instance interacts with other nodes, acting as a proxy for local computing resources. If the cluster resource manager cannot find a class in the class library that matches the attributes of the newly added node, it will generate a new node class based on the attribute values of the new node and subsequently add it to the class library. Our cluster resource manager and all resource proxies are implemented in C++ and have a seamless interface with CCAFFEINE [14]. The CCA parallel component runtime framework is also implemented in C++.
2.2. Aggregation of the Computing Nodes
To reduce the communication overhead caused by the load-balancing mechanism, we aggregate all nodes in the execution platform into different sub-clusters according to the network conditions between the nodes. A sub-cluster is a logical concept and is equivalent to a subset of the overall heterogeneous execution platform. PCDDB employs Algorithm 1 for its clustering process.
Figure 3 presents an example of node aggregation. The red node sends a broadcast to other nodes. According to the order of the reply, we can select the top m − 1 nodes and add the red node to form a set (indicated in yellow in the figure). We can take the union of the three yellow sets to obtain a sub-cluster. The union of all sub-clusters equals the original set S.
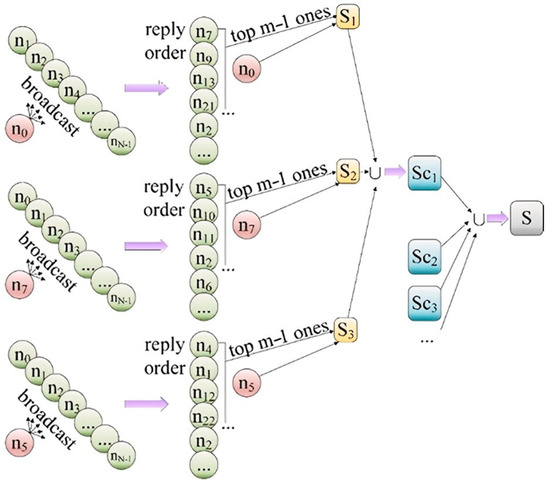
Figure 3.
Node aggregation example.
This sub-cluster aggregation method is based on the network conditions between the nodes in the platform. The nodes contained in the same sub-cluster have better communication conditions. The load-balancing of different component instances in a parallel component application is performed within a sub-cluster to reduce overhead. The size of each sub-cluster can be no less than m. At the same time, our algorithm may result in different sub-clusters that have no intersection, but it is also possible that they contain some of the same nodes, which is quite natural. That is, for two sub-clusters, Sc1 ⋂ Sc2 ≠ Φ is allowed. For example, if S = {n0, n1, n2, n3, n4, n5, … n14}, and we have obtained Sc1 = {n0, n1, n2, n3, n4} through clustering, then we select n6 from S-Sc1 as the starting point to continue clustering in the hope of obtaining Sc2. If the communication conditions between n3, n4, and n6 are very good, then n3 and n4 will also be among those ranked in front to return when n6 sends out a broadcast message, thus making n3 and n4 part of Sc2 as well.
| Algorithm 1: Node aggregation algorithm | |
| (1) | /*All nodes of the platform form a set S. The total number of nodes on the platform is N. We then estimate the possible minimum sub-cluster size m.*/ |
| If clusters where N <= 50, | |
| set m = ⌊30%*N⌋; | |
| set Sr = ∅; | |
| choose a node n0 randomly; | |
| (2) | n0 sends a broadcast message; |
| Any node that receives this message replies n0; | |
| n0 record the first m−1 replies (from whom, as Setm−1); | |
| S1 = n0 + Setm−1; | |
| (3) | Choose n1 in S1 randomly, and n1 ≠ n0. |
| Repeat step (2) to obtain set S2. | |
| (4) | Choose n2 in S2 randomly, where n2 ≠ n0, n2 ≠ n1. Repeat step (2) to obtain set S3. |
| (5) | Sc1= S1∪S2∪S3. |
| Sr = Sr∪Sc1 | |
| (6) | If S = Sr, |
| the aggregation process ends. | |
| else | |
| select any node n0’ in the set S’ = S − Sr and repeat steps (2) to (6). | |
| (7) | Sc1, Sc2, Sc3… are the final sub-clusters. |
For each node contained in a sub-cluster, the sub-cluster ID attribute in the local computing resource proxy (object) takes the same value. If a node belongs to multiple sub-clusters, then it has multiple sub-cluster IDs. After the aggregation process, we manually specify a node in each sub-cluster as the startup node, which is responsible for the startup of the parallel component applications deployed on the sub-cluster. The maintenance of the class library of computing nodes and sub-cluster aggregation are performed during idle time, when the platform load is low. The entire server cluster is partitioned into distinct sub-clusters by the aggregation algorithm. Each sub-cluster is required to have a size exceeding 30%*N. This threshold is an empirical value. Based on our extensive historical data from deploying applications on this cluster, for server clusters with a node count N less than 50, a sub-cluster size of 30%*N is sufficient to support the operation of typical applications.
2.3. Load-Balancing of the CCA Parallel Applications
Sandia National Laboratory, a part of the US Department of Energy, developed tools for CCA [14]. Users can use the Babel compiler to generate component skeletons. They can then take these skeletons and fill in the implementation code. The CCAFFEINE framework links the component library at runtime to support the operation of the components. A component instance is represented by a C++ object. This object includes the definitions of all the data structures required by the component, which is equivalent to a copy of the component definition. Multiple instances of the same component can be deployed on different computing nodes and executed in parallel in a multi-process manner. A heterogeneous cluster platform often carries multiple component applications concurrently.
2.3.1. CCA-Balance Environment
The original CCA parallel component application does not consider the processing capacity of the computing nodes on an execution platform. This results in an imbalance in the component tasks on different nodes. Nodes with strong computing power and fewer component instances will complete their tasks earlier; therefore, they will be idle. Other nodes spend a long time completing tasks. This imbalance causes computing resources on the platform to be wasted, reducing the performance of applications and the throughput of the whole system. To solve this problem, we added a mechanism for computing node resource management, business component data flow analysis, and component instance load-balancing using the Babel compiler and CCAFFEINE framework. We integrated them into an efficient parallel component application management and running environment, called CCA-balance. The structure of the whole environment is shown in Figure 4.
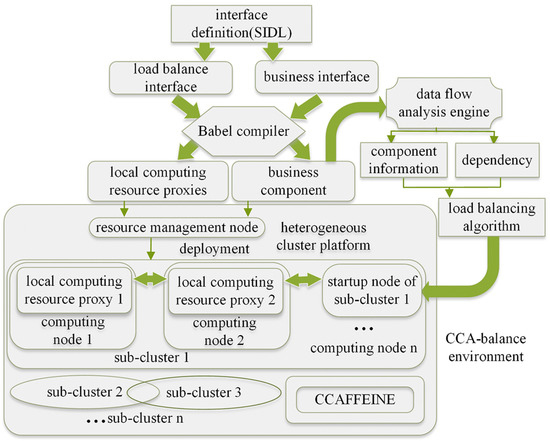
Figure 4.
Structure of CCA-balance.
In CCA-balance, the load balance interfaces and business interfaces are defined using the Scientific Interface Definition Language (SIDL) [15]. The Babel compiler generates local computing-resource proxies and business components by compiling these two types of interfaces. The resource-management node of a heterogeneous platform deploys these components (instances) on the computing nodes. The data flow analysis engine examines the codes of the business components and obtains information such as the component call interfaces, input parameters, and dependency between components. According to the distributed load-balancing algorithm, the component instances that must be executed are allocated within a sub-cluster. The computing nodes within this sub-cluster choose to receive tasks from the task allocation requests based on their own load situations. These nodes locally call the CCAFFEINE framework, generate the component instances, and execute them.
2.3.2. Load-Balance Interface
PCDDB defines a new type of component interface, namely the load-balance interface, based on the ordinary business interface of parallel components. This type of interface is primarily used by the local computing resource proxy objects of the computing nodes. These interfaces are defined in the root of the computing node class tree and all computing node classes inherit the definitions of these interfaces. These interfaces are defined in the SIDL, which is an interface definition language similar to C that defines an interface by specifying its name, input parameters, and return value. The Babel tool compiles these interfaces and generates the corresponding local computing resource proxy objects for the computing nodes. These proxies provide a distributed load-balancing mechanism. During the compilation process, we generate the implementation part of the code. The interface functions include checking the load status of the node itself, receiving and sending task allocation requests, updating the relevant local tables, and accepting component instances. These functions play a role in the interactions between different computing nodes for load-balancing. Table 1 lists the definitions of the load-balance interfaces.

Table 1.
Balance interfaces and definitions.
We use the Babel tool to compile the business interfaces and generate the corresponding business function components. The code for each business component is compiled into an .la dynamic library file by calling the Babel tool and Libtool [16]. Before an application runs, the resource-management node of the execution platform selects a sub-cluster and copies the .la library files of the business components to each computing node in the sub-cluster. The load-balancing of the component instances belonging to the same application are carried out within this sub-cluster.
Dynamically assigning a component instance to a computing node within a sub-cluster does not require the transmission of the code of the component instance over the network. Instead, the name, interface, and parameters of the component are sent to the node. The local computing-resource proxy of the node then calls the CCAFFEINE framework, which links the .la dynamic library, generates the component instance, and executes it.
2.3.3. Data Flow Analysis
To achieve a multi-component, multi-data model and lay the groundwork for load-balancing, it is essential to perform a data flow analysis on the business component codes. PCDDB contains a data flow analysis engine that scrutinizes the source codes of a component application. It counts the occurrences of component calls within the codes, marks them, and calculates the input parameters for components, following the direction of data flow. Figure 5 shows an example of the data flow analysis.
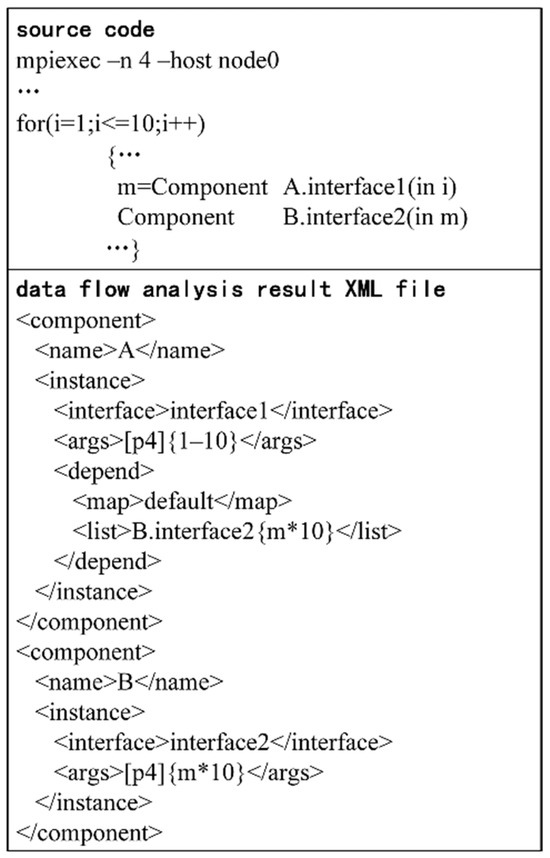
Figure 5.
Example of data flow analysis.
In Figure 5, components A and B are each called 10 times. All 10 calls to component A are made through the same interface, interface1, with input parameter “i” marked as “in”, indicating that it does not need to be returned externally. Moreover, there is no dependency between the 10 calls to A, and the input parameter values for each call range from 1 to 10. For the 10 calls to component B, the input parameters for each call depend on the execution results of component A, meaning that component B is dependent on component A. The data flow analysis of the component codes reveals the dependency relationships between components, interface information, and the input parameters of components whose dependencies have been resolved. These components form the component instance tasks that are to be assigned. The results of the data flow analysis are recorded in an XML file.
According to the results of this analysis, if a component does not depend on any other unexecuted components and has not been executed yet, we say the component is in a ready state, that is, a state that can be executed immediately. During the execution of an application, it is necessary to dynamically allocate computing resources for components in the ready state. The PCDDB method incorporates a load-balancing task manager responsible for generating component instance tasks and initiating resource allocation, which is deployed on the startup node of each sub-cluster. This manager is activated by two types of events. The first event is triggered when a user initiates the execution of a parallel component application on the sub-cluster; components in a ready state when the application starts require resource allocation and execution. When a component is ready, the XML file from the data flow analysis results can be queried to determine the number of instances to generate, along with their interfaces and input parameters. The load-balancing task manager then packages this information into a task allocation request, distributing it among the low-load nodes within the sub-cluster to allocate computational resources and execute them in a distributed manner. The second event is triggered when a parallel component within the sub-cluster completes its execution, with results returned to the sub-cluster’s startup node by the local computing resource proxy on the executing node. The load-balancing task manager updates the data flow analysis XML file, setting the status of all components dependent on the completed component to ready. It then packages their information into task allocation requests and initiates the load-balancing algorithm to distribute computational resources and execute the instances of ready components.
2.3.4. Load-Balancing Algorithm
We define two thresholds: LT and MT. Each computing node maintains a local component instance table that records the number of component instances it holds. If this number is less than LT, there are too few tasks on this node and it should take on new tasks. MT is the threshold for a moderate load. When assigning new tasks to nodes with too few tasks, we should ensure that the total number of tasks on this node does not exceed MT. The initial values of LT and MT are set for single-core nodes. If a node is a multicore node (n CPU cores), the corresponding LT and MT values on that node are n times those of a single-core node. Normally, single-core nodes should have an LT value between 2 and 4 and an MT value between 6 and 10. If the computational load for most parallel component instances is low, the LT value can be increased as appropriate. When there is an abundance of computational nodes and resources, the MT value can be decreased accordingly. On the contrary, if computational resources are limited, the MT value should be increased as necessary. The experimental section of this paper provides specific examples to illustrate these points.
Each node in a sub-cluster must also maintain a local low-load node table to record the information of nodes with too few tasks in the sub-cluster. The overall process of the load-balancing algorithm is Algorithm 2. In order to enhance the efficiency of information exchange, the startup node and low-load nodes are required to interact under two specific circumstances. First, prior to the execution of a deployed application, the startup node must gather information from all low-load nodes within the local sub-cluster. Second, once a low-load node accepts new component instance tasks that are distributed through the system, it is necessary for that node to update its status to “not a low-load node” and subsequently notify the startup node of this change.
| Algorithm 2: Load balancing algorithm | |
| (1) | The startup node collects the local low-load node information of other nodes. |
| (2) | The startup node packages the component names, interfaces, and input parameters of N component instances as well as its own low-load node table as a task allocation request and sends it to the first node in its own low-load node table. |
| (3) | When a node receives a task allocation request, the following occurs: |
| (3.1) | If the local table indicates that local node is not a low load node, it deletes itself from the table in the task allocation request and then forwards the task allocation request. |
| (3.2) | If the local table specifies that this node is a low-load node and the number of component instances in the local component instance table is x, it selects MT-x component instances in the task allocation request as its newly assigned tasks and executes them. |
| (4) | After receiving a reply from a node, the startup node deletes the node from its low-load node table. |
| (5) | If there are unallocated tasks in the task allocation request held by a node but the local low-load node table is empty, it sends the task allocation request to the startup node. The startup node then reassigns them. |
| (6) | The received replies tell the startup node the allocation of the component instances on the computing nodes, and the results of the tasks are collected by the startup node to complete the application. |
Figure 6 illustrates the execution process of the proposed load-balancing algorithm using an example. The startup node has five instances of component D and four instances of component C that must be allocated. It packages the names of these components, interfaces, input parameters of each instance, and its own low-load node table as a task allocation request and sends this request to the first node in its low-load node table, node 6. After receiving this request, node 6 first updates its local low-load node table, adds nodes 3, 4, and 9, and deletes node 12. According to its own load status (the number of existing component instances is 2 < LT), it assigns itself four instances of component D (MT−2 = 4) to generate and execute locally. It then deletes itself from the low-load node table in the task allocation request and local table. Next, node 6 modifies the task allocation request, deletes the component tasks it has just assigned itself, and then forwards the task allocation request to the first node in its local low-load node table, that is, node 8. Node 8 determines that it is not a low-load node. After updating the local low-load node table, it immediately sends the task allocation request to the first node in its low-load node table, that is, node 9. Node 9 updates its local low-load node table, deletes nodes 6 and 8, and adds nodes 4 and 2. According to its number of existing component instances (2 < LT), it assigns itself one component D and three instances of component C. It then deletes itself from the task allocation request and local low-load node table, deletes the component instance tasks it has just assigned itself from the task allocation request, and forwards the task allocation request to node 3. Node 3 updates its local low-load node table, deletes nodes 8, 6, and 9, and adds node 11. According to the number of its existing instances (1 < LT), it assigns itself one instance of component C from the task allocation request. Node 3 deletes itself from the local low-load node table. At this point, all the component instances in the task allocation requests sent from the startup node have been assigned. In Figure 6, the white arrow indicates the delivery of the task allocation request. The gray arrows indicate replies to the startup node.
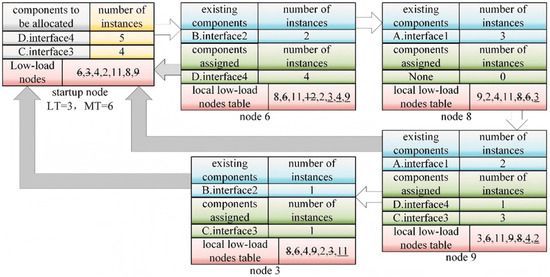
Figure 6.
Example of load-balancing algorithm execution.
In the above algorithm, each node checks its own status, updates the local low-load node table, receives and forwards task allocation requests, accepts component instances, calls CCAFFEINE, modifies the task allocation requests, and replies to the startup node. These operations are defined in the load balance interface in Table 1 and are implemented by the local computing resource proxy of each node. To reduce the communication overhead, all component instances of an application are allocated in the same sub-cluster. If a node is a member of multiple sub-clusters simultaneously, it contains multiple local low-load node tables, and each low-load node table is bound with a sub-cluster ID. The value of the sub-cluster ID is passed along with the task allocation request. Each node uses the corresponding local low-load node table according to this ID. Regardless of which application the component instances belong to, they always increase the load on the node to which they are assigned. Therefore, the component instance table counts the number of all component instances as existing instances on the local node, regardless of the application to which these component instances belong. For simplicity, the nodes in Figure 6 are assumed to be single-core nodes. During the operation of the load-balancing algorithm, if a node has multiple cores, the corresponding LT and MT values on the node are n times those of the single-core node (n is the number of CPU cores of the node). The local computing resource proxy on that node allocates the component instances to each CPU core equally.
PCDDB employs a distributed load-balancing algorithm. The core of the algorithm includes updating related tables and allocating component instances. We define the platform resource-management node and the sub-cluster startup node. However, the task allocation requests are passed among computing nodes. Each node selectively accepts parts of the tasks in the request according to the content of the related local table. This avoids the huge increase in load that the management node may incur. Our algorithm is primarily used for task allocation on CPU processors. If there are special requirements for code execution—for instance, if some components containing CUDA code must be deployed on a GPU server, or if some components require a large amount of memory to process a large amount of data—these requirements are recorded in the XML file during the data flow analysis. The load-balancing task manager on the startup node includes these special requirements in the task allocation request. Only qualified computing nodes accept and execute these tasks. The adaptiveness of the method mentioned in this paper is primarily manifested in its ability to deploy and execute a component instance in real time and dynamically, based on the information of low-load nodes within the sub-cluster, when the instance requires deployment and execution. This approach contrasts with the static, one-time deployment strategy employed prior to the entire application’s execution.
3. Results
To test the effectiveness of the distributed dynamic load-balancing method proposed by PCDDB, we first used CCA tools to create a weather forecast parallel component application based on the Fifth Generation Mesoscale Model (MM5) [17]. This application includes eight large functional modules, and the overall module structure is illustrated in Figure 7.
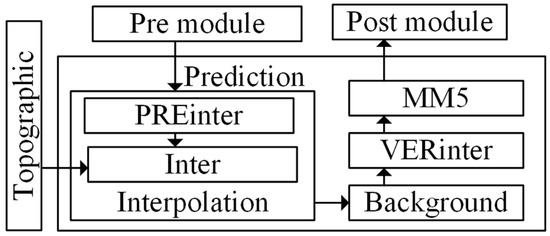
Figure 7.
Weather forecast application structure.
First, the input data are pre-processed. The Topographic module processes the terrain data to generate the terrain data file. The PREinter module reads the preprocessed data and generates the data required by the Inter module, which interpolates the input data. The Background module analyzes the background field data at the barometric layer. The VERinter module reads the background field data and generates the initial grid data and boundary conditions. The MM5 module produces its forecast using the data obtained from other modules. Finally, the Post module generates visual graphics based on the forecast results.
3.1. Number of Component Instances Completed and Effective Working Time Test
Table 2 lists the location statistics of the parallel components in each module. For example, in the first row of Table 2, within the Pre module, there are nine component calls that appear in the for loops, eight component calls in the while loops, three component calls in the recursive call structures, and five component calls that are not included in these three structures. As Table 2 reveals, most component calls in the application appear in the code structures with simple dependencies. Therefore, these components are highly suitable for parallel execution, aligning well with the load-balancing strategy proposed in this paper.

Table 2.
Location statistics of parallel component calls.
The execution platform we used is a heterogeneous cluster. This platform consists of thirty dual-core servers (Intel Pentium G4520 @ 3.60 GHz, 8 GB memory; nodes 1–30), three 8-core servers (Intel Xeon Silver 4110 @ 2.10 GHz, 64 GB memory; nodes 31–33), and three 10-core servers (Intel Xeon Silver 4114 @ 2.20 GHz, 256 GB memory; nodes 34–36). The input data included weather information such as altitude, temperature, relative humidity, air pressure, and wind field within 48 h from 7 August to 8 August 2021, in Sichuan, China. The output was 48 h of precipitation data from 9 August to 10 August 2021.
Table 3 presents the results of node aggregation on this heterogeneous cluster. Based on the results of the aggregation operation, we deployed a component application on Sc2. For the initial threshold values, we set LT = 2, MT = 10 for a single-core node, LT = 4, MT = 20 for a dual-core node, and LT = 16, MT = 80 for an 8-core node. Node 33 was selected as the startup node. During the application execution, the task information of the component instances was sent to the low-load nodes in Sc2, which generated the corresponding component instances and executed them. In multicore nodes, the CPU core is the basic unit that performs the tasks of the component instances. We counted the number of component instances completed on each CPU core and the time required to complete these tasks.

Table 3.
Results of node aggregation.
In Figure 8, the 52 points on the x-axis each represent a CPU core. Points 1–28 represent the CPU cores on the first 14 dual-core nodes of sub-cluster Sc2. For example, points 1 and 2 represent the two CPU cores of node 8 (the first dual-core node in Sc2). Points 29–52 represent the CPUs of the last three 8-core nodes on Sc2; that is, the twenty-four CPU cores on nodes 31, 32, and 33. The y-axis represents the number of component instances completed by each CPU core. For the first 14 dual-core nodes, the CPU frequency is 3.60 GHZ, the average number of component instances completed by each CPU core is 34, and the variance is 3.6. As shown in Figure 8, the number of component instances completed on these CPU cores is approximately evenly distributed, which reflects the effect of our load-balancing mechanism. For the last three 8-core nodes, the average number of component instances completed by each CPU core is 28, which is slightly lower than that for the dual-core nodes. This is because the CPU frequency of the 8-core nodes is low (2.10 GHz). The variance in the number of component instances completed by the CPU cores of the 8-core nodes is 5.02, which is approximately evenly distributed. Our load-balancing mechanism embodies the principle of “able people should do more work”.
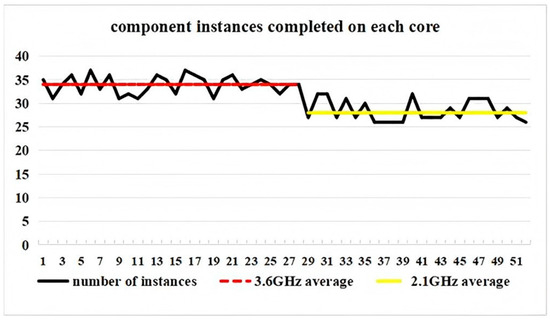
Figure 8.
Component instances completed on each core.
A CPU core with a strong processing capacity can quickly complete its existing tasks, thus returning to a low load status and becoming able to accept more new tasks. Meanwhile, our approximately even distribution does not imply that the numbers of component instances completed by the cores with the same frequency are identical. As Figure 8 reveals, CPU cores with the same frequency complete different numbers of instances. This is because the component instances vary in size. For CPU cores with the same frequency, over the same period, a core may be able to complete multiple small instances, whereas another core with large instances may only be able to complete one large instance. Figure 9 shows the statistics of the effective working time on each node. The effective working time refers to the total time spent running all component instances assigned to a CPU core.
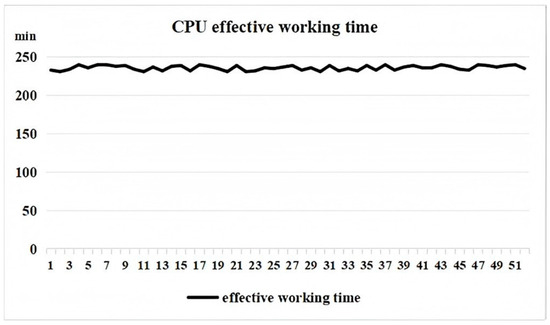
Figure 9.
CPU effective working time.
A comparison of Figure 8 and Figure 9 reveals that there is a small gap in the number of component instances executed in the different CPU cores that is due to the difference in the size of the component instances. However, from the perspective of effective working time, each CPU core completed nearly the same amount of work, demonstrating the effect of our load-balancing mechanism.
3.2. Performance and Speedup Test
In addition to the proposed PCDDB method, we tested two other cases in the performance and speedup tests. One is a case in which a static load-balancing mechanism is used; that is, all components are assigned to each computing node only at the beginning of the application, and the distribution does not change during the process. The other is a dynamic centralized load-balancing method, which arranges monitoring agents on each computing node, collects the load information of the computing node, and sends it to a central scheduler, which uniformly generates a load migration strategy and assigns the component instances to nodes with light load.
We first compared the performances of the three methods through experiments. The PCDDB version MM5 application was deployed on cluster Sc2. We set LT = 2 and MT = 10 as the initial threshold values of the corresponding threshold on a single-core node. The values on the dual-core nodes and the 8-core nodes were multiplied by the corresponding number of cores. The applications using the other two load-balancing methods were deployed on a cluster composed of fourteen randomly selected dual-core nodes and three 8-core nodes. The size of the input data was varied, and the execution times of the applications using the three different load-balancing methods were recorded. The input data range spans from 0 to 400 M, with measurements taken at regular intervals of 10 (i.e., 0, 10, 20, 30, …, 400), resulting in a total of 41 experimental trials for each method. The results are presented in Figure 10. The static load-balancing decision was made prior to application execution and thus cannot account for the load conditions of nodes during runtime. It assigns components to different nodes before execution based solely on the application’s component definitions and process requirements, which results in inferior performance compared to the other two methods. The dynamic, centralized load-balancing method, on the other hand, deployed component instance tasks to nodes with lighter loads during application execution, based on real-time load conditions of the computing nodes. This approach outperforms the static method. However, it is entirely dependent on a single central scheduler for generating and executing load scheduling decisions, which places a significant burden on the management node hosting the scheduler and incurs a relatively high load-balancing overhead. In contrast, the PCDDB method’s dynamic, distributed load-balancing decision-making captured the load conditions of computing nodes in real time and distributed the load-balancing overhead across various computing nodes within a sub-cluster that enjoyed good communication conditions. This approach has demonstrated the best performance compared to the other two methods.
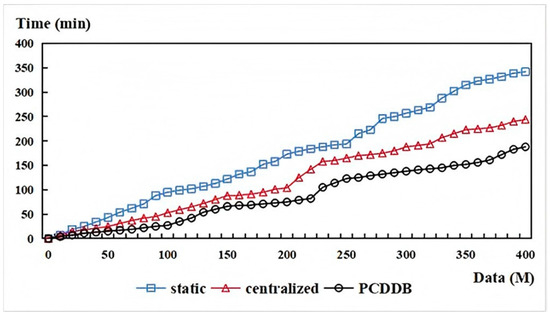
Figure 10.
Performance comparison test.
To further evaluate the advantages of the proposed node aggregation in reducing the communication overhead of the load-balancing mechanism, we deployed the MM5 component application on sub-cluster SC5. A cluster was composed of eighteen randomly selected dual-core nodes and three 10-core nodes. We set LT = 4, MT = 20 on the dual-core node and LT = 20, MT = 100 on the 10-core node. While changing the size of the input data, we recorded the communication costs of load-balancing. The communication cost includes the transmission of the low-load status from the computing node to the startup node in the load-balancing algorithm, transmission of the component instance task allocation requests between nodes, and replies sent by nodes accepting certain component instances to the startup node. Experiments were conducted across a range of 0 to 400 M in increments of 10 (0, 10, 20, …, 400), totaling 41 data points. Figure 11 shows the result of the communication cost test, revealing that when the proposed load-balancing mechanism was taken, deploying the application on a sub-cluster generated by our aggregation algorithm lowered the communication cost.
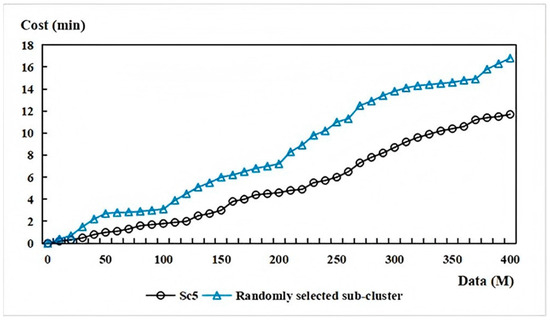
Figure 11.
Communication cost test.
To test the scalability of the PCDDB method, we selected several dual-core nodes in cluster Sc5 to deploy the weather forecasting application. There are 18 dual-core nodes in Sc5. We tested 1, 2, 4, 8, and 16 nodes, which correspond to the cases of 2, 4, 8, 16, and 32 cores, respectively. We used the three load-balancing methods defined above to calculate the corresponding speedup with respect to a single core (without any load-balancing strategy). For the PCDDB method, we tested both LT = 4, MT = 12 and LT = 4, MT = 20 for the dual-core nodes.
Table 4 presents the result of the speedup test. As the number of cores increases, the PCDDB method achieved better speedup results than the static and centralized methods. When using the PCDDB method, if the number of computing nodes is large and the number of applications running on the sub-cluster is small, that is, the overall load of the sub-cluster is light and there are many low-load nodes, we should reduce the value of MT appropriately so that each low-load node is assigned fewer new tasks. This enables more low-load nodes to be utilized to achieve better performance. In Table 4, the speedup using MT = 12 is higher than that using MT = 20 for 8, 16, and 32 cores. On the contrary, if there are fewer nodes in a sub-cluster and the value of MT is small, some tasks will not be assigned in time. These tasks will be returned to the startup node for reallocation. If this occurs more than once, the system performance will be compromised. As Table 4 reveals, the speedup obtained using MT = 12 on the 2- and 4-core nodes is relatively poor compared with that obtained using MT = 20. Before performing the PCDDB method, appropriate values of LT and MT should be set according to the number of nodes in a sub-cluster and the overall workload of the sub-cluster, which will improve the load-balancing result.

Table 4.
Speedup test.
4. Discussion
By examining and analyzing the operational characteristics of CCA parallel component applications, this paper introduces a dynamic, distributed load-balancing approach. To develop this method, we extracted the typical features of computing nodes on a heterogeneous cluster platform and established a class library for these nodes. Based on the network status among nodes within the execution platform, we employed a custom aggregation algorithm to group computing nodes into various sub-clusters. The Babel compiler then compiles the load balance interfaces and business interfaces defined by SIDL, generating local computing-resource proxies for the computing nodes and business function components, respectively. The platform’s resource-management node deploys these proxies onto the corresponding computing nodes, while the data flow analysis engine gathers information and dependencies of component instances by analyzing the business function components’ code. Users manually select a sub-cluster, and the platform’s resource-management node deploys the component code to all nodes within that sub-cluster. An application is initiated by a startup node within the sub-cluster. During the application’s execution, the startup node consults the data-flow analysis result XML file and communicates the component instances ready for execution among low-load nodes in the sub-cluster. These low-load nodes decide to accept component instances based on their current load status and execute them using the local CCAFFEINE framework. Our PCDDB method can allocate component instances to computing nodes with minimal overhead, thereby enhancing the performance of parallel component applications, optimizing the efficiency of platform computing resources, and increasing the system’s overall throughput. Experimental results indicate that, compared to existing static load-balancing methods and centralized load-balancing strategies, PCDDB can fully leverage the system’s computing resources to improve performance and scalability at a low cost. Our current research is focused on the allocation of CPU as the primary computing resource. Future work will explore the impact of memory and other resource allocations on load-balancing. Moreover, when the number of computational nodes in a server cluster exceeds 50 and the number of applications deployed on a daily basis is relatively limited, the promotion of the load-balancing method proposed in this paper is likely to be significantly reduced, due to the potentially excessive utilization of computational resources. Given that the method relies on the distributed dissemination of component instance information throughout the cluster, it becomes inapplicable when network fluctuations or failures occur. However, barring these two scenarios, the proposed method can be effectively extended to load-balancing processes of other types of parallel component applications beyond CCA-based systems, provided that the server cluster is constrained by computational resources but enjoys a robust network environment.
Author Contributions
Conceptualization, L.G.; methodology, L.G.; software, L.G.; validation, X.G.; formal analysis, F.L.; investigation, F.L.; resources, F.L.; writing—original draft preparation, L.G.; writing—review and editing, L.G.; supervision, L.G.; project administration, L.G.; funding acquisition, F.L. All authors have read and agreed to the published version of the manuscript.
Funding
This research was funded by the National Natural Science Foundation of China, grant number 62003004.
Data Availability Statement
No new data were created or analyzed in this study. Data sharing is not applicable to this article.
Conflicts of Interest
Author Xin Guo was employed by the company Beijing Power Node Technology Co., Ltd. The remaining authors declare that the research was conducted in the absence of any commercial or financial relationships that could be construed as a potential conflict of interest.
Abbreviations
The following abbreviations are used in this manuscript:
| CCA | Common component architecture |
| PCDDB | Parallel component dynamic and distributed balance |
| SIDL | Scientific interface definition language |
References
- The Common Component Architecture Forum. Available online: https://cca-forum.github.io/cca-forum/overview/index.html (accessed on 1 February 2024).
- Furmento, N.; Mayer, A.; McGough, S.; Newhouse, S.; Field, T.; Darlington, J. Iceni: Optimisation of component applications within a Grid environment. Parallel Comput. 2002, 28, 1753–1772. [Google Scholar] [CrossRef]
- Tian, T.H.; Tian, H.Y.; Jin, Y.Y. Performance skeleton analysis method towards component-based parallel applications. Comput. Sci. 2021, 48, 1–9. [Google Scholar] [CrossRef]
- Mo, Z.Y.; Yang, Z. Parallel computing component model for interdisciplinary multiphysicscoupling. Sci. Sin. Inf. 2023, 53, 1560. [Google Scholar] [CrossRef]
- Yang, D.L.; Jiao, M.; Han, Y.D. Design of a visual parallel computing framework based on low code concept. Inf. Technol. Informatiz. 2023, 12, 21–24. [Google Scholar] [CrossRef]
- Concerto: Parallel Adaptive Components. Available online: http://www-casa.irisa.fr/concerto/ (accessed on 1 February 2024).
- Osama, M.; Porumbescu, S.D.; Owens, J.D. A programming model for GPU load balancing. In Proceedings of the 28th ACM SIGPLAN Annual Symposium on Principles and Practice of Parallel Programming, Montreal, QC, Canada, 25 February–1 March 2023. [Google Scholar] [CrossRef]
- Wang, J.Z.; Fan, Z.L.; Bi, Q.; Guo, S.S. Monitoring-based dynamic load balancing approach in object-based storage system. Microelectron. Comput. 2022, 39, 69–76. [Google Scholar] [CrossRef]
- Ebneyousef, S.; Shirmarz, A. A taxonomy of load balancing algorithms and approaches in fog computing: A survey. Cluster. Comput. 2023, 26, 3187–3208. [Google Scholar] [CrossRef]
- Wang, C.B. Research on dynamic load balancing model based on machine learning. J. Heilongjiang Inst. Technol. 2022, 36, 22–26. [Google Scholar] [CrossRef]
- Zhang, L.L.; Zhang, F. Design of adaptive load balancing system for wearable electronic device communication terminal. Electron. Des. Eng. 2023, 31, 163–167. [Google Scholar] [CrossRef]
- Yang, Q.L.; Jiang, L.Y. Study on load balancing algorithm of microservices based on machine learning. Comput. Sci. 2023, 50, 313–321. [Google Scholar] [CrossRef]
- GRID COMPUTING-FIRB Project. Available online: http://ardent.unitn.it/grid/ (accessed on 1 February 2024).
- Sandia Software Portal. Available online: https://sandialabs.github.io/ (accessed on 1 February 2024).
- Babel Homepage. Available online: https://software.llnl.gov/Babel/#page=home (accessed on 1 February 2024).
- Libtool-GNU Project. Available online: https://www.gnu.org/software/libtool/ (accessed on 1 February 2024).
- MM5 Community Model Home. Available online: https://a.atmos.washington.edu/~ovens/newwebpage/mm5-home.html (accessed on 1 February 2024).
Disclaimer/Publisher’s Note: The statements, opinions and data contained in all publications are solely those of the individual author(s) and contributor(s) and not of MDPI and/or the editor(s). MDPI and/or the editor(s) disclaim responsibility for any injury to people or property resulting from any ideas, methods, instructions or products referred to in the content. |
© 2025 by the authors. Licensee MDPI, Basel, Switzerland. This article is an open access article distributed under the terms and conditions of the Creative Commons Attribution (CC BY) license (https://creativecommons.org/licenses/by/4.0/).