Abstract
Energy management strategies (EMS) in the context of electric or hybrid vehicles can optimize the available energy by minimizing consumption. Most optimization-based EMS are not real-time-applicable for an accurate estimation of future consumption. The performance of these strategies also strongly depends on the driving patterns, which may be influenced by road and traffic conditions, among other factors such as driving style, weather, vehicle type, etc. The primary contribution of this work is to develop a novel two-layer driving pattern recognition (DPR) system for roadway type and traffic classification, thus enabling the identification of unknown patterns for the enhancement of the prediction of energy consumption of an electric vehicle (EV). The novelty of this work lies in the development of a strategy based on real-time data which is capable of classifying driving patterns and implementing an optimized EMS based on the results of the DPR. In the approach, first, labels are defined based on statistical features related to speed followed by the creation of representative driving patterns (RDPs). A neural network-based classifier is then employed for classification into six classes based on four features. A training accuracy of 97.7% is achieved with the classification of unknown speed profiles into the known RDPs. Testing with patterns from two different test routes shows an accuracy of 97.45% and 96.98% during morning and 96.65% and 94.12% during evening hours, respectively. Apart from the route and time of data collection, accuracy is also a function of sampling time horizon and the threshold values chosen for the features. A sensitivity analysis was also performed to evaluate the relative importance of each feature. An EMS based on sequential quadratic programming (SQP) was combined with DPR for the computation of optimal energy consumption. Simulation results show that maximum and minimum energy savings of 61% and 18% were obtained under suburban low traffic and highway high traffic conditions, respectively. An eco-driving or driver speed advisory system may further be developed based on information obtained from multiple routes and varying traffic scenarios.
1. Introduction
Electric and hybrid vehicles (HV) are becoming increasingly popular due to their environmental benefits. Energy management strategies (EMSs) include different methods or techniques that aim to manage multiple aspects of optimal energy consumption to improve the performance of electric vehicles (EVs) [1]. The integration of EMS with EVs as a part of the eco-driving protocol may enable the smart management of driving speed profiles and help in achieving long-term sustainability goals. The main significance of optimized energy management lies in the achievement of better performance of vehicles with the desired set of characteristics, as defined by the user. An optimal EMS is an important requirement to be implemented to produce a final product which is not only smart and automated but also energy efficient.
In the past [2,3,4,5,6], different types of methods have been adopted for energy management in EVs or hybrid electric vehicles (HEVs). Depending on the mode of operation, the strategies can be classified as online or offline. In Figure 1, a broad classification of EMSs is listed based on online and offline approaches.
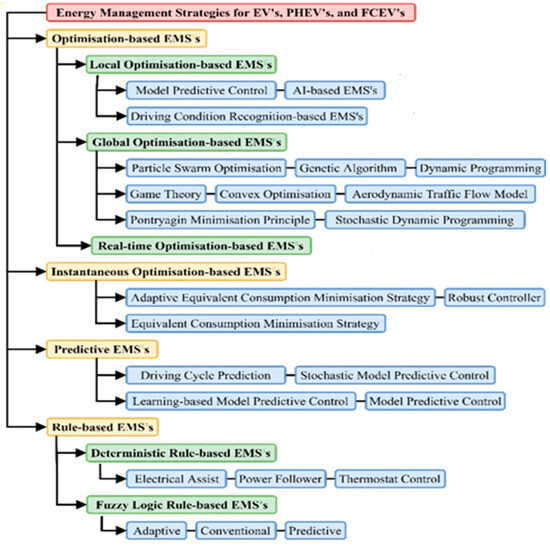
Figure 1.
Classification of EMSs for electric and HVs [2,3,4,5,6].
Online approaches are generally real-time-based algorithms such as predictive and instantaneous optimization techniques, whereas offline approaches are non-real-time and can provide a globally optimal solution. Predictive (prediction-based) and cognitive (recognition-based) energy management can enhance the performance of electric or HVs immensely [7]. In [8], a dynamic programming-based energy management strategy (EMS) is presented along with a general regression neural network (NN) for improving the system efficiency of a dual-motor battery electric vehicle (BEV). In [9], authors have developed an energy management system for the minimization of the total distribution costs of BEV batteries, which is considered along with the maximization of average utilization of batteries. In [10], a plug-in hybrid vehicle has been optimized for better fuel efficiency by using an adaptive and hierarchical EMS and classification based on fuzzy logic control. In [11], an adaptive wavelet transform–fuzzy logic control EMS has been combined with cluster analysis-based classification to divide power among the hybrid energy sources in an optimal manner. In [12], the fuel cell lifetime of HEVs is improved by using a NN classification that works with a genetic-algorithm-based EMS. Similarly, [13] achieved an improvement in the fuel efficiency of HEVs by optimizing power management using fuzzy logic-based strategies. In [14], the authors present a fuzzy-based EMS for fuel cell vehicles (FCV) by employing a particle swarm optimization algorithm for the better recognition of traffic conditions.
Further, in [15], a multi-mode EMS has been achieved for a fuel cell electric vehicle (FCEV). A Markov chain-based DPR classification has been employed for the improvement of fuel economy. In [16], authors minimized the fuel consumption of HEVs using the Euclid approach degree-based classification and simulated annealing-based EMS. In [17], the fuel consumption of HEVs has been minimized by using heuristic and optimal control strategies.
Similarly, in [18], fuel consumption and emission improvements of an HEV have been analyzed using clustering and torque division by employing classification and optimization, respectively. Further, in [19], a DPR-based optimization technique has been presented with a learning vector quantization classification system to improve the fuel economy of HEVs. In the case of an EV, a prior estimate of the load can be made depending upon the driving pattern of the driver, and information thus obtained can be used to extend the life and range of the battery [20]. As concluded from the literature, regardless of the type of vehicle, combining DPR with energy management may lead to significant improvements in fuel economy, energy consumption, battery life, performance, and efficiency [21,22]. Most of the existing literature focuses on the optimization of the energy consumption in electric vehicles; however, achieving real-time prediction and optimization of energy consumption is a challenging task, necessitating the need for the development of DPR-based EMS. DPR may enable driving suggestions and the identification of traffic congestion patterns along with suggestions of energy-efficient routes. It may also lead to the implementation of an optimized EMS to control the vehicle speed and realize eco-driving. Minimizing the energy consumption of an EV considering a given route and traffic situation is one of the goals of eco-driving. However, due to several technical, computational, and operational challenges, the realization of eco-driving becomes difficult. As decisions when driving must be made within milliseconds, real-time-applicable DPR and EMS are required.
In the present work, real-time-applicable EMS is integrated with DPR to overcome the challenges faced in achieving optimality in real-time scenarios. The novelty of the contribution lies in the development of the two-layer DPR, which is capable of organizing unknown driving patterns into known representative driving patterns (RDPs) by recognizing the patterns in terms of road and traffic conditions. Longer and shorter sampling horizons have been chosen for road and traffic conditions, respectively. RDPs are used to represent road and traffic conditions for a certain driving route. The characterization of real and standard driving patterns has have been performed in terms of four features, namely average speed, positive and negative acceleration, and number of stops. Unknown patterns are classified into the known RDPs by employing a multi-layer perceptron neural network (MLPNN) with six classes, namely highway high and low traffic, sub-urban high and low traffic, and urban high and low traffic. A sequential quadratic programming (SQP)-based energy management strategy (EMS) is considered for the optimization of energy consumption of an EV. The feasibility of DPR is verified by subjecting the classifier to an unknown mixed pattern generated as a result of combining different standard cycles. The DPR is also evaluated for two test route data points to evaluate the classification accuracy with changing routes and data collection timings. The impact of road and traffic on energy consumption prediction has been evaluated on the different test data. A comparison analysis of results has also been performed to indicate that an EMS with DPR can lead to more energy savings.
This paper is organized as follows. In Section 2, DPR is developed for roadway type and traffic recognition. Section 2.4 discusses EMS problem formulation using sequential quadratic programming (SQP). The results and discussion are presented in Section 3, followed by the conclusion in Section 4.
2. DPR for Roadway and Traffic Type Classification
In this section, a two-layer DPR is discussed. The first step is to prepare the data by sampling at different intervals, and labeling the sampled data. Three target classes are defined based on roadway type and three based on traffic. The main idea is to generate RDPs corresponding to roadways and traffic situations for a certain route. The generation of RDPs is based on data collected along the real route and information available from standard cycles. Finally, an MLPNN-based classifier is used to classify an unknown pattern into the target classes.
2.1. Data Analysis and Formation of RDPs
As a first step, data are collected using an on-board diagnostic (OBD) device from a fixed route at different times of the day for a month. The selected route is a drive over a distance of 10.4 km. The differences in morning and evening average travel times are noted due to variations in traffic, as shown in Figure 2.
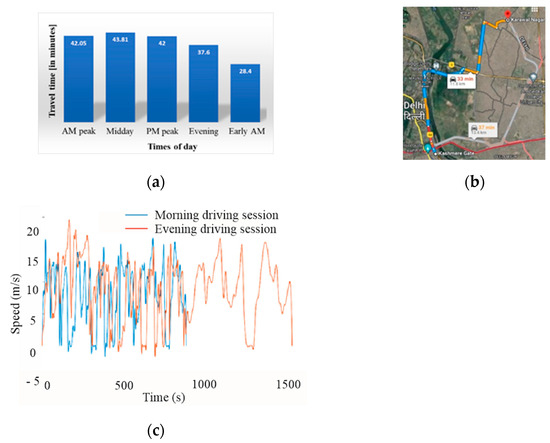
Figure 2.
Speed data collection along a route: (a) variations in average travel time, (b) route map, and (c) variations in driving profile.
The collected speed versus time data have been used to extract certain critical characteristic features, such as average speed within a window of 100 s (, average positive and negative acceleration within a window of 10 s ( and ), and 5 s (), respectively, along with attributes like number of stops, time of the day, and day of the week. For the classification of roadway type, a sampling time of 100 s is chosen to calculate the average speed. For the classification of traffic type, within the 100 s sampling interval, the data are further sub-sampled for intervals of 10 and 5 s.
In the next step, target classes are defined and IF-ELSE rules are formulated for the classification of the target classes, as shown in Figure 3.
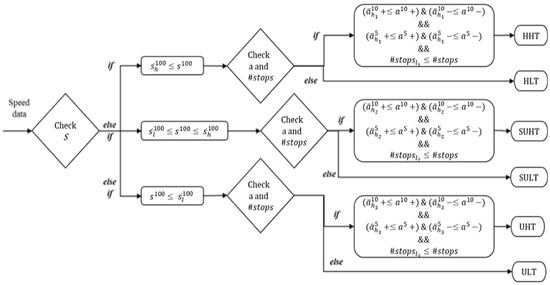
Figure 3.
Flow diagram describing different target classes.
The six target classes considered are target class 1: highway high traffic (HHT); target class 2: highway low traffic (HLT); target class 3: suburban high traffic (SUHT); target class 4: suburban low traffic (SULT); target class 5: urban high traffic (UHT); and target class 6: urban low traffic (ULT). When sampled at 100 s, the first condition checked is that of average speed. The comparison of a 100 s average speed with a higher ( and lower bound () gives an estimate about the roadway type. The next conditions which are checked are related to the traffic condition, namely, , , , and number of stops (.
- Case 1: If , then an estimate is made about the roadway type being a highway. If , , , , and , the traffic condition is considered to be high traffic, and otherwise low traffic type.
- Case 2: If then the road condition is considered to be suburban. If , , , , and , then the traffic condition is considered to be high traffic, and otherwise low traffic type.
- Case 3: If then the road condition is considered to be urban. If , , , , and , then the traffic condition is considered to be high traffic, and otherwise low traffic type.
In each case, the upper and lower thresholds are defined separately by taking into consideration the values associated with the standard cycles. Further, an analysis of four standard driving cycles was carried out in terms of the characteristic features, and the results are listed in Table 1. The table reveals the characteristic features of New York city cycle (NYCC), Artemis urban, urban dynamometer driving schedule (UDDS), and highway fuel economy test cycle (HWFET).

Table 1.
Characteristic features of standard drive cycles.
Based on the data collected under real driving conditions and the standard cycle data, synthetic datasets were generated and utilized to create RDPs. RDPs represent different driving conditions for roadway and traffic type and have been developed based on comparisons of characteristic features of real-time driving and standard cycles. On the basis of the characteristic features, four standard cycles were compared with the real data points to synthesize the pattern of RDPs. The six RDPs are shown in Figure 4.
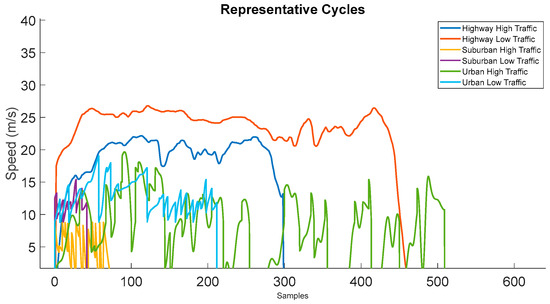
Figure 4.
RDPs for different road and traffic conditions.
2.2. Classification Employing MLPNN
The main task of classification is to identify an unknown driving cycle and translate it into one of the known target classes. Classification was performed using MLPNN, with specifications as given in Table 2.

Table 2.
Hyperparameters of MLPNN classifier.
The complete process of DPR is shown in Figure 5. After the data acquisition and pre-processing steps, a driving cycle database was used to train the MLPNN classifier. A classification into the six target classes was performed with an accuracy of 97.7% [23]. The RDP was used to select a pattern corresponding to the classified target classes. The selected pattern was then used to compute and optimize the energy consumption of the EV.
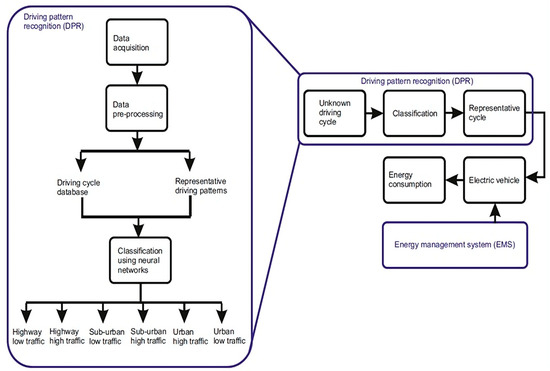
Figure 5.
Integration of EMS with DPR.
2.3. Energy Consumption of the EV
An EV model has been implemented in MATLAB-Simulink 2018a to analyze the energy consumption under different identified road and traffic conditions. An EV model consisting of vehicle dynamics, battery, and electric drive is considered with specifications in Table 3.

Table 3.
EV model specifications.
The total tractive force is given as [24]
where the mass is represented by and acceleration by . The velocity is given by and and are constants. The acceleration due to gravity is given by The tractive power is given as the sum of electrical losses and mechanical forces as
where represents the motor current demand and the motor resistance. The total power () is the sum of the electrical power loss, mechanical resistive losses and possible energy gained/lost from regeneration/driving, as
where is given by , with representing the armature constant and the magnetic flux. The radius of the tire is represented by R.
The energy consumption may be calculated as
2.4. EMS Problem Formulation Using SQP
Determination of optimal speed trajectory for minimum energy consumption by the vehicle is one of the targets of eco-driving. An SQP approach has been considered in this regard [25,26,27], as it scores over the dynamic optimization approach with a requirement of a lower computational burden. It is also better than the static optimization approach, as it can incorporate non-linearities. The eco-driving problem is formulated as
where represents the objective function, with as the target class representing HHT, HLT, SUHT, SULT, UHT, and ULT. The upper and lower bounds are as
Equations (1)–(4) can be converted to a finite-dimensional optimization problem by using Euler’s discretization, as
where k ∈ K = {0, 1, 2, … K − 1}, with K being the optimization horizon, u = {u0, … uk − 1} being the input variables or decision variables, and x = {x0, … xk} being the state variables.
Here,
where τ is the step size and are non-negative model parameters.
As is not positive definite, the problem is non-convex. In order to reach a global minimum, SQP aims to solve the non-convex or non-linear problem by sequentially solving linearly constrained quadratic programs of (6), as
Subject to linear states,
such that the SQP subproblems (8) and (9) are convex and convergent. Here, is added to ensure strict convex behavior.
3. Results and Discussion
In this section, the proposed DPR-based EMS is evaluated in different stages. First, a standard cycle comprising mixed individual known driving cycles is classified with the DPR and the formation of the RDPs is verified. Next, test data collected from two different routes at two different timings are used to evaluate the accuracy of the model. The effect of increasing time frame on classification accuracy is also evaluated. As a next step, a sensitivity analysis is conducted by varying the thresholds of speed and acceleration. Moreover, the relative importance of features on the classification result is analyzed. Finally, the proposed DPR with the EMS is implemented under varying driving conditions.
The simulation was performed on an Intel (R) Core (TM) system with i5-1155G7 at 2.50 GHz. The system had a 64-bit operating system, with a x64-based processor. For real-time implementation, two options of on-board (Edge AI) or off-board processing (Cloud AI) could be considered. Embedded GPUs (Graphics Processing Units) and higher RAM capacities are required for advanced deep learning models with 10–15 trillion operations per second. Cloud AI is useful in offloading heavy computations from the vehicle and is particularly useful in the optimization of high-performing neural networks.
A mixed driving cycle is developed by combining individual standard driving cycles to verify the accuracy of RDPs and DPR processes. A training accuracy of 97.7% is achieved with the classification of unknown speed profiles into the known RDPs. In Figure 6, it can be observed that the mixed cycle comprising sections from standard cycles can be successfully classified into the respective target classes.
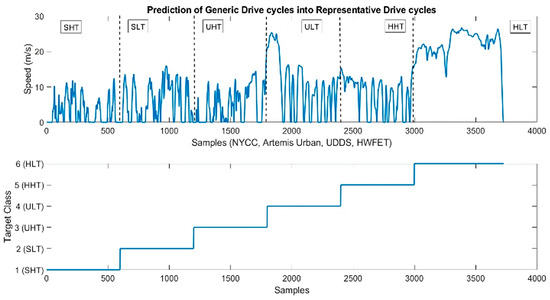
Figure 6.
Classification of mixed cycle into RDPs.
Next, driving data collected over two test routes during early morning and evening, with specifications given in Table 4, are analyzed. The speed and acceleration over time show the variations in pattern due to road and traffic conditions, as shown in Figure 7. The positive and negative values indicate positive and negative acceleration, respectively. The accuracy of classification for both routes at the two timings are shown in Figure 8. The validation accuracy is slightly less than the training accuracy. The accuracy is higher for test route 1 than test route 2, mainly due to the fact that the speed variations are higher in test route 2. Moreover, with heavier traffic in the evening, the accuracy values are less than those in the morning. This can be solved by considering different time horizons or sampling intervals.

Table 4.
Specifications of data collection over test routes.
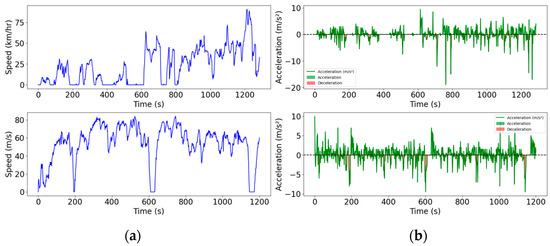
Figure 7.
Driving speed and acceleration during (a) test route 1 and (b) test route 2.
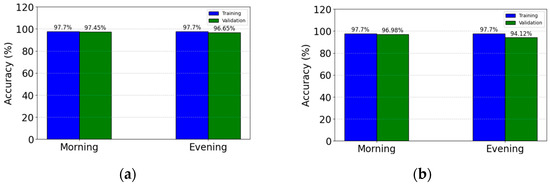
Figure 8.
Accuracy in % for morning and evening data for (a) test route 1 and (b) test route 2.
The timing of data collection is essential for understanding the influence of traffic. The labels of test route 1 during evening and early morning hours are shown in Figure 9. As noted from the figure, the data during the evening have a higher percentage of high traffic regions and hence more times of occurrence of UHT. The data during the morning have more frequent occurrence of ULT.
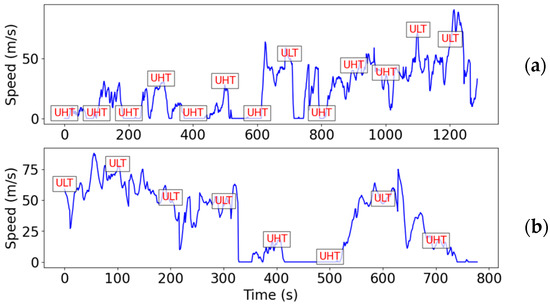
Figure 9.
Labels for test route 1 sampled every 100 s for (a) evening and (b) early morning.
The sampling interval for acceleration data changed from 100 s to 10 s and then to 5 s. The corresponding values of training and validation accuracy are recorded in Table 5. An effect of varying the time horizon of the acceleration data can be observed. For the data from early morning, decreasing the time horizon from 100 s to 10 s led to significantly higher accuracy, but decreasing it from 10 s to 5 s did not bring much improvement. This is due to the fact that although analyzing shorter segments is useful in predicting traffic conditions, too much shortening does not lead to meaningful results. For the data from the evening, the improvement in accuracy due to a decrease in time horizon is more significant than in the case of the morning dataset. Decreasing the time horizon to 5 s, however, brings a slight improvement.

Table 5.
Accuracy and loss over 100 s speed samples for test route 1 with varying acceleration samples.
As a next step, the influence of speed and acceleration thresholds on the classification accuracy were analyzed. In Figure 10, the confusion matrix for test route 1 during the evening session is shown. Increasing the threshold values led to more data being correctly classified. When threshold values were increased by 5%, 167 samples were classified as UHT and 77 as ULT, as shown in the confusion matrix. In this case, five samples were wrongly classified as SHT, three as HLT, and four as HHT. When threshold values decreased by 5%, 143 samples were classified as UHT and 66 as ULT. In this case, 35, 6 and 7 samples were wrongly classified as SHT, SLT and HLT, respectively.
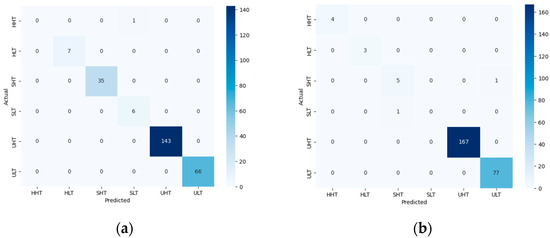
Figure 10.
Confusion matrix for test route 1 during the evening with threshold values: (a) decreased by 5%; (b) increased by 5%.
In Figure 11, the confusion matrix for test route 1 during the morning session is shown. Increasing the threshold values led to more data being correctly classified. When threshold values increased by 5%, 92 samples were classified as ULT and 52 as UHT. In this case, four samples were wrongly classified as SHT and one as HLT. When threshold values decreased by 5%, 79 and 65 samples were classified as ULT and UHT, respectively. In this case, four samples were wrongly classified as SHT.
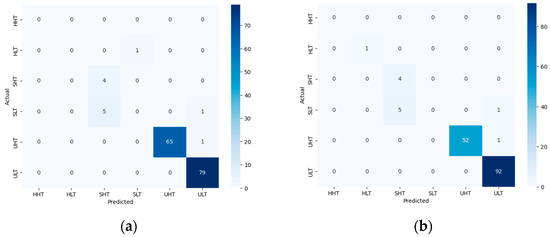
Figure 11.
Confusion matrix for test route 1 during the morning with threshold values: (a) decreased by 5%; (b) increased by 5%.
The relative importance of the four features, namely speed, positive and negative acceleration, and number of stops, was evaluated through F-score and p-value to measure the effectiveness with which each of these features separates the different classes. As shown in Table 6, for both routes, speed is the most determining feature for classification as its F score value is the highest. For test route 1, positive and negative acceleration do not play such vital roles as in test route 2. This is because this route has higher changes in acceleration and deceleration values. Moreover, the number of stops has a higher occurrence in test route 1 than test route 2, and hence a higher F score value in test route 1. The p-value indicates the relevancy of the feature for classification. Since p-values are less than 0.05 for all features, they are all relevant in the classification process.

Table 6.
F-score and p-value for the different features over the two test routes.
The energy management problem solved using SQP provides the reference speed values for optimized energy consumption of the EV. As shown in Figure 12, with the mixed speed profile, the classification using DPR provides information about the type of driving and traffic situation. EMS provides reference speed values corresponding to minimum energy consumption.
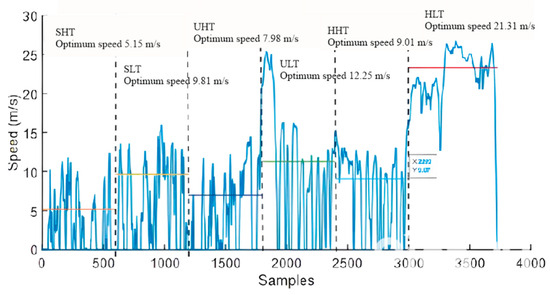
Figure 12.
Reference speed and energy values.
The energy consumption of the vehicle and the battery state of charge (SOC) are shown in Figure 13 and Figure 14, respectively. The energy is observed to be increasing over time and the battery SOC has been depleted to a minimum value over time.
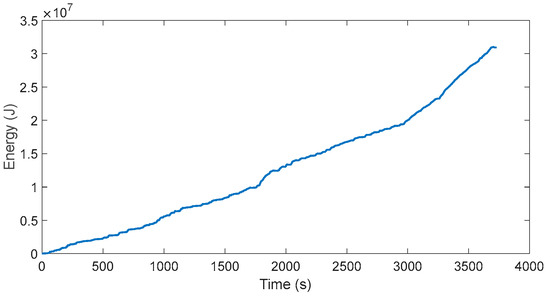
Figure 13.
Energy consumption with the mixed cycle.
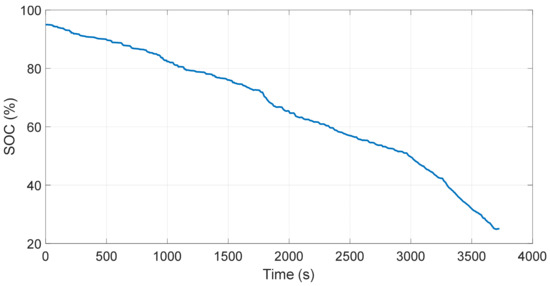
Figure 14.
Battery SOC with the mixed cycle.
Table 7 depicts the energy consumption of the six RDPs obtained through analysis of the EV model. For the highway type of roadway, the energy consumption falls under the range of 3.825–7.96 kWh for different road traffic conditions. Similarly, for the suburban and urban types of roadways, the energy consumption lies in the range of 0.985–0.964 kWh and 2.87–5.46 kWh, respectively. It can be observed that the error in the case of energy consumption obtained under real driving conditions and as calculated by the RDPs is relatively small.

Table 7.
Energy consumption and error calculation.
Figure 15 depicts a comparison between the energy consumption predicted with and without applying DPR.
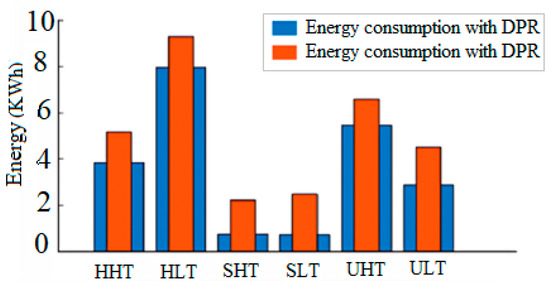
Figure 15.
Energy consumption as predicted by the RDPs.
Table 8 further elaborates the optimum speed and average value of optimum energy consumption obtained with EMS from Table 7 and Table 8. It is observed that the total energy consumption without EMS is significantly higher than optimum energy (with EMS).

Table 8.
Optimal speed and energy consumption.
Integration of DPR with EMS may lead to a significant improvement in energy savings. However, several practical challenges prevent the successful implementation of this technology. Firstly, large datasets are required, considering multiple factors related to the vehicle and the environment under which the vehicle is being driven, and how the vehicle is being driven. Secondly, low-latency and lightweight solutions are required to ensure the real-time applicability of the system. Thirdly, generalizability over multiple regions with varying conditions requires an adaptive approach. Finally, dynamic unknown factors related to the traffic, accidents, roadblocks, and driving habits need to be considered.
4. Conclusions
In this contribution, a two-layer DPR has been developed to classify an unknown driving cycle into one of the predefined templates or RDPs. The DPR has been implemented with an EV model and SQP-based optimized EMS. The predicted energy consumption has been analyzed along with the implementation of EMS to achieve an optimal speed profile for minimizing energy consumption. The simulation results indicate that the DPR is able to generalize well over different routes and traffic conditions. However, training with a larger database with data from multiple regions under varied traffic conditions can improve the testing accuracy further. A consideration of other factors, such as weather, driving style, unknown incidents during the drive, and charging patterns of the EV, may also provide more insight into the applicability of the DPR. As concluded from the present work, DPR-based EMS can provide lower energy consumption. The optimal speed profile can either be maintained by virtue of eco-driving or provided as advice to the human driver. As part of future work, complete control loop may be implemented to realize eco-driving. More advanced artificial intelligence (AI) tools may be implemented to improve the accuracy of classification. A hardware application can also be considered with on-board (edge-AI) and off-board (cloud AI) systems.
Author Contributions
Conceptualization, B.M.; methodology, B.M.; validation, B.M. and S.K.; formal analysis, M.I.; resources, B.M. and S.K.; writing—original draft preparation, B.M. and S.K.; writing—review and editing, M.I.; supervision, M.I.; project administration, M.I. All authors have read and agreed to the published version of the manuscript.
Funding
This research received no external funding.
Data Availability Statement
The data can be made available upon reasonable request from the authors.
Conflicts of Interest
The authors declare that they do not have any conflicts of interest, and nor do they have any financial or non-financial interests that are directly or indirectly related to the work submitted for publication.
References
- Al-Dhaifallah, M.; Ali, Z.M.; Alanazi, M.; Dadfar, S.; Fazaeli, M.H. An efficient short-term energy management system for a microgrid with renewable power generation and electric vehicles. Neural Comput. Appl. 2021, 33, 16095–16111. [Google Scholar] [CrossRef]
- Aldosary, A.; Rawa, M.; Ali, Z.M.; Latifi, M.; Razmjoo, A.; Rezvani, A. Energy management strategy based on short-term resource scheduling of a renewable energy-based microgrid in the presence of electric vehicles using θ-modified krill herd algorithm. Neural Comput. Appl. 2021, 33, 10005–10020. [Google Scholar] [CrossRef]
- Zhang, F.; Xiao, L.; Coskun, S.; Pang, H.; Xie, S.; Liu, K.; Cui, Y. Comparative study of energy management in parallel hybrid electric vehicles considering battery ageing. Energy 2023, 264, 123219. [Google Scholar] [CrossRef]
- Kong, H.; Yan, J.; Wang, H.; Fan, L. Energy management strategy for electric vehicles based on deep Q-learning using Bayesian optimization. Neural Comput. Appl. 2020, 32, 14431–14445. [Google Scholar] [CrossRef]
- Son, N.N.; Van Cuong, N. Neuro-evolutionary for time series forecasting and its application in hourly energy consumption prediction. Neural Comput. Appl. 2023, 35, 21697–21707. [Google Scholar] [CrossRef]
- Zhang, J.; Xu, F.; Zhang, Y.; Shen, T. ELM-based driver torque demand prediction and real-time optimal energy management strategy for HEVs. Neural Comput. Appl. 2020, 32, 14411–14429. [Google Scholar] [CrossRef]
- Ali, M.A.; Moulik, B. On the role of intelligent power management strategies for electrified vehicles: A review of predictive and cognitive methods. IEEE Trans. Transp. Electrif. 2022, 1, 368–383. [Google Scholar] [CrossRef]
- Hu, J.; Niu, X.; Jiang, X.; Zu, G. Energy management strategy based on driving pattern recognition for a dual-motor battery electric vehicle. Int. J. Energy Res. 2019, 43, 3346–3364. [Google Scholar] [CrossRef]
- Zhou, B.; Zhao, Z. Multi-objective optimization of electric vehicle routing problem with battery swap and mixed time windows. Neural Comput. Appl. 2022, 34, 7325–7348. [Google Scholar]
- Zhang, S.; Xiong, R. Adaptive energy management of a plug-in hybrid electric vehicle based on driving pattern recognition and dynamic programming. Appl. Energy 2015, 155, 68–78. [Google Scholar] [CrossRef]
- Hu, J.; Liu, D. Intelligent energy management strategy of hybrid energy storage system for electric vehicle based on driving pattern recognition. Energy 2020, 198, 117298. [Google Scholar] [CrossRef]
- Zhang, R.; Tao, J.; Zhou, H. Fuzzy optimal energy management for fuel cell and supercapacitor systems using neural network based driving pattern recognition. IEEE Trans. Fuzzy Syst. 2019, 27, 45–57. [Google Scholar] [CrossRef]
- Wei, Z.; Xu, Z.; Halim, D. Study of HEV power management control strategy based on driving pattern recognition. Energy Procedia 2016, 88, 847–853. [Google Scholar] [CrossRef]
- Kandi Dayeni, M.; Soleymani, M. Intelligent energy management of a fuel cell vehicle based on traffic condition recognition. Clean Technol. Environ. Policy 2016, 18, 1945–1960. [Google Scholar] [CrossRef]
- Zhou, Y.; Ravey, A.; Péra, M.C. Multi-mode predictive energy management for fuel cell hybrid electric vehicles using Markov driving pattern recognizer. Appl. Energy 2020, 258, 114057. [Google Scholar] [CrossRef]
- Lei, Z.; Cheng, D.; Liu, Y.; Qin, D.; Zhang, Y.; Xie, Q. A dynamic control strategy for hybrid electric vehicles based on parameter optimization for multiple driving cycles and driving pattern recognition. Energies 2017, 10, 54. [Google Scholar] [CrossRef]
- Keulen, T.V.; De Jager, B.; Kessels, J.; Steinbuch, M. Energy management in hybrid electric vehicles: Benefit of prediction. IFAC Proc. 2010, 43, 264–269. [Google Scholar] [CrossRef]
- Yokoi, Y.; Ichikawa, S.; Doki, S.; Okuma, S.; Naitou, T.; Shiimado, T.; Miki, N. Driving pattern prediction for an energy management system of hybrid electric vehicles in a specific driving course. In Proceedings of the 30th Annual Conference of IEEE Industrial Electronics Society, Busan, Republic of Korea, 2–6 November 2004; Volume 2, pp. 1727–1732. [Google Scholar]
- He, H.; Sun, C.; Zhang, X. A method for identification of driving patterns in hybrid electric vehicles based on a LVQ Neural Network. Energies 2022, 9, 3363–3380. [Google Scholar] [CrossRef]
- Kajiwara, S. Driver-condition detection using a thermal imaging camera and neural networks. Int. J Automot. Technol. 2021, 22, 1505–1515. [Google Scholar] [CrossRef]
- Mehranfar, S.; Banagar, I.; Moradi, J.; Andwari, A.M.; Könnö, J.; Gharehghani, A.; Rabiei, M.; Kurvinen, E. The perspective of energy storage systems advancements and challenges for electric vehicle applications; metric, mechanism, mode, and mitigation framework. Future Sustain. 2024, 2, 22–32. [Google Scholar] [CrossRef]
- Habib, A.R.R.; Butler, K. Environmental and economic comparison of hydrogen fuel cell and battery electric vehicles. Future Technol. 2022, 1, 25–33. [Google Scholar] [CrossRef]
- Moulik, B.; Kaur, S.; Ranjan, S.; Dixit, S. Analysing the Energy Consumption of Urban Electric Vehicles for Real Driving Scenarios. IETE J. Res. 2024, 70, 5799–5809. [Google Scholar] [CrossRef]
- Li, M.; Wu, X.; He, X.; Yu, G.; Wang, Y. An eco-driving system for electric vehicles with signal control under V2X environment. Trans. Res. Part C Emerg. Technol. 2018, 93, 335–350. [Google Scholar]
- Zhang, Y.; Liu, Y.; Huang, Y.; Chen, Z.; Li, G.; Hao, W.; Cunningham, G.; Early, J. An optimal control strategy design for plug-in hybrid electric vehicles based on internet of vehicles. Energy 2021, 228, 120631. [Google Scholar]
- López-Rojas, A.D.; Cruz-Villar, C.A. Neural networks as an approximator for a family of optimization algorithm solutions for online applications. Neural Comput. Appl. 2024, 36, 3125–3140. [Google Scholar]
- Khalik, Z.; Padilla, G.P.; Romijn, T.C.J.; Donkers, M.C.F. Vehicle energy management with ecodriving: A sequential quadratic programming approach with dual decomposition. In Proceedings of the 2018 Annual American Control Conference (ACC), Milwaukee, WI, USA, 27–29 June 2018; pp. 4002–4007. [Google Scholar]
Disclaimer/Publisher’s Note: The statements, opinions and data contained in all publications are solely those of the individual author(s) and contributor(s) and not of MDPI and/or the editor(s). MDPI and/or the editor(s) disclaim responsibility for any injury to people or property resulting from any ideas, methods, instructions or products referred to in the content. |
© 2025 by the authors. Licensee MDPI, Basel, Switzerland. This article is an open access article distributed under the terms and conditions of the Creative Commons Attribution (CC BY) license (https://creativecommons.org/licenses/by/4.0/).