Abstract
Cardiovascular diseases (CVDs) are among the leading causes of mortality worldwide, particularly in Mexico, where rural regions face challenges due to limited access to medical equipment. This preliminary study proposes a low-cost cardiovascular disease classifier, Buazduino-001, which integrates machine learning (ML) techniques with Arduino-based technology to provide accessible and non-invasive risk assessment. Three classical ML models—logistic regression, random forest, and support vector machine—were implemented and evaluated using a dataset of 303 patients from the UCI Machine Learning Repository. This study introduces a six-stage methodology, including a novel step that prioritizes non-invasive attributes to optimize diagnostic time and cost. The random forest model demonstrated the best performance, achieving 87% classification accuracy, with a reduced feature set of five attributes (sex, age, chest pain, heart rate, and exercise-induced angina). In this preliminary study, the system was validated experimentally with 30 patients, confirming an 85% accuracy and an 80% reduction in diagnostic time compared to traditional medical assessments. The results highlight the practicality of combining ML with low-cost electronics to address healthcare gaps in resource-limited settings. While this study is preliminary, the Buazduino-001 system demonstrates potential for early CVD risk detection and could serve as a screening tool in rural clinics, complementing conventional diagnostic methods.
1. Introduction
Cardiovascular diseases (CVDs) are among the leading causes of mortality worldwide and can lead to severe cardiac complications, including heart disease [1]. In Mexico, CVDs accounted for 23.5% of total deaths in 2019, representing 156,041 fatalities out of the 88.8% of deaths attributed to non-communicable diseases [2]. This situation is even more critical in rural areas, where the lack of advanced medical equipment limits timely diagnosis and treatment, increasing the vulnerability of the population to these conditions [3]. The absence of medical equipment in Mexican rural clinics is mainly due to its high costs. However, this problem can be partially solved with the combination of two practical and low-cost tools, the first is the use of machine learning techniques and the second consists of using Arduino-based equipment [4,5].
Previous research has applied machine learning to a variety of cardiovascular diseases, demonstrating its effectiveness in risk prediction and diagnosis. For instance, ML models have been used to predict coronary artery disease (CAD) by analyzing clinical parameters, such as cholesterol levels and electrocardiogram features [6]. Other studies have focused on heart failure prediction, utilizing patient demographics and echocardiographic data to assess the likelihood of disease progression [7]. Additionally, ML algorithms have been employed for arrhythmia classification, leveraging electrocardiographic signals to detect abnormalities in cardiac rhythms [8]. These applications highlight the versatility of ML in cardiovascular research and support its potential for developing low-cost, accessible diagnostic tools.
Several studies have demonstrated that machine learning (ML) techniques can assist in classifying and predicting cardiovascular diseases with high accuracy. Algorithms such as logistic regression (LR), random forest (RF), and support vector machines (SVM) have been widely used in clinical applications to assess cardiovascular risk, providing reliable diagnoses without requiring costly and invasive testing (Table 1) [2,3]. Additionally, the integration of ML models with low-cost hardware solutions, such as Arduino-based systems, has led to the development of portable and accessible medical diagnostic tools [4,5].

Table 1.
Main characteristics and advantages.
The second tool, the Arduino board, has a wide range of applications [12], such as low-cost cameras to study animal behavior [13], greenhouse monitoring systems [14], and even systems for fluorescence detection [15], among other applications [16,17].
Additionally, this board is low-cost, and the user does not need to have advanced knowledge in electronics and programming to use it. So, the Arduino board is a novel solution to design low-cost lab equipment, avoiding the high costs of lab equipment. The scientific community is using the Arduino Board to develop low-cost technologies, which have been implemented in different fields of study [18,19].
The combination of the two previous tools (machine learning and Arduino) can be a preliminary proposal to the problem of the absence of medical equipment in rural clinics in Mexico. Therefore, this study aims to develop a machine learning-based cardiovascular risk classifier, prioritizing the use of non-invasive attributes (features) to facilitate its implementation in resource-limited settings. The model is trained and validated using the Heart Disease dataset from the UCI Machine Learning Repository, which includes the clinical and demographic data from 303 patients. The classifier focuses on detecting the risk of cardiovascular disease (CVD) by analyzing key non-invasive attributes, such as age, sex, chest pain type, resting blood pressure, cholesterol levels, fasting blood sugar, maximum heart rate, and exercise-induced angina.
To achieve this, a six-stage methodology is proposed, incorporating a novel step that distinguishes between invasive and non-invasive attributes, optimizing both diagnostic time and cost. The classifier is implemented using three classical machine learning techniques: logistic regression, random forest, and support vector machine. The main contribution of this research is the development of a low-cost system, called Buazduino-001, which enables cardiovascular disease risk classification through a step-by-step implementation procedure. The principal advantage of this classifier is its reliance on non-invasive attributes, reducing the need for expensive and time-consuming laboratory tests.
Additionally, as this is a preliminary study, the selected patient sample was relatively small. Despite this, a high classification accuracy of 87% was obtained using the random forest algorithm, demonstrating the feasibility of this approach. The results of this research can provide a viable solution for the early detection of cardiovascular diseases in populations with restricted access to specialized medical services, promoting the use of affordable technology in healthcare.
2. Materials and Methods
First, the methodology used for patient data classification is presented. Additionally, one new stage has been proposed to assign each attribute as “invasive” and “non-invasive”. The proposed new stage has two characteristics: (1) classification between invasive and non-invasive attributes, and (2) reduction of diagnosis time. Also, this section describes each stage in detail. In the first subsection some preliminaries of LR, RF, and SVM, are presented, then in a second subsection the low-cost electronic device Arduino-based components are described, which are required to implement the retained algorithms. Also, the heart rate sensor used in this study is the MAX30100, a pulse oximeter and heart rate monitoring sensor manufactured by Maxim Integrated (San Jose, CA, USA). The sensor is designed for the non-invasive measurement of heart rate and blood oxygen saturation (SpO2) levels by utilizing a combination of infrared (IR) and red light-emitting diodes (LEDs) along with a photodetector to measure changes in blood volume. The MAX30100 has been widely used in wearable medical devices due to its low power consumption and compact design, making it suitable for integration into portable health monitoring systems. The sensor was integrated into the Buazduino-001 classifier, and its measurements were validated against a commercial pulse oximeter to ensure accuracy.
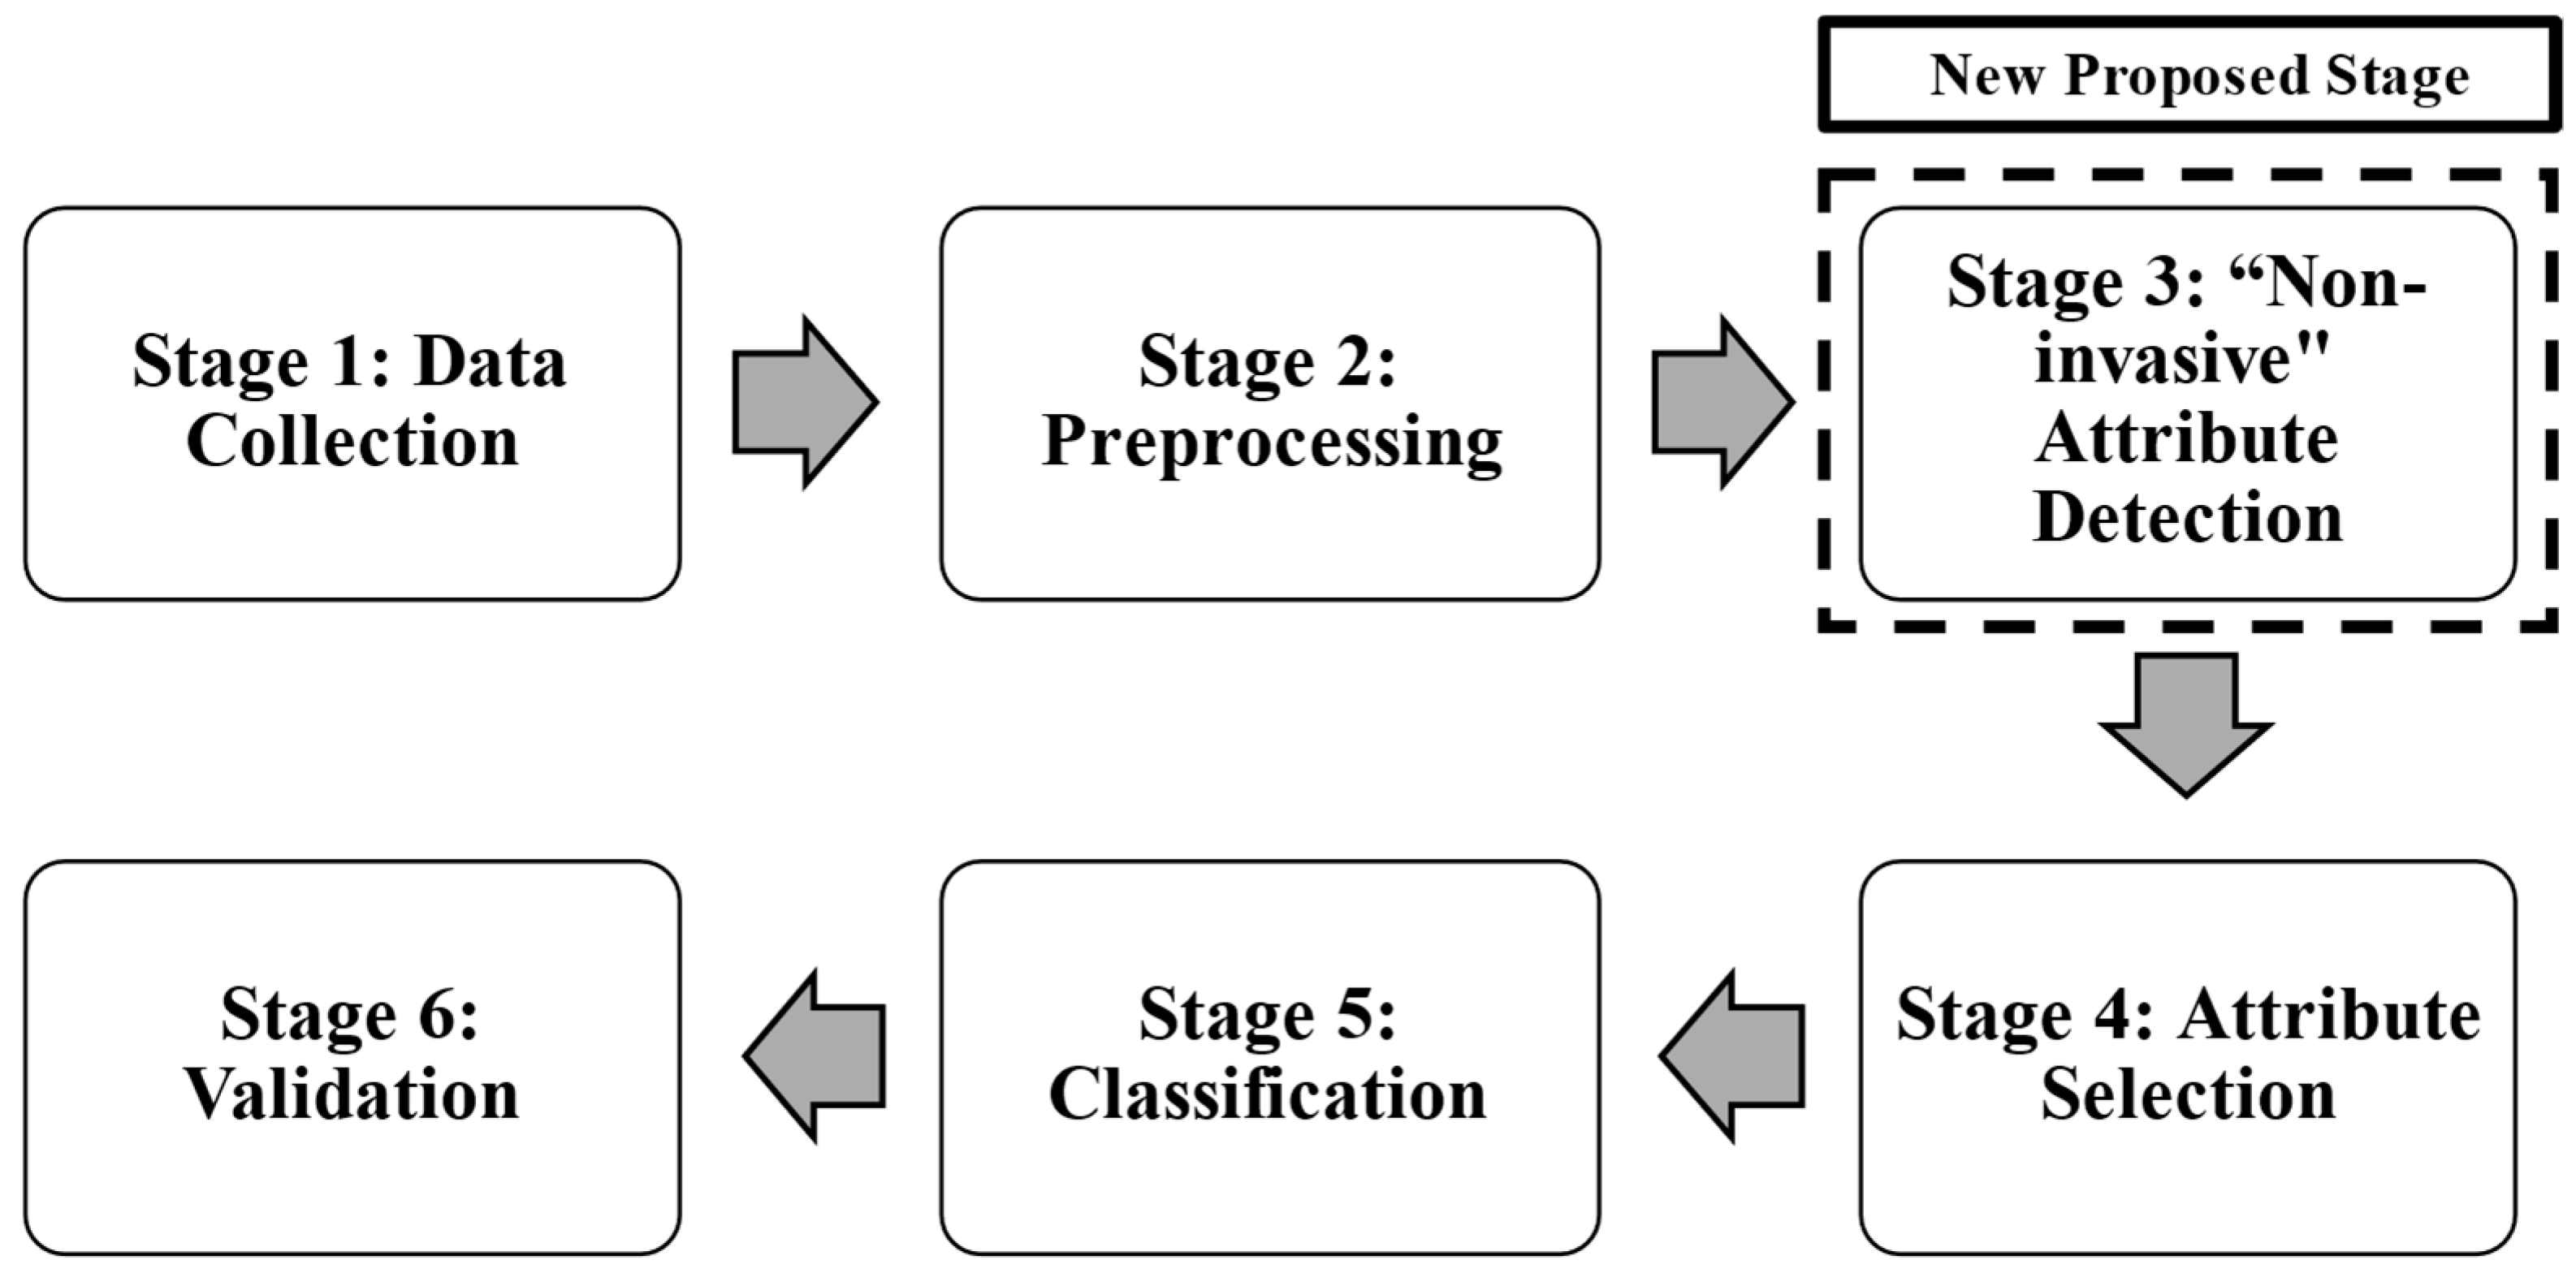
In the third subsection, the characteristics of the patients “Experimental data” is described. Finally, the Buazduino-001 cardiovascular risk classifier is presented, and its operation procedure is described in detail. The machine learning algorithms are now analyzed. Normally, to process patient cardiovascular health information, five stages are used, according to Fayyad et al. [20], but these stages do not distinguish between invasive and non-invasive attributes. For this reason, in this work it is proposed to add an additional step in the methodology normally used to classify information. This new stage considers a classification between invasive and non-invasive attributes (features). An advantage of this proposed stage is to quickly know the diagnosis of a patient. Using the new proposed stage, it was possible to classify between a “high” or “low” risk of cardiovascular disease. Figure 1 shows the methodology used to classify cardiovascular risk, and to determine the risk of cardiovascular disease. Each stage is described as follows:

Figure 1.
Proposed methodology, using a new third stage.
Stage 1: Data Collection was performed using the database “The Heart Disease Data Set”, it comes from the UCI Machine Learning Repository [21]. This database is available for free use and has 14 attributes (features or characteristics) and 303 patients (observations). It consists of multiple clinical and diagnostic attributes, including patient demographics, vital signs, and test results. The dataset includes both numerical and categorical variables, which are essential for model training and feature selection.
The primary objective of this dataset is to predict the presence of heart disease using non-invasive clinical measurements. The target variable, “target”, indicates whether a patient has heart disease (1) or not (0).
This database allows for training and testing the proposed algorithm to predict cardiovascular disease risk. In Stage 2, preprocessing consists of identifying errors (outliers and missing values) in each attribute and observation. Once the data had been preprocessed, a database with 14 attributes and 298 observations was obtained. Finally, a univariate analysis was performed to determine the type of data distribution and its correlation. At Stage 3, the “non-invasive” feature detection and indiscriminate selection of attributes is carried out. This affects the diagnosis generated by the machine learning algorithm, leading to wasted time and financial resources. To address this, an additional step is introduced in the existing methodology.
A critical step in this methodology involved separating the attributes into two groups: “invasive” and “non-invasive”. The classification of attributes was performed based on expert consultation in the medical field.
The distinction was made to prioritize features that can be obtained without specialized clinical procedures, thereby facilitating a rapid and accessible cardiovascular risk assessment. Non-invasive attributes were selected to minimize patient discomfort and simplify data collection. The eight non-invasive attributes considered were: age, sex, chest pain type, resting blood pressure, serum cholesterol, fasting blood sugar, maximum heart rate, and exercise-induced angina. Blood pressure was measured on the upper arm (brachial artery) using a standard sphygmomanometer. The measurement was taken in a seated position after at least five minutes of rest, following standard clinical guidelines. Serum cholesterol and fasting blood sugar were obtained through venous blood samples, analyzed using enzymatic colorimetric methods commonly used in clinical diagnostics. The tests were conducted in a fasting state (at least 8 h) to ensure accuracy. The heart rate was recorded using the MAX30100 sensor, while the presence of angina during physical activity was determined based on patient self-report and physician evaluation. All studies and measurements were supported and validated by a health expert. To validate the impact of these attributes on classification performance, the forward selection technique was applied. This method incrementally selected features that contributed most to model accuracy, ensuring optimal classification performance with a minimal number of attributes.
This sequential feature selection method starts with an empty set of features and iteratively adds one attribute at a time, selecting the one that provides the most significant improvement in model performance at each step. The process follows these key steps:
Initial Model Setup: The classification algorithm is trained using an empty set of predictors.
Incremental Feature Addition: Attributes are added one-by-one based on their individual contribution to model performance, which is assessed using a predefined evaluation metric (AUC).
Performance Evaluation: After each addition, the model’s performance is measured. If adding a feature improves classification accuracy beyond a set threshold, the feature is retained.
Stopping Criterion: The process continues until adding further attributes does not yield a statistically significant improvement in performance.
Algorithm 1 shows the pseudocode of the forward selection algorithm implemented in this work.
| Algorithm 1: Forward Selection |
| 1. Initialize: a. Create an empty set of selected features: Yk = {∅} b. Set iteration counter: k = 0 2. Repeat until stopping criterion is met: a. Select the best remaining feature: x* = arg max (x* ∈ X \ Yk) [J(Yk + x*)] # Choose the feature that maximizes the evaluation function J() b. Evaluate the performance: If J(Yk + x*) > J(Yk) then: i. Update feature subset: Yk+1 = Yk + x* ii. Increment counter: k = k + 1 iii. Go back to step 2a 3. Return the final feature subset: Y* |
By applying forward selection, it is ensured that only the most predictive attributes are included in the final model, reducing dimensionality while maintaining optimal classification performance. This approach minimizes redundancy and enhances the interpretability of the model by focusing on the most informative non-invasive clinical indicators. Logistic regression was used as the test algorithm. On the other hand, as a performance and/or error parameter, the area under the curve (AUC) was used.
Stage 5 consists of classifying patients using three machine learning algorithms: logistic regression, random forest, and support vector machine. These algorithms are continuously implemented in the health sciences area. Patients were classified according to two conditions (binary classification): high risk (identified in the database with a “1”) or low risk (identified with a “0”) of cardiovascular problems. For each algorithm, the K-fold cross-validation technique was used for the distribution of the training and test data.
The R language was used to develop the three algorithms in its 4.4.2 version [12]. Finally, stage 6 compares the performance of the algorithms. The evaluation is based on the performance during the test, in the classification stage. For the evaluation of the algorithms, four performance parameters are obtained:
Accuracy measures the proportion of correct predictions out of the total predictions. It is defined by Equation (1) as follows:
Sensitivity measures the model’s ability to correctly identify positive cases. It is defined by Equation (2) as follows:
where (true positives) are positive cases correctly classified and (false negatives) are positive cases incorrectly classified as negative.
Specificity evaluates the model’s ability to correctly detect negative cases. It is defined by Equation (3) as follows:
where (true negatives) are negative cases correctly classified and (false positives) are negative cases incorrectly classified as positive.
Area under the curve (AUC) measures the ability of a classifier to distinguish between classes. It is calculated by integrating the receiver operating characteristic (ROC) curve, where represents the sensitivity versus the false positive rate. An AUC close to 1.0 indicates a highly accurate model. An AUC of 0.5 represents a model that has no discrimination capability (equivalent to a random classification). An AUC less than 0.5 suggests that the model is classifying worse than random. It is defined by Equation (4) as follows:
Using these metrics, it is possible to deduce which of the algorithms has the better performance classification. Finally, based on the previous analysis, the algorithm that best classifies the risk of cardiovascular disease was detected. In turn, the attributes that need to be measured in patients were identified.
2.1. Preliminaries of LR, RF and SVM
2.1.1. Logistic Regression
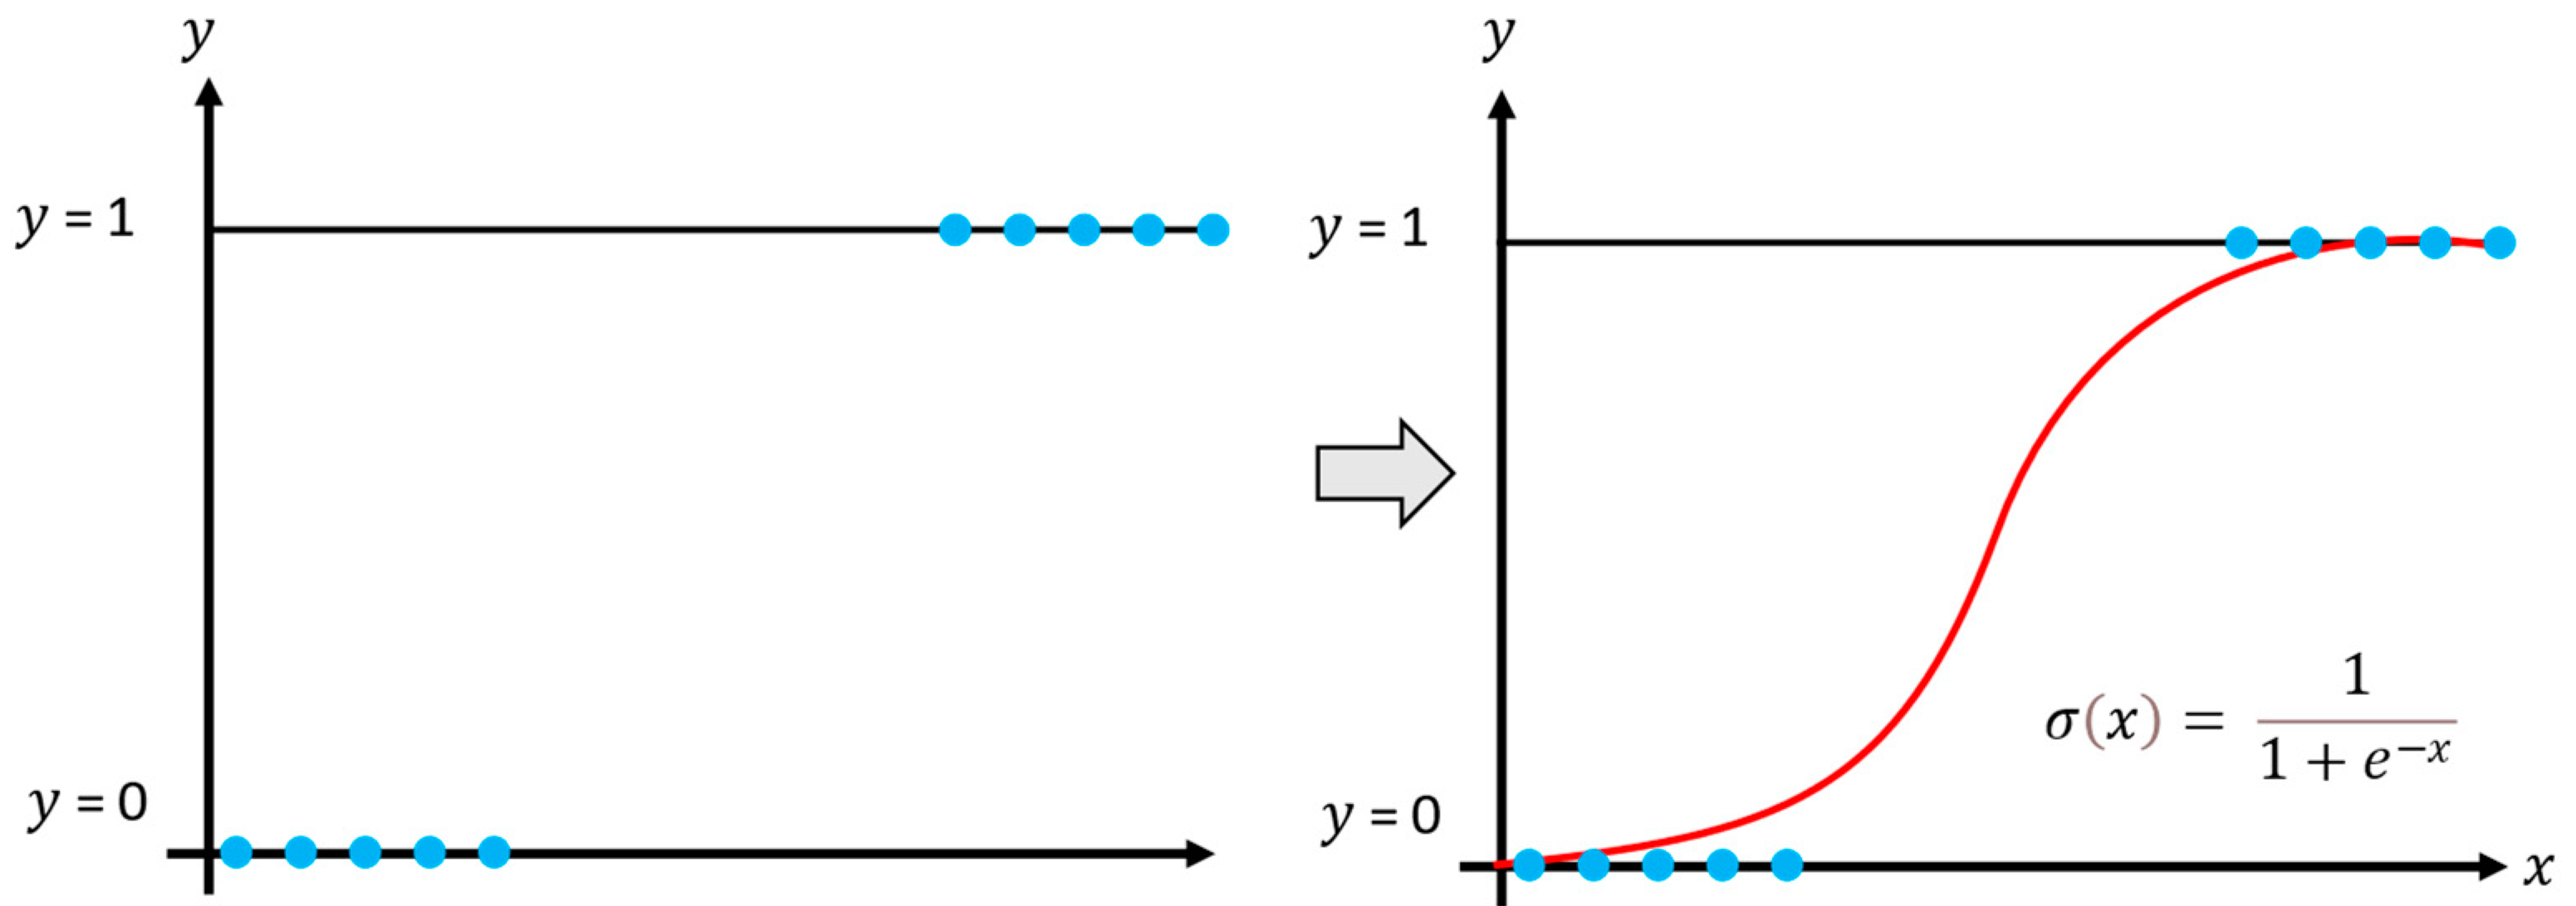
The logistic regression model aims to estimate the posterior probabilities of classes using the linear functions of , ensuring that the probabilities sum to one and remain within the interval 0 and 1. Thus, logistic regression is applied to multiple classification problems and, in supervised learning, to model nonlinear data, as shown in Figure 2 [22,23]. The model generates outputs between 0 and 1, representing the probability of an event occurring or a sample belonging to a particular class.
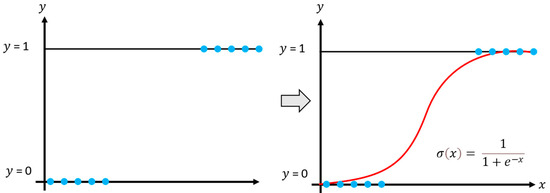
Figure 2.
Example of the logistic regression model, the colored dots indicate the upper and lower limits.
The calculation of the probability that a sample belongs to a specific class is given by the following Equation (5):
where is the exponential function and x corresponds to the training data.
2.1.2. Random Forest
Random forests correspond to a modification of bagging that builds a large collection of de-correlated trees, , and then averages them. Bagging, also known as bootstrap aggregation, is a technique for reducing the variance of an estimated prediction function. Bagging seems to work especially well for high-variance, low-bias procedures, such as trees. The essential idea in bagging is to average many noisy but approximately unbiased models, , and hence reduce the variance. Trees are ideal candidates for bagging, since they can capture complex interaction structures in the data and, if grown sufficiently deep, have a relatively low bias. Since trees are notoriously noisy, they benefit greatly from the averaging. Moreover, since each tree generated in bagging is identically distributed (i.d.), the expectation of an average of N such trees is the same as the expectation of any one of them. To make the prediction at any point, one uses Equation (6), and to make the classification , Equation (7) is used:
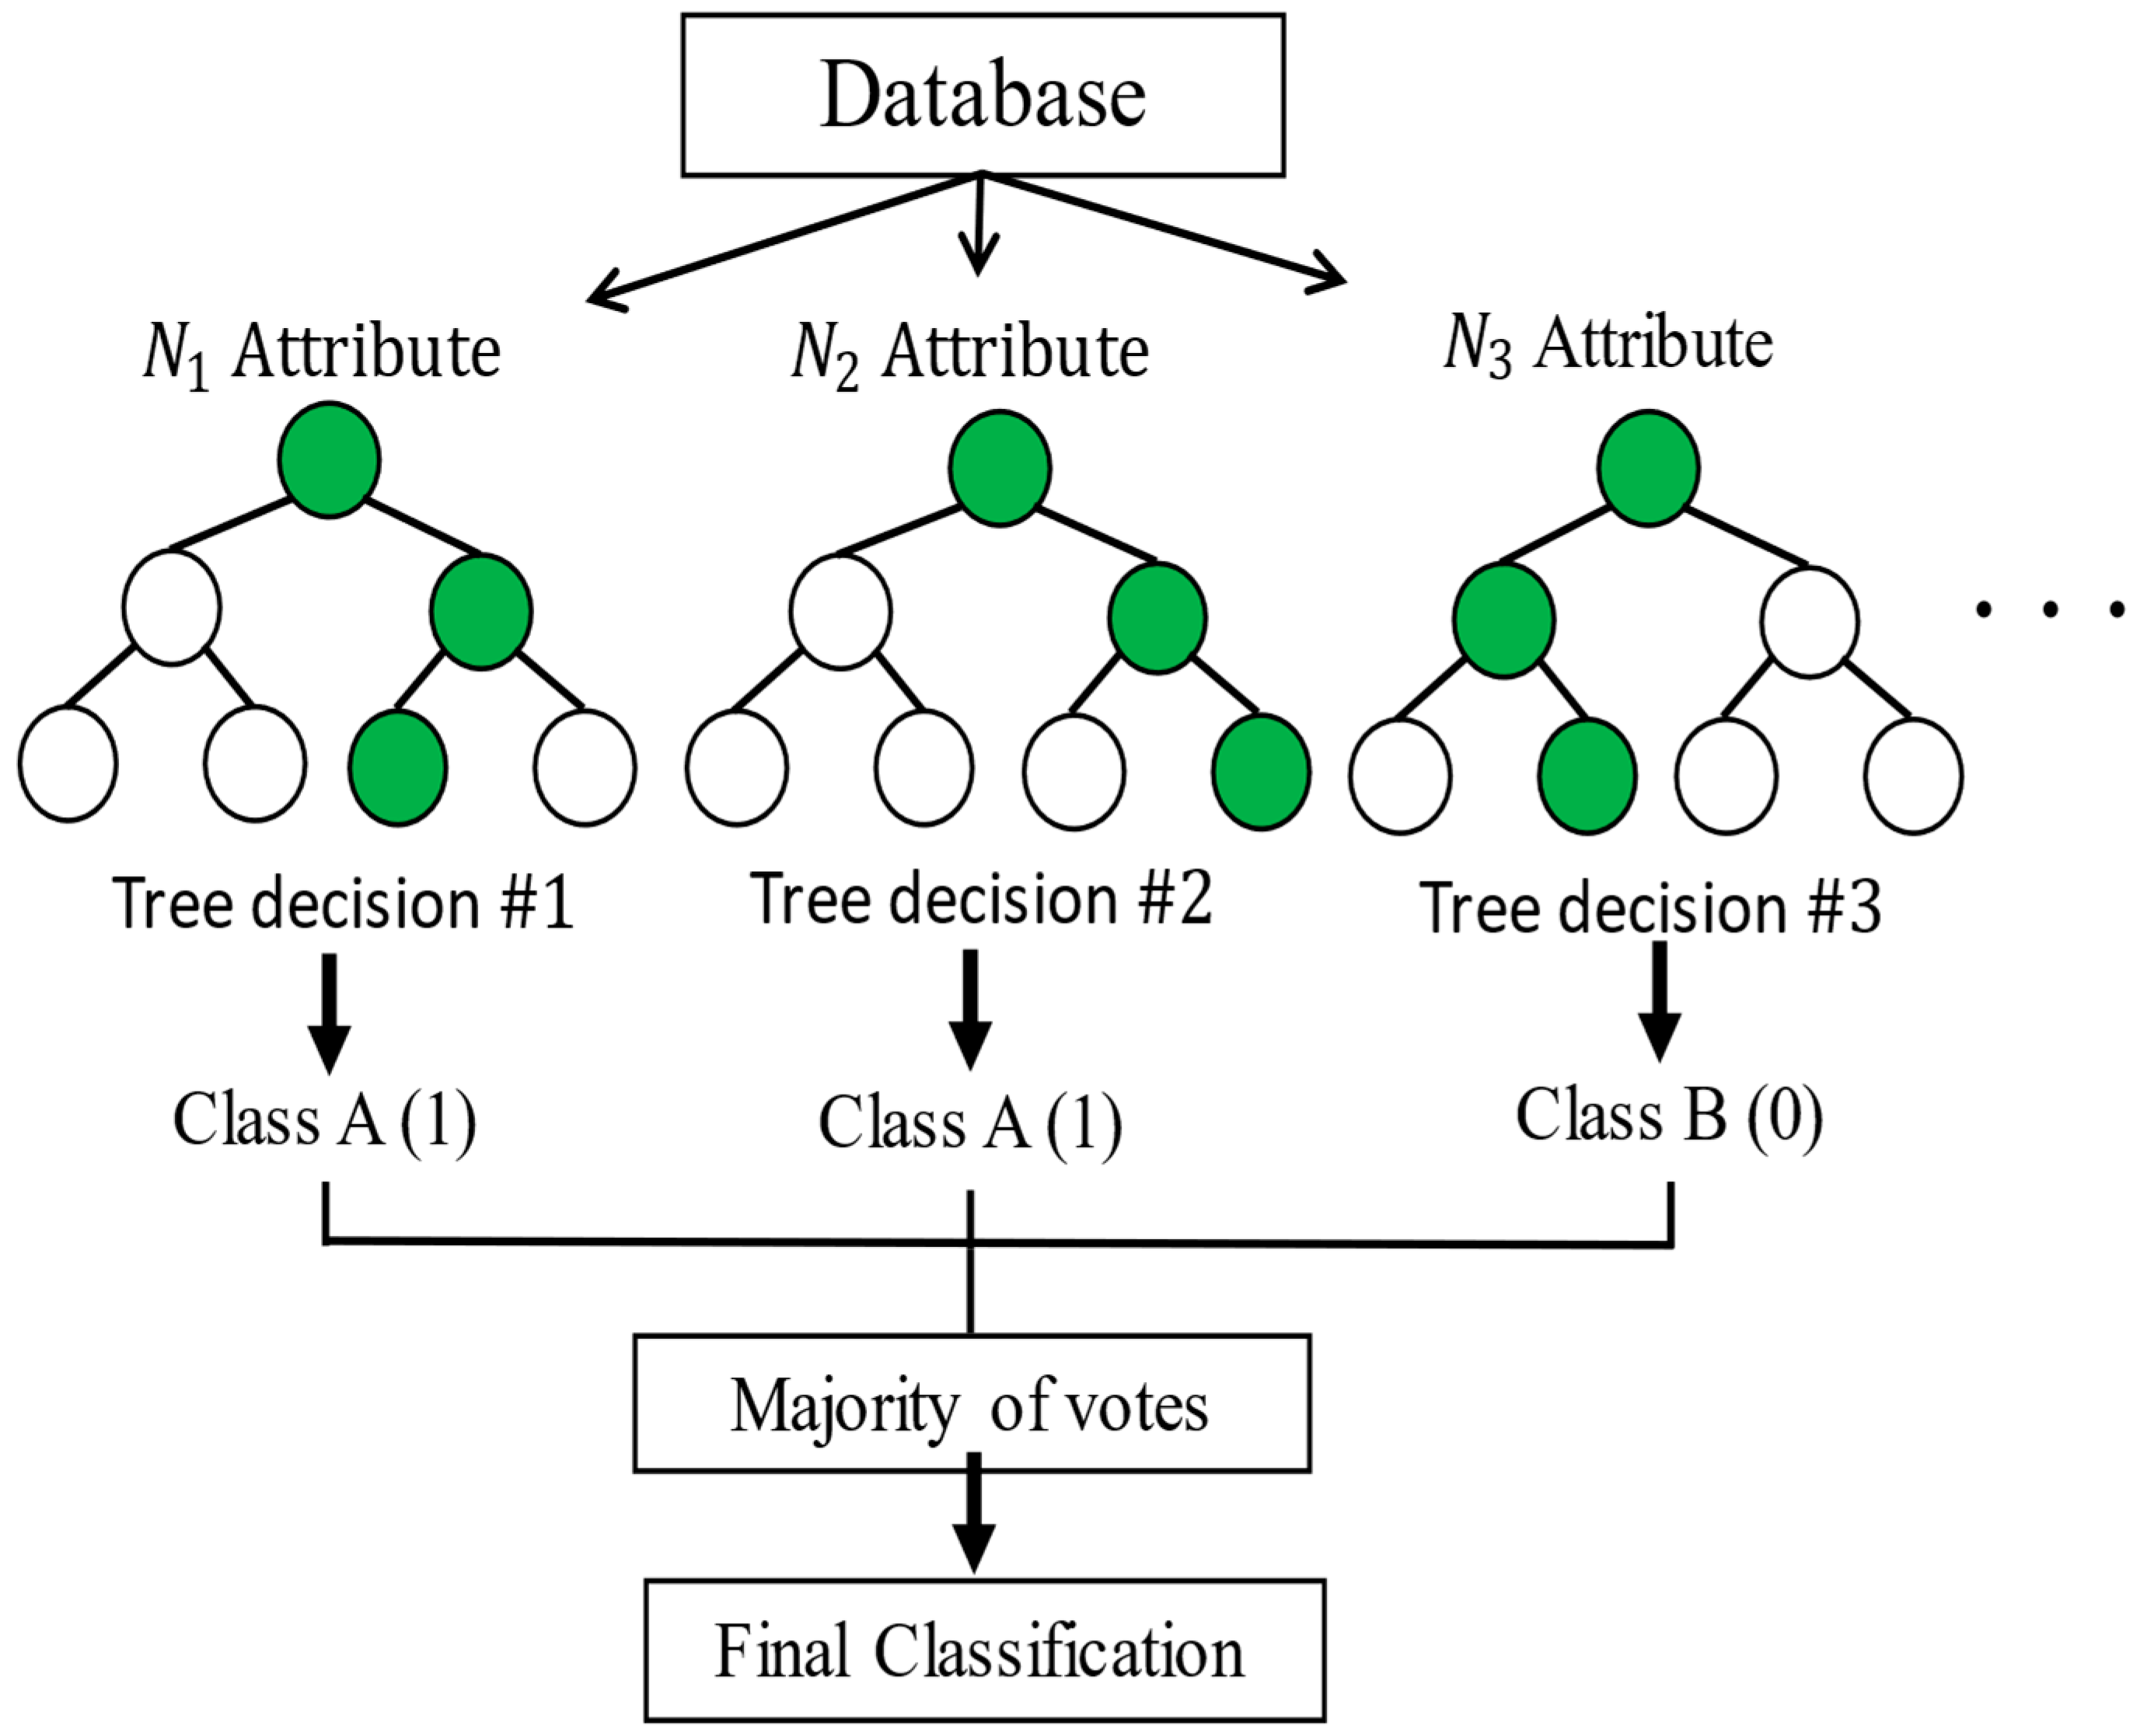
The random forest model classification is capable of self-learning, and it is based on various classifiers for decision making. The model is used for prediction and classification tasks, as shown in Figure 3 [24,25].

Figure 3.
Example of the random forest model, the green dots indicate the main options.
The random forests are based on a collection of decision trees, and each tree is composed of one root node, branches, internal nodes, and leaf nodes. The learning process is complex, since the optimal quantity of decision trees must be obtained and, at the same time, the optimal structure of each decision tree must be attained.
2.1.3. Support Vector Machines
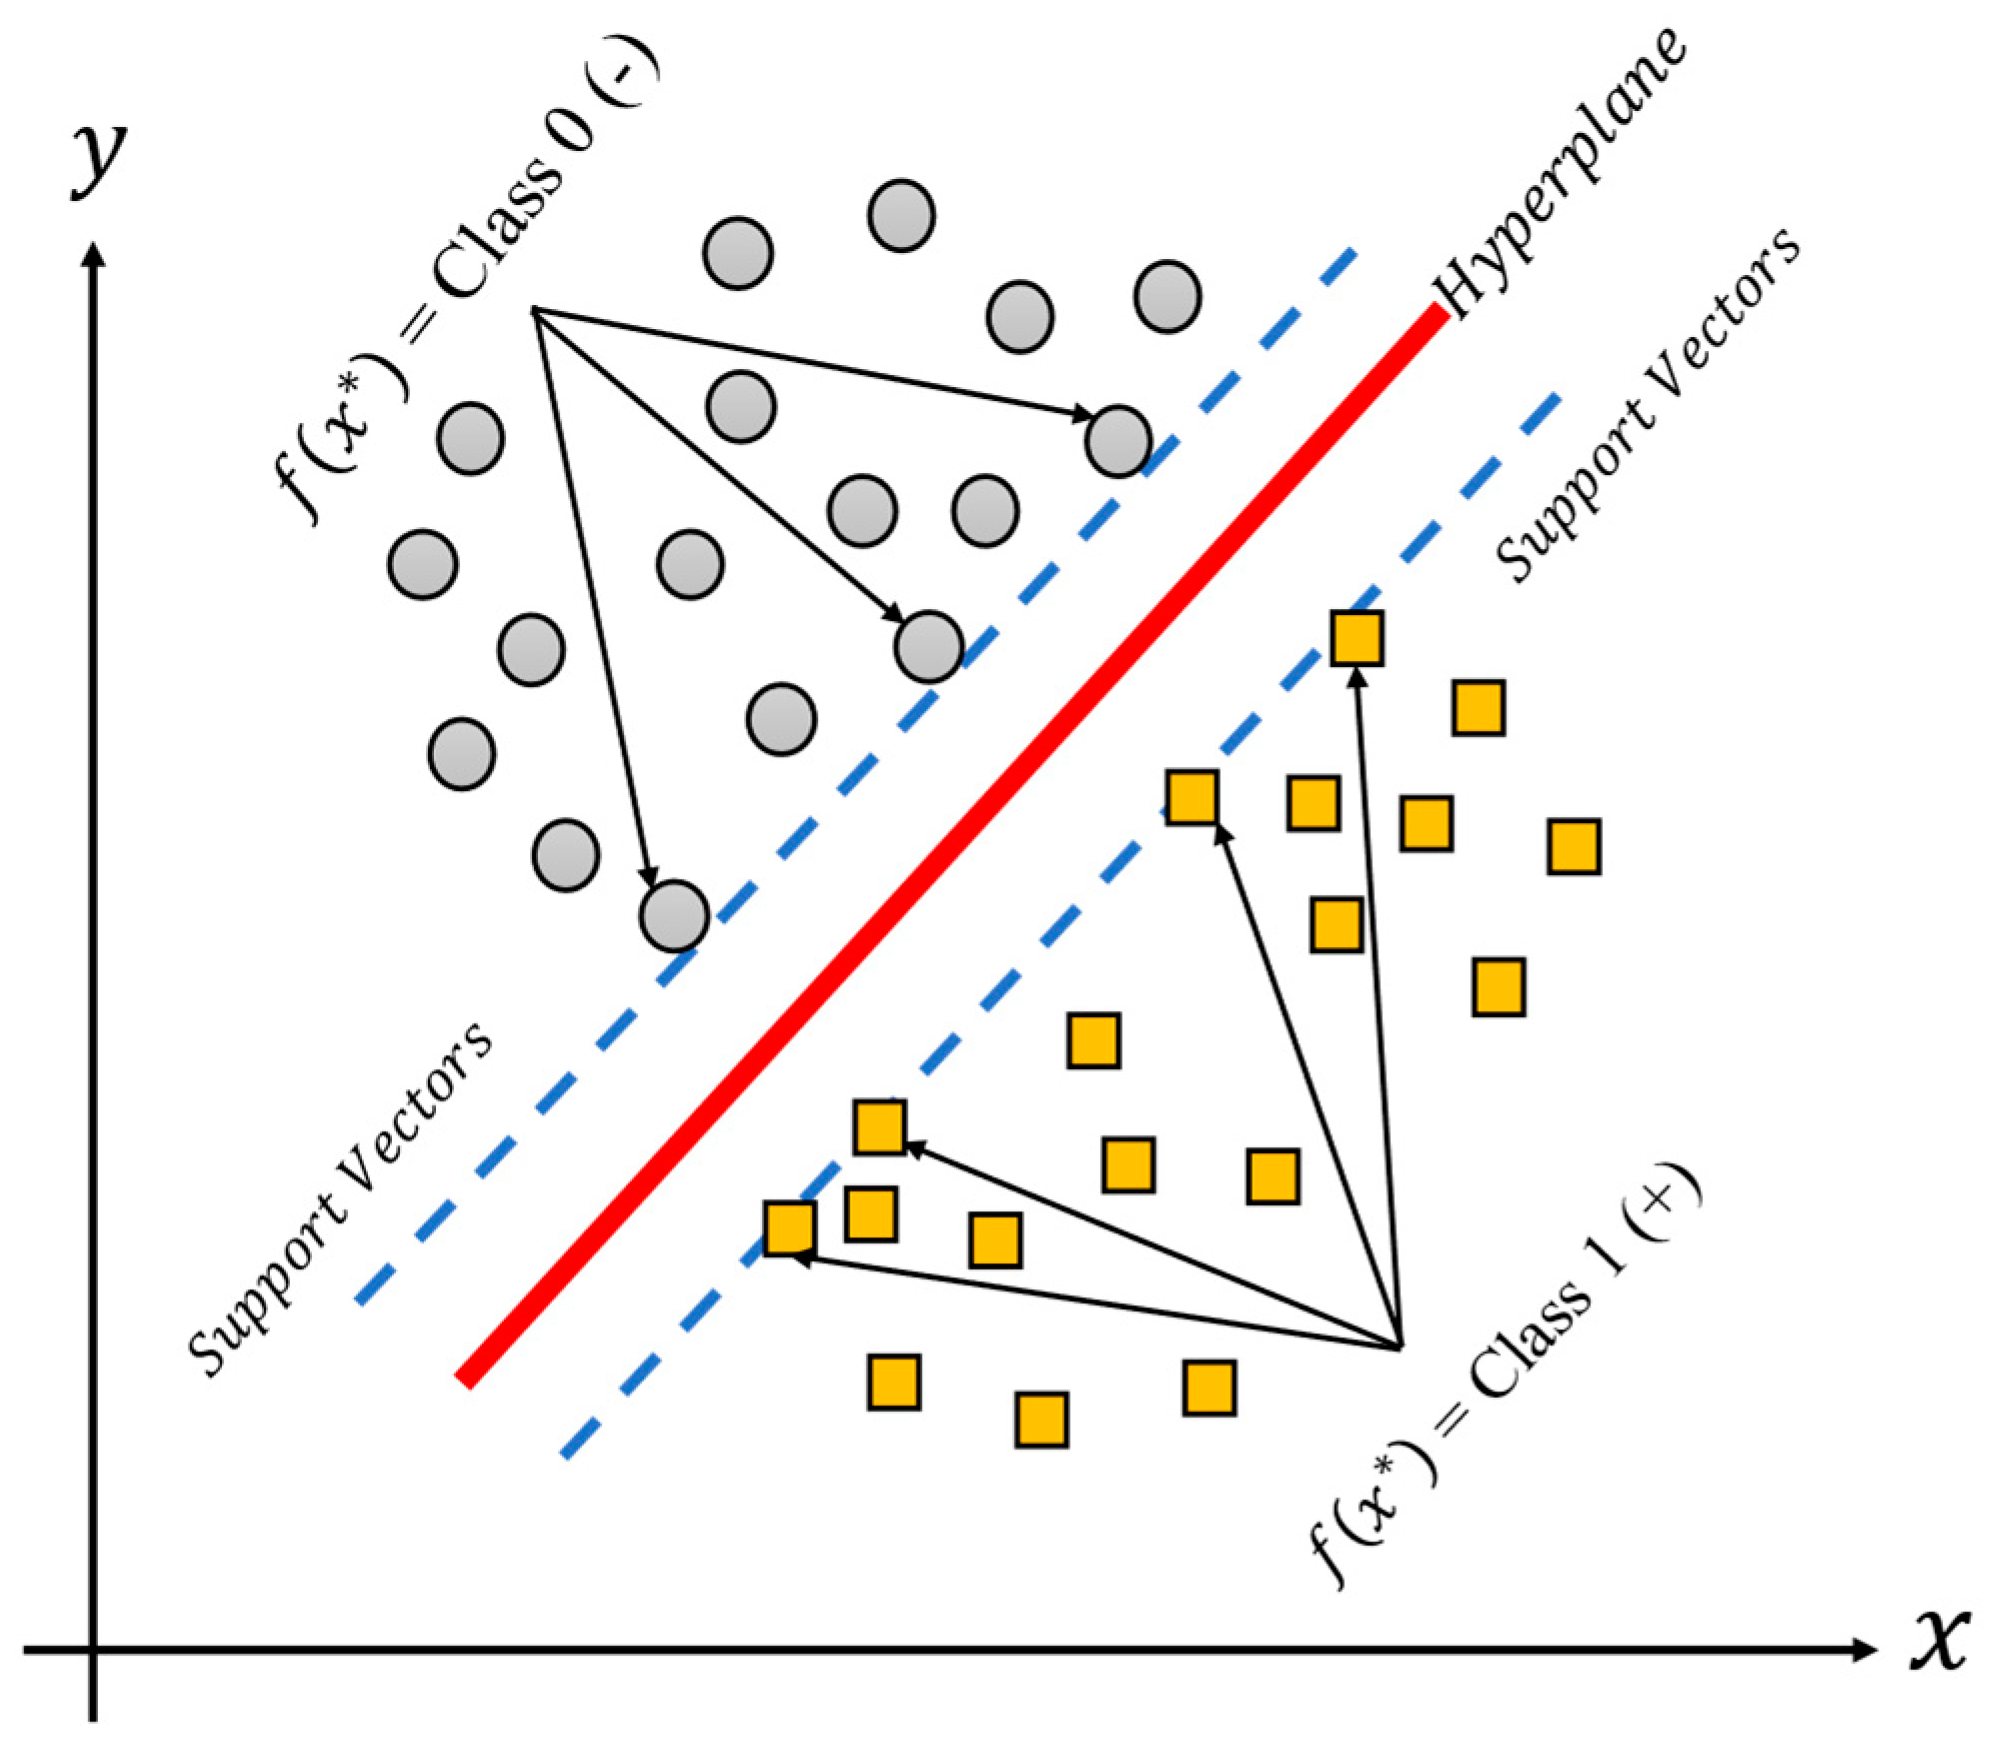
The support vector machine (SVM), is a methodology which produces nonlinear boundaries by constructing a linear boundary for the transformed version of the feature space, such transformation is obtained using a kernel function K. The SVM is thus a supervised learning technique used for classification tasks, and it could be useful for binary and multiple classification problems. The support vector machine classifies data by calculating support vectors, boundaries also known as frontiers or margins, as can be seen in Figure 4 [24,25] for a binary classification linear model. The support vectors (in green and blue) are those observations closer to the boundary (line in red), and the distances between them are summed to obtain the margin. On the other hand, the margin corresponds to the area (dashed lines) of the feature space without observations that separate the classes between them. At each iteration of the training phase, the support vectors and the margins are recalculated. The final aim of the training process is to find large margins (or large areas) which permit the different groups of classes to separate the best possible data.
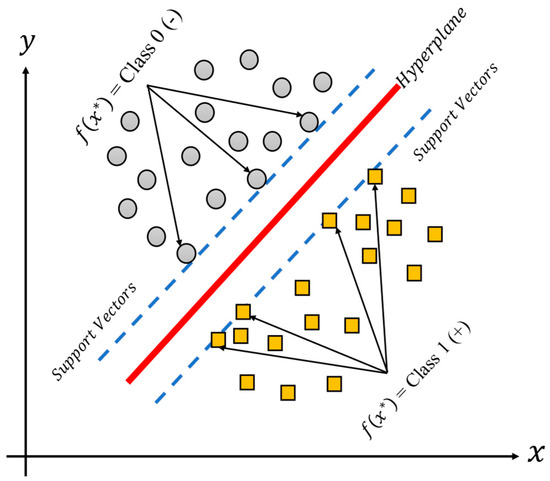
Figure 4.
Example of the SVM model for binary classification, where “*” indicates the possible value of the function f.
2.2. Low-Cost Data Acquisition Systems Based on Arduino
This section describes the low-cost data acquisition system based on Arduino. This system uses the ATMega328p microcontroller, due to its versatility and ease of programming. Table 2 shows the total cost of the system in dollars, and the used electronic components.
Table 2.
Electronic components cost.
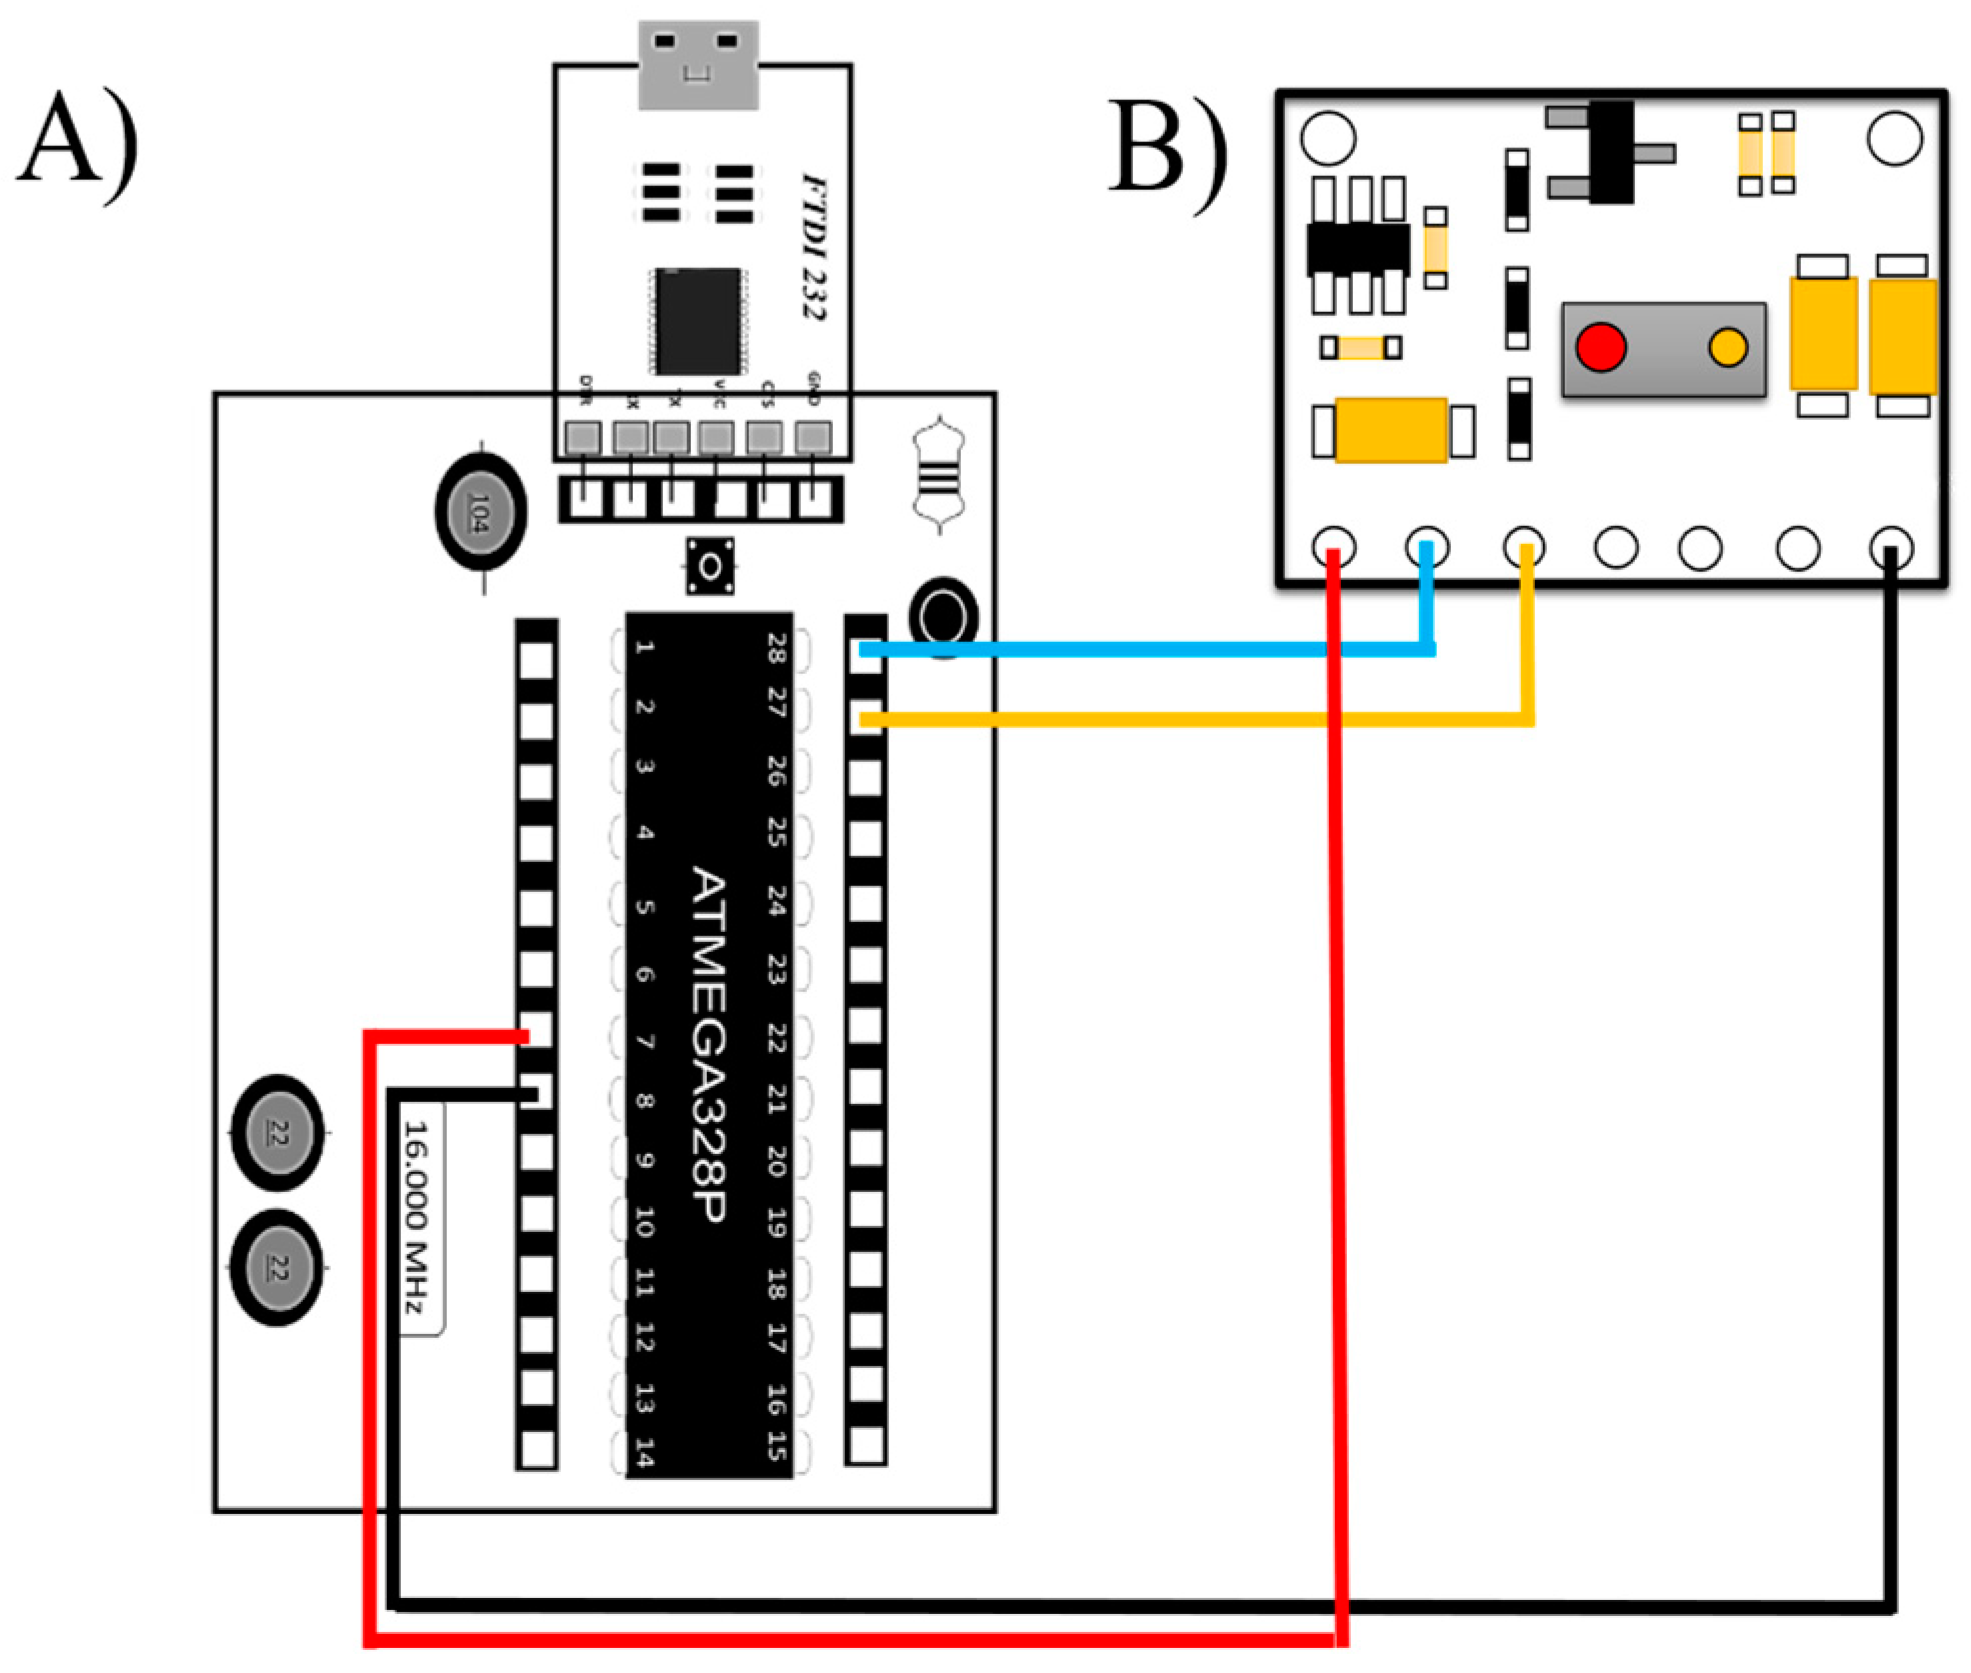
The FTDI FT232 (USB-to-TTL serial adapter, Manufacturer: Waveshare International Limited, City: Shenzhen, Country: China) device allows communication between the microcontroller via peripherals and the programming software v1.0. The microcontroller can be programmed using the free-to-use Arduino IDE software. This software allows for establishing serial communication between the DAB (data acquisition board) and the computer to run and program the board. In addition, the design of the electronic module (MAX30100, Manufacturer: Shenzhen Electronics, City: Shenzhen, Country: China) used to determine the heart rate is shown. It is capable of measuring blood oxygen and heart rate. It can send the heart rate and oxygen saturation (SpO2) values, so there is no need to perform any calculation or operation in the Arduino code. This sensor has no compatibility problems with the low-cost acquisition system. Thus, the diagram of the connections and the description of the connections are shown in Figure 5.

Figure 5.
Electronic diagram of the connection between the DAB and the MAX30100 sensor: (A) DAB, (B) MAX30100, Red Color: Current, Black Color: Ground, Yellow Color: Analog Gate, Blue Color: Electrical Signal.
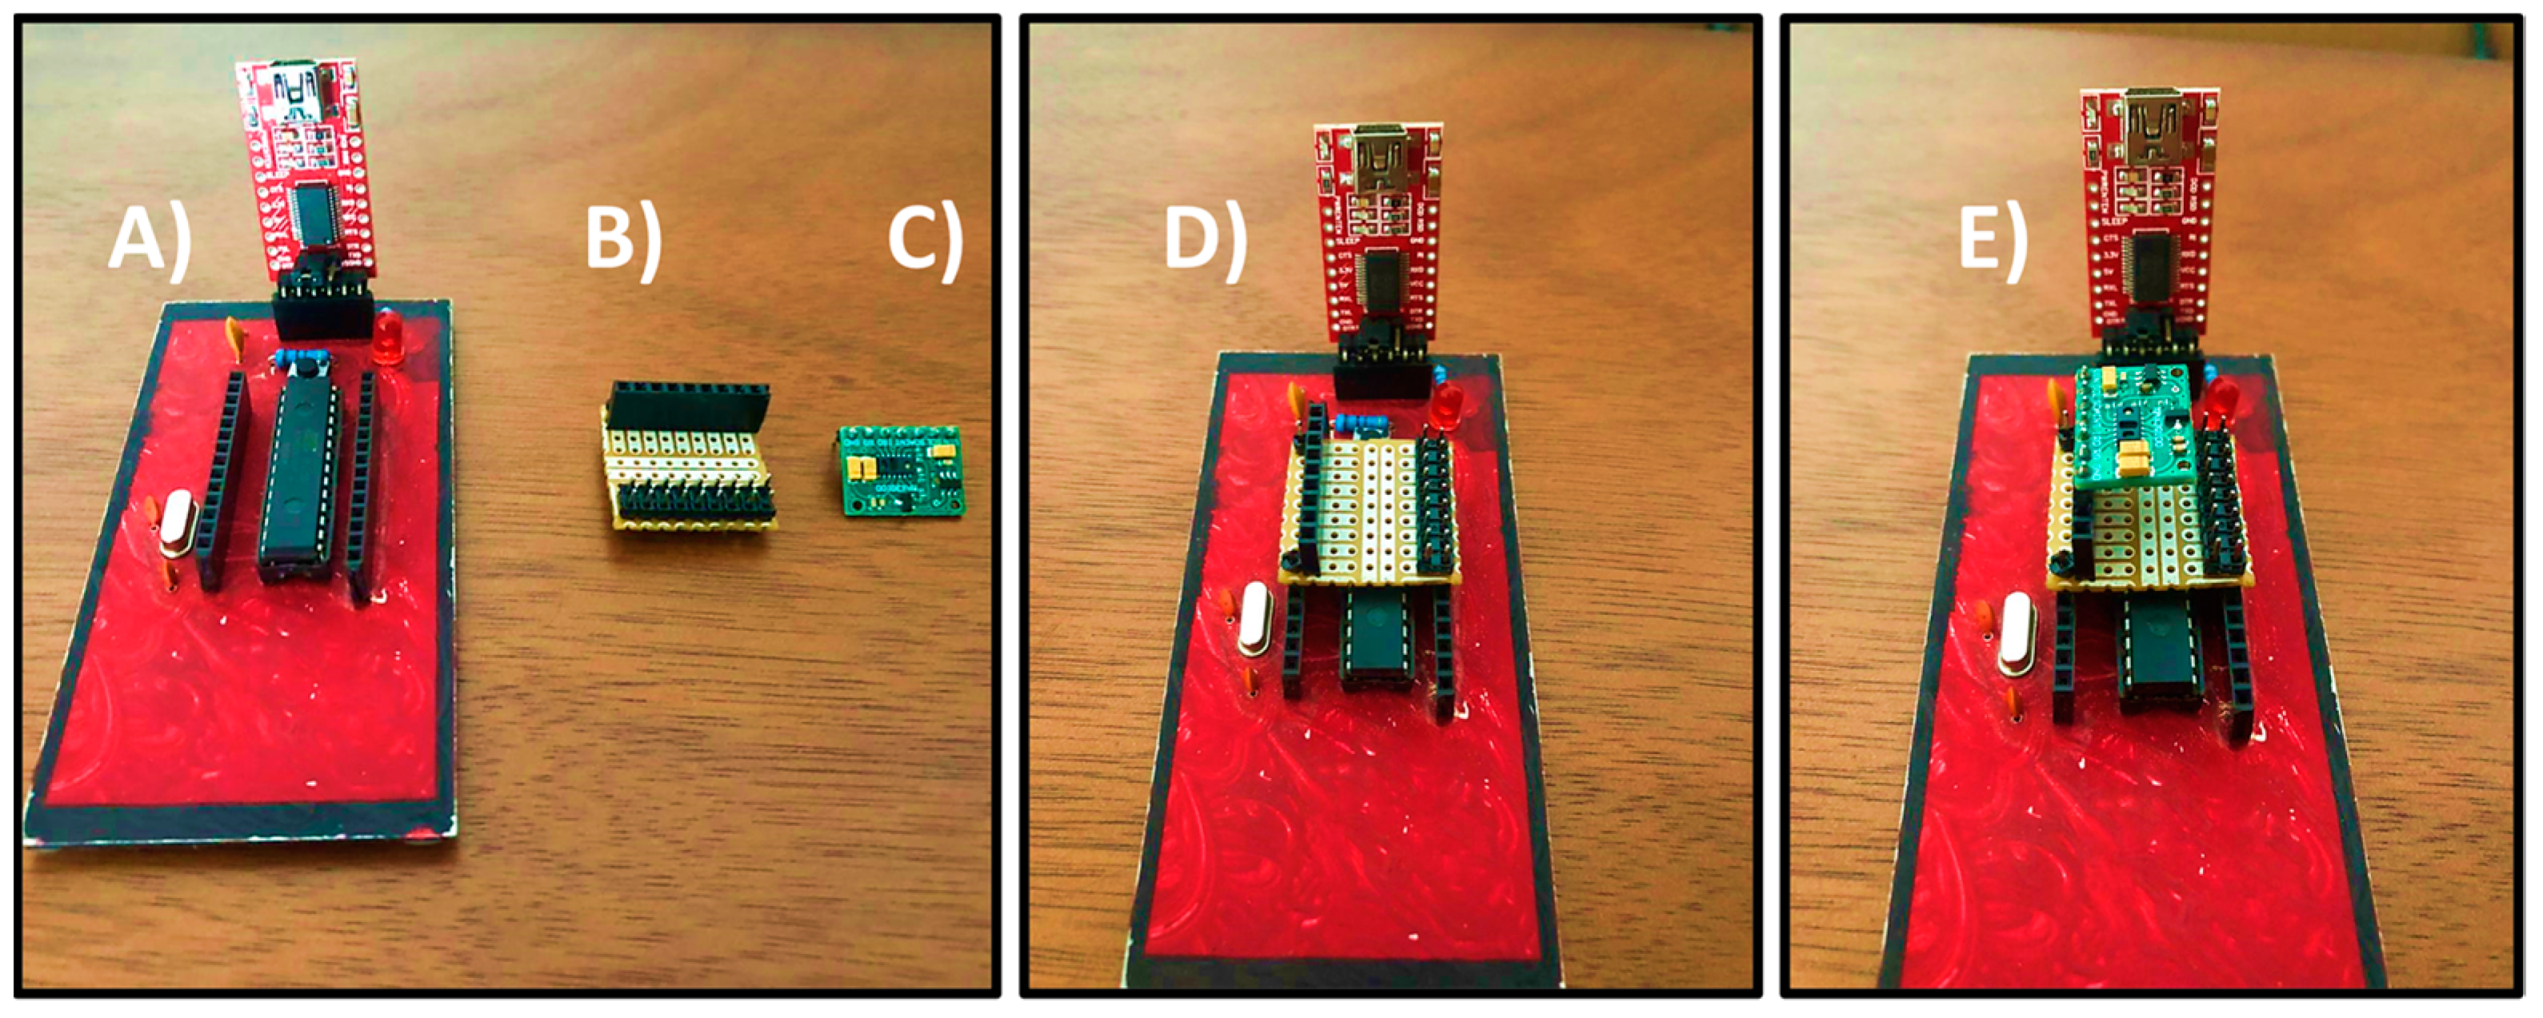
The design allows a safe and correct connection for the user, thus avoiding errors in the operation of the sensor. In addition, this design allows the MAX30100 sensor to be exchanged in case of damage. Figure 6 shows the complete assembly of the sensor and the low-cost acquisition board.
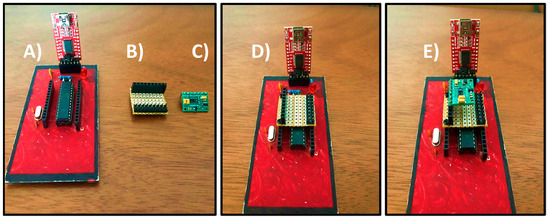
Figure 6.
Mounting the MAX30100 sensor and DAB. (A) DAB. (B) Mountable module. (C) MAX30100 sensor. (D) Module and DAB connected. (E) DAB, module, and MAX30100 sensor connected.
The reliability of the sensor was verified by comparing the percentage of error with a commercial oximeter commonly used by doctors. The measurement was performed at the same time on the patient. One sensor was placed on the index finger of the left hand. The commercial one was placed on the middle finger. As a reference for real measurement, a doctor manually measured the heart rate in conjunction with the sensor and the commercial oximeter. In this way, a real measurement (obtained by the doctor) and an approximate measurement were obtained for both the commercial oximeter and the MAX30100 sensor. The error rate does not exceed 5% using the MAX30100 sensor. Therefore, the performance of the device is adequate. Furthermore, the difference between the error percentages of the sensor and the commercial oximeter does not exceed 3%.
2.3. Buazduino-001: A Cardiovascular Risk Classifier
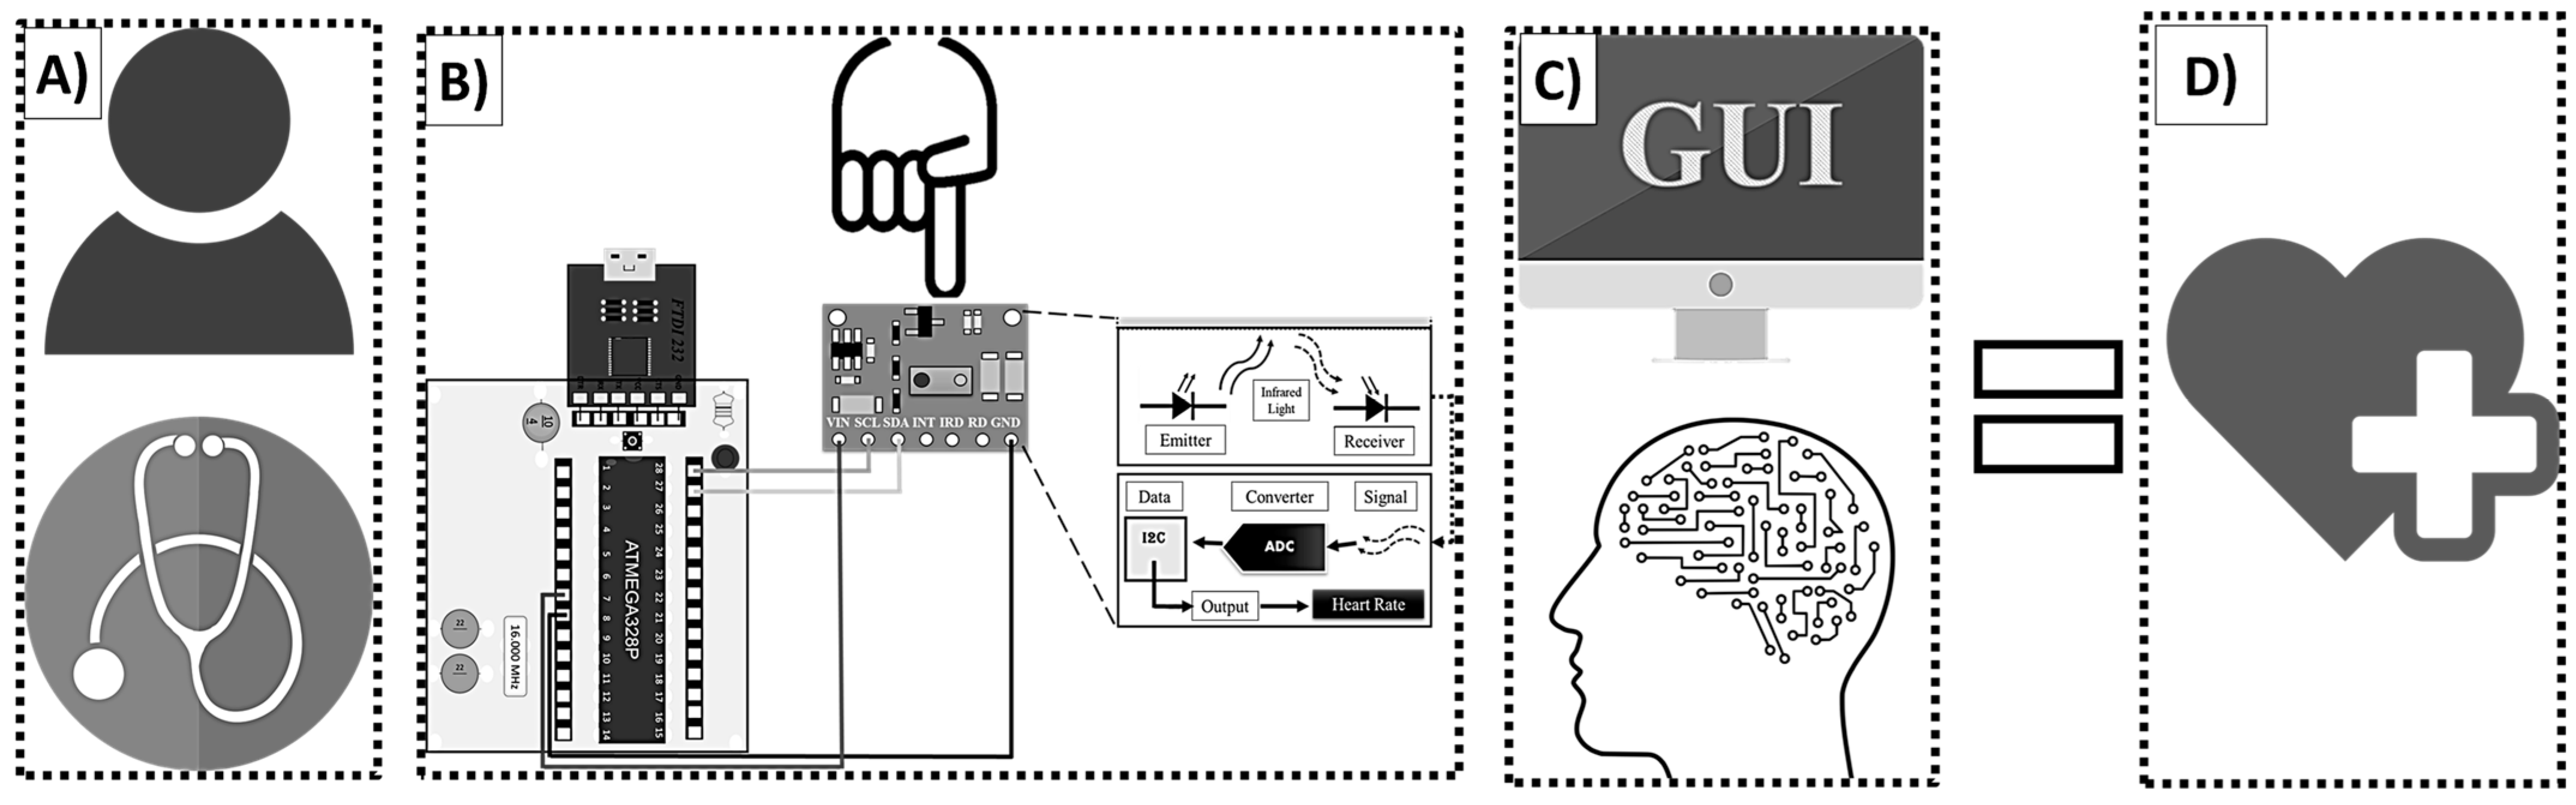
The Buazduino-001 classifier is presented in this section, and it is the integration of previously discussed topics. Figure 7 shows a diagram of the Buazduino-001 predictor. Figure 7A, represents the first approach between the patient and the doctor. The presence of the patient is necessary to begin the measurement process. Figure 7B, shows the electronic part. At this point the doctor measures the patient’s frequency using the MAX30100 sensor.

Figure 7.
General diagram to use Buazduino-001 predictor: (A) interaction between patient and doctor; (B) electronic part; (C) machine learning algorithm; (D) cardiovascular classification.
The collected information will be measured and stored in the next stage of the predictor. Figure 7C shows the graphical user interface and the machine learning algorithm. This part of the predictor is operated from the computer. At this point, the algorithm produces either a high risk or low risk classification for cardiovascular disease based on the patient’s data. Then, the doctor identifies the result and proceeds with a diagnostic.
To use the cardiovascular risk classifier, the following steps must be followed:
- Patient Preparation—The patient should remain seated and at rest for five minutes to stabilize heart rate and pulse.
- Software and Hardware Setup—Ensure that all components are correctly configured and operational.
- Data Collection—The physician gathers the required attributes for the machine learning algorithm.
- Data Input—The collected patient information is entered into the system via the graphical interface, and the algorithm processes the data to generate a classification result.
Final diagnosis—The algorithm displays a classification between high risk or low risk for cardiovascular disease. In this way, the doctor has a diagnostic about the risk of cardiovascular disease. Cardiovascular risk was measured in 30 patients of different ages and physical conditions.
3. Results and Discussion
First, the application of machine learning for cardiovascular disease classification has shown that certain attributes exhibit a strong statistical correlation. Additionally, the optimal number of attributes required to achieve a reliable diagnosis with an acceptable error margin is determined. Second, the selected machine learning algorithm is validated. Subsequently, the Buazduino-001 classifier undergoes validation. Finally, the performance of the Buazduino-001 classifier is compared to other cardiovascular risk classifiers reported in the literature.
3.1. Correlation and Performance of the Non-Invasive Attributes
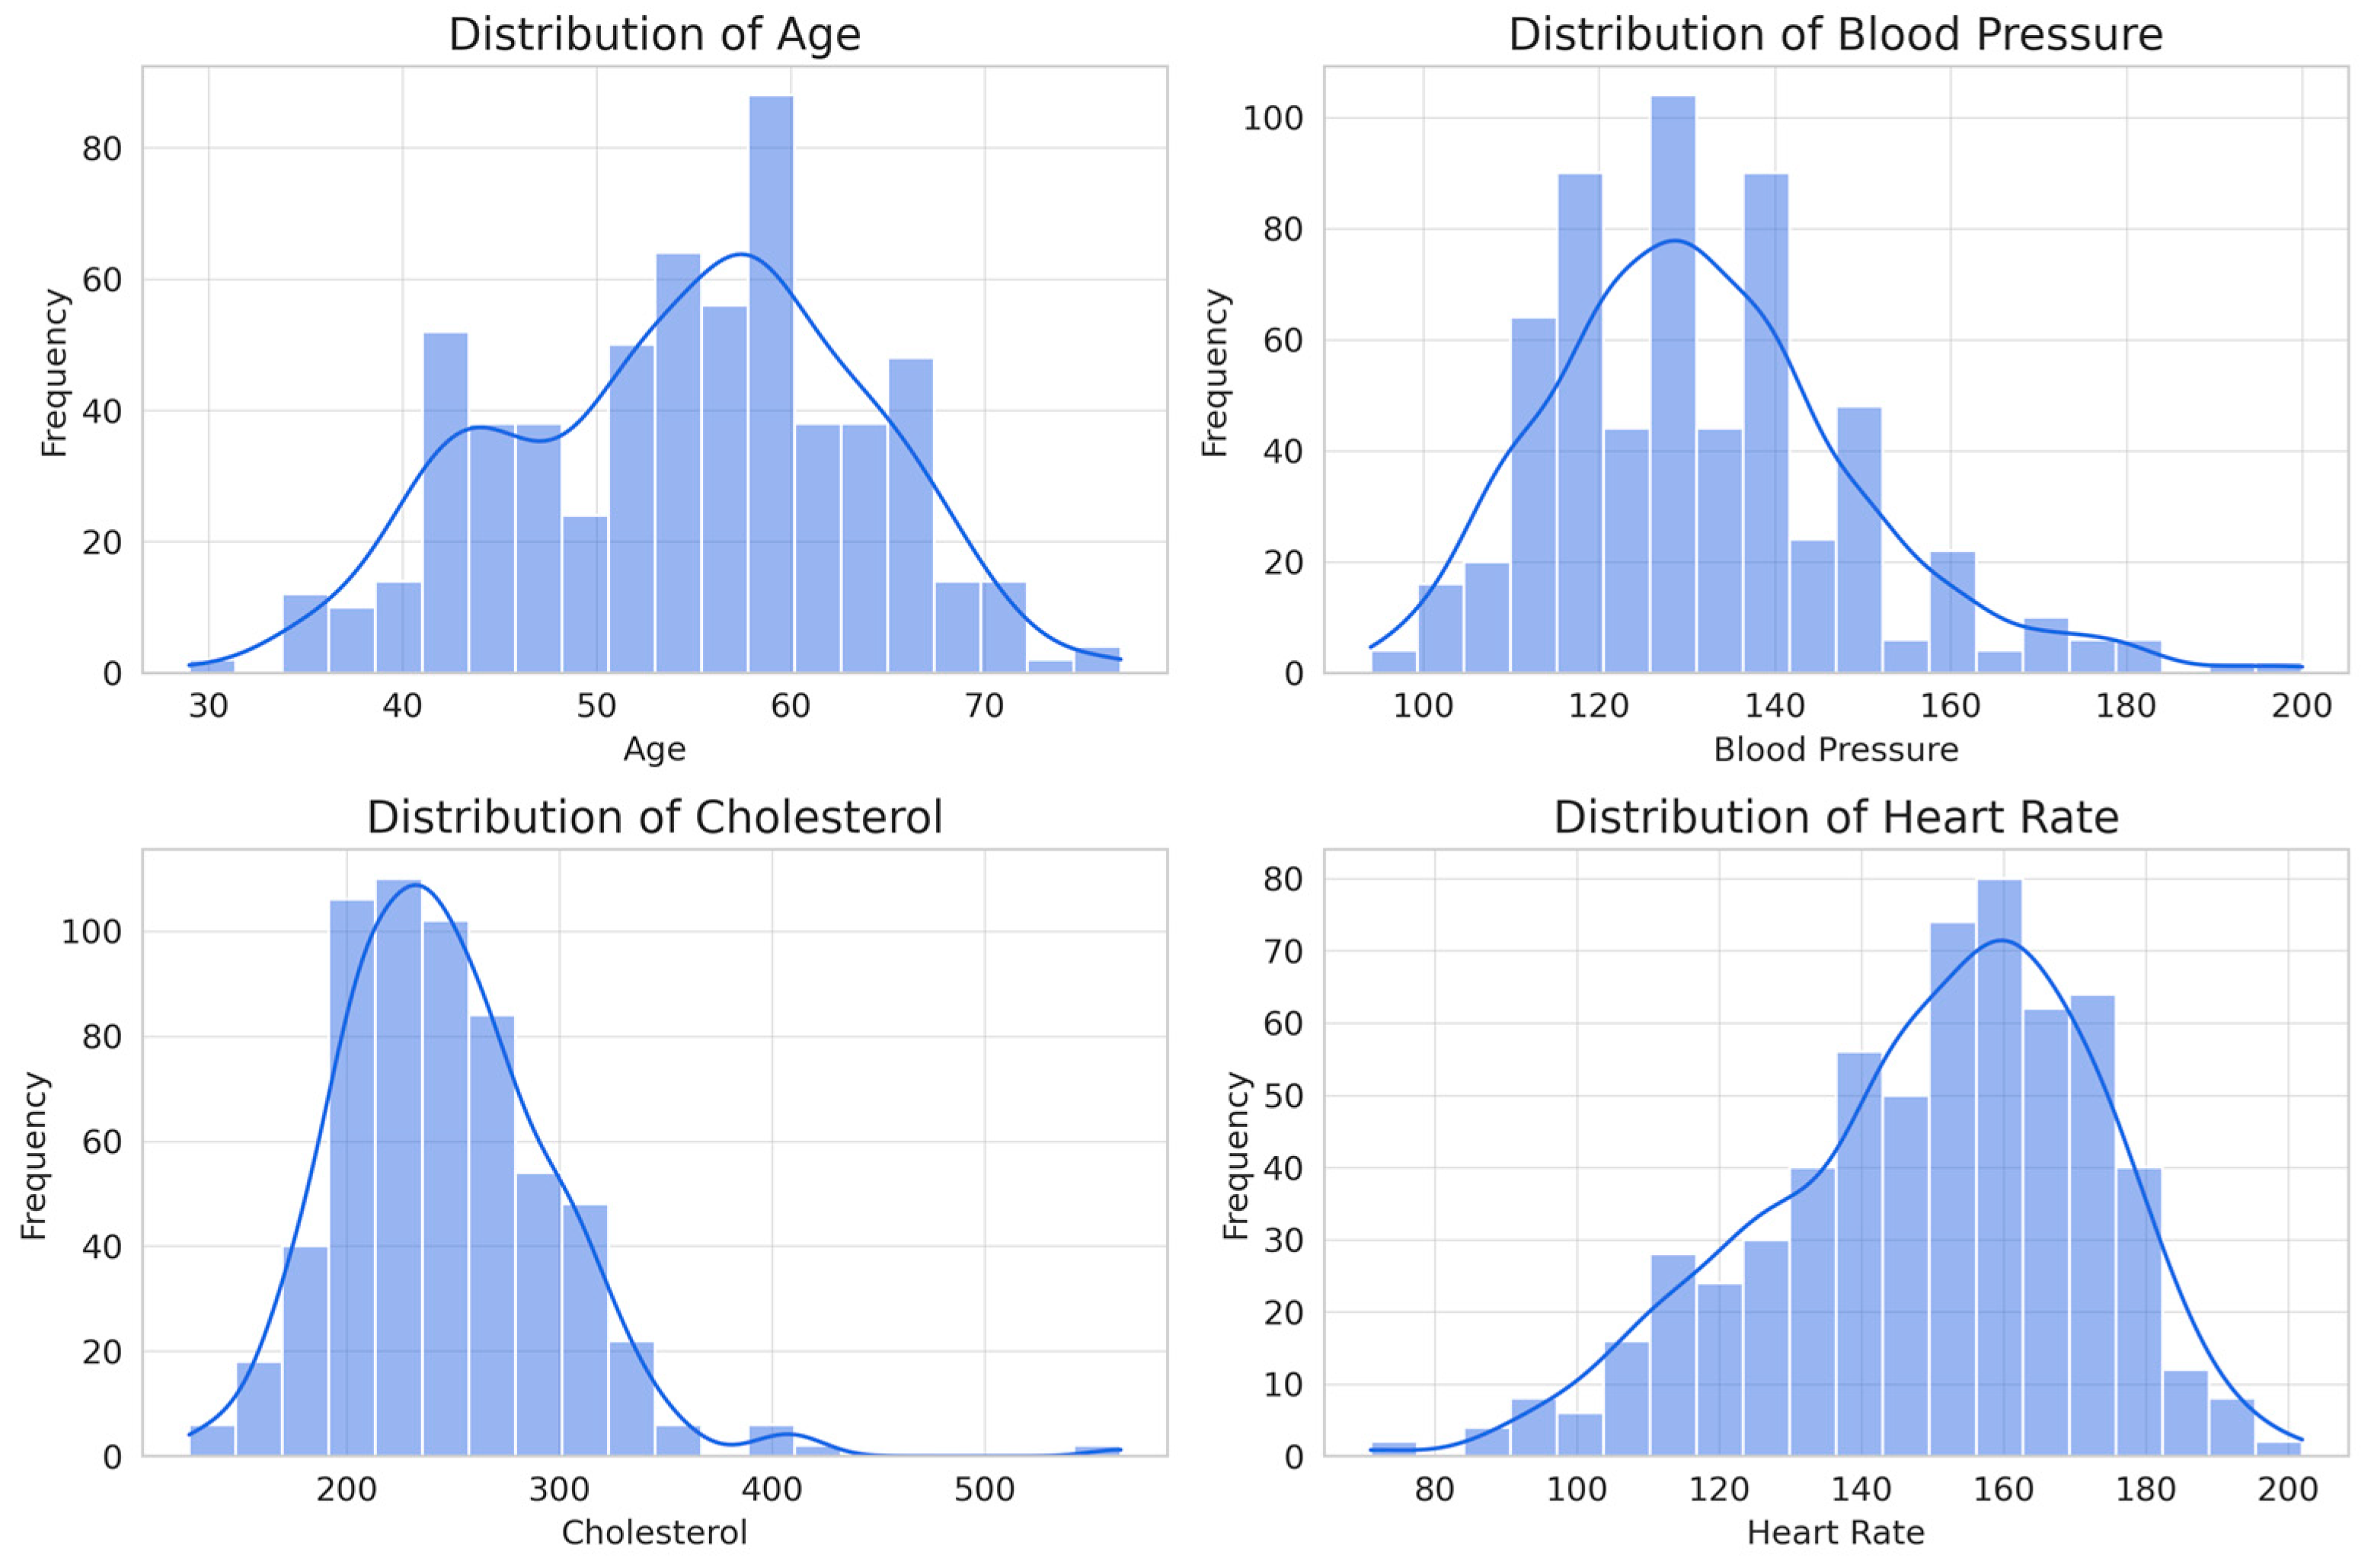
Statistical analysis of numerical attributes (from the eight attributes assigned as non-invasive) provides key information on their influence for the classification of heart disease (Figure 8).
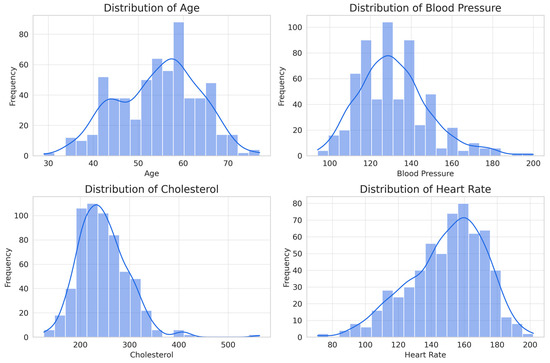
Figure 8.
Histograms of the numerical attributes considered for the classification of cardiovascular disease.
Age shows a distribution slightly skewed to the right, with a range of 29 to 77 years and an average of 54 years. This indicates that risk increases with age, making it a relevant factor for classification. Resting blood pressure has a range of 94 to 200 mm Hg and an average of 131 mm Hg, with a distribution slightly skewed to the right, suggesting that, although hypertension is a risk factor, it is not a determinant predictor on its own. Although it is arguable that it may be a common condition for developing cardiovascular disease, in the case of this database, it may not prove to be relevant. Cholesterol varies between 126 and 564 mg/dL, with an average of 246 mg/dL, showing a distribution skewed to the right due to elevated values in some patients. As in the previous case, it would be evident that it is a determining factor; however, given the conditions of the database, it may be irrelevant. The maximum heart rate achieved has a range of 71 to 202 bpm and an average of 150 bpm, with a distribution skewed to the left, suggesting that patients with a lower heart rate response have a higher probability of presenting heart disease.
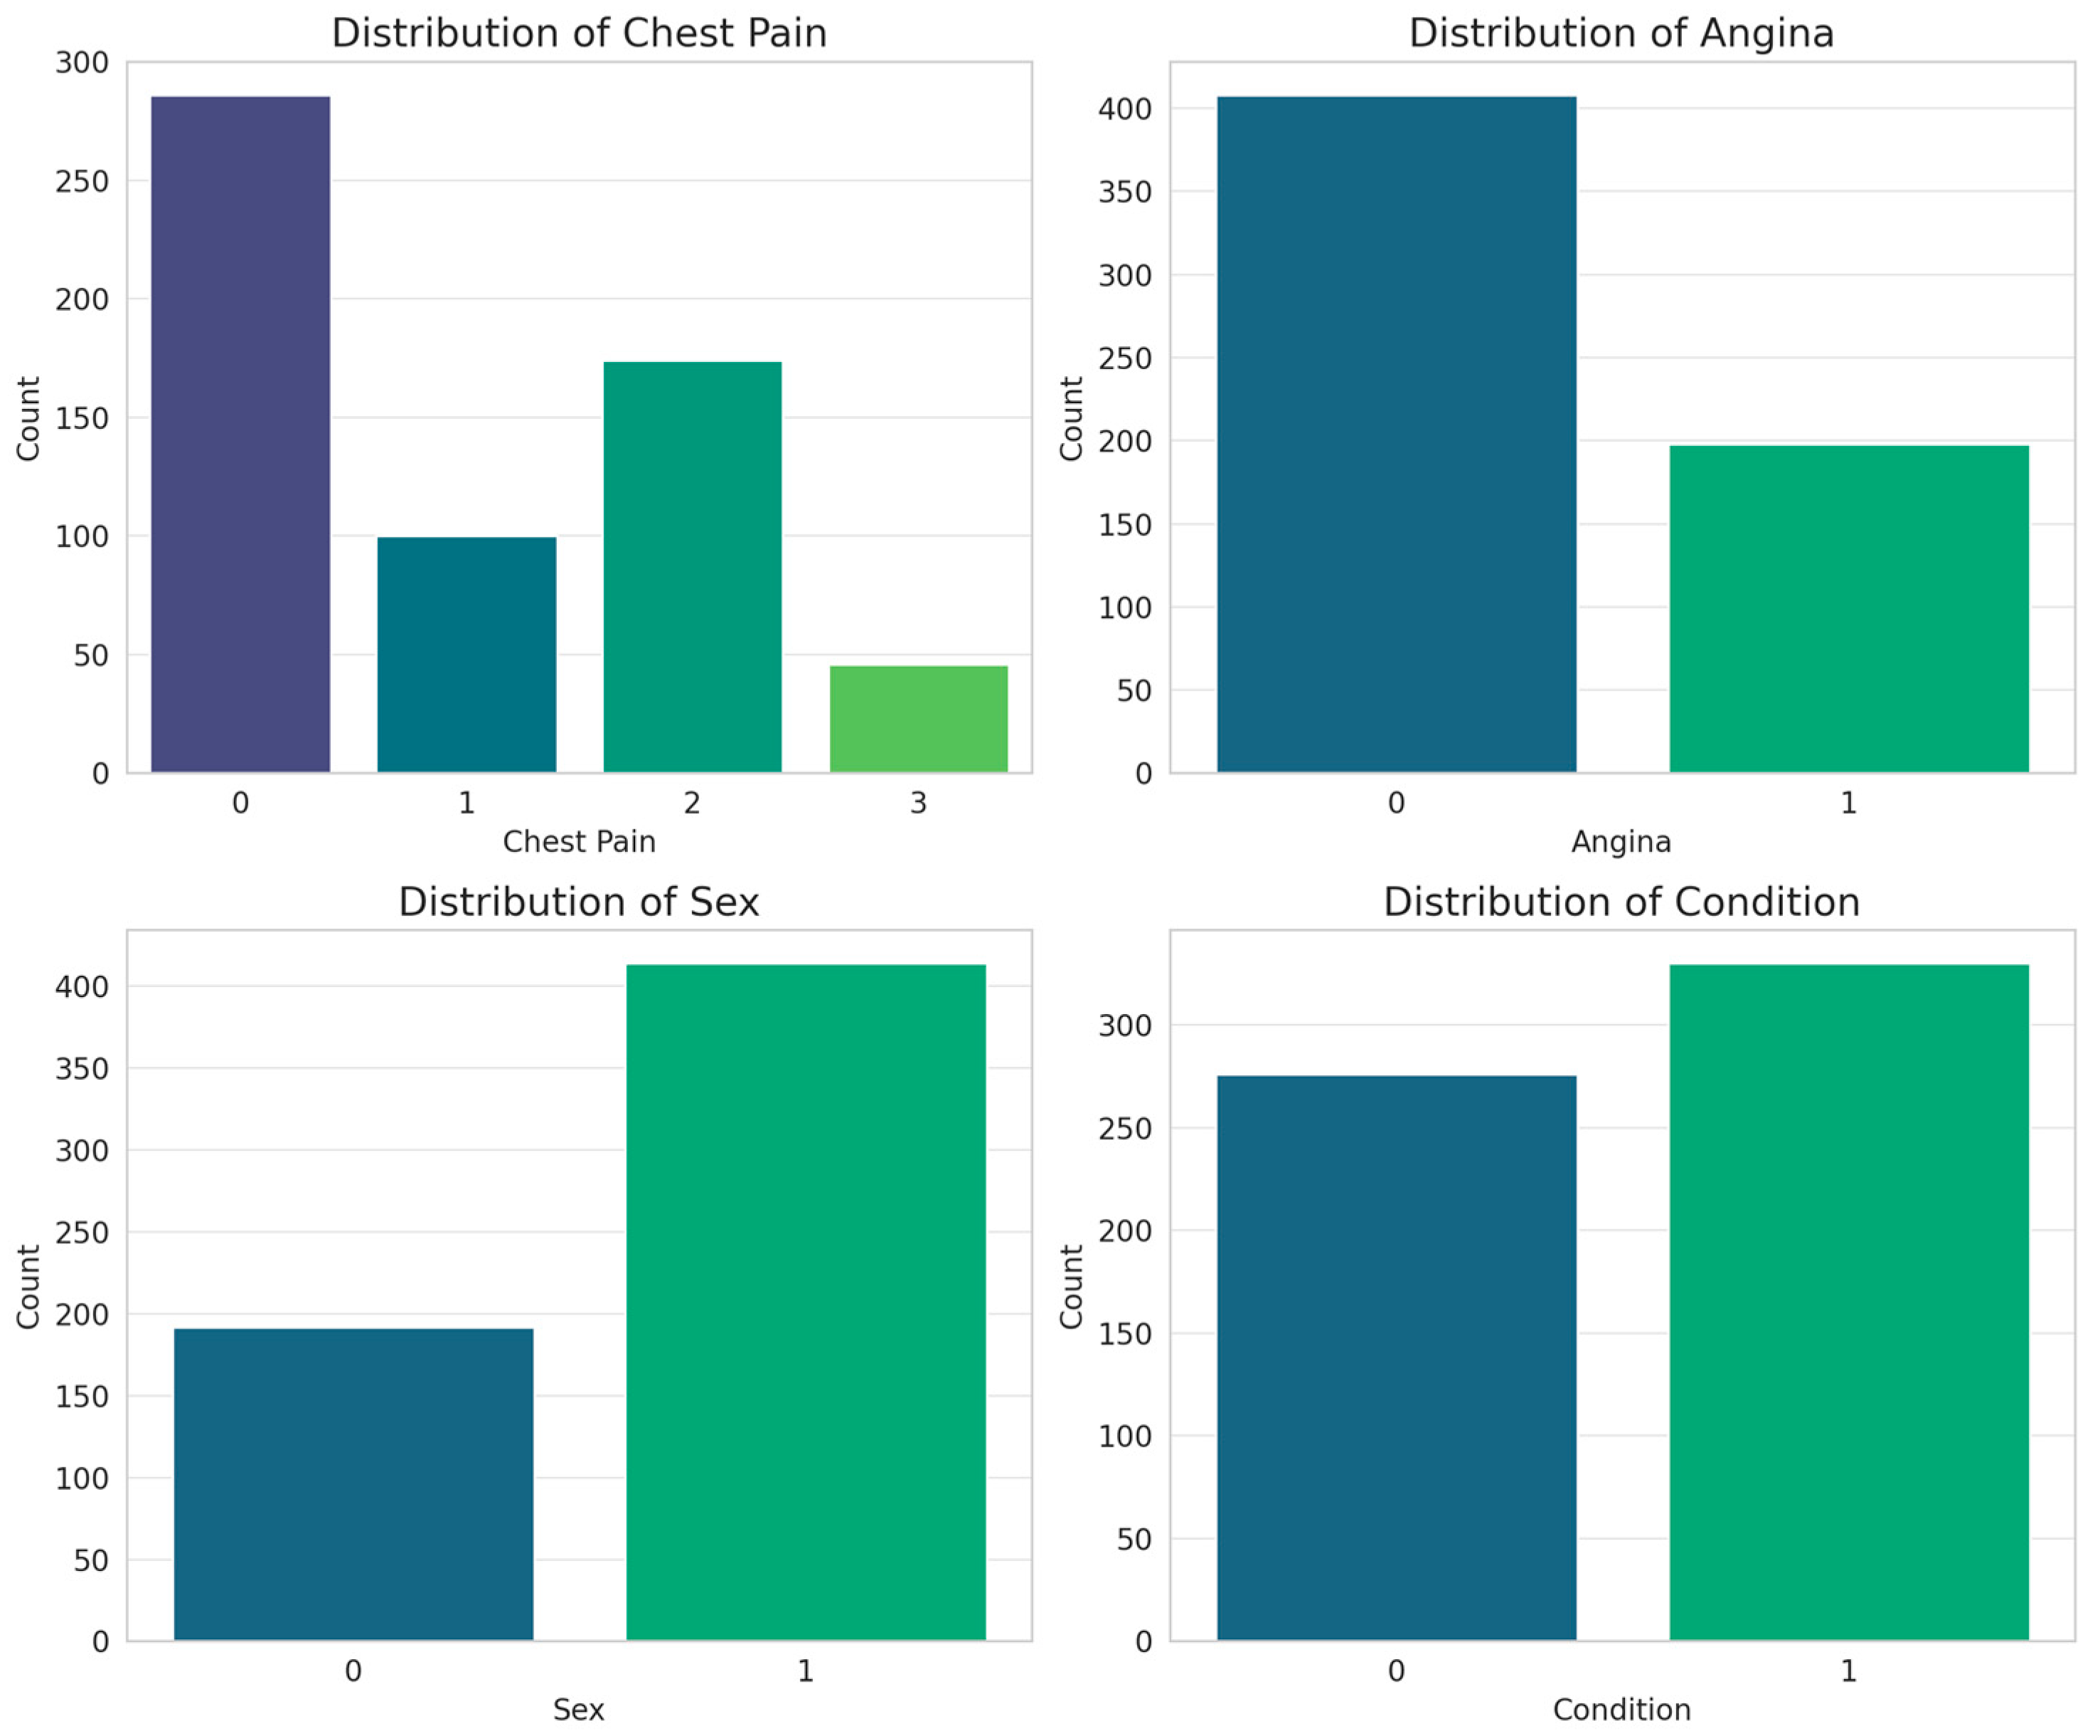
On the other hand, for the categorical attributes, bar plots were obtained (Figure 9).
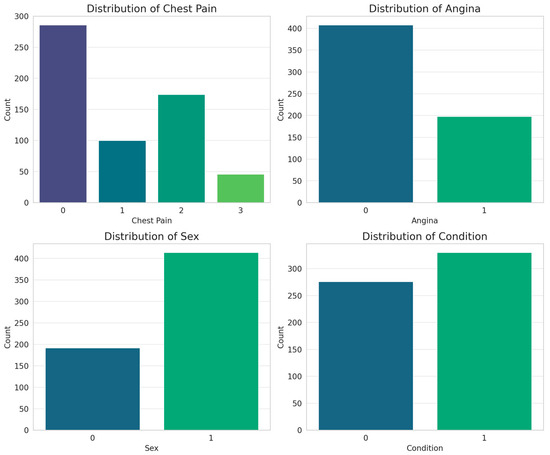
Figure 9.
Histograms of the categorical attributes considered for the classification of cardiovascular disease.
Most patients present with asymptomatic pain, suggesting that the disease does not always manifest with typical symptoms, which reinforces the importance of assessing other attributes. Exercise-induced angina shows a strong relationship with cardiac disease, highlighting it as a key predictor in classification models. Patient sex indicates a male predominance in the database, reflecting the higher prevalence of cardiovascular disease in men, although this bias should be considered when training models to avoid distortions in prediction. The diagnostic variable (condition) has a balanced distribution, which favors adequate training of the models without bias toward a specific class. From a classification perspective, chest pain and exercise-induced angina are the most relevant indicators, while sex and diagnosis distribution provide context for the database. These findings reinforce the importance of combining categorical variables with non-invasive measurements, such as blood pressure and heart rate, to improve the accuracy of predictive models.
From a machine learning perspective, these features provide crucial information for prediction. Age and heart rate stand out as the strongest indicators of the presence of disease, whereas blood pressure and cholesterol, although important in overall cardiovascular health, show less predictive capacity in this case. The use of non-invasive features such as these is fundamental to the practical implementation of classification models in clinical settings, as it allows for early detection without the need for costly or invasive laboratory tests. In addition, their immediate availability in medical consultations facilitates fast and efficient decision making.
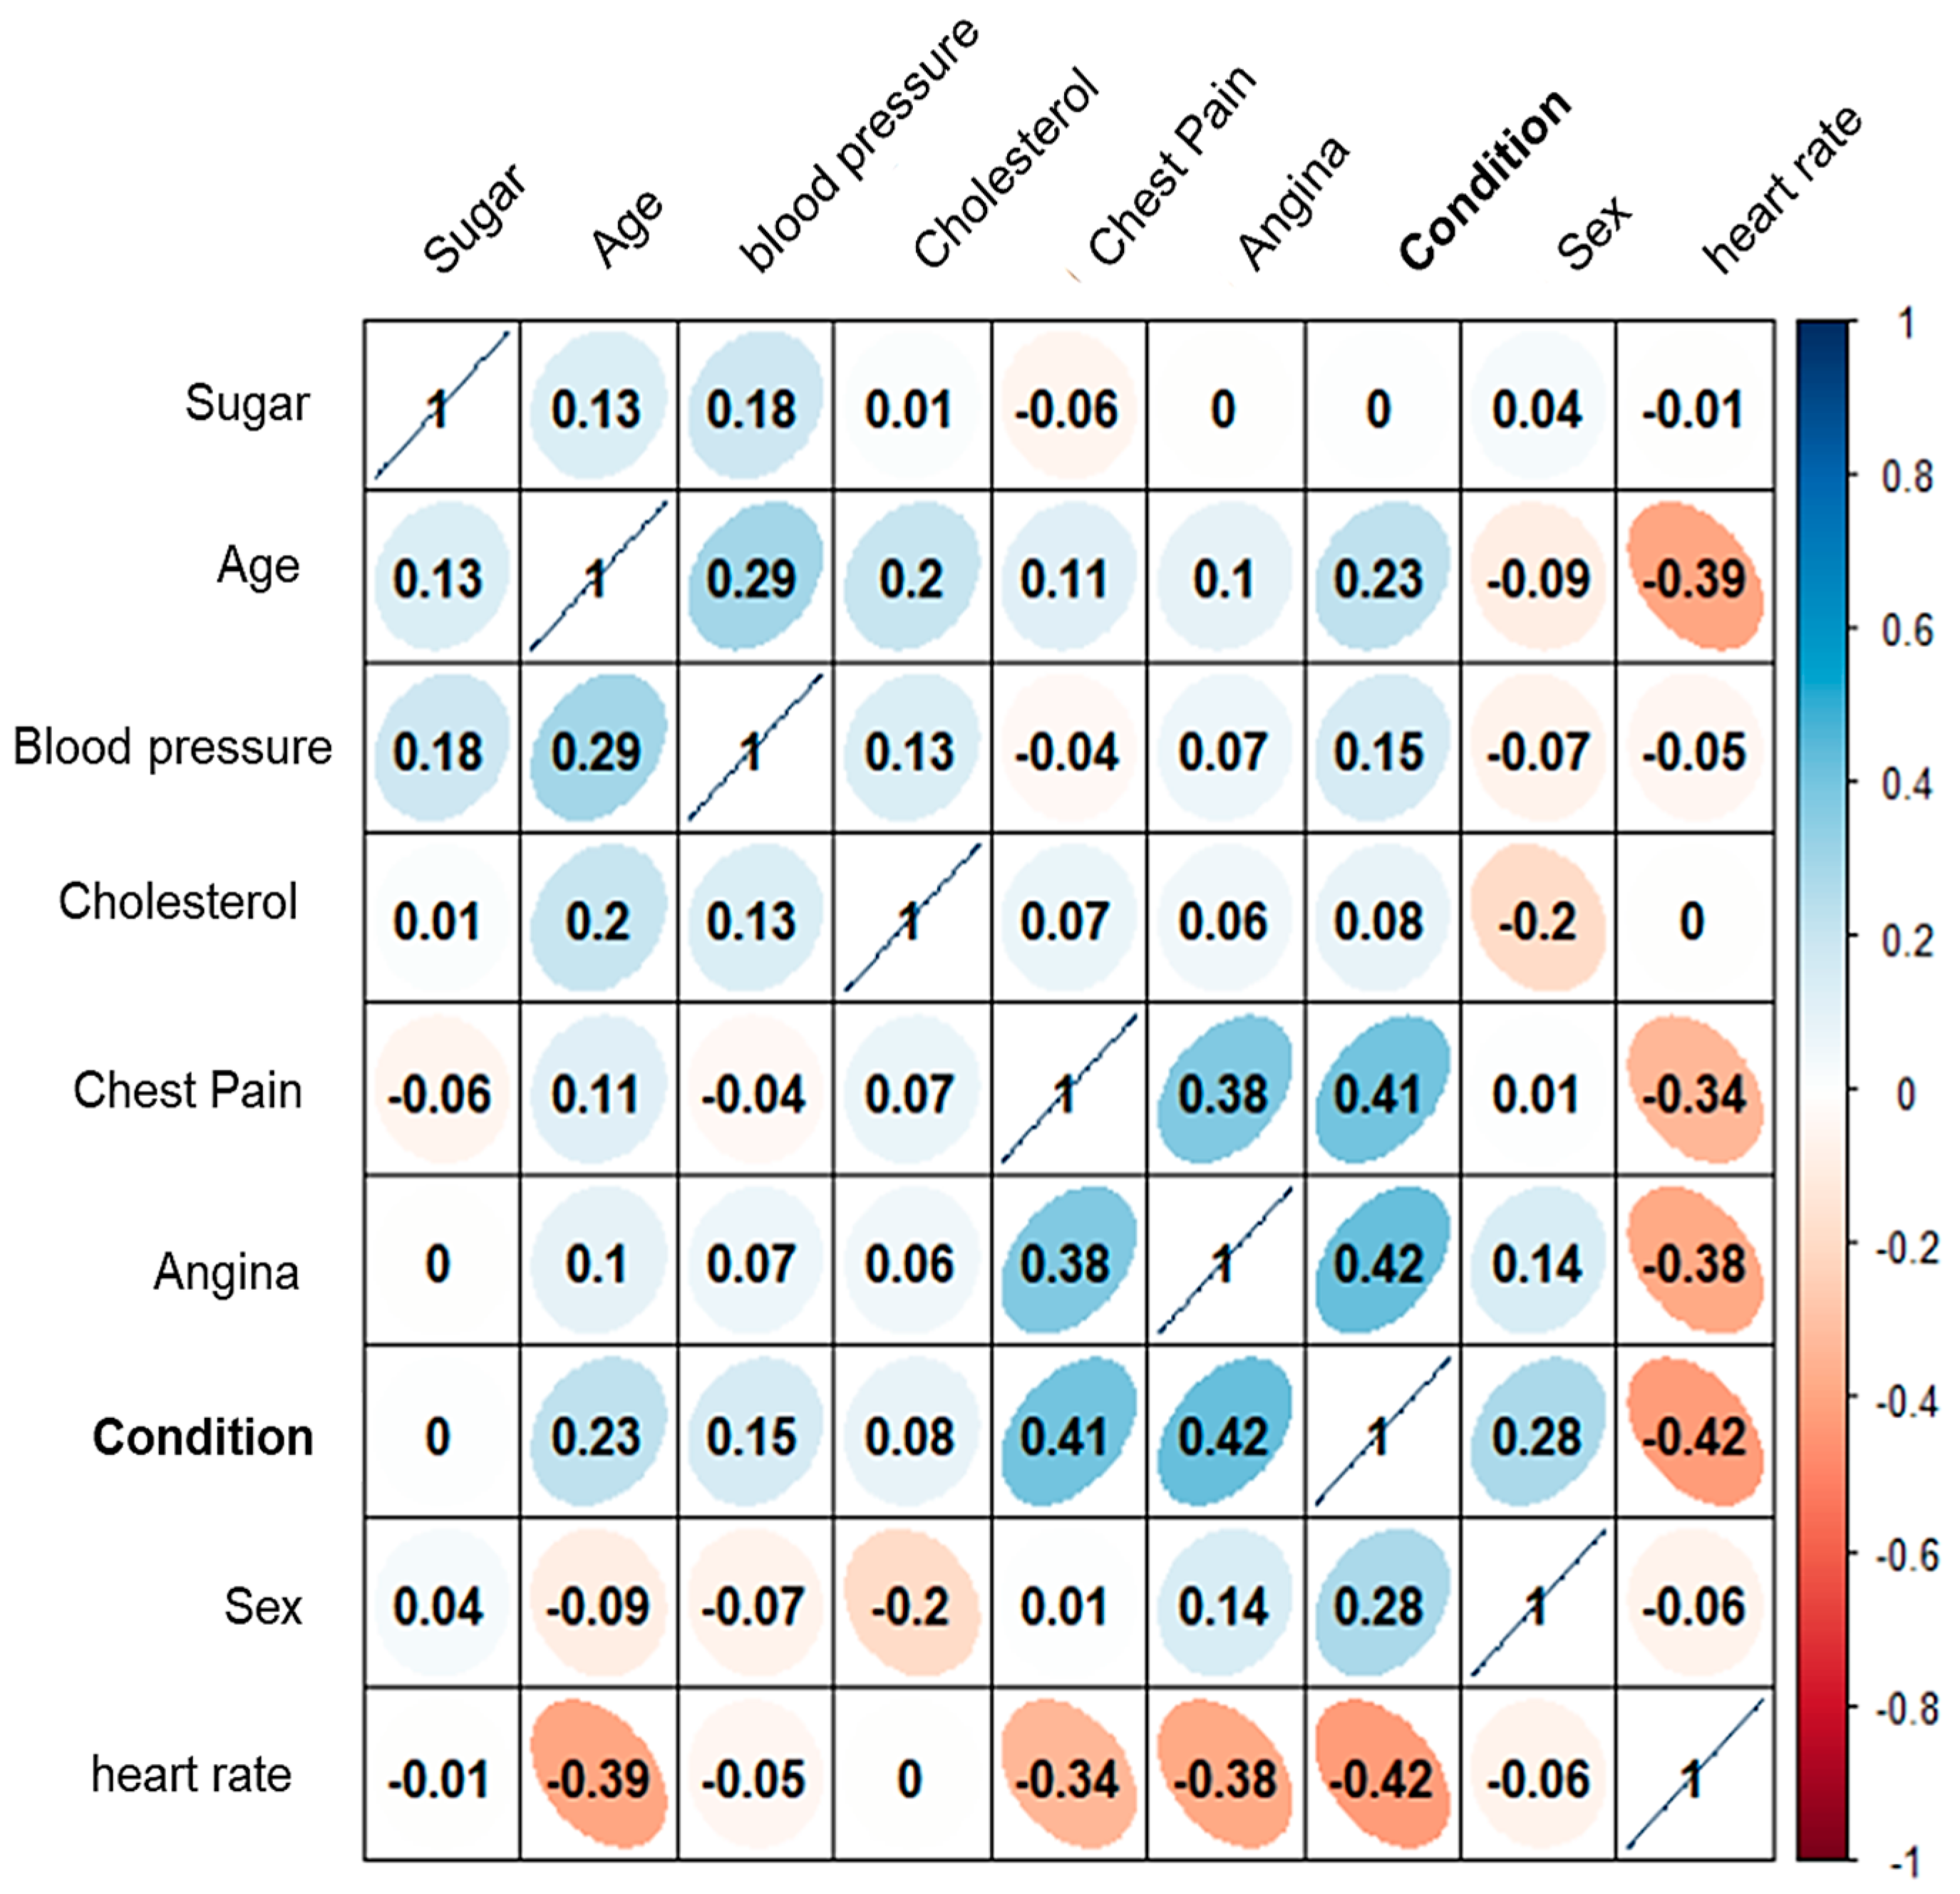
Considering the eight attributes classified as non-invasive, a heat map of the correlation matrix is presented to illustrate the relationships between them (see Figure 10). The analysis revealed that “sugar” and “cholesterol” exhibit a low correlation coefficient with respect to the ’condition’ attribute.
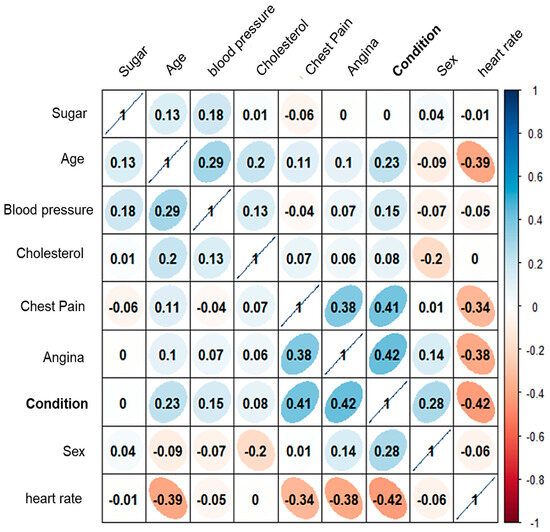
Figure 10.
Heat map of the correlation coefficients of the 8 attributes assigned as “non-invasive”.
This suggests that these two attributes contribute minimally to the accurate classification of patients, and may not be essential for the model’s predictive performance.
These results may be questionable. Given that, by the essence of cardiovascular diseases, elevated glucose and cholesterol are highly correlated with the development of these diseases. However, this study seeks to generate a classification based on non-invasive attributes, given the conditions of many health clinics in Mexico. Where blood studies usually take several days or even weeks. It is important to note that this preliminary study seeks to discuss this alternative for the use of artificial intelligence and the implementation of a new stage in the implemented methodology, in addition to the requirements and disadvantages of measuring cholesterol and glucose non-invasively [26].
However, the attributes “angina”, “frequency”, and “chest pain” are the ones that will have the highest statistical correlation in the classification. Thus, these eight attributes were tested in the following stage.
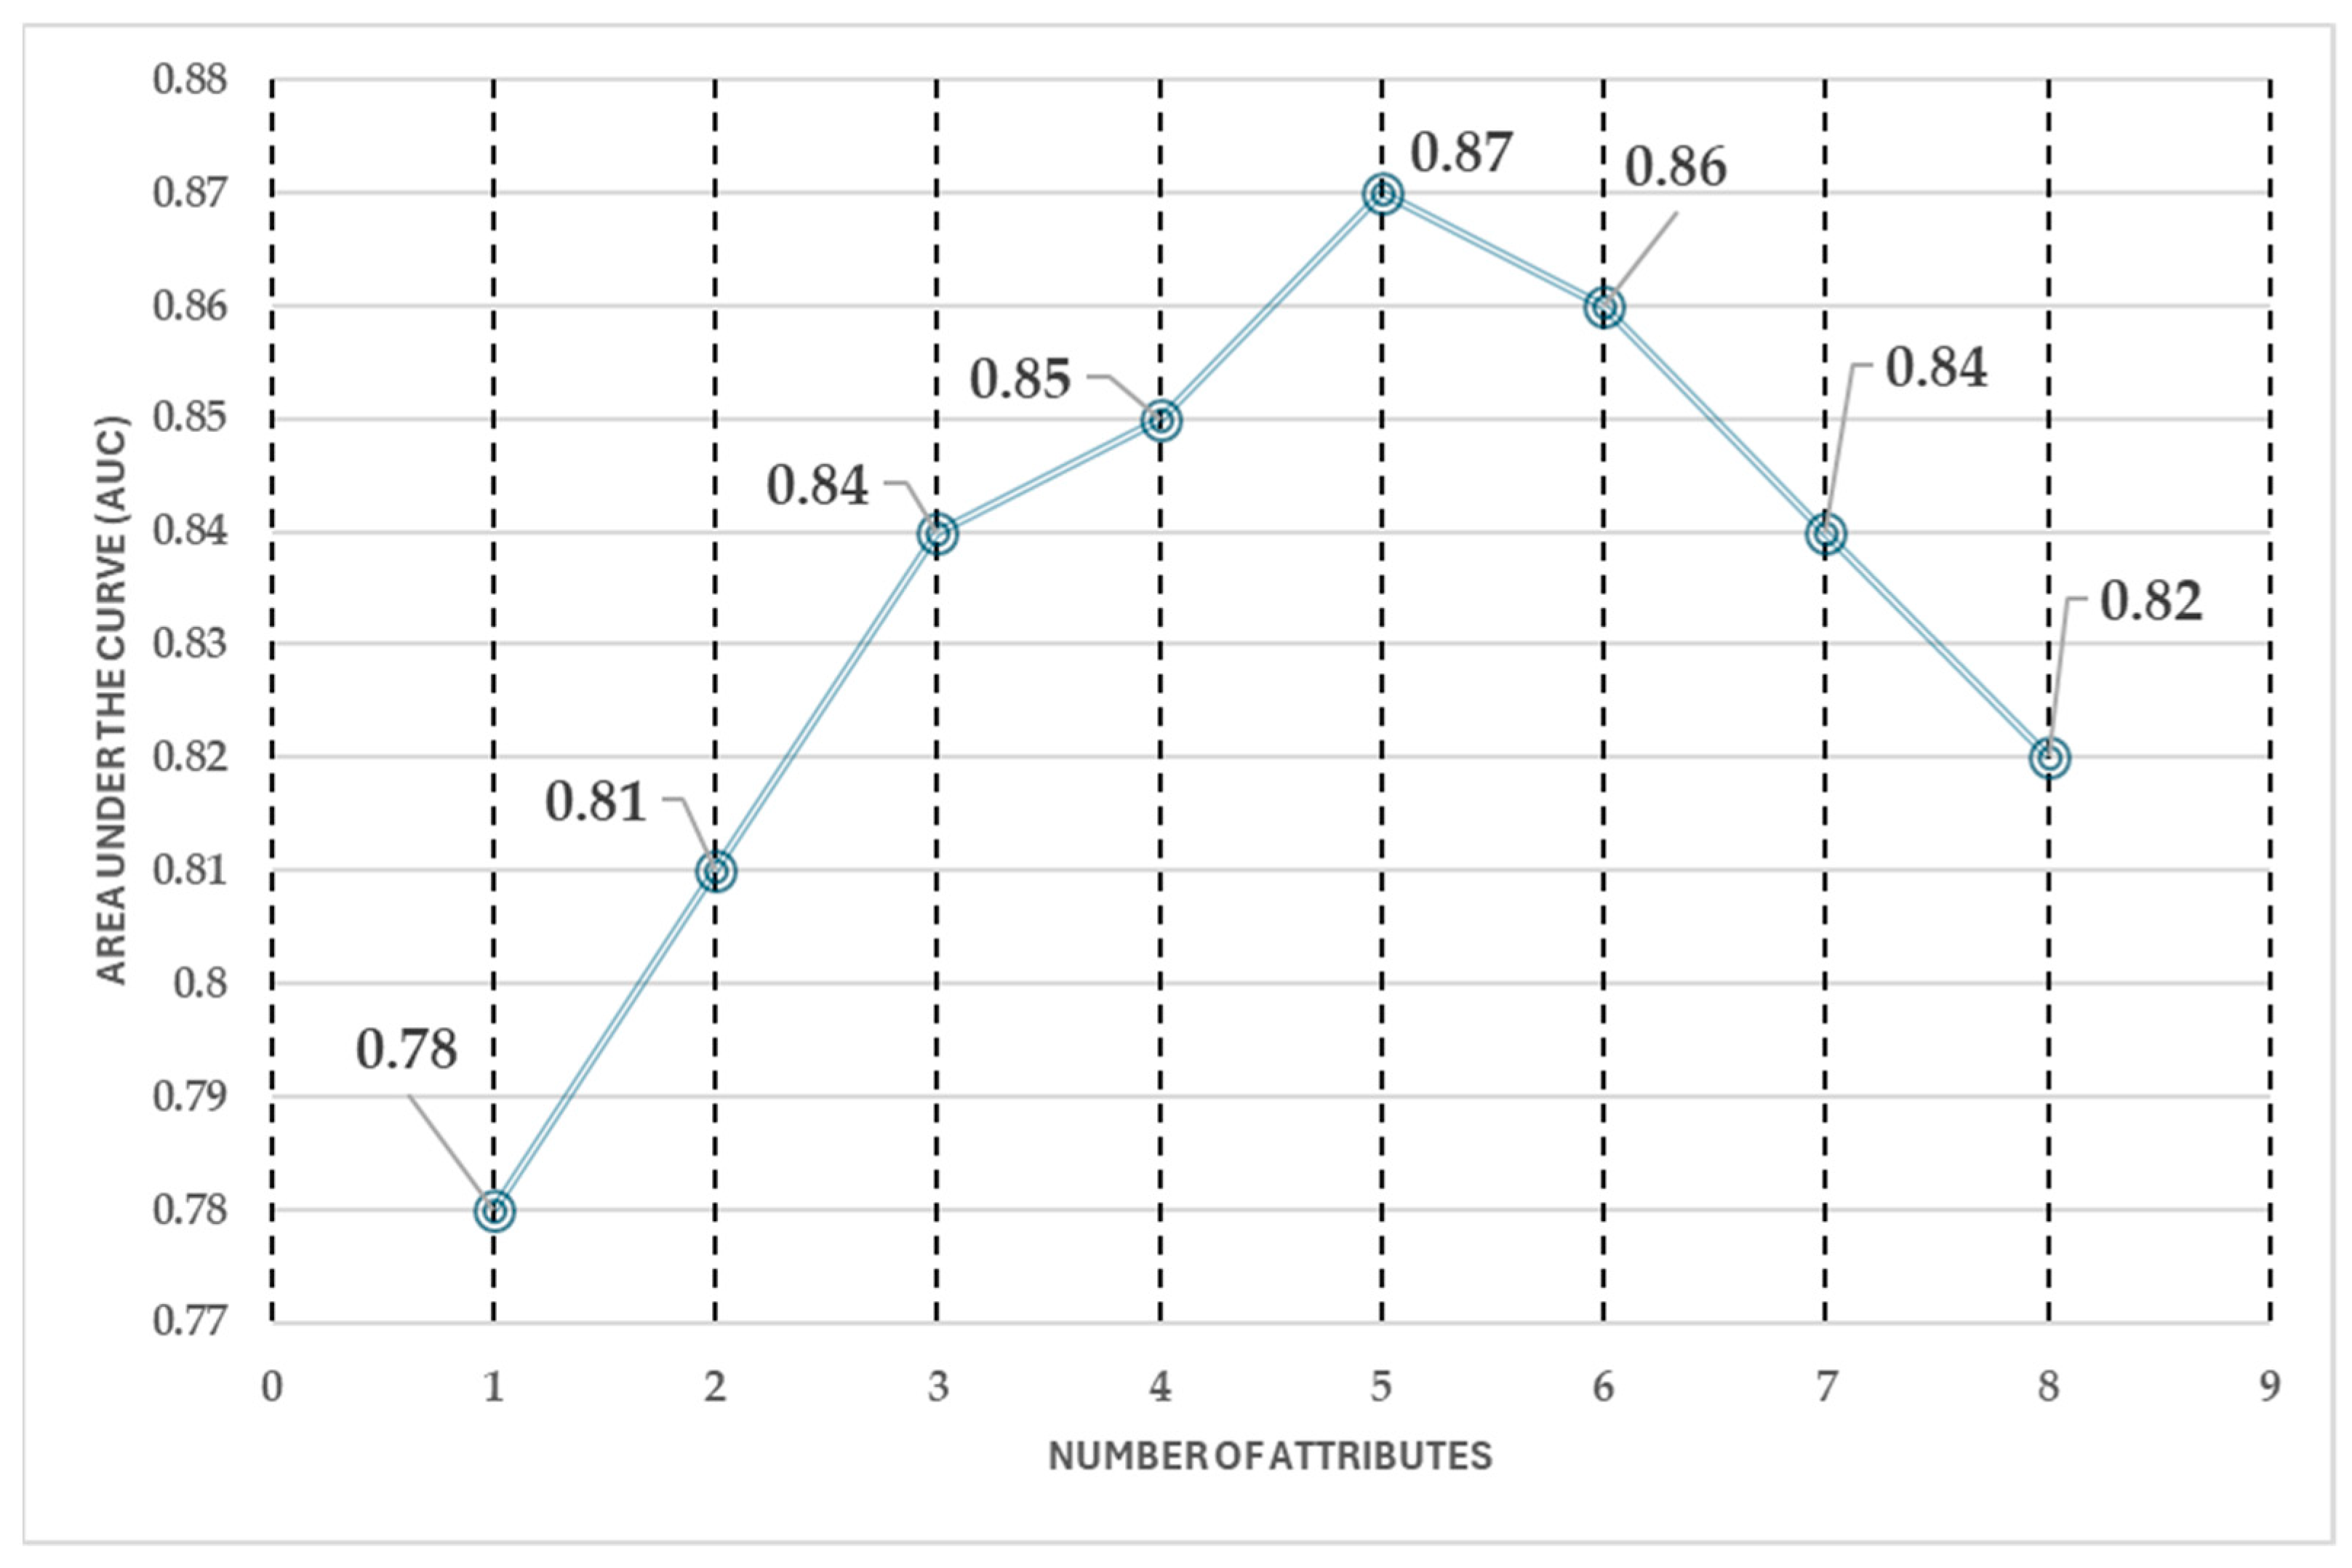
Furthermore, the forward selection process (see Figure 11) revealed that the predictive performance stabilizes after selecting five attributes. The AUC shows a consistent trend across five, six, seven, and eight attributes, indicating that adding more features does not significantly improve classification performance. This suggests that an optimal balance between model accuracy and computational efficiency can be achieved with a reduced set of attributes, avoiding unnecessary complexity while maintaining high predictive capability.
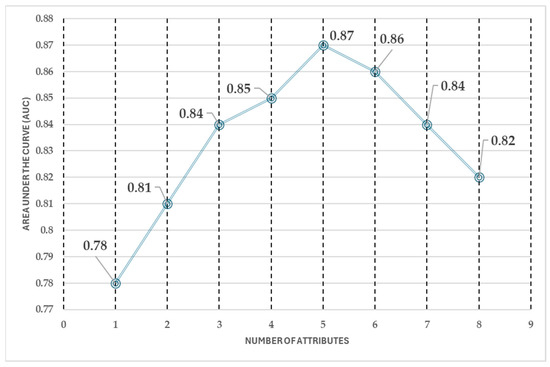
Figure 11.
Forward selection performance.
The forward selection analysis highlights that, after selecting five attributes, the model’s performance remains stable, making additional features redundant. This reduction in the number of attributes leads to a 50% decrease in computational cost and reduces the workload for medical professionals, improving efficiency in the classification process.
Based on this analysis, the five key attributes that achieve similar classification performance as the full eight-attribute model are sex, age, chest pain, heart rate, angina, and condition. The stepwise addition of attributes follows this sequence:
- Condition, Heart Rate
- Condition, Chest Pain, Heart Rate
- Condition, Chest Pain, Heart Rate, Exercise-Induced Angina
- Condition, Chest Pain, Heart Rate, Angina, Sex
- Condition, Chest Pain, Heart Rate, Angina, Sex, Age
- Condition, Chest Pain, Heart Rate, Angina, Sex, Age, Cholesterol
- Condition, Chest Pain, Heart Rate, Angina, Sex, Age, Cholesterol, Blood Pressure
- Condition, Chest Pain, Heart Rate, Angina, Sex, Age, Cholesterol, Blood Pressure, Sugar
A key finding of this study is that an accurate prediction of high or low cardiovascular disease risk can be obtained using just one measurement instrument and a few patient-reported attributes. The best achieved accuracy is 87%, meaning that 87 out of every 100 patients are correctly classified, with a 13% margin of error. This demonstrates the effectiveness of a simplified approach, ensuring reliable results while minimizing the need for costly and invasive procedures.
The difference in the area under the curve (AUC) between using five and eight attributes is approximately 0.05. While this change is negligible in terms of performance improvement, it represents a significant reduction in the number of attributes required, optimizing efficiency without compromising accuracy.
3.2. Performance of ML Algorithms
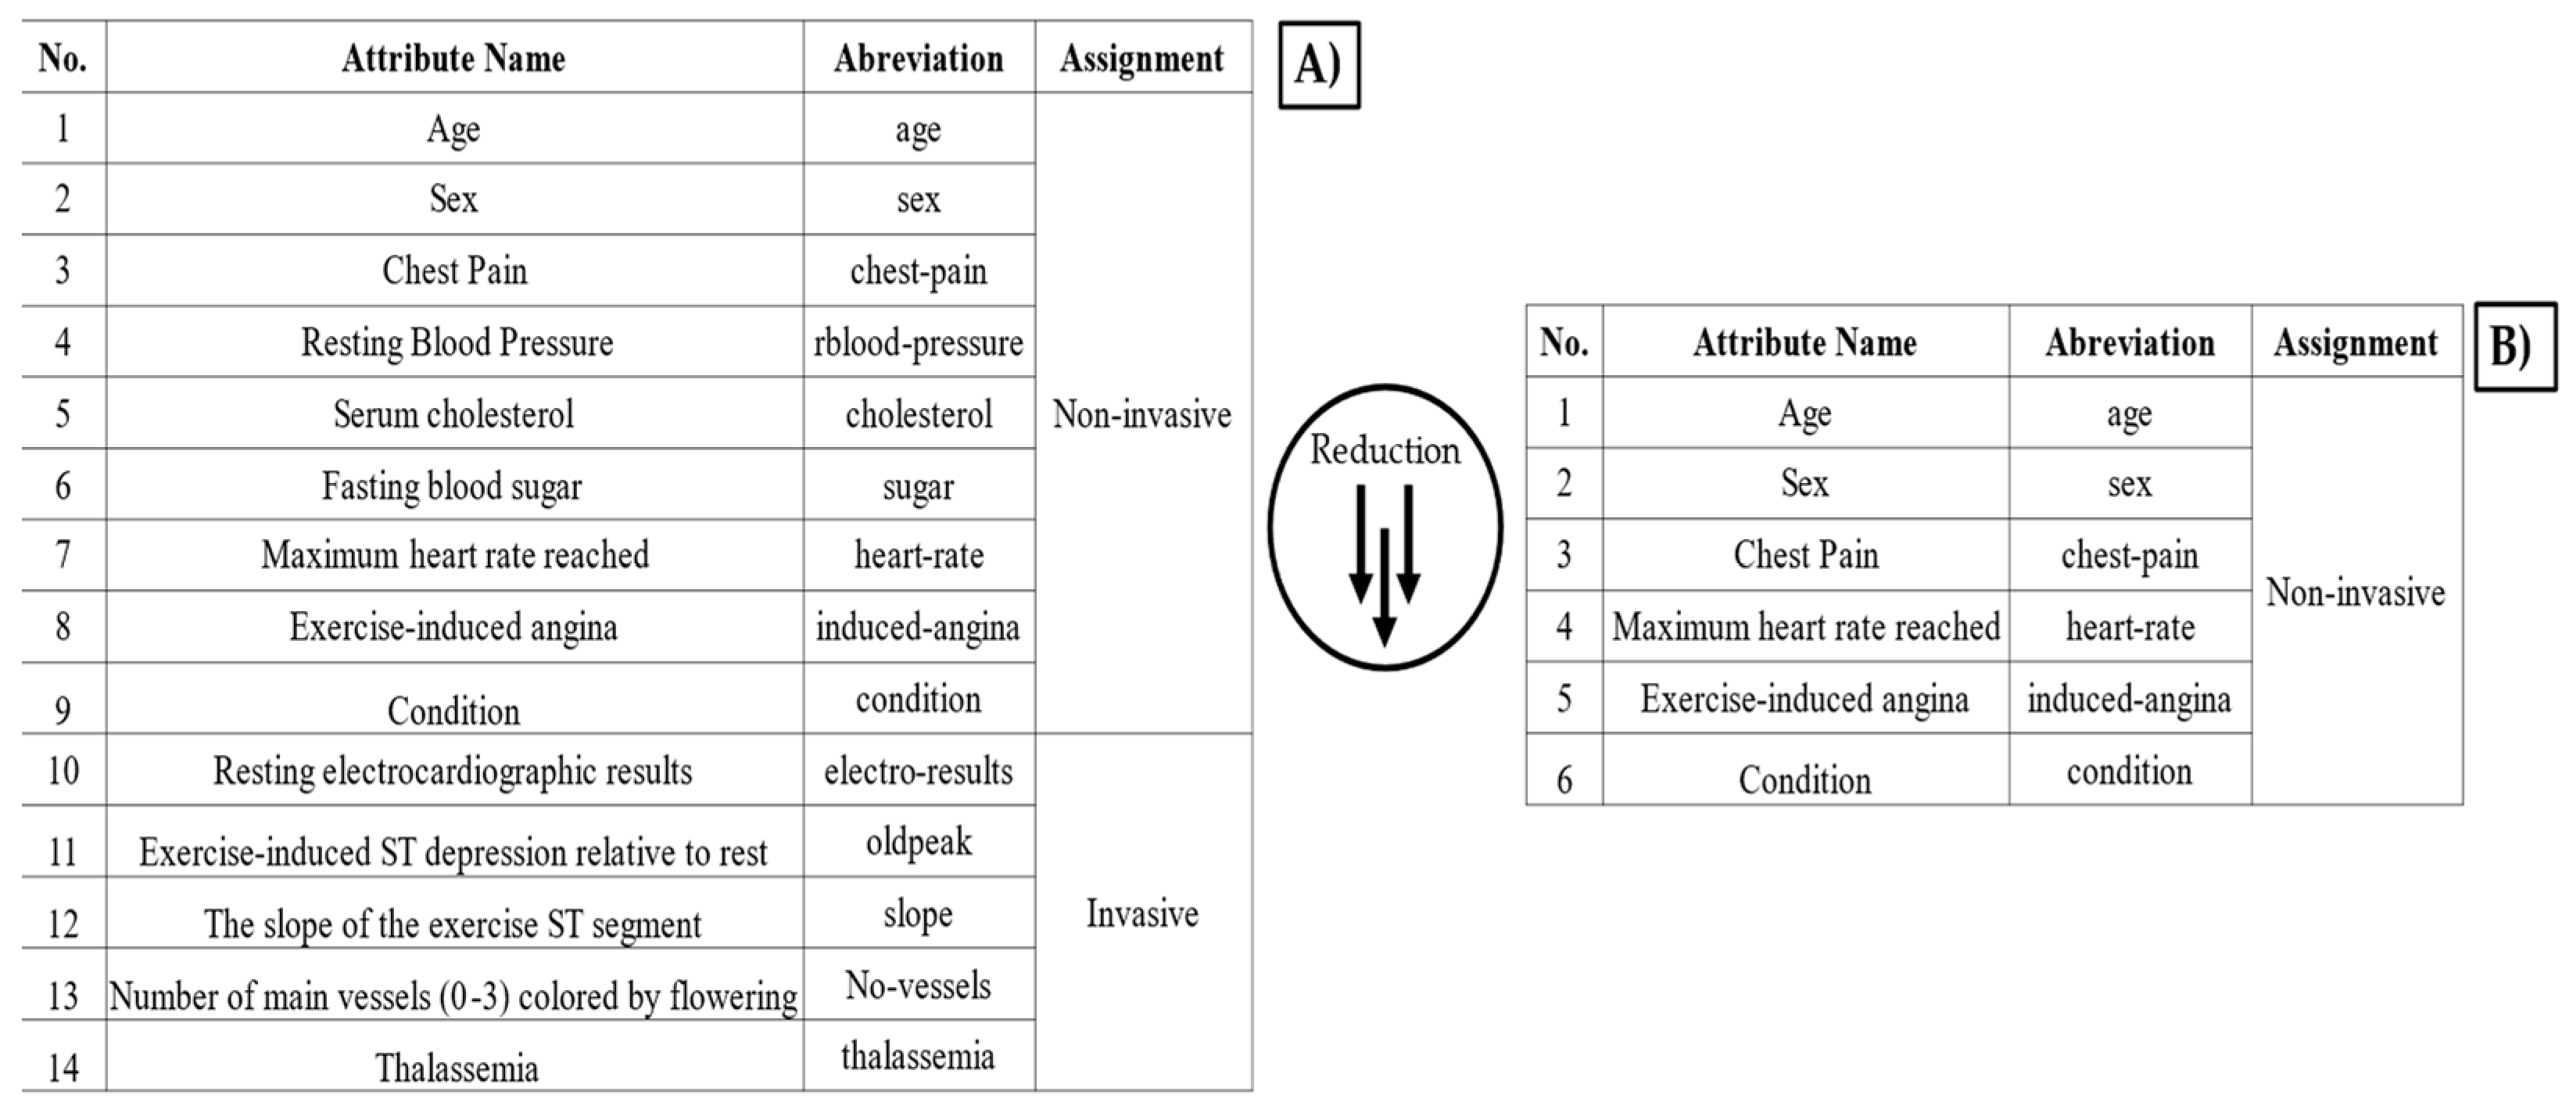
The most suitable algorithm to classify patients is the random forest algorithm, with only five attributes, and the performance obtained in the area under the curve (AUC) is 0.93; whereas logistic regression and support vector machine show a lower performance, so they are discarded. On the other hand, it is important to highlight the difference between the performance obtained for 14 attributes (accuracy 0.87, AUC 0.93) and that for 5 attributes (accuracy 0.85, AUC 0.93). The difference is approximately 0.02 in accuracy, which can be considered of little difference. However, if only 5 attributes are considered, and not 14, there is a reduction in the number of attributes by approximately 60%, which represents a significant improvement in terms of data efficiency (Figure 12).

Figure 12.
(A) Table that contains the 14 attributes available in the UC Irvine database. (B) Table with a reduction to 5 attributes.
To find the most suitable algorithm for classifying patients, three parameters were obtained to measure their performance: accuracy, sensitivity, and area under the curve. Table 3 shows a summary of the three algorithms and their respective performances obtained during the testing of the algorithms. First, with 5 purely non-invasive attributes, and then with 14 attributes between non-invasive and invasive.
Table 3.
Performance of machine learning classification algorithms.
While random forest performs best in all cases, logistic regression experiences a notable drop in accuracy when increasing the number of attributes from 5 to 14 (from 0.79 to 0.62). This suggests that LR struggles with high-dimensional data and may not generalize well when additional features are introduced. Conversely, SVM improves with more attributes, reaching an accuracy of 0.83, but still underperforms compared to RF.
To further validate these findings, Figure 13 presents the confusion matrices for each model with 5 and 14 attributes, providing a detailed view of the classification errors.
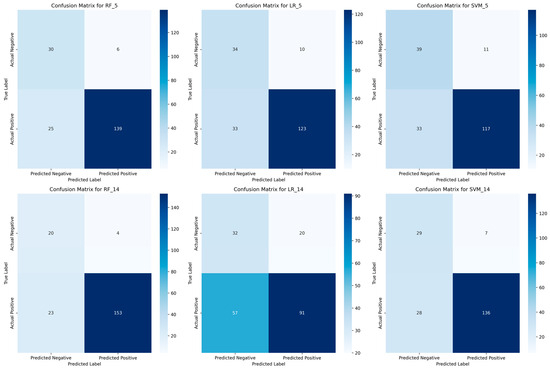
Figure 13.
Confusion Matrices for the Evaluated Models.
The confusion matrices (Figure 13) confirm the superiority of RF in patient classification. With five attributes, RF achieves a strong balance between true positives (139) and low false negatives (25), ensuring high sensitivity (0.82). When using 14 attributes, RF further improves, reducing false negatives to 23, thereby reinforcing its reliability for medical screening. LR struggles with high-dimensional data, as seen in its confusion matrix for 14 attributes, where false negatives increase to 57, significantly reducing its sensitivity. This suggests LR is unsuitable for detecting high-risk patients, particularly when adding more features. SVM improves with more attributes, reducing misclassifications, but still underperforms compared to RF. Its higher false negatives suggest a lower reliability in identifying patients at risk. Overall, RF consistently minimizes misclassification errors, making it the most effective model for screening patients with a limited set of non-invasive attributes.
These results reflect a lower computational and data collection cost, making it easier for clinicians to classify patients using fewer tools. The measurement and classification processes also become simpler and faster.
A slight decrease in accuracy in RF, less than 0.1 (approximately 2%), is observed when prioritizing non-invasive attributes; however, this trade-off results in several advantages. These include a reduction in monetary cost, minimizing patient discomfort during measurement, lowering computational requirements, eliminating the need for specialized and expensive instruments, and increasing the number of patients identified early as at-risk for cardiovascular disease. Additionally, this approach enhances the efficiency of the screening process, ensuring that more individuals at risk can be directed toward specialized medical evaluation.
Furthermore, the system is designed for preventive use (to detect or warn of an imminent cardiovascular risk) and as a screening tool (to identify high-risk individuals and refer them for specialized evaluation).
3.3. Validation of ML Algorithms
It was found that only four attributes are required to classify the risk of cardiovascular disease: sex, chest pain, exercise-induced angina, and maximum heart rate. Among these, maximum heart rate is the only attribute that requires measurement using the MAX30100 sensor, while the remaining three can be obtained through a simple questionnaire. The random forest algorithm was identified as the most effective classifier for this task.
To assess the feasibility of using the Heart Disease dataset (originally from the United States) in a Mexican population, a comparative analysis was conducted. Initially, 10 patients were randomly selected from the dataset; however, to strengthen statistical robustness, the sample size was increased to 30 patients. These patients were randomly extracted by generating a random number between 0 and 298, repeating the process 30 times to ensure a representative selection.
The cosine similarity coefficient was then used to quantify the degree of resemblance between the Mexican patients (experimental data) and the original dataset (theoretical data). As shown in Table 4, most similarity coefficients exceed 70%, indicating a strong correlation between both datasets.
Table 4.
Cosine similarity coefficients from dataset and Mexican patients.
Among the evaluated attributes, heart rate exhibited the highest similarity (0.94), suggesting that the patient sample used in this study is comparable to the data in the original database. This validates the applicability of the machine learning model and reinforces the relevance of its use as a preliminary diagnostic tool for cardiovascular disease risk.
Additionally, Figure 14 visualizes the comparison between the 30 Mexican patients and the 30 selected patients from the dataset. The graph plots five key attributes: sex, exercise-induced angina, chest pain, age, and heart rate, further supporting the justification for using the Heart Disease dataset as a reliable reference for this study.
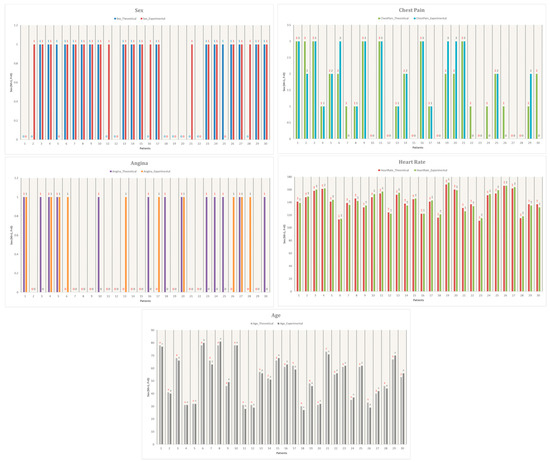
Figure 14.
Comparison of the five attributes measured, the colors represent the specific conditions of each experiment.
As shown in Figure 14, the similarities between experimental and theoretical data are highly consistent. The attribute with the highest similarity is heart rate, indicating that the patient sample obtained for this study closely resembles the data from the reference database. This validation supports the applicability of the Heart Disease dataset for training and testing the machine learning model in the context of a Mexican population.
Following this validation of the use of the UC Irvine database in the Mexican population, the time taken by the Buazduino-001 cardiovascular disease risk classifier to obtain the diagnosis of the selected patients was obtained and compared with the diagnosis time made by a health specialist. A significant reduction in diagnosis time was observed when comparing the tool’s performance to the traditional method performed by a medical specialist (Table 5).
Table 5.
Comparison of Diagnosis Time Between a Medical Specialist and the Buazduino-001.
To quantify the observed time reduction, a direct comparison was made between the diagnosis time required by a specialist and the Buazduino-001 system. The specialist took an average of 10 min per patient, whereas the Buazduino-001 classifier generated a diagnosis in approximately 2 min per patient. This represents an 80% reduction in diagnostic time. Additionally, in a one-hour period, the specialist could assess an estimated 6 patients, while the Buazduino-001 system could theoretically classify 30 patients under similar conditions.
To assess classification accuracy, two independent tests were conducted using the Buazduino-001 system. The goal was to compare the tool’s predictions with the actual diagnosis provided by a specialist. In the first test, the tool correctly classified 24 out of 30 patients, achieving an accuracy of 80%. In the second test, the tool correctly classified 27 out of 30 patients, reaching an accuracy of 90%.
These results align well with the 87% accuracy obtained in the numerical simulations using the random forest algorithm. In other words, the experimental outcomes closely resemble the performance predicted in the algorithm evaluation stage. If the results of both experimental tests (80% and 90%) are averaged, the system achieves an overall accuracy of 85%.
Additionally, the recall (sensitivity) of the tool, which measures the proportion of correctly identified positive cases, was found to be considerably acceptable. The level of agreement between the expected and the actual classification results, measured by Cohen’s kappa coefficient, was within a range considered substantially acceptable, further validating the reliability of the Buazduino-001 system for preliminary cardiovascular disease risk assessment.
3.4. Comparison of Cardiovascular Risk Predictor with Other Works
Finally, to validate the performance of the Buazduino-001 classifier, a comparison was made with similar works in the literature. The comparison focused on accuracy, number of attributes used, and the type of attributes considered in algorithm development. Table 6 summarizes four related works alongside the present study.
Table 6.
Comparison vs. other similar classifiers.
A key observation is that previous studies do not differentiate between invasive and non-invasive attributes, whereas Buazduino-001 prioritizes only non-invasive parameters. Additionally, most related studies use a higher number of attributes, increasing computational complexity. Ghosh et al. (2021) [26] achieve almost perfect accuracy, but the algorithm’s complexity is significantly higher than the model implemented in this work, making its application in real-time scenarios more challenging.
For the case of Tabassum et al. (2019) [27], the accuracy is comparable to Buazduino-001; however, their model does not minimize the number of attributes, which impacts efficiency and applicability in low-resource settings. The integration of machine learning, electronics, and GUI in the Buazduino-001 system demonstrates a feasible and practical approach for cardiovascular disease risk detection.
It is important to emphasize that this system is intended solely as a decision-support tool, not as a replacement for specialized medical evaluations. While Buazduino-001 provides a low-cost, rapid screening method, it does not eliminate the need for specialized studies or advanced diagnostic tools, such as electrocardiograms. Instead, it serves as a complementary tool that can assist healthcare providers in early detection and decision-making regarding cardiovascular risk, particularly in settings with limited access to specialized care.
At this point, it is demonstrated through the discussion of the results obtained, that the proposal of a six-step methodology, integrating an innovative step to differentiate the attributes between “non-invasive” and “invasive” can be useful and an option for the development and implementation of cardiovascular disease classifiers. The benefits of this new stage are to reduce the costs, patient discomfort and to decrease the number of attributes, but without losing adequate precision for cardiovascular risk classification.
In addition, the Buazduino-001 electronic design proposal contributes to cost savings by implementing low-cost and easily accessible components. This also has the advantage of being repaired or replaced quickly and without generating large additional costs.
4. Conclusions
This work presents the implementation of a machine learning-based classifier for cardiovascular disease risk assessment. The Buazduino-001 classifier offers a promising low-cost solution for early detection, significantly reducing the response time for diagnosis compared to traditional methods. From a specialist’s perspective, it is considered a valuable auxiliary tool for cardiology consultations, particularly in rural clinics where access to specialized medical equipment is limited.
A key contribution of this study is the introduction of a new stage in the conventional data processing methodology, distinguishing between invasive and non-invasive attributes. This enhancement streamlines the classification process, facilitating faster and more accessible screenings, which is crucial for early intervention. By using non-invasive attributes, the classifier optimizes diagnostic efficiency while minimizing patient discomfort.
It is important to highlight that this is a preliminary study, and the results obtained are based on the reference [21], Heart Disease dataset, a publicly available dataset from the UCI Machine Learning Repository. The dataset consists of 303 patients, of which 298 cases were used after preprocessing. Additionally, experimental validation was conducted with 30 patients, yielding an 85% accuracy, closely aligning with the 87% accuracy obtained in numerical simulations. While this validation provides strong initial support for the classifier’s feasibility, further studies are needed with larger and more diverse patient populations to ensure greater generalizability.
One limitation of this study is the relatively small dataset, which does not cover a broad spectrum of cardiovascular diseases. Future research should focus on testing the classifier with a significantly larger dataset, incorporating real-world clinical data from diverse populations. Expanding the sample size would allow for a more comprehensive evaluation of the classifier’s effectiveness and could improve the model’s ability to differentiate between various cardiovascular conditions.
Nevertheless, the Buazduino-001 classifier demonstrates strong potential for real-world application, offering an effective balance between diagnostic accuracy and resource efficiency. By achieving a 70% reduction in required attributes with only a 10% decrease in performance, this tool provides a practical and scalable solution to address the critical shortage of medical equipment in underserved regions of Mexico. Future work should explore the integration of real-time clinical data, investigate the incorporation of additional machine learning techniques, and assess the feasibility of deploying the classifier in telemedicine and mobile healthcare settings to further enhance accessibility.
Author Contributions
Conceptualization, C.S.G. and M.Z.d.l.T.; methodology, D.A.L. and E.G.-R.; software v1.0, J.I.D.l.R.V. and C.O.-O.; validation, J.O.S. and O.A.G.-B.; formal analysis; writing—original draft preparation, O.C.D. and H.D.M. All authors have read and agreed to the published version of the manuscript.
Funding
This research received no external funding.
Institutional Review Board Statement
Not applicable.
Informed Consent Statement
Not applicable.
Data Availability Statement
The raw data supporting the conclusions of this article will be made available by the authors on request.
Acknowledgments
The authors would like to thank Consejo Nacional de Humanidades Ciencias Tecnologías (CONAHCYT) for the scholarship support for the development of this work.
Conflicts of Interest
The authors declare no conflicts of interest.
References
- Moherdaui, S.; Ferreira, M.; Souza, F.; Galan, F.; Muller, V.; Andreazza, I. Development and validation of analytical methodology for quantification of propranolol hydrochloride in a multiparticulate biphasic system by uv-vis spectrophotometry. Acta Sci. Technol. 2018, 40, 1. [Google Scholar] [CrossRef]
- Munteanu, R.; Banuleasa, S.; Rusu, A.; Butacu, D. Acquisition and transmission of ecg signals through stainless steel yarn embroidered in shirts. Adv. Electr. Comput. Eng. 2020, 20, 73–78. [Google Scholar] [CrossRef]
- Uddin, S.; Khan, A.; Hossain, M.; Moni, M. Comparing different supervised machine learning algorithms for disease prediction. BMC Med. Inform. Decis. Mak. 2019, 19, 281. [Google Scholar] [CrossRef]
- Mezzatesta, S.; Torino, C.; Meo, P.D.; Fiumara, G.; Vilasi, A. A machine learning-based approach for predicting the outbreak of cardiovascular diseases in patients on dialysis. Comput. Methods Programs Biomed. 2019, 177, 9–15. [Google Scholar] [CrossRef] [PubMed]
- Li, R.; Shen, S.; Zhang, X. Cardiovascular disease risk prediction based on random forest. In Proceedings of the 2nd International Conference on Healthcare Science and Engineering, ICHSE 2018; Springer: Singapore, 2019; Volume 536. [Google Scholar] [CrossRef]
- García, J.; Crawford, B.; Soto, R.; Astorga, G. A clustering algorithm applied to the binarization of swarm intelligence continuous metaheuristics. Swarm Evol. Comput. 2019, 44, 646–664. [Google Scholar] [CrossRef]
- Liu, X.; Wang, E.; Zheng, Q. Random forest algorithm optimization of enterprise financial information management system. Lat. Am. Appl. Res. 2019, 48, 255–260. [Google Scholar] [CrossRef]
- Li, H.; Zhang, Q.; Zheng, Z. Application of machine learning in intelligent knowledge search algorithm. Lat. Am. Appl. Res. 2018, 48, 287–292. [Google Scholar] [CrossRef]
- Nusinovici, S.; Tham, Y.C.; Yan, M.-Y.C. Logistic regression was as good as machine learning for predicting major chronic diseases. J. Clin. Epidemiol. 2020, 122, 56–69. [Google Scholar] [CrossRef] [PubMed]
- Schonlau, M.; Zou, R. The random forest algorithm for statistical learning. Stata J. 2020, 20, 3–29. [Google Scholar] [CrossRef]
- Suthaharan, S. Support Vector Machine. In Machine Learning Models and Algorithms for Big Data Classification; Integrated Series in Information Systems; Springer: Boston, MA, USA, 2016; Volume 36, pp. 207–235. [Google Scholar] [CrossRef]
- Guzmán-Fernández, M.; Zambrano, M.; Ortega-Sigala, J. Arduino: A novel solution to the problem of high-cost experimental equipment in higher education. Exp. Tech. 2021, 45, 613–625. [Google Scholar] [CrossRef]
- Devarakonda, K.N.; Kravitz, A. Robucket: A low-cost operant chamber based on the arduino microcontroller. Behav. Res. 2016, 48, 503–509. [Google Scholar] [CrossRef] [PubMed]
- Guzmán, C.; Carrera, J.; Durán, H.; Berumen, J.; Ortiz, A. Implementation of virtual sensors for monitoring temperature in greenhouses using cfd and control. Sensors 2019, 19, 60. [Google Scholar] [CrossRef]
- Bueno-Hernández, D.; Mishra, R.; Muñoz, R.; Marty, J. Low-cost optical device for detection of fluorescence from ochratoxin a using a cmos sensor. Sens. Actuators B Chem. 2017, 246, 606–614. [Google Scholar] [CrossRef]
- Kuan, W.-H.; Tseng, C.-H.; Chen, S. Development of a computer-assisted instrumentation curriculum for physics students: Using labview and arduino platform. J. Sci. Educ. Technol. 2016, 25, 427–438. [Google Scholar] [CrossRef]
- Sifuentes-Gallardo, C.; Hernández-Ortiz, M.; Ortega-Sigala, J.; Rodríguez-González, B.; Cardoso-Pérez, M.; Esquivel-Félix, R.; Guirette-Barbosa, O. A versatile educational tool to detect adulterated honey with Arduino and Python-OpenCv. Revista Internacional de Investigación e Innovación Tecnológica 2024, 12, 67. [Google Scholar]
- Cave, A.; Roslyakov, S.; Iskander, M.; Bless, S. Design and performance of a laboratory pneumatic gun for soil ballistic applications. Exp. Tech. 2016, 40, 541–553. [Google Scholar] [CrossRef]
- Damci, E.; Sekerci, E. Development of a low-cost single-axis shake table based on arduino. Exp. Tech. 2019, 43, 179–198. [Google Scholar] [CrossRef]
- Fayyad, U.; Piatetsky-Shapiro, G.; Smyth, P. From data mining to knowledge discovery in databases. AI Mag. 1996, 17, 37–54. [Google Scholar] [CrossRef]
- Janosi, A.; Steinbrunn, W.; Pfisterer, M.; Detrano, R. UCI Machine Learning Repository Heart Disease Data Set; Technical Report; School of Information and Computer Sciences, University of California: Irvine, CA, USA, 1988; Available online: https://archive.ics.uci.edu/dataset/45/heart+disease (accessed on 24 November 2024).
- Hastie, T.; Tibshirani, R.; Friedman, J. The Elements of Statistical Learning Data Mining, Inference, and Prediction, 2nd ed.; Springer Series in Statistics; Springer: Berlin/Heidelberg, Germany, 2016. [Google Scholar] [CrossRef]
- Raschka, S.; Mirjalili, V. Python Machine Learning, 3rd ed.; Packt Publishing: Birmingham, UK, 2019. [Google Scholar]
- Hastie, T.; Tibshirani, R.; Friedman, J. The Elements of Statistical Learning Data Mining, Inference, and Prediction, 2nd ed.; Series in Statistics; Springer: Berlin/Heidelberg, Germany, 2001. [Google Scholar] [CrossRef]
- Raschk, S.; Mirjalili, V. Python Machine Learning, 2nd ed.; MARCOMBO: Barcelona, Spain, 2019. [Google Scholar]
- Ghosh, P.; Azam, Z.; Jonkman, M.; Karim, A. Efficient prediction of cardiovascular disease using machine learning algorithms with relief and lasso feature selection techniques. IEEE Access 2021, 9, 19304–19326. [Google Scholar] [CrossRef]
- Tabassum, S.; Zaman, U.; Ullah, M.; Rahaman, A.; Nahar, S.; Islam, A. The cardiac disease predictor: Iot and mL driven healthcare system. In Proceedings of the 2019 4th International Conference on Electrical Information and Communication Technology (EICT), Khulna, Bangladesh, 20–22 December 2019. [Google Scholar] [CrossRef]
- Kang, G.; Yang, B.; Wei, D.; Li, L. The application of machine learning algorithm applied to 3hs risk assessment. In Big Data–BigData 2018, Proceedings of the7th International Congress, Held as Part of the Services Conference Federation, SCF 2018, Seattle, WA, USA, 25–30 June 2018; Lecture Notes in Computer Science; Springer: Cham, Switzerland, 2018; Volume 10968. [Google Scholar] [CrossRef]
- Ambrish, G.; Ganesh, B.; Ganesh, A.; Srinivas, C.; Dhanraj; Mensinkal, K. Logistic regression technique for prediction of cardiovascular disease. Glob. Transit. Proc. 2022, 3, 127–130. [Google Scholar] [CrossRef]


Disclaimer/Publisher’s Note: The statements, opinions and data contained in all publications are solely those of the individual author(s) and contributor(s) and not of MDPI and/or the editor(s). MDPI and/or the editor(s) disclaim responsibility for any injury to people or property resulting from any ideas, methods, instructions or products referred to in the content. |
© 2025 by the authors. Licensee MDPI, Basel, Switzerland. This article is an open access article distributed under the terms and conditions of the Creative Commons Attribution (CC BY) license (https://creativecommons.org/licenses/by/4.0/).