Article

Image Deconvolution to Resolve Astronomical X-Ray Sources in Close Proximity: The NuSTAR Images of SXP 15.3 and SXP 305

by
Sayantan Bhattacharya
*,†,‡,
Dimitris M. Christodoulou
†,§ and
Silas G. T. Laycock
Lowell Center For Space Science and Technology, Lowell, MA 01854, USA
*
Author to whom correspondence should be addressed.
The authors contributed equally to this work.
Current address: Tata Institute of Fundamental Research, Mumbai 400005, India.
§
Current address: Department of Mathematical Sciences, DePaul University, Chicago, IL 60614, USA.
Algorithms 2025, 18(4), 191; https://doi.org/10.3390/a18040191
Submission received: 17 February 2025 / Revised: 24 March 2025 / Accepted: 25 March 2025 / Published: 27 March 2025
(This article belongs to the Special Issue Machine Learning Algorithms for Image Understanding and Analysis)

Abstract

:
The broad point spread function of the NuSTAR telescope makes resolving astronomical X-ray sources a challenging task, especially for off-axis observations. This limitation has affected the observations of the high-mass X-ray binary pulsars SXP 15.3 and SXP 305, in which pulsations are detected from nearly overlapping regions without spatially resolving these X-ray sources. To address this issue, we introduce a deconvolution algorithm designed to enhance NuSTAR’s spatial resolution for closely spaced X-ray sources. We apply this technique to archival data and simulations of synthetic point sources placed at varying separations and locations, testing the algorithm’s efficacy in source detection and differentiation. Our study confirms that on some occasions when SXP 305 is brighter, SXP 15.3 is also resolved, suggesting that some prior non-detections may have resulted from imaging limitations. This deconvolution technique represents a proof of concept test for analyzing crowded fields in the sky with closely spaced X-ray sources in future NuSTAR observations.

1. Introduction

1.1. Astronomical Point Sources and X-Ray Telescopes

Astronomical systems as observed by modern telescopes are divided into the following two types: point-like sources and extended sources. The former are unresolved and present images whose sizes and shapes are dictated purely by the combined point spread function (PSF) of the telescope optics and the detector; whereas extended sources and crowded fields (containing many closely spaced point sources) present images that represent the true brightness patterns in the sky convolved with the imaging PSF [1]. If a reliable estimate of the PSF can be made, then in principle, mathematical deconvolution can reduce the instrumental blurring and provide a sharper image.
Most observations from space-based X-ray telescopes are used to study distant galactic and extragalactic point sources. Examples of such point sources are X-ray binaries [2], novae [3], and active galactic nuclei [4], while extended sources are found in supernova remnants [5], galaxy clusters [6], star-forming regions [7], and galactic halos [8]. The goal is to always obtain more detailed images of the X-ray source, regardless of its nature. In extended sources, the finer the image, the more detailed the structure of the source. In the case of point sources, higher-resolution images can be crucial in distinguishing between two closely spaced sources (actually, their 2D projections in the sky).
Among presently operating X-ray observatories, Chandra [9] has the best spatial resolution, capable of distinguishing sources projected to 0.5″ apart; whereas NuSTAR [10] has a broader energy coverage (viz. 3–79 keV versus 0.5–8 keV for Chandra), but also (suffers from) a broader PSF (a half power diameter (HPD) of 58″). The NuSTAR PSF also deteriorates considerably for off-axis sources (observed far out from the image center). This can create a grave issue in distinguishing between point sources located within the full radius of the PSF when there are no simultaneous observations from either the Chandra or the XMM-Newton [11] telescope. Image deconvolution can then help resolve the problem to a certain extent. For instance, Sakai et al. [12] applied a Richardson–Lucy image deconvolution technique to a high-resolution Chandra image of the supernova remnant Cas A to bring out more detailed features in the low-flux regions. A non-iterative deconvolution technique has also been used on Suzaku-XIS [13] images, improving the resolution from a 110″ HPD to ∼ 20 [14].

1.2. Image Deconvolution

Image deconvolution is a mathematical technique used to improve the resolution or clarity of images by reversing the effects of blurring and distortion. These distortions arise from the instrument’s PSF, atmospheric effects, or other turbulence during observation. Deconvolution aims to reconstruct a more accurate version of the original image by using prior knowledge of the PSF and other known properties of the telescope. There are several methods for image deconvolution, each with specific advantages and limitations. Iterative methods, such as the Richardson–Lucy algorithm [15,16], apply successive approximations to recover the image, and they are particularly effective in dealing with noisy data. Fourier-based methods [17] work in the frequency domain to perform deconvolution efficiently, but they can be more sensitive to noise. Wavelet-based deconvolution [18] is often used for images with structures and edges, allowing for better edge detection and detail recovery. More recently, machine learning techniques [19] have become very common, using deep learning models trained on known PSFs and image pairs to achieve results that are comparable to or better than those from deconvolution methods (but these new techniques are heavily dependent on the availability of training data).
Applications of image deconvolution have appeared in diverse fields. In astronomy, deconvolution is used to sharpen images of distant stars, galaxies, and various other celestial objects captured by ground-based and space-based observatories. In medical imaging, deconvolution improves the quality of microscopy and radiology scans, aiding in more precise diagnoses. It is also widely used in remote sensing, surveillance, and increasingly in consumer photography to enhance image quality and detail.

1.3. High-Mass X-Ray Binary Pulsars

X-ray pulsars are rapidly spinning neutron stars (NSs) that emit X-rays modulated by their spin periods. These pulsars are found in NS X-ray binary (XRB) systems with high-mass or low-mass companion stars from which the NS accretes material. The material falls onto the star’s magnetic poles, forming bright spots (‘hotspots’) that emit X-ray photons. As the NS rotates, the X-ray beams sweep across space, appearing as regular pulses to any observer. The pulse period tells us how fast the neutron star is spinning, and changes in this period over time reveal details about the interaction of the NS with its companion star [20,21].
High-mass X-ray binaries (HMXBs) are systems in which the NS companion is a massive (> 8 M ) hot star, usually of spectral type O or B. A special type of HMXB is the subset of Be X-ray binaries in which the companion is a Be star. Be stars are a class of B-type stars that show Hydrogen emission lines (e.g., Hα) in their optical spectra (hence, the ‘e’ in the class name). They form large decretion disks around them due to material shed from their rapidly rotating surfaces enhanced by processes thought to be related to stellar pulsations [22,23]. This disk, composed of partly ionized gas, is held together by centripetal, gravitational, and pressure forces, coupled by turbulent viscosity, and extends outward in the star’s equatorial plane. The disk is rich in hydrogen, which produces the characteristic H-alpha emission line, which is a key diagnostic feature for identifying and studying Be stars. The H-alpha emission varies with the size and density of the disk, often linked to the star’s activity level. The decretion disk is also responsible for excess infrared emission due to free-free and bound-free radiation, helping astronomers trace the disk’s size, structure, and evolution. This disk is not static; it can grow, shrink, or even become disrupted, depending on interactions with the binary companion. Decretion disks are crucial in driving the observed X-ray behavior in Be-XRBs. When the NS passes through or interacts with the disk material, then the process of accretion occurs leading to powerful X-ray outbursts [24]. These interactions are especially significant near the periastron of the binary orbit, resulting in regular Type I outbursts or more intense longer, irregular Type II outbursts when the disk extends significantly.

1.4. The Magellanic Pulsars SXP 15.3 and SXP 305

The Small Magellanic Cloud (SMC) is a nearby dwarf galaxy that is home to more than 100 HMXBs [25], about 70 of which are X-ray pulsars, and all but one are Be-XRBs [21]. The low metallicity of the SMC makes it a great environment for forming massive stars and studying their life cycles [26]. With a plethora of known HMXBs, the SMC offers unique opportunities to understand how these systems evolve. Be X-ray binaries in the SMC are particularly interesting because the distance (∼62 kpc [27]) and properties of the galaxy are well-known, allowing precise measurements of their properties.
In this work, we address the difficult problem of resolving point sources in NuSTAR X-ray images, especially when there is no other major distinguishable spectral or timing feature, and the observer has to rely entirely on the imaging capability of the telescope. The particular case that we explore concerns the closely spaced pair of SXP 15.3 and SXP 305 [28,29]. These two pulsars have widely different spin periods, and their X-ray outbursts allow us to study the extreme conditions that develop near their accreting NSs.
SXP 15.3 [30,31,32] and SXP 305 [29] are both Be-HMXB pulsars [21,26], and they are separated by only 7″ in the sky (see Figure 1 of Monageng et al. [29]). Lazzarini et al. [28] determined the pulse period of SXP 305 for the first time using a NuSTAR observation (also used in this work), but the NuSTAR image did not resolve the pair as the projected separation of the two sources is much smaller than the NuSTAR HPD of 58″. The study of systems like SXP 15.3 and SXP 305 shows how important yet challenging it can be to distinguish closely residing X-ray sources. However, monitoring, detecting, and understanding these systems is crucial for gaining a broader understanding of how neutron stars interact with their companion stars, and to keep track of how they evolve.

1.5. Outline

The structure of this paper is as follows:
In Section 2, we provide the details of the deconvolution technique that we use, and the NuSTAR data analysis used to obtain clean sky images.
In Section 3, the results from the simulated images and the real image of the pair of X-ray sources SXP 15.3/305 are presented.
In Section 4, the implications of the results are discussed in some detail.
In Section 5, the conclusions from this investigation are summarized.

2. Methodology

2.1. General Framework for Image Deconvolution

Image deconvolution is a computational technique used to reconstruct the ‘true’ image I true ( x , y ) that has been blurred by the instrument’s PSF and the superimposed noise. The observed image I obs ( x , y ) is expressed as follows:
I obs ( x , y ) = I true ( x , y ) P S F ( x , y ) + N ( x , y ) ,
where ∗ denotes convolution, and N ( x , y ) represents the noise at each image point ( x , y ) . The goal of deconvolution is to estimate I true ( x , y ) by reversing the effects of the PSF while accounting for noise.
Deconvolution is an ill-posed problem because the noise in the observed image can be amplified during the reduction process. To address this issue, regularization techniques, and additional constraints are applied. Common deconvolution approaches include the following:
  • Direct methods: These include Fourier-based deconvolution and Wiener filtering, which are computationally efficient but very sensitive to the noise content.
  • Iterative methods: Methods such as the Richardson–Lucy algorithm refine the estimate during successive iterations and are very effective against Poisson noise.
  • Bayesian methods: These incorporate prior knowledge about the image, such as smoothness or sparsity, to guide the cleaning algorithm.
  • Machine learning approaches: Neural networks trained on simulated data can directly predict the ‘true’ image from the observed outcome [19].
The general update rule for iterative deconvolution is written as follows:
I true ( k + 1 ) ( x , y ) = I true ( k ) ( x , y ) + λ · R ( I true ( k ) , I obs , P S F ) ,
where I true ( k ) ( x , y ) is the estimate after k iterations, λ is a step size, and R ( ) is a residual term based on the convolution mismatch. Iterations continue for as long as the residual is minimized and an adopted convergence criterion is met.

2.1.1. The Richardson–Lucy Algorithm: Motivation

In this work, we use the Richardson–Lucy (RL) algorithm, the details of which are described in Section 2.1.2 below. The RL algorithm is one of the most widely used methods in image deconvolution, especially in astronomical observations because of its ability to enhance image resolution all the while preserving the observed total intensity. The procedure is particularly effective in restoring images blurred by the telescope’s PSF, making it useful for disentangling closely spaced point sources and enhancing faint structures in extended sources [14].
One of the key advantages of RL deconvolution is that it is well-suited for Poisson noise, which is quite common in low photon-count observations, such as those carried out by X-ray and optical telescopes [33]. Furthermore, the iterative nature of the algorithm allows for gradual refinement of the image, but the technique requires careful tuning of the number of iterations to avoid noise amplification noise or introducing numerical artifacts.
While RL deconvolution is computationally efficient and does not assume a specific noise model beyond standard Poisson statistics, it can struggle in cases of extremely low signal-to-noise (S/N) ratios where the noise dominates over the deconvolution process. Despite these limitations, the ability of the RL algorithm to recover spatial details in low photon-count observations makes it a valuable tool for analyzing astronomical images.

2.1.2. The Richardson–Lucy Algorithm: Procedure

The Richardson–Lucy (RL) algorithm [15,16] is an iterative deconvolution technique optimized for low-flux data, such as many X-ray observations of SMC sources. It is based on maximum likelihood estimation under Poisson statistics. The algorithm iteratively updates the image intensity I true by the following equation:
I true ( k + 1 ) ( x , y ) = I true ( k ) ( x , y ) · I obs ( x , y ) P S F T ( x , y ) I true ( k ) ( x , y ) P S F ( x , y ) ,
where P S F T ( x , y ) is the transpose of the P S F matrix. The numerator represents the cross-correlation of the observed image with the P S F T matrix, while the denominator represents the deblurred estimate of the true image.
The execution steps for the RL algorithm are as follows:
  • Initialization: Start with an initial guess for the true image, typically a uniform image or a given I obs ( x , y ) .
  • Update rule: Correct the estimate iteratively based on the ratio of observed data to the simulated blurred estimate.
  • Stopping criterion: Stop the iteration when the changes in I true ( x , y ) are negligible or when the residual error is sufficiently small.
The RL algorithm assumes an accurately known PSF and works quite well in images with superimposed Poisson noise. Various extensions of this algorithm can also handle spatially varying PSFs. This work uses the Python ‘scikit’ image restoration package called skimage.restoration.richardson_lucy [34] (version 0.24.0, downloaded from the URL https://scikit-image.org/, accessed on 26 October 2024).

2.2. NuSTAR Data Analysis

NuSTAR (Harrison et al. [10]) is the first orbiting telescope capable of focusing very high-energy X-rays. It was launched on 13 June 2012 and operates in the 3–79 keV energy range, surpassing the  10 keV limit of earlier focusing X-ray telescopes. NuSTAR comprises two co-aligned hard X-ray grazing incidence telescopes (Wolter I design) that focus X-rays onto two separate solid-state focal-plane detectors with a focal length of approximately 10 m. The two focal-plane modules (FPMA and FPMB) are designed to be identical, enabling their combined data to enhance the signal.
The archival data from both FPMA and FPMB modules were processed using the NuSTAR Data Analysis Software (NuSTARDAS v2.1.4) with calibration files from CALDB (v20240325). This software is included in the HEASoft (v6.34) package distributed by the High Energy Astrophysics Science Archive Research Center (HEASARC). The nupipeline command was employed to convert level-1 event files into level-2 event files, applying standard data-cleaning procedures. High-level products, including barycenter-corrected source event files, skymap images, light curves, and spectra, were generated using the nuproducts command. For this study, skymap images, created in the broad energy band of 3–79 keV, were utilized.

2.3. NuSTAR PSF

The PSF of NuSTAR describes how the telescope and detector system respond to point X-ray sources, effectively characterizing the blurring introduced by the instrument’s optical components. It is effectively determined by its focusing optics, which consist of multilayer-coated, grazing-incidence mirrors designed to reflect high-energy X-rays. The on-axis PSF has a full width at half maximum of approximately 18″ and an HPD of about 58″ [10]. This relatively broad PSF stops NuSTAR from achieving high spatial resolution in the hard X-ray band (3–79 keV).
However, the PSF varies with off-axis angle due to optical aberrations inherent in the telescope’s design (Figure 1). As sources appear offset from the optical axis (the image center), the PSF broadens and becomes more asymmetric, resulting in decreased spatial resolution and increased overlap between nearby sources. Additionally, the PSF exhibits a slight energy dependence because of reflectivity variations in the multilayer mirror coatings. Accurately modeling the NuSTAR PSF—including its dependence on energy and off-axis angle—is crucial for image deconvolution techniques aiming to resolve sources in close proximity, such as SXP 15.3 and SXP 305 [28,29]. In this study, we utilized the calibrated PSF models stored in CALDB and accounted for the specific offsets and energy ranges that pertain to the particular FPMA and FPMB data sets.

3. Results

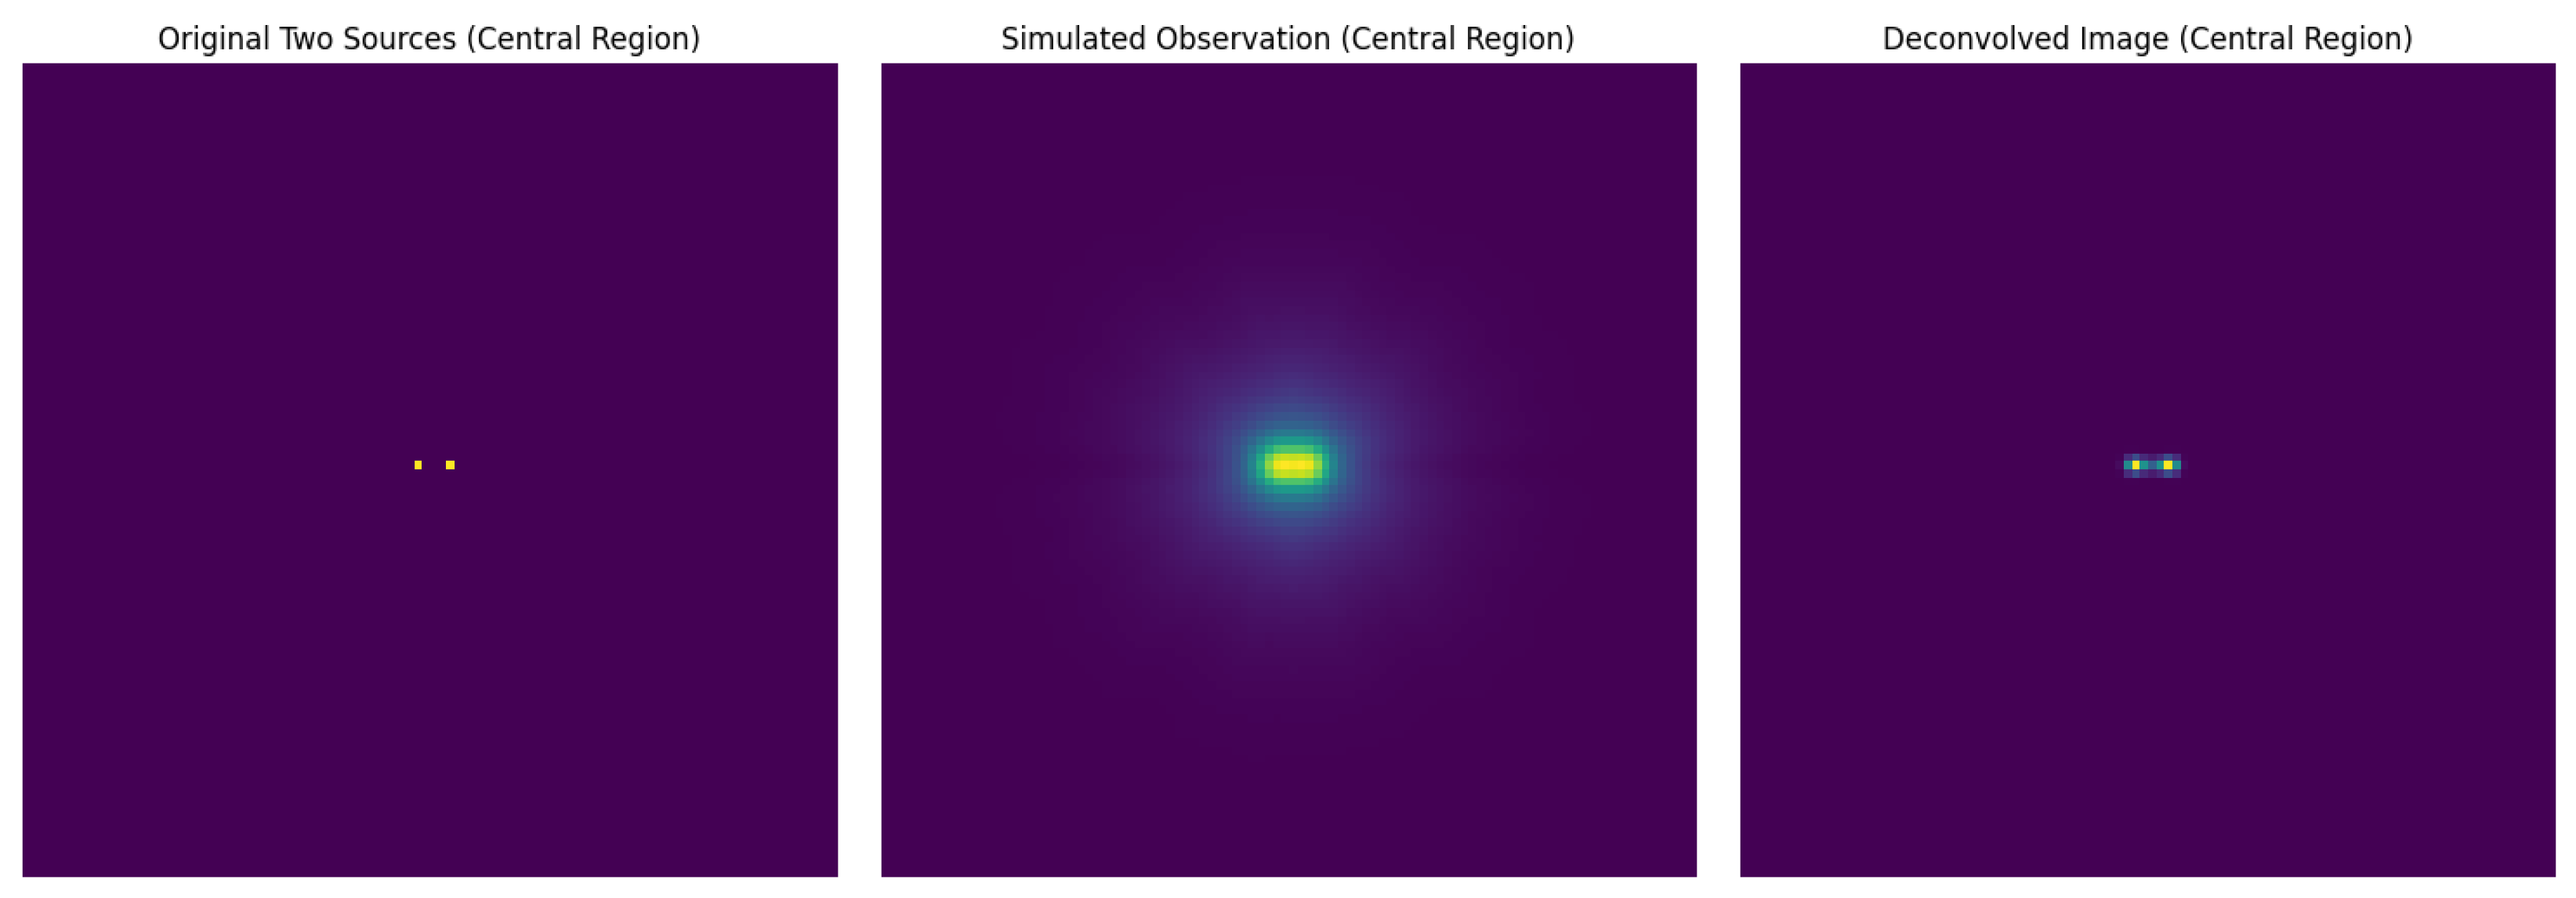
3.1. Deconvolution of Simulated NuSTAR Images

The NuSTAR PSF was used to simulate two nearby point sources. The sources were placed at various distances and the deconvolution algorithm was tested for efficiency. An example is shown in Figure 2, where a 4′ offset PSF was used for both sources separated by 10″. Offset ranges from 0 to 7′ have been tested with separations starting from 30″ to 6″, decreasing in steps of 2″.
We have also tested various numbers of iterations starting with 50 and ending with 200 cycles; above 200 iterations, the noise increases considerably, and visible artifacts are introduced in the deconvolved images. The experiments demonstrated that two sources placed at a separation of 10 are clearly resolved in the final image when the NuSTAR PSF is implemented in the code.

3.2. Deconvolution of the SXP 15.3–SXP 305 Pair

Figure 3 demonstrates that deconvolution of the SXP 15.3/305 image enhances the visibility of fine structures, particularly in the region around the sources. The cropped image isolates the target and reduces background noise during computations. Then, image rotation helps to align the raw cropped image with the adopted input PSF image. After rotation, the alignment of features remains consistent, preserving the various morphological details. Finally, the RL iteration procedure sharpens the image and reveals details that were previously blurred due to the instrument’s PSF.
In the resulting image (right panel in Figure 3), the maximum X-ray luminosities are not the same in the two flux-enhanced regions marked by boxes. This is never the case in NuSTAR observations of single sources, so this feature signifies the presence of two X-ray emitters in the cleaned image. However, the sources are not entirely resolved owing to their small separation of about 7 , for which the performance of the RL algorithm begins to degrade somewhat (simulations show strong performance for separations of ≥ 10 ). Nevertheless, we believe the brighter region corresponds to SXP 305 in outburst, during which pulsations of 305 s were measured. Before this observation, only 15.3 s pulsations were detected from this region when SXP 15.3 was active and SXP 305 was presumably in quiescence.
A comparison between the original, rotated, and deconvolved images of Figure 3 shows the effectiveness of the RL method in improving spatial resolution. The deconvolved image (right panel) can subsequently be processed using other source detection algorithms (e.g., Gaussian fitting of the signal) to pinpoint the precise positions of the two sources that were unresolved in previous observations [28,29].

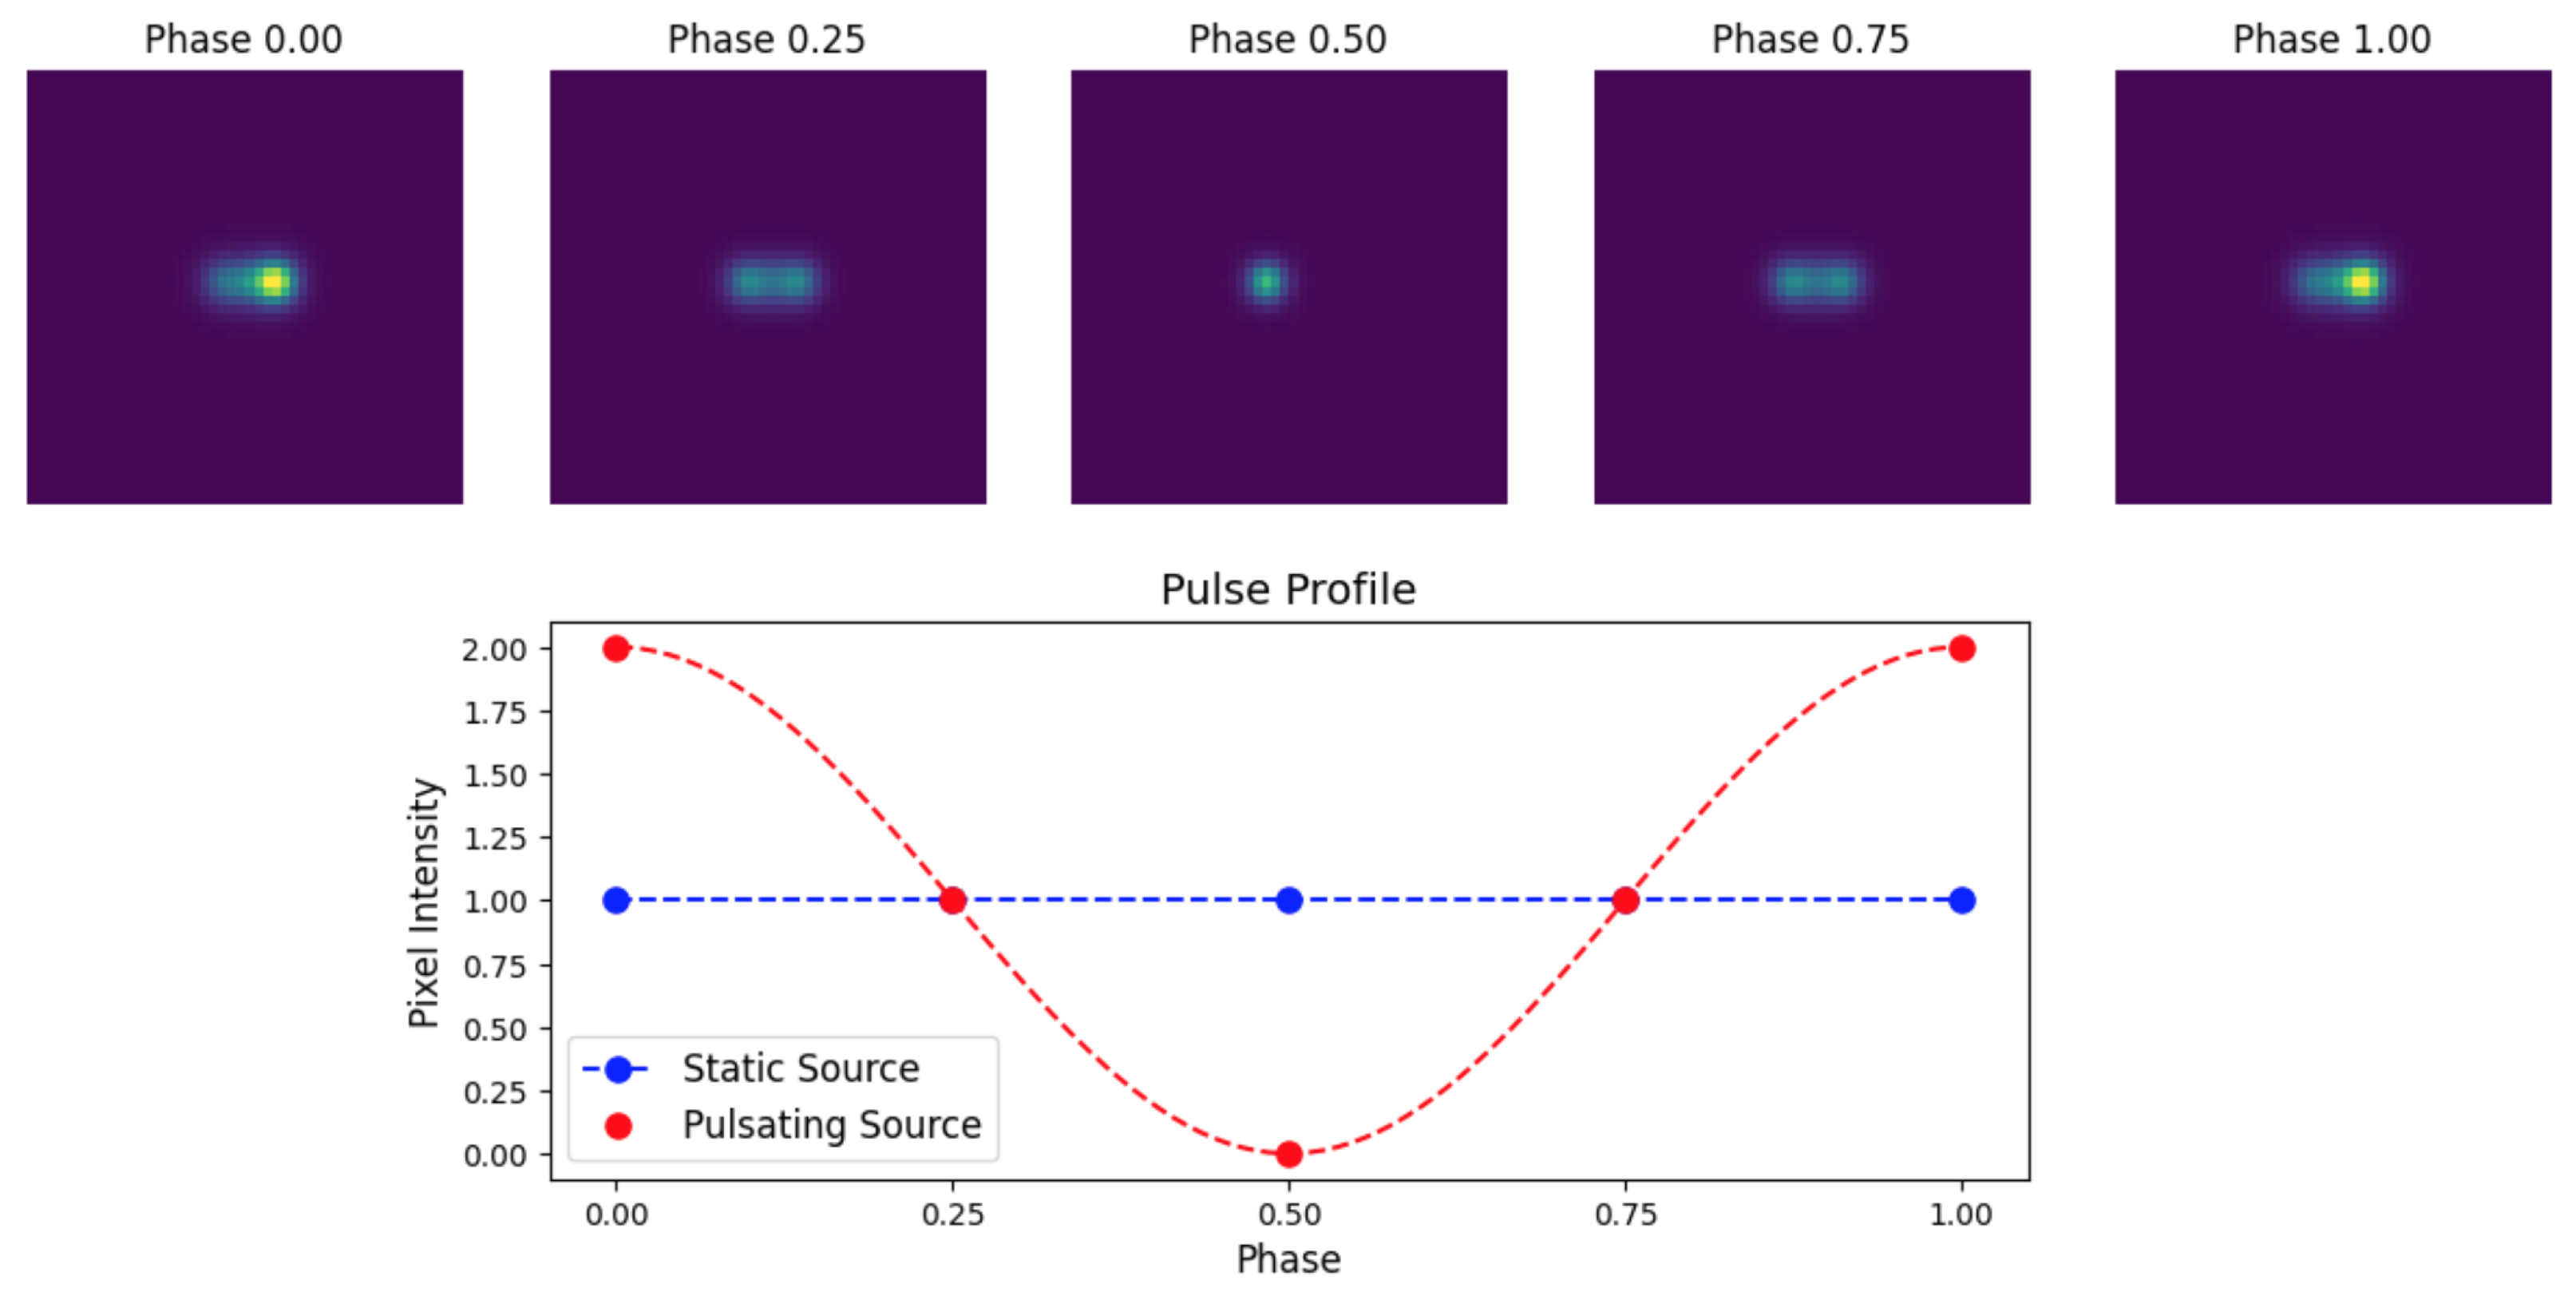
3.3. Pulse Phase-Resolved Deconvolution

In order to determine if the 305 s pulsation detected in the observation can also be identified in the deconvolved images, we created additional pulse phase-resolved images. This is done by stacking up events in each quarter of the phase (i.e., in intervals of 76.25 s) of the total spin period, and then by producing individual images from each phase-specific event file. Unfortunately, the individual images did not have enough photon counts (SNR), and the deconvolutions resulted in artifacts and increased noise. Applying this phase-driven technique to real X-ray images will require either brighter sources in close proximity or much longer exposure times in order to collect more photons during the observations.
As an addendum, we demonstrate how this technique works using simulated sources for which we again use the NuSTAR calibrated PSF. For each phase bin, a synthetic image was constructed by simulating two point sources at a separation of 10 —one pulsating and one static source. The phase bins are associated with the spin of the pulsating source. The pulsating source exhibited sinusoidal intensity variations with a peak-to-peak amplitude of 2.0, while the static source remained at a fixed intensity of 1.0. The maximum intensity of the pulse occurs at phase 0.0 (and phase 1.0), and the minimum intensity occurs at phase 0.5 (see the pulse profile at the bottom of Figure 4).
The simulated images were first convolved with the NuSTAR PSF to generate phase-resolved ‘observed’ images, which were then deconvolved using the RL algorithm. The results from the simulation are shown in Figure 4. We see that the source on the right shows the variation of intensity as expected from the plotted pulse profile, and the source on the left remains at a fixed intensity in all images. Furthermore, the pulsating source is not discernible at the phase of 0.5 (where its intensity drops to zero).

4. Discussion

We have demonstrated that by utilizing advanced image deconvolution techniques, specifically the RL algorithm tailored to the NuSTAR PSF, we can significantly enhance the spatial resolution of NuSTAR X-ray images. By choosing the correct model of the telescope’s PSF and incorporating it into the deconvolution procedure, it is possible to resolve closely spaced X-ray sources that are indistinguishable from standard imaging techniques. Our application of the RL iterative method to the case of the HMXB pulsars SXP 15.3 and SXP 305 (right panel in Figure 3) illustrates this approach.
Observations of these nearly overlapping sources with NuSTAR have been challenged by the instrument’s broad and off-axis-dependent PSF, leading to blended images in which pulsations from one or the other source are detected at different epochs without the two sources ever being spatially resolved. By employing a refined PSF model accounting for energy dependence and off-axis variations inherent in the telescope’s optics, we increased the effectiveness of the RL deconvolution algorithm.
The ability to resolve such X-ray sources has significant implications for astrophysical research. For HMXBs like SXP 15.3 and SXP 305, accurately determining their individual fluxes, spectral properties, and temporal behaviors is essential for understanding their accretion processes, magnetic fields, and evolutionary states [29]. In crowded pulsar fields (as in the SMC), where multiple X-ray sources may be located in close angular proximity, enhanced resolution facilitates a more precise characterization of the source population and their individual contributions to the X-ray luminosity of the entire region.
We also demonstrated the technique of phase-resolved RL deconvolution in simulated images of a pulsating and a non-pulsating source in close proximity ( 10 ). This technique failed to yield clean images of the SXP 15.3/305 pair when the data were divided and stacked in four phase bins. The division resulted in decreased photon counts in each bin, and the S/N ratio also decreased sufficiently for spurious artifacts to appear due to the enhanced noise. Nevertheless, the proof of concept offered by the simulated data (Figure 4) demonstrates that in cases where the pulse period is known, phase-resolved deconvolution can detect the variations in the brightness of nearly overlapping sources in the sky. It is also important to note that the same technique can be extended to energy-resolved deconvolution in spectroscopic observations of high S/N ratio, which will enable different emission components (and mechanisms) to be spatially and temporally disentangled.
Furthermore, the improved detection capabilities enabled by refined PSF modeling and deconvolution can also support studies of transient phenomena. Detecting outbursts, pulsations, or other temporal variations from faint sources requires not only temporal resolution but also the ability to spatially isolate the sources in order to avoid contamination from nearby objects. By enhancing the spatial resolution, we improve the S/N ratio for individual sources, enabling the possibility of more sensitive timing analyses.
Despite the advancements in this field of research, certain challenges and limitations remain: (a) The RL deconvolution procedure is sensitive to inaccuracies in the adopted PSF model; any mismatch between the modeled PSF and the actual instrumental response can introduce artifacts or spurious features in the cleaned image. This necessitates ongoing efforts to validate and update the existing PSF models using observations of bright isolated point sources across the entire detector area. (b) Noise amplification is an inherent risk in deconvolution algorithms, particularly in low-flux scenarios typical of faint (galactic and extragalactic) X-ray sources. Regularization techniques and careful selection of iteration parameters are required to mitigate this effect.

5. Conclusions

Our study reveals the significant impact that PSF modeling and RL deconvolution can have on the analysis of NuSTAR observations of X-ray point sources by enhancing the spatial resolution and enabling the detection of multiple sources in close proximity (≳10″). In a case study of pulsars SXP 15.3 and SXP 305, we tested these tools in an investigation of a faint crowded X-ray field in the sky. This approach, not only improves our understanding of specific astrophysical objects but also contributes to the broader capability of X-ray astronomy to explore the very high-energy universe with greater precision and clarity.
Future work should explore the integration of spatially varying PSFs directly into deconvolution algorithms, allowing for the continuous and seamless incorporation of off-axis signal variations. Bayesian deconvolution and machine learning approaches may offer alternative ways to handle complex PSF attributes and noise characteristics. Furthermore, applying this methodology to a broader set of observations carried out at different wavelengths and targeting more densely populated fields can help assess the effectiveness of the procedure and identify telescope-specific requirements.

Author Contributions

Conceptualization, project administration, resources, and supervision, S.G.T.L.; investigation, methodology formal analysis, and software, S.B., D.M.C. and S.G.T.L.; writing—original draft, S.B.; writing—review and editing, S.B., D.M.C. and S.G.T.L. All authors have read and agreed to the published version of the manuscript.

Funding

NSF-AAG, grant 2109004; NASA Astrophysics Data Analysis Program (ADAP), grant nos. NNX14AF77G and 80NSSC18K0430.

Data Availability Statement

The raw NuSTAR data are publicly available at the HEASoft archive, URL: https://heasarc.gsfc.nasa.gov/docs/nustar/analysis/ (accessed on 26 October 2024). The reduced images will be provided by the corresponding author upon request.

Acknowledgments

This research project was facilitated in part by the following funding agencies and programs: NSF-AAG, grant 2109004; NASA Astrophysics Data Analysis Program (ADAP), grant nos. NNX14AF77G and 80NSSC18K0430; and the Lowell Center for Space Science and Technology (LoCSST) of the University of Massachusetts Lowell.

Conflicts of Interest

The authors declare no conflicts of interest.

Abbreviations

The following acronyms are used in this manuscript:
CALDBcalibration database
DOAJDirectory of Open Access Journals
FPMAfocal plane module A
FPMBfocal plane module B
HEASARCHigh Energy Astrophysics Science Archive Research Center
HEASoftHigh Energy Astrophysics Software
HMXBhigh-mass X-ray binary
HPDhalf-power diameter
LDlinear dichroism
NSneutron star
NuSTARNuclear Spectroscopic Telescope Array
NuSTARDASNuSTAR data analysis software
PSFpoint spread function
RLRichardson–Lucy
SMCSmall Magellanic Cloud
S/Nsignal-to-noise
SXPSMC X-ray pulsar
TLAthree-letter acronym
XISX-ray imaging spectrometer
XMMX-ray multi-mirror mission
XRBX-ray binary pulsar

References

  1. Starck, J.L.; Murtagh, F. Astronomical Image and Data Analysis; Springer: Berlin/Heidelberg, Germany, 2007. [Google Scholar]
  2. Lewin, W.H.; van den Heuvel, E.P.; van Paradijs, J. X-Ray Binaries; Cambridge University Press: Cambridge, UK, 1997; Volume 26. [Google Scholar]
  3. Tanaka, Y.; Shibazaki, N. X-ray Novae. Annu. Rev. Astron. Astrophys. 1996, 34, 607–644. [Google Scholar]
  4. Padovani, P.; Alexander, D.; Assef, R.; De Marco, B.; Giommi, P.; Hickox, R.; Richards, G.; Smolčić, V.; Hatziminaoglou, E.; Mainieri, V.; et al. Active galactic nuclei: What’s in a name? Astron. Astrophys. Rev. 2017, 25, 2. [Google Scholar]
  5. Reynolds, S.P. Supernova remnants at high energy. Annu. Rev. Astron. Astrophys. 2008, 46, 89–126. [Google Scholar]
  6. Sarazin, C.L. X-ray emission from clusters of galaxies. Rev. Mod. Phys. 1986, 58, 1. [Google Scholar]
  7. Cohen, J.G. Star formation and X-ray emission in distant star-forming galaxies. Astrophys. J. 2003, 598, 288. [Google Scholar]
  8. Putman, M.; Peek, J.; Joung, M. Gaseous galaxy halos. Annu. Rev. Astron. Astrophys. 2012, 50, 491–529. [Google Scholar]
  9. Weisskopf, M.; Brinkman, B.; Canizares, C.; Garmire, G.; Murray, S.; Van Speybroeck, L. An overview of the performance and scientific results from the Chandra X-Ray Observatory. Publ. Astron. Soc. Pac. 2002, 114, 1. [Google Scholar]
  10. Harrison, F.A.; Craig, W.W.; Christensen, F.E.; Hailey, C.J.; Zhang, W.W.; Boggs, S.E.; Stern, D.; Cook, W.R.; Forster, K.; Giommi, P.; et al. The nuclear spectroscopic telescope array (NuSTAR) high-energy X-ray mission. Astrophys. J. 2013, 770, 103. [Google Scholar]
  11. Jansen, F.; Lumb, D.; Altieri, B.; Clavel, J.; Ehle, M.; Erd, C.; Gabriel, C.; Guainazzi, M.; Gondoin, P.; Much, R.; et al. XMM-Newton observatory-I. The spacecraft and operations. Astron. Astrophys. 2001, 365, L1–L6. [Google Scholar]
  12. Sakai, Y.; Yamada, S.; Sato, T.; Hayakawa, R.; Higurashi, R.; Kominato, N. Richardson–Lucy Deconvolution with a Spatially Variant Point-spread Function of Chandra: Supernova Remnant Cassiopeia A as an Example. Astrophys. J. 2023, 951, 59. [Google Scholar]
  13. Koyama, K.; Tsunemi, H.; Dotani, T.; Bautz, M.W.; Hayashida, K.; Tsuru, T.G.; Matsumoto, H.; Ogawara, Y.; Ricker, G.R.; Doty, J.; et al. X-ray imaging spectrometer (XIS) on board Suzaku. Publ. Astron. Soc. Jpn. 2007, 59, S23–S33. [Google Scholar] [CrossRef]
  14. Sugizaki, M.; Kamae, T.; Maeda, Y. Deconvolution of Images Taken with the Suzaku X-Ray Imaging Spectrometer. Publ. Astron. Soc. Jpn. 2009, 61, S55–S67. [Google Scholar] [CrossRef]
  15. Richardson, W.H. Bayesian-based iterative method of image restoration. J. Opt. Soc. Am. 1972, 62, 55–59. [Google Scholar] [CrossRef]
  16. Lucy, L.B. An iterative technique for the rectification of observed distributions. Astron. J. 1974, 79, 745. [Google Scholar] [CrossRef]
  17. Bonettini, S.; Cornelio, A.; Prato, M. A new semiblind deconvolution approach for Fourier-based image restoration: An application in astronomy. SIAM J. Imaging Sci. 2013, 6, 1736–1757. [Google Scholar] [CrossRef]
  18. Mertens, F.; Lobanov, A. Wavelet-based decomposition and analysis of structural patterns in astronomical images. Astron. Astrophys. 2015, 574, A67. [Google Scholar] [CrossRef]
  19. Akhaury, U.; Starck, J.L.; Jablonka, P.; Courbin, F.; Michalewicz, K. Deep learning-based galaxy image deconvolution. Front. Astron. Space Sci. 2022, 9, 1001043. [Google Scholar]
  20. Caballero, I.; Wilms, J. X-ray pulsars: A review. arXiv 2012, arXiv:1206.3124. [Google Scholar]
  21. Coe, M.; Kirk, J. Catalogue of Be/X-ray binary systems in the Small Magellanic Cloud: X-ray, optical and IR properties. Mon. Not. R. Astron. Soc. 2015, 452, 969–977. [Google Scholar] [CrossRef]
  22. Reig, P. Be/X-ray binaries. Astrophys. Space Sci. 2011, 332, 1–29. [Google Scholar] [CrossRef]
  23. Kretschmar, P.; Fürst, F.; Sidoli, L.; Bozzo, E.; Alfonso-Garzón, J.; Bodaghee, A.; Chaty, S.; Chernyakova, M.; Ferrigno, C.; Manousakis, A.; et al. Advances in understanding high-mass X-ray binaries with INTEGRALand future directions. New Astron. Rev. 2019, 86, 101546. [Google Scholar]
  24. Okazaki, A.; Negueruela, I. A natural explanation for periodic X-ray outbursts in Be/X-ray binaries. Astron. Astrophys. 2001, 377, 161–174. [Google Scholar]
  25. Haberl, F.; Sturm, R. High-mass X-ray binaries in the Small Magellanic Cloud. Astron. Astrophys. 2016, 586, A81. [Google Scholar]
  26. Antoniou, V.; Zezas, A.; Hatzidimitriou, D.; Kalogera, V. Star formation history and X-ray binary populations: The case of the Small Magellanic Cloud. Astrophys. J. Lett. 2010, 716, L140. [Google Scholar]
  27. Scowcroft, V.; Freedman, W.L.; Madore, B.F.; Monson, A.; Persson, S.E.; Rich, J.; Seibert, M.; Rigby, J.R. The Carnegie Hubble Program: The distance and structure of the SMC as revealed by mid-infrared observations of Cepheids. Astrophys. J. 2016, 816, 49. [Google Scholar]
  28. Lazzarini, M.; Williams, B.; Hornschemeier, A.; Antoniou, V.; Vasilopoulos, G.; Haberl, F.; Vulic, N.; Yukita, M.; Zezas, A.; Bodaghee, A.; et al. Neutron stars and black holes in the small magellanic cloud: The SMC NuSTAR legacy survey. Astrophys. J. 2019, 884, 2. [Google Scholar]
  29. Monageng, I.M.; Coe, M.J.; Townsend, L.J.; Laycock, S.G.; Kennea, J.A.; Roy, A.; Udalski, A.; Bhattacharya, S.; Christodoulou, D.M.; Buckley, D.A.; et al. Disentangling the neighbouring pulsars SXP 15.3 and SXP 305. Mon. Not. R. Astron. Soc. 2022, 511, 6075–6086. [Google Scholar]
  30. Galache, J.; Corbet, R.; Coe, M.; Laycock, S.; Schurch, M.; Markwardt, C.; Marshall, F.; Lochner, J. A long look at the be/x-ray binaries of the small magellanic cloud. Astrophys. J. Suppl. Ser. 2008, 177, 189. [Google Scholar]
  31. Christodoulou, D.M.; Laycock, S.G.; Yang, J.; Fingerman, S. Determination of the magnetic fields of Magellanic X-ray pulsars. Res. Astron. Astrophys. 2017, 17, 059. [Google Scholar]
  32. Maitra, C.; Paul, B.; Haberl, F.; Vasilopoulos, G. Detection of a cyclotron line in SXP 15.3 during its 2017 outburst. Mon. Not. R. Astron. Soc. Lett. 2018, 480, L136–L140. [Google Scholar]
  33. Vio, R.; Bardsley, J.; Wamsteker, W. Least-squares methods with Poissonian noise: Analysis and comparison with the Richardson-Lucy algorithm. Astron. Astrophys. 2005, 436, 741–755. [Google Scholar]
  34. Van der Walt, S.; Schönberger, J.L.; Nunez-Iglesias, J.; Boulogne, F.; Warner, J.D.; Yager, N.; Gouillart, E.; Yu, T. scikit-image: Image processing in Python. PeerJ 2014, 2, e453. [Google Scholar] [PubMed]
Figure 1. Central 100 × 100-pixel regions of the NuSTAR PSF at different off-axis angles ranging from 0′ to 7′. Each panel represents the PSF corresponding to a specific off-axis angle, highlighting the variation in spatial distribution due to the telescope’s optics. The color scale indicates relative intensity, and the images are shown in a logarithmic scale for a better view of the PSF structure.
Algorithms 18 00191 g001
Figure 2. Deconvolution of simulated closely spaced sources demonstrating that the RL algorithm can enhance source detection in NuSTAR images.
Algorithms 18 00191 g002
Figure 3. Deconvolution of the original NuSTAR image. (Left) Observed image of the sky field containing three sources, with our target circled. (Center) The SXP 15.3/305 region is cropped and centered by rotation. (Right) Final deconvolved image using the off-axis PSF; the brighter source is likely SXP 305 since only 305 s pulsations were measured in this observation [28].
Algorithms 18 00191 g003
Figure 4. Pulse phase-resolved deconvolution of simulated images. The pulse phase is associated with the spin period of the pulsating source (right). (Top) Deconvolved images of the two sources at different phases of the pulsating (right) source. The left point source remains at a fixed intensity irrespective of the spin phases. (Bottom) Pulse profile showing the variation of intensity with spin phase for both the static (blue) and the pulsating (red) source (see Section 3.3 for details).
Algorithms 18 00191 g004
Disclaimer/Publisher’s Note: The statements, opinions and data contained in all publications are solely those of the individual author(s) and contributor(s) and not of MDPI and/or the editor(s). MDPI and/or the editor(s) disclaim responsibility for any injury to people or property resulting from any ideas, methods, instructions or products referred to in the content.

