Abstract
Dimensionality reduction is essential in machine learning, reducing dataset dimensions while enhancing classification performance. Feature Selection, a key subset of dimensionality reduction, identifies the most relevant features. Genetic Algorithms (GA) are widely used for feature selection due to their robust exploration and efficient convergence. However, GAs often suffer from premature convergence, getting stuck in local optima. Quantum Genetic Algorithm (QGA) address this limitation by introducing quantum representations to enhance the search process. To further improve QGA performance, we propose an Adaptive Feature-Based Quantum Genetic Algorithm (FbQGA), which strengthens exploration and exploitation through quantum representation and adaptive quantum rotation. The rotation angle dynamically adjusts based on feature significance, optimizing feature selection. FbQGA is applied to outlier detection tasks and benchmarked against basic GA and QGA variants on five high-dimensional, imbalanced datasets. Performance is evaluated using metrics like classification accuracy, F1 score, precision, recall, selected feature count, and computational cost. Results consistently show FbQGA outperforming other methods, with significant improvements in feature selection efficiency and computational cost. These findings highlight FbQGA’s potential as an advanced tool for feature selection in complex datasets.
1. Introduction
The rise of AI and IoT have revolutionized data analysis, leading to the generation of vast amounts of high-dimensional data across various domains such as business, healthcare, social media, transportation, online education, government, marketing, and finance. However, extracting meaningful insights from this data poses significant challenges for machine learning and data mining models. Traditional data analytics methods often struggle to handle large-scale, high-dimensional datasets, limiting their ability to uncover hidden patterns or knowledge [1]. These datasets frequently include redundant, irrelevant, or noisy features, which increase memory requirements, prolong processing times, and negatively impact performance, ultimately raising processing costs.
Dimensionality reduction has become a vital preprocessing technique to address these issues [2]. Its goal is to convert high-dimensional data into a lower-dimensional space while preserving essential information. Two main approaches to dimensionality reduction are Feature Extraction (FE) and Feature Selection (FS). Features refer to measurable characteristics of the data being analyzed. FE techniques create a new feature space by combining existing features, whereas FS identifies a subset of the original features by removing unnecessary or irrelevant ones based on specific evaluation criteria [3]. While both methods reduce dimensionality, FS is often preferred in domains like text mining and genetic analysis because it retains the interpretability and meaning of the original features. FS methods can be categorized into filter, wrapper, and embedded approaches [4]. Among these, wrapper methods generally provide better accuracy than filter methods, although they require more computational resources [5]. Embedded methods, which integrate feature selection into the training phase of machine learning models, are considered a specialized type of wrapper method [6].
Bio-inspired Optimization Algorithms (BIA) offer innovative solutions inspired by biological evolution and natural behaviors, such as those observed in ant colonies, bird flocks, bee swarms, and fish schools. These algorithms have drawn significant interest in solving complex problems in science and engineering by mimicking the intelligent interactions within biological systems. Evolutionary algorithms, a branch of BIA, solve problems by employing processes that mimic the behaviors of living things. As such, it uses mechanisms that are typically associated with biological evolution, such as reproduction, mutation and recombination [7].
Feature selection is often treated as an optimization problem, where the objective is to identify the most relevant subset of features from the original dataset. Both exhaustive and metaheuristic search techniques are commonly employed to solve these problems [8]. Evolutionary algorithms, which is a metaheuristic method, have shown exceptional effectiveness in tackling wrapper-based feature selection problems [9].
In this paper, we proposed an Adaptive Feature-based Quantum Genetic Algorithm (FbQGA) for feature selection, enhanced by an adaptive mechanism that dynamically adjusts the quantum rotation angle based on the contribution of individual features. This innovation improves the performance and adaptability of the conventional QGA. The proposed FbQGA was benchmarked against state-of-the-art feature selection techniques using five high-dimensional datasets. The results consistently demonstrated that FbQGA outperformed other QGA variants, establishing itself as a highly effective and reliable approach for feature selection.
The structure of this paper is as follows: Section 2 provides a detailed overview of related work in the field of quantum bio-inspired algorithms for feature selection. Section 3 describes the theoretical foundation of the quantum genetic algorithm for feature selection. Section 4 shows the design and architecture of our proposed adaptive feature-based quantum genetic algorithm for feature selection. Section 5 presents the experimental design and a brief description of other variants of the Quantum Genetic algorithm. Section 6 demonstrates the algorithm’s performance on various benchmark datasets in comparison with the methods mentioned in the previous section. Finally, Section 7 discusses the implications of these results and potential avenues for future research.
2. Related Work
Genetic Algorithms (GA), first developed by John Holland [10], mimic the process of natural selection to solve optimization or search problems and are particularly useful when the objective function lacks continuity, differentiability, or convexity or has local optima on the search space. Quantum Genetic Algorithm (QGA), proposed by Han and Kim [11,12,13], is widely and effectively used in many fields. In QGA, a solution individual is encoded by quantum bit, which expressed as a pair of normalized probability amplitude. Quantum bit coding represents 0–1 linear superposition and has abundant diversity. Several studies have explored using QGA for feature selection problems.
Ramos and Vellasco [14] applied a Quantum Evolutionary Algorithm (QEA) to electroencephalography (EEG) signal data, utilizing a quantum rotation gate with a user-defined rotation angle. Experimentation revealed optimal rotation angles of 0.002 and 0.0025 yielding superior results. This approach demonstrated the potential of QEA in feature selection for biomedical data analysis. Ramos and Vellasco [15] extended their work by integrating chaotic maps, such as the logistic and Ikeda maps, into QEA to update rotation angles. This chaotic-based QEA demonstrated improved convergence, exploration, and exploitation balance, outperforming non-quantum and classical algorithms. Tayarani et al. [16] introduced a Quantum Evolutionary Algorithm based on principal component analysis (PCA) to identify personality traits. Utilizing a novel observation operator (O-operator) and PCA, the approach improved classification accuracy to 74–82% for datasets with nearly 3000 fillers uttered by 120 speakers.
Several research exploring quantum concepts with other bio-inspired methods. Kaur et al. [17,18] proposed a two-phase approach based on the nature-inspired wrapper-based feature selection Quantum-based Whale Optimization Algorithm. Experiments on the publicly available Distress Analysis Interview Corpus Wizard-of-Oz (DAICWOZ) dataset showed better F1 score compared to existing unimodal and multimodal automated depression detection models. A hybridization of quantum and moth flame optimization algorithm was proposed by Dabba et al. [19]. They test it on thirteen microarray datasets (six binary-class and seven multi-class) to evaluate and compare the classification accuracy and the number of genes selected by the proposed method against many recently published algorithms. Experimental results show that their method provides greater classification accuracy and the ability to reduce the number of selected genes compared to the other algorithms.
These studies underline the versatility and potential of quantum bio-inspired algorithms in addressing feature selection challenges across diverse domains, including biomedical analysis, personality trait identification, intrusion detection, and neural network optimization. By integrating quantum principles such as rotation gates, chaotic maps, and amplitude estimation, these algorithms achieve better convergence, scalability, and accuracy, paving the way for more robust and efficient machine learning models.
3. Materials and Method
In this section, first, we describe the basic GA and the QGA for feature selection. Then, we detail our proposed adaptive feature-based genetic algorithm, with the architecture highlighting the enhancements.
3.1. Genetic Algorithms
Genetic algorithms are used to solve optimization and search problems by applying biologically inspired operators such as mutation, crossover, and selection.
Step 1 (Initialization): a population of chromosomes (individuals) is initially generated at random. Each individual represents a potential solution within the search space (Figure 1).
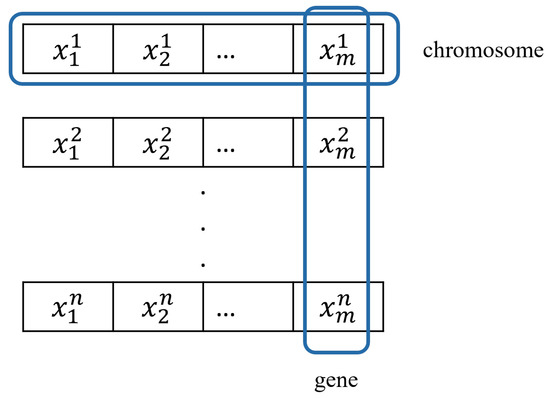
Figure 1.
Population initialization of Genetic Algorithms.
The quality of these chromosomes is evaluated using a fitness function. Every chromosome consists of multiple genes, where each gene corresponds to a specific dimension or feature of the solution. In the context of GA for FS problems, each gene is binary, taking a value of either 0 or 1. A value of 0 indicates that the associated feature is excluded, while a value of 1 means the feature is selected, as in Figure 2.

Figure 2.
Binary representation of BIA-FS problems.
To evolve the population and generate new candidate solutions, three key operators are applied iteratively until a termination criterion is met. These operators and their roles in the GA process are explained as follows.
Step 2 (Selection process): high-quality chromosomes are chosen as parents through a selection process designed to preserve the exploration of potential solutions. Various methods can be used for parent selection, including:
- Elitism Selection: this method selects the top k chromosomes based on their fitness scores and passes them directly to the next generation without modification.
- Roulette Wheel Selection: in this approach, each chromosome is assigned a portion of a wheel proportional to its fitness value. Chromosomes with higher fitness occupy larger segments, increasing their probability of being selected as parents.
Step 3 (Crossover): the crossover operator, controlled by a probability parameter , is applied to the selected parents to generate new offspring (solutions) by exchanging genes between them. This operator is inspired by the concept of offspring inheriting the most favorable traits from their parents. Common crossover methods include single-point, two-point, and uniform crossover, each offering varying degrees of diversity in the GA (Figure 3).
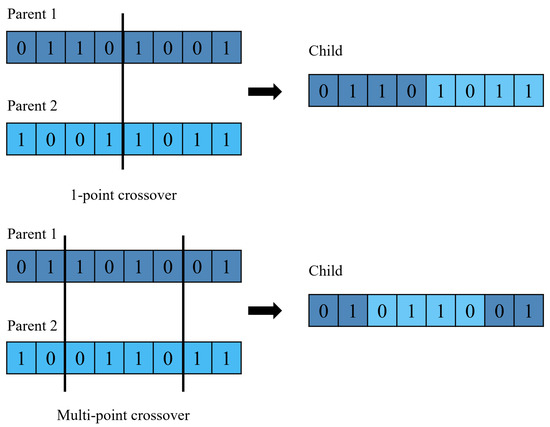
Figure 3.
Genetic Algorithms crossover process.
Step 4 (Mutation process): this step introduces small random changes to the offspring solutions, creating variations that differentiate them from their parents and potentially improve them. This process helps maintain diversity within the population by exploring the local search space. A mutation is typically applied with a lower probability () compared to crossover (). An example of the mutation process is illustrated in Figure 4.

Figure 4.
Genetic Algorithms mutation process.
Step 5 (Next generation): Offspring replace some or all individuals in the current population. Several common strategies:
- Generational Replacement: the entire population is replaced by offspring.
- Elitism: the best individuals from the parent generation are carried over to the next generation to preserve good solutions.
- Steady-state: offspring are evaluated, then merged with the parent generation and sorted. Finally, less fit individuals are removed.
Step 6 (Termination): the reproduction process continues until a specified termination condition is met. Common termination criteria include: achieving a solution that meets a predefined minimum fitness value, reaching a set number of iterations, or exhausting the allocated computation time.
3.2. Quantum Genetic Algorithms
Quantum Genetic Algorithm (QGA) for feature selection are enhanced versions of traditional genetic algorithms that incorporate principles from quantum computing, though they do not require actual quantum hardware. In quantum computing, information is represented using quantum bits, or qubits. Unlike classical bits, which exist strictly as either ‘0’ or ‘1’, qubits can exist in a superposition of both states simultaneously. The mathematical representation of a qubit is given by Equation (1).
In this representation, and are complex numbers that denote the probability amplitudes of their respective states. The probability of the qubit being in the “0” state is given by the squared magnitude of , represented as , while represents the probability of the qubit being in the “1” state. To maintain normalization, Equation (2) ensures that the total probability across all possible states sums to one.
In the context of feature selection using QGA, and correspond to the probabilities of a feature being unselected (state “0”) and selected (state “1”), respectively. As these probabilities approach either 1 or 0, the Q-bit individual becomes more deterministic, ultimately converging to a single state and gradually reducing diversity. This characteristic enables the Q-bit representation to balance both exploration and exploitation simultaneously [11]. A Q-bit individual, structured as a sequence of Q-bits, is mathematically defined in Equation (3).
where + = 1;
A quantum genetic algorithm for feature selection encompasses the below essential steps.
- Initialization: A quantum chromosome population is randomly generated. at generation t, where n is the size of population, and is a Q-bit individual defined as Equation (4).The number of features is represented by m. After that, in the act of observation, n Q-bit individuals are converted into (or collapsed) n binary individuals (). One binary solution; ; is a binary string of the length m, and is formed by selecting each bit using the probability of q-bit following the rules below Equation (5).where i represents individual, j is the feature, and generates a random number between 0 and 1.The fitness function, also known as the evaluation function, is designed to assess the quality of each quantum feature subset. In feature selection problems, whether a lower or higher fitness value indicates a more optimal solution depends on the objective function. If the objective function is a minimization problem (e.g., minimizing error or redundancy as in Equation (6)), a lower fitness value is preferable. Since fitness functions are crucial for evaluating candidate solutions during optimization, various methods have been proposed in the literature. These include evaluation metrics such as accuracy, F1 score, precision, and recall, as well as information-theoretic measures, error or loss functions, and linear combinations of subset cardinality with evaluation or loss metrics. An example of a fitness function is given in Equation (6).Here, acts as a weighting factor for relative to the size of the feature subset. It is designed to identify a feature subset that minimizes both the classification error () and the number of selected features. The parameter ranges between 0 and 1, where represents the selected feature subset, and denotes the total number of features.
- Rotation: In QGA, the update of Q-bit individuals is performed through a quantum rotation. At generation , all individuals adjust their positions by rotating toward the best individual from the previous generation . A rotation gate is utilized to modify a Q-bit individual. For instance, at position is updated to at , as expressed in Equation (7) and illustrated in Figure 5.
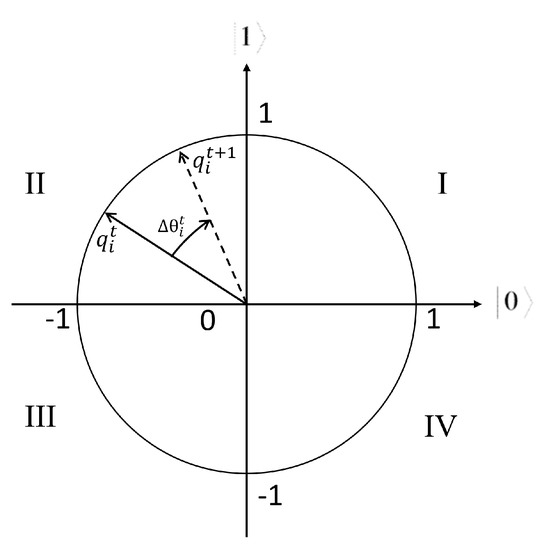 Figure 5. Polar plot of the rotation gate for Q-bit individuals.The rotation angle governs the adjustment of the qubit’s state, influencing its angular approximation toward the |0⟩ or |1⟩ amplitudes. The superposition state of the qubit, defined by and , dictates the probability of measuring the qubit in either the 0 or 1 state. The rotation angle is dynamically modified based on the fitness function of the quantum individuals. Through iterative updates of these rotation angles, the algorithm explores the quantum state space in search of optimal solutions.
4. The Proposed Method
Unlike the traditional QGA [11], our proposed FbQGA for Feature Selection consists of three main phases, as depicted in Figure 6. The steps outlined with red contours represent the new enhancements.
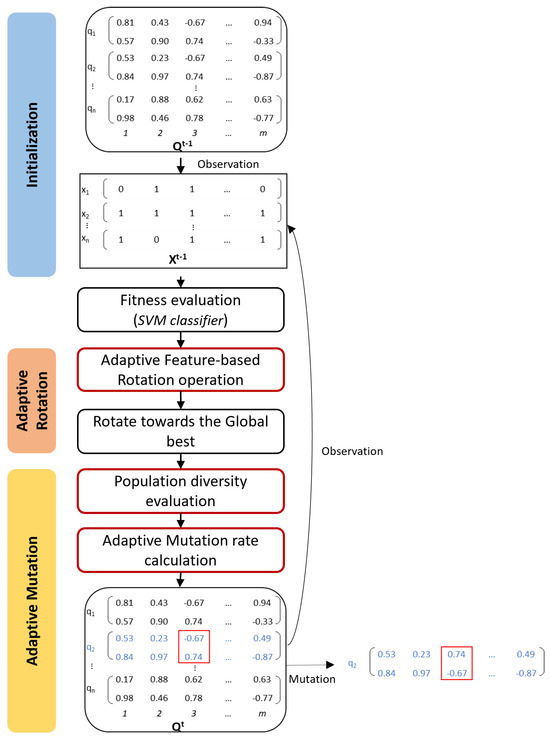
Figure 6.
The architecture of Adaptive Feature-based Quantum Genetic Algorithm (FbQGA) Feature Selection (The steps in red-contour are the new enhancements).
- (A)
- Initialization: This step remains the same as in the classic QGA, where a population of Q-bit individuals is randomly generated and then converted into binary individuals. We use an SVM classifier to compute the fitness values.
- (B)
- Adaptive Rotation: Typically, a quantum rotation operation involves two key components: the rotation direction and the rotation angle. The details of each component are provided below in this paper.
- Rotation direction: A quantum individual undergoes rotation only when the following conditions are met: the quantum individual is inferior to the global best solution , and the corresponding binary digit of the individual differs from . This mechanism is illustrated in Figure 7. Here, f represents the fitness function, is the binary value of the feature of the individual, and refers to the binary value of the global best solution.
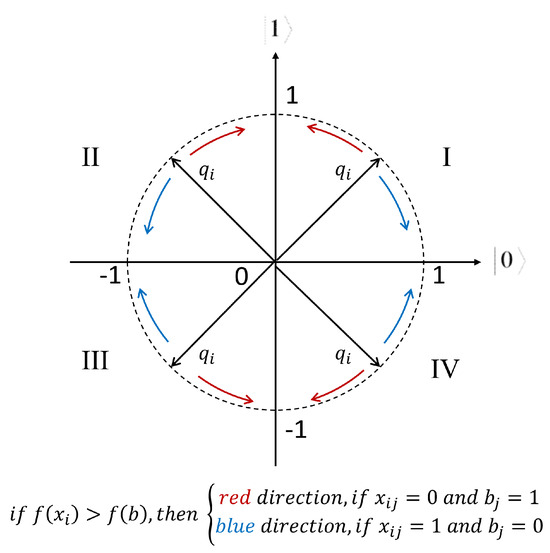 Figure 7. Rotation direction of Adaptive Feature-based Quantum Genetic Algorithm (AFbQGA) Feature Selection.
 - Rotation angle: we propose a novel adaptive rotation angle that calculates the magnitude of the rotation angle for each Q-bit of each quantum individual in the Equation (8)Here, represents the rotation angle of the Q-bit in the Q-bit individual at generation . is the minimum rotation angle, set to . The population size and the total number of features are denoted by n and m, respectively.The feature frequency vector, , is shown in Figure 8 and is calculated as the sum of all binary individuals. Specifically, represents the frequency of the feature appearing in the binary population at the previous generation . The term refers to the average fitness of the population at the generation.
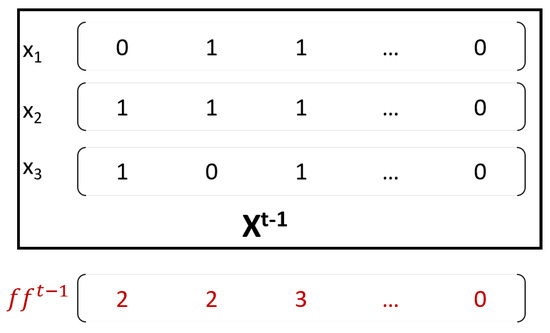 Figure 8. Feature frequency vector.The core concept is that different features have different levels of importance. To evaluate their contributions, we measure the frequency of their occurrence in the population and examine how this frequency influences the population’s fitness. To avoid bias due to variations in population size (n) and the total number of features (m), we normalize the results using these factors. As the population’s fitness improves or worsens, the rotation angle adjusts accordingly, increasing or decreasing in response. Similarly, when the frequency of a feature changes, the rotation angle for that feature adjusts proportionally to the change in fitness.
- (C)
- Adaptive Mutation: We employ the adaptive mutation rate based on the population diversity [20]. The population diversity is measured through the standard deviation of the population’s fitness values, as described in Equation (9).Here, represents the average fitness of the generation, and is the fitness value of individual in the generation.As the standard deviation decreases, the mutation rate is increased to promote greater population diversity. The adaptive mutation rate is given by Equation (10).In this equation, is a fixed mutation rate, and is the highest fitness in the generation. The adaptive mutation rate is influenced by both the fixed mutation rate and the population’s diversity. As the population diversity decreases, will increase proportionally.
Table 1 below highlights the main differences between our proposed method and other variants of QGA employed for comparison.

Table 1.
Main characteristics of algorithms tested in the experiment.
5. Experiment Design
This section starts with a description of the datasets and its pre-processing, followed by the experimental setup and the results obtained from the experiments.
5.1. Dataset and Data Preprocessing
The experiments and result comparisons are based on five datasets from the UCI Machine Learning Repository [21] and the ADBench repository [22]. These datasets present a diverse range of real-world domains and applications. The datasets are listed in Table 2.
- The Taiwan bankruptcy dataset were collected from the Taiwan Economic Journal for the years 1999 to 2009. Company bankruptcy was defined based on the business regulations of the Taiwan Stock Exchange.
- The Musk dataset describes a set of 102 molecules of which 39 are judged by human experts to be musks and the remaining 63 molecules are judged to be non-musks. The 166 features that describe these molecules depend upon the exact shape, or conformation, of the molecule. The label is either 0 if the record is non-musk and 1 if the record is musk.
- The Parkinson’s Disease (PD) dataset is composed of a range of biomedical voice measurements. The main aim of the data is to discriminate healthy people from those with PD, according to “status” column which is set to 0 for healthy and 1 for PD.
- The Backdoor dataset has a hybrid of the real modern normal and the contemporary synthesized attack activities of the network traffic. It contains nine attack categories and normal network traffic. There are 49 features in the original UNSW-NB15 dataset developed by Moustafa and Slay [23]. Han et al. [22] synthetically create the Backdoor dataset based on the UNSW-NB15 dataset by adding more anomalies and irrelevant features up to more than 50% of the total input features. They follow and enrich the approach in [24] to generate realistic synthetic anomalies.
- The Campaign dataset is related with direct marketing campaigns (phone calls) of a Portuguese banking institution. The classification goal is to predict if the client will subscribe a term deposit.

Table 2.
Datasets description.
Table 2.
Datasets description.
| Dataset | # Features | # Samples | # Class | Domain | Outlier Rate |
|---|---|---|---|---|---|
| Taiwan bankruptcy [25] | 96 | 6819 | 2 | Finance | 3.23% |
| Musk [26] | 167 | 3062 | 2 | Chemistry | 3.17% |
| Parkinson’s Disease [27] | 756 | 754 | 2 | Healthcare | 25.39% |
| Backdoor [22] | 196 | 95,329 | 10 | Network | 2.44% |
| Campaign [22,28] | 62 | 41,188 | 2 | Finance | 11.27% |
In our study, we used labeled datasets, where the minority class resembles outliers due to its rarity in high-dimensional data. The datasets are high-dimensional and imbalanced, making them suitable for evaluating the influence of feature selection in outlier detection applications.
Each dataset is partitioned randomly into three subsets: 81% of the data serves as the training set, 9% is allocated for the validation set, and the remaining 10% is designated as the test set.
To improve the optimization process and boost the algorithm’s performance, the entire dataset was normalized to a range of 0 to 1. This scaling ensures that all features contribute equally to the model, preventing any single feature from dominating due to differences in scale.
To address the issue of imbalanced classification, undersampling techniques were applied to modify the class distribution by removing instances from the majority class in the training dataset. Specifically, the NearMiss-1 undersampling method was used, which selects majority class instances based on their proximity to the three nearest instances of the minority class [29]. Details of the class distributions for each dataset after applying the undersampling technique are shown in Table 3. The outlier rate on Validation and Test remain unchanged.

Table 3.
Datasets after undersampling.
5.2. Classifier
The classifier algorithm used here is the popular Support Vector Machine (SVM) classifier, a supervised learning method for classification, regression and outliers detection [30]. We employed the SVM classifer in fitness evaluation step and in evaluating performance on test set. Module SVC from Python library sklearn.svm was used for the classifier. The kernel was the Radial Basis Function (rbf), and other hyperparameters were kept default.
5.3. Evaluation Metrics
To evaluate the effectiveness of the proposed model, assessments are performed using metrics derived from the confusion matrix, including true positive (TP), true negative (TN), false positive (FP), and false negative (FN) classifications. From these metrics, additional performance measures such as Accuracy, F1-Score, Precision, Recall, and G-Mean are calculated using Equation (11) to Equation (15). Additionally, key performance indicators are reported, including the fitness value on the test set, the number of features selected, and the runtime.
- Classification Accuracy: This metric determines the percentage of accurately classified instances relative to the total number of classifications. It is calculated as:
- Precision (P): This refers to the ratio of correctly identified outlier instances to the total number of instances predicted as outliers:
- Recall (R): This is often referred to as sensitivity, which measures the proportion of actual outlier instances correctly identified as outliers. It is computed by dividing the number of true positive predictions (TP) by the total number of actual outlier instances:
- F1-Score (F-Measure): This is the mean of the precision and recall, defined as:
- G-Mean: To evaluate the performance of a classification algorithm when dealing with imbalanced data, sensitivity and specificity can be combined into a single metric. This metric, called the geometric mean (G-Mean), provides a balanced measure of both factors. It is calculated as follows:
5.4. Comparable Methods
In this paper, we compare our proposed Adaptive Feature-based Quantum Genetic Algorithm (FbQGA) with the traditional Genetic Algorithms (GA) and several popular variants (QGAs). All QGAs variants follow the same process, as illustrated in Figure 6, with their primary distinction being the rotation mechanisms employed. Numerous studies highlight that the magnitude of the rotation angle significantly influences both the speed of convergence and the quality of the obtained solutions. Consequently, this experiment aims to evaluate the effectiveness and efficiency of various rotation strategies.
5.4.1. Fixed Value Rotation Angle
Han and Kim [11] recommend that the suitable value of rotation angle can be from 0.001 to 0.05. The Fixed-value Quantum Genetic Algorithm (FvQGA) we tested employs 0.01 rotation angle.
5.4.2. Generation-Based Rotation Angle
The angle amplitude of the Generation-based Quantum Genetic Algorithm (GbQGA) varies with evolutionary generations in the whole process of evolution. In general, as there exists a greater distance from all individuals to the optimal solution, the angle amplitude usually takes a large value to speed up convergence. As evolution continues, all individuals may successively approach the optimal solution, so the angle amplitude should be reduced gradually to avoid missing the optimum solution and improve the convergence precision. Xiong et al. [31] proposed the rotation angle is expressed as Equation (16)
where t and T denote the current generation and the maximum generation respectively, and are set to 0.0025 and 0.05, respectively.
5.4.3. Individual-Based Rotation Angle
In the Individual-based Quantum Genetic Algorithm (IbQGA) variant, the rotation angle is influenced by the distance between the best solution and the corresponding individual [31,32]. The angle amplitude varies with the Hamming distance of binary code as in Equation (17)
Let be the Hamming distance between the binary codes of and , and m is the total number of features, then is calculated by Equation.
5.5. Parameters
We compared our proposed FbQGA against the traditional GA, classic FvQGA, and QGA’s variants including GbQGA and IbQGA with configurations in Table 4.

Table 4.
Parameter settings.
6. Results
In this study, the statistical test utilized was the Wilcoxon rank-sum test, proposed by Frank Wilcoxon [33]. This test is a nonparametric method employed to compare two independent groups. It evaluates differences between the two groups on a single ordinal variable, without requiring any specific distribution.
We conducted 30 independent runs (samples) and subsequently employed the Wilcoxon rank-sum test to compare the performance of the two techniques using the selected evaluation metrics. The experimental outcomes, presented in Table 5, Table 6, Table 7 and Table 8, encompass the average and standard deviation of all evaluation metrics across 30 independent runs. Superior results are highlighted in bold for clarity. Additionally, the SSD column indicates whether a significant statistical difference exists between the compared methods.

Table 5.
Comparison of GA and FbQGA (std: standard deviation; SSD: Significant Statistical Differences; the best performance is highlighted in “Bold”).

Table 6.
Comparison of FvQGA and FbQGA (std: standard deviation; SSD: Significant Statistical Differences; the best performance is highlighted in “Bold”).

Table 7.
Comparison of GbQGA and FbQGA (std: standard deviation; SSD: Significant Statistical Differences; the best performance is highlighted in “Bold”).

Table 8.
Comparison of IbQGA and FbQGA (std: standard deviation; SSD: Significant Statistical Differences; the best performance is highlighted in “Bold”).
All the implementations are done in Python 3.9.19. The experiments are run on an Intel Core i7-1185G7 @ 3.00GHz (8 CPUs) and 16 GB RAM. The fitness function was defined in Equation (6) with and as 0.99 and 1 − F1, respectively. Due to the stochastic nature of metaheuristic algorithms, the experiment was done for 30 runs on each method and the average of the simulated results was recorded.
6.1. Performance Analysis
Figure 9 outlines the convergence plot for FbQGA versus the four other algorithms on the given datasets over 100 generations. The convergence plot of each method is the average of 30 runs.
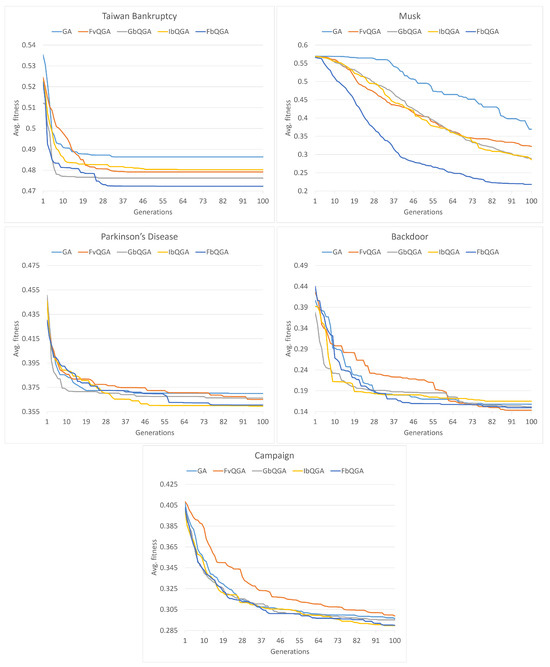
Figure 9.
The Convergence curve of FbQGA versus other methods.
The Taiwan bankruptcy dataset (Figure 10) represents a moderately high-dimensional problem with a low anomaly rate. FbQGA emerged as the most effective algorithm, achieving the highest F1-score (58.86 ± 1.17%), Recall (61.27 ± 5.06%), and Accuracy (89.61%). Its dynamic feature prioritization mechanism proved particularly effective, allowing it to handle the moderate dimensionality and capture the minority class with high precision and consistency. The low standard deviation across metrics further illustrates FbQGA’s reliability.
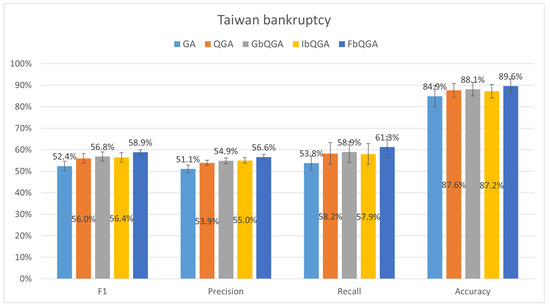
Figure 10.
The average performance over 30 runs on Taiwan bankruptcy dataset.
While GbQGA (58.93 ± 2.13%) and IbQGA (57.93 ± 1.33%) also performed reasonably well in terms of F1-score, they lacked the adaptability needed to match FbQGA’s balanced performance. The classic GA struggled significantly, with the lowest F1-score (52.42 ± 2.26%) and Accuracy (84.89%), highlighting its inability to manage the dimensionality effectively. FvQGA showed some improvement over GA, but its fixed rotation angle limited its capability to optimize feature selection dynamically.
The Musk dataset (Figure 11) poses significant challenges for traditional algorithms like GA, which achieved an F1-score of 60.96 ± 15.11%, highlighting its instability and inability to handle high dimensionality effectively. FbQGA, on the other hand, excelled with the highest F1-score (69.65 ± 5.48%), Recall (74.5 ± 6.13%), and Accuracy (71.2 ± 2.74%). Its feature-based rotation adjustment mechanism proved instrumental in prioritizing significant features.
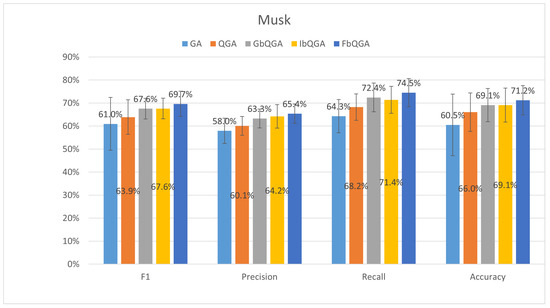
Figure 11.
The average performance over 30 runs on Musk dataset.
GbQGA (67.56 ± 4.48%) and IbQGA (67.62 ± 4.48%) have comparable F1-scores, leveraging their generation- and individual-based rotation angle mechanisms to adapt to the dataset’s high dimensionality. However, their lack of feature-specific adjustments left them trailing FbQGA. FvQGA (63.92 ± 7.48%) showed better performance than GA but struggled with consistency due to its fixed rotation angle, which limits its adaptability to the dataset’s complexity.
The Parkinson’s disease dataset (Figure 12) is characterized by its extreme dimensionality (754 features for 756 records), high anomaly rate (25.39%), and imbalanced class distribution. This challenging dataset tests the limits of feature selection algorithms. FbQGA again emerged as the most effective algorithm, achieving the highest F1-score (69.51 ± 2.72%), Precision (68.7%), Recall (70.31%), and Accuracy (77.31 ± 2.74%). Its ability to dynamically adjust rotation angles based on feature frequency and contribution was pivotal in managing the dataset’s complexity and high anomaly rate.
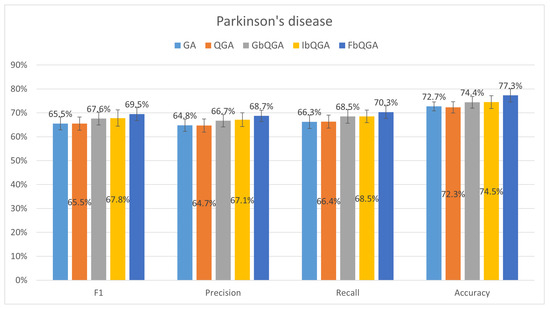
Figure 12.
The average performance over 30 runs on Parkinson’s disease dataset.
IbQGA (67.81 ± 2.70%) and GbQGA (67.59 ± 2.61%) performed reasonably well but slightly worse than FbQGA’s precision and recall due to their reliance on individual- and generation-based adjustments, which are less effective in extreme dimensionality scenarios. GA (65.53 ± 2.66%) and FvQGA (65.5 ± 2.74%) demonstrated the lowest F1-scores, reflecting their limitations in handling such complex datasets. The fixed rotation angle of FvQGA proved insufficient for capturing meaningful patterns in the data, while GA’s non-adaptive feature selection mechanism failed to optimize performance.
For the Backdoor dataset (Figure 13), FbQGA maintains strong precision (87.1%) and accuracy (95.5%), but it falls short in recall (71.0%), the lowest among all methods. This indicates that while FbQGA is effective at making precise fraud predictions with fewer false positives, it struggles to capture all fraudulent cases, likely missing some important anomalies. In contrast, FvQGA achieves the highest recall (78.6%) and F1 score (85.2%), suggesting it is better at identifying fraudulent cases despite slightly lower precision (93.1%) compared to GbQGA (94.1%). GbQGA outperforms all methods in precision (94.1%) and accuracy (96.5%), making it the most precise model but slightly less balanced than FvQGA. IbQGA also shows strong performance, with an F1 score of 84.2% and recall of 75.8%, making it a good alternative. While FbQGA remains highly accurate, its lower recall suggests it may be too conservative, potentially missing fraudulent instances in high-risk scenarios.
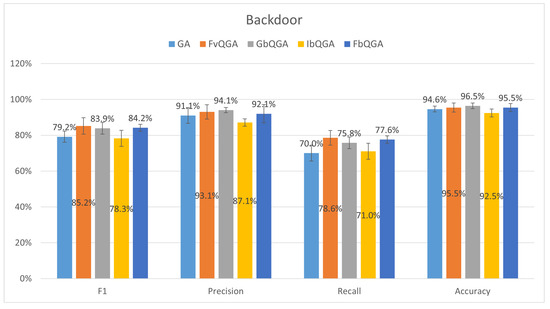
Figure 13.
The average performance over 30 runs on Backdoor dataset.
For the Campaign dataset (Figure 14), FbQGA demonstrates superior performance across all evaluation metrics, achieving the highest F1 score (69.3%), precision (68.8%), recall (69.5%), and accuracy (87.3%). This suggests that FbQGA effectively balances precision and recall, leading to the most accurate fraud detection model among the tested algorithms. Compared to the other methods, GA (baseline) has the lowest F1 score (65.7%) and accuracy (83.4%), indicating weaker overall performance. The FvQGA and GbQGA models perform similarly, with F1 scores of 66.1% and 66.1%, respectively, and accuracy values of 84.1% and 85.7%, slightly behind FbQGA. IbQGA shows competitive performance with an F1 score of 69.1% and an accuracy of 87.1%, coming closest to FbQGA. However, FbQGA maintains a slight edge, making it the most reliable model for this dataset.
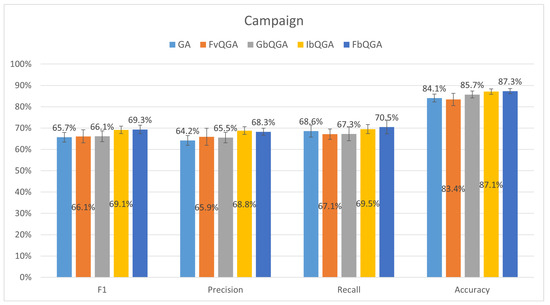
Figure 14.
The average performance over 30 runs on Campaign dataset.
6.2. Feature Reduction Analysis
Figure 15 illustrates the average number of selected features across the three datasets.
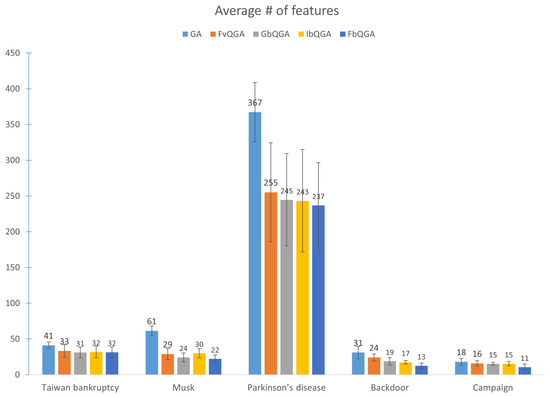
Figure 15.
The average number of selected features over 30 runs.
- Taiwan Bankruptcy Dataset: With 96 features, FbQGA (31.52 features) demonstrated the most efficient reduction, followed closely by GbQGA and IbQGA, which also reduced dimensionality effectively. GA, in contrast, selected 41.10 features, leaving more irrelevant features and highlighting its limitations in reducing dimensions for datasets with relatively fewer features.
- Musk Dataset: Among 167 features, FbQGA (22.13 features) again achieved the most substantial reduction, outperforming the other quantum-inspired variants and significantly outpacing GA (61.35 features). This dataset’s moderate dimensionality underscores FbQGA’s adaptability, where dynamic adjustments to feature importance contribute to efficient reduction.
- Parkinson’s Disease Dataset: With 754 features, this dataset posed a significant challenge. FbQGA (236.91 features) emerged as the most effective algorithm, selecting the fewest features and maintaining consistency. Other quantum-inspired algorithms, including GbQGA and IbQGA, performed well but selected slightly more features than FbQGA. GA (367.20 features) struggled, retaining nearly half of the original features.
- Backdoor dataset, FbQGA selects the smallest number of features (13), significantly reducing dimensionality compared to GA (31) and even outperforming other quantum genetic algorithms such as IbQGA (17), GbQGA (19), and FvQGA (24). This suggests that FbQGA is the most efficient in feature selection, minimizing redundancy while maintaining useful information. Given its lower recall in the classification results, this aggressive reduction may contribute to missing some relevant fraud indicators, indicating a trade-off between feature selection and model sensitivity.
- Campaign dataset, FbQGA again selects the fewest features (11), demonstrating its strong feature reduction capability compared to GA (18), FvQGA (16), GbQGA (15), and IbQGA (15). This suggests that FbQGA efficiently filters out irrelevant or redundant features while preserving those most critical for classification. Since FbQGA also achieved the highest accuracy in this dataset, the reduced feature set appears to be well-optimized, helping to enhance model performance without sacrificing predictive power.
Overall, FbQGA consistently excelled in feature selection, demonstrating robust adaptability across datasets of varying complexity. Quantum-inspired methods, such as FbQGA, GbQGA, and IbQGA, significantly outperformed the traditional GA in reducing dimensionality, particularly for high-dimensional datasets.
The processing time results, shown in Figure 16, further distinguish the performance of the algorithms.
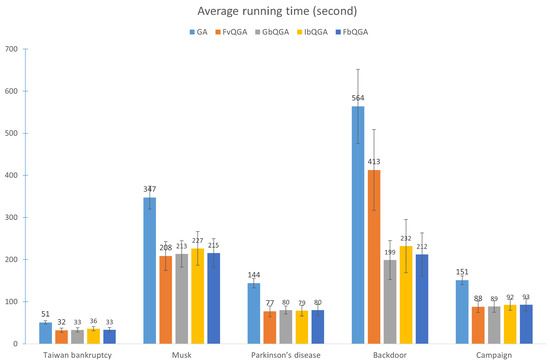
Figure 16.
The average processing time of 100 generations over 30 runs.
- Taiwan Bankruptcy Dataset: GA had the highest processing time (50.93 s), while FvQGA (31.92 s) and FbQGA (33.15 s) were the fastest. The quantum-inspired algorithms demonstrated efficiency, with FbQGA striking a balance between speed and feature selection effectiveness.
- Musk Dataset: GA required the longest processing time (347.33 s), reflecting its inefficiency in handling moderate dimensionality. FvQGA (208.46 s) was the fastest but lacked the feature selection precision of FbQGA (215.46 s), which offered a superior trade-off between processing time and dimensionality reduction.
- Parkinson’s Disease Dataset: For this highly complex dataset, GA (143.88 s) was the slowest, while FbQGA (80.12 s) and GbQGA (80.01 s) were the most efficient. Despite their similar times, FbQGA demonstrated better feature selection, making it the optimal choice for extreme dimensionality.
- Backdoor dataset, the FbQGA algorithm has an average running time of 212 s, making it one of the more efficient methods compared to GA (564 s) and FvQGA (413 s). While it is slightly slower than GbQGA (199 s) and IbQGA (232 s), its performance remains competitive within the quantum-inspired algorithms. The error bars indicate moderate variability, suggesting consistent efficiency in solving this dataset. FbQGA’s significant reduction in runtime compared to GA highlights its advantage in computational efficiency.
- Campaign dataset, FbQGA has an average running time of 93 s, which is nearly identical to GbQGA (92 s) and IbQGA (89 s). Compared to GA (151 s), FbQGA shows a significant improvement, cutting execution time by almost 40%. The error bars suggest minimal variation, reinforcing FbQGA’s reliability in handling this dataset efficiently. This consistency across multiple datasets indicates that FbQGA is a strong candidate for reducing computational costs while maintaining performance.
In conclusion, FbQGA consistently demonstrated favorable processing times while maintaining strong feature selection performance.
7. Conclusions
In this paper, we examined the approach of a feature-based quantum genetic algorithm for feature selection. To enhance the conventional QGA, we employed an adaptive mechanism based on the contribution of features to adjust the quantum rotation angle. The proposed method, FbQGA, is compared with other state-of-the-art techniques for feature selection problems on five high-dimensional datasets. Among the QGAs, FbQGA consistently emerged as the high-performing and effective approach. FbQGA’s ability to dynamically calibrate rotation angles based on the significance of features allowed it to achieve better dimensionality reduction across datasets of varying complexity. This adaptability was particularly evident in high-dimensional data, such as the Parkinson’s disease dataset, where FbQGA selected the fewest features while maintaining high classification performance. Its performance was also competitive on the Musk and Taiwan bankruptcy datasets, where it consistently outperformed the original GA and other QGA variants in both feature selection and predictive accuracy. In terms of computational efficiency, FbQGA achieved a favorable balance between runtime and feature selection efficacy. While Fixed-Value Quantum Genetic Algorithm (FvQGA) demonstrated the fastest processing times, its fixed rotation angle limited its adaptability, leading to suboptimal feature selection. In contrast, GA required the longest processing times across all datasets and retained significantly more features, highlighting its limitations for modern, high-dimensional data challenges. Future research could investigate the performance of the proposed method on multiple class datasets.
Author Contributions
Conceptualization, T.H.P. and B.R.; methodology, T.H.P. and B.R.; software, T.H.P.; validation, T.H.P.; formal analysis, T.H.P. and B.R.; investigation, T.H.P. and B.R.; data curation, T.H.P.; writing—original draft preparation, writing T.H.P.—review and editing, B.R.; visualization, T.H.P.; supervision, B.R.; project administration, B.R.; funding acquisition, B.R. All authors have read and agreed to the published version of the manuscript.
Funding
This research was funded by NSERC Discovery Grant under the grant number Nbr RGPIN-2023-03733.
Data Availability Statement
The datasets presented in this study are available in UCI ML Repository at https://archive.ics.uci.edu (accessed on 1 December 2024) and ADBench repository at https://github.com/Minqi824/ADBench/tree/main/adbench/datasets/Classical (accessed on 1 December 2024).
Conflicts of Interest
The authors declare no conflict of interest.
Abbreviations
The following abbreviations are used in this manuscript:
| GA | Genetic Algorithms |
| QGA | Quantum Genetic Algorithm |
| FbQGA | Adaptive Feature-based Quantum Genetic Algorithm |
| FvQGA | Fixed value Quantum Genetic Algorithm |
| GbQGA | Generation-based Quantum Genetic Algorithm |
| IbQGA | Individual-based Quantum Genetic Algorithm |
References
- L’Heureux, A.; Grolinger, K.; Elyamany, H.F.; Capretz, M.A.M. Machine Learning with Big Data: Challenges and Approaches. IEEE Access 2017, 5, 7776–7797. [Google Scholar] [CrossRef]
- Mandal, A.K.; Chakraborty, B. Quantum computing and quantum-inspired techniques for feature subset selection: A review. Knowl. Inf. Syst. 2024, 67, 2019–2061. [Google Scholar] [CrossRef]
- Pudjihartono, N.; Fadason, T.; Kempa-Liehr, A.W.; O’Sullivan, J.M. A Review of Feature Selection Methods for Machine Learning-Based Disease Risk Prediction. Front. Bioinform. 2022, 2, 927312. [Google Scholar] [CrossRef] [PubMed]
- Rao, H.; Shi, X.; Rodrigue, A.K.; Feng, J.; Xia, Y.; Elhoseny, M.; Yuan, X.; Gu, L. Feature selection based on artificial bee colony and gradient boosting decision tree. Appl. Soft Comput. 2019, 74, 634–642. [Google Scholar] [CrossRef]
- van Zyl, C.; Ye, X.; Naidoo, R. Harnessing eXplainable artificial intelligence for feature selection in time series energy forecasting: A comparative analysis of Grad-CAM and SHAP. Appl. Energy 2024, 353, 122079. [Google Scholar] [CrossRef]
- Li, J.; Tang, J.; Liu, H. Reconstruction-based Unsupervised Feature Selection: An Embedded Approach. In Proceedings of the 26th International Joint Conference on Artificial Intelligence, Melbourne, VIC, Australia, 19–25 August 2017; pp. 2159–2165. [Google Scholar] [CrossRef]
- Afzal, W.; Torkar, R. On the application of genetic programming for software engineering predictive modeling: A systematic review. Expert Syst. Appl. 2011, 38, 11984–11997. [Google Scholar] [CrossRef]
- Brezočnik, L.; Fister, I.; Podgorelec, V. Swarm Intelligence Algorithms for Feature Selection: A Review. Appl. Sci. 2018, 8, 1521. [Google Scholar] [CrossRef]
- Xue, B.; Zhang, M.; Browne, W.N.; Yao, X. A Survey on Evolutionary Computation Approaches to Feature Selection. IEEE Trans. Evol. Comput. 2016, 20, 606–626. [Google Scholar] [CrossRef]
- Holland, J.H. Adaptation in Natural and Artificial Systems: An Introductory Analysis with Applications to Biology, Control, and Artificial Intelligence; MIT Press: Cambridge, MA, USA, 1992. [Google Scholar]
- Han, K.H.; Kim, J.H. Genetic quantum algorithm and its application to combinatorial optimization problem. In Proceedings of the 2000 Congress on Evolutionary Computation. CEC00 (Cat. No.00TH8512), La Jolla, CA, USA, 16–19 July 2000; Volume 2, pp. 1354–1360. [Google Scholar] [CrossRef]
- Han, K.H.; Kim, J.H. Quantum-inspired evolutionary algorithm for a class of combinatorial optimization. IEEE Trans. Evol. Comput. 2002, 6, 580–593. [Google Scholar] [CrossRef]
- Han, K.H.; Park, K.H.; Lee, C.H.; Kim, J.H. Parallel quantum-inspired genetic algorithm for combinatorial optimization problem. In Proceedings of the 2001 Congress on Evolutionary Computation (IEEE Cat. No.01TH8546), Seoul, Republic of Korea, 27–30 May 2001; Volume 2, pp. 1422–1429. [Google Scholar] [CrossRef]
- Ramos, A.C.; Vellasco, M. Quantum-inspired Evolutionary Algorithm for Feature Selection in Motor Imagery EEG Classification. In Proceedings of the 2018 IEEE Congress on Evolutionary Computation (CEC), Rio de Janeiro, Brazil, 8–13 July 2018; pp. 1–8. [Google Scholar] [CrossRef]
- Ramos, A.C.; Vellasco, M. Chaotic Quantum-inspired Evolutionary Algorithm: Enhancing feature selection in BCI. In Proceedings of the 2020 IEEE Congress on Evolutionary Computation (CEC), Glasgow, UK, 19–24 July 2020; pp. 1–8. [Google Scholar] [CrossRef]
- Tayarani, M.; Esposito, A.; Vinciarelli, A. What an “Ehm” Leaks About You: Mapping Fillers into Personality Traits with Quantum Evolutionary Feature Selection Algorithms. IEEE Trans. Affect. Comput. 2022, 13, 108–121. [Google Scholar] [CrossRef]
- Kaur, B.; Rathi, S.; Agrawal, R. Enhanced depression detection from speech using Quantum Whale Optimization Algorithm for feature selection. Comput. Biol. Med. 2022, 150, 106122. [Google Scholar] [CrossRef] [PubMed]
- Agrawal, R.; Kaur, B.; Sharma, S. Quantum based Whale Optimization Algorithm for wrapper feature selection. Appl. Soft Comput. J. 2020, 89, 106092. [Google Scholar] [CrossRef]
- Dabba, A.; Tari, A.; Meftali, S. Hybridization of Moth flame optimization algorithm and quantum computing for gene selection in microarray data. J. Ambient. Intell. Humaniz. Comput. 2021, 12, 2731–2750. [Google Scholar] [CrossRef]
- Pham, T.H.; Raahemi, B. An Adaptive Quantum-based Genetic Algorithm Feature Selection for Outlier Detection. In Proceedings of the 10th International Conference on Control, Decision and Information Technologies (CoDIT), Vallette, Malta, 1–4 July 2024; pp. 1034–1039, ISSN 2576-3555. [Google Scholar] [CrossRef]
- Kelly, M.; Longjohn, R.; Nottingham, K. The UCI Machine Learning Repository. Available online: https://archive.ics.uci.edu (accessed on 1 December 2024).
- Han, S.; Hu, X.; Huang, H.; Jiang, M.; Zhao, Y. ADBench: Anomaly Detection Benchmark. arXiv 2022, arXiv:2206.09426. [Google Scholar] [CrossRef]
- Moustafa, N.; Slay, J. UNSW-NB15: A comprehensive data set for network intrusion detection systems (UNSW-NB15 network data set). In Proceedings of the 2015 Military Communications and Information Systems Conference (MilCIS), Canberra, ACT, Australia, 10–12 November 2015; pp. 1–6. [Google Scholar] [CrossRef]
- Steinbuss, G.; Böhm, K. Benchmarking Unsupervised Outlier Detection with Realistic Synthetic Data. ACM Trans. Knowl. Discov. Data 2021, 15, 1–20. [Google Scholar] [CrossRef]
- Taiwanese Bankruptcy Prediction. UCI Machine Learning Repository. 2020. Available online: https://doi.org/10.24432/C5004D (accessed on 1 December 2024).
- Chapman, D.; Jain, A. Musk (Version 1). UCI Machine Learning Repository. 1994. Available online: https://doi.org/10.24432/C5ZK5B (accessed on 1 December 2024).
- Sakar, C.; Serbes, G.; Gunduz, A.; Nizam, H.; Sakar, B. Parkinson’s Disease Classification. UCI Machine Learning Repository. 2018. Available online: https://doi.org/10.24432/C5MS4X (accessed on 1 December 2024).
- Pang, G.; Shen, C.; van den Hengel, A. Deep Anomaly Detection with Deviation Networks. arXiv 2019, arXiv:1911.08623. [Google Scholar]
- Zhang, J.; Mani, I. KNN Approach to Unbalanced Data Distributions: A Case Study Involving Information Extraction. In Proceedings of the ICML’2003 Workshop on Learning from Imbalanced Datasets, Washington, DC, USA, 21 August 2003. [Google Scholar]
- Cortes, C.; Vapnik, V. Support-vector networks. Mach. Learn. 1995, 20, 273–297. [Google Scholar] [CrossRef]
- Xiong, H.; Wu, Z.; Fan, H.; Li, G.; Jiang, G. Quantum rotation gate in quantum-inspired evolutionary algorithm: A review, analysis and comparison study. Swarm Evol. Comput. 2018, 42, 43–57. [Google Scholar] [CrossRef]
- Wang, Z.; Yang, B.; Lv, X.; Cui, D. An Improved Quantum Genetic Algorithm. J. Xi’an Univ. Technol. 2012, 28, 145–151. [Google Scholar]
- Wilcoxon, F. Individual Comparisons by Ranking Methods. Biom. Bull. 1945, 1, 80–83. [Google Scholar] [CrossRef]
Disclaimer/Publisher’s Note: The statements, opinions and data contained in all publications are solely those of the individual author(s) and contributor(s) and not of MDPI and/or the editor(s). MDPI and/or the editor(s) disclaim responsibility for any injury to people or property resulting from any ideas, methods, instructions or products referred to in the content. |
© 2025 by the authors. Licensee MDPI, Basel, Switzerland. This article is an open access article distributed under the terms and conditions of the Creative Commons Attribution (CC BY) license (https://creativecommons.org/licenses/by/4.0/).