1. Introduction
An ideal vehicle suspension system should facilitate two main functions, namely ride quality and vehicle handling. Ride quality refers to the comfort perceived by passengers, which is achieved by the isolation of the vehicle body from external disturbances such as road irregularities. Vehicle handling can be represented by road holding, i.e., the ability of the suspension to control the motion of unsprung masses to maintain firm contact with the road [
1]. The passive suspension is the traditional arrangement used in most production vehicles—it consists of a spring and damper of fixed spring constant and damping coefficient, respectively [
2]. The popularity of the passive suspension lies in its simplistic design, reliability, and no external power requirements. However, the use of a constant damping coefficient limits the optimisation of a passive suspension to achieve simultaneous improvement in comfort and handling [
3]. As comfort (body isolation) is improved via adjustment of the damping coefficient, axle response and road-to-wheel contact (vehicle handling) can become worse [
4]. Therefore, a trade-off in comfort or handling has to be made when choosing a single damping coefficient value for the passive suspension system. Therefore, the design and tuning of a passive suspension involves finding the best single compromise between the conflicting goals of comfort and handling [
2].
As such, the optimal solution is a suspension system that can adjust its parameters to suit the variations in operating conditions, i.e., an adjustable suspension is required to facilitate the various road disturbances encountered, whereby an ideal unique response is required for each different disturbance. The solution is realised in terms of the semi-active and fully active suspension systems [
5]. A semi-active suspension is similar to the passive design since there is a fixed spring constant; however, an electronically controlled variable damper is used to adjust the damping coefficient in a closed-loop feedback configuration [
2]. Using an appropriate control strategy, the semi-active suspension can reduce the compromise found in the passive suspension, resulting in optimised comfort and handling regardless of the road surface [
6]. Active suspension systems provide an additional force (energy) input to the traditional passive system by means of an actuator which is usually installed in parallel with the spring and damper. The supply of force is regulated by a suitable control strategy that uses information from vehicle sensors [
7]. Generally, the fully active suspension design can give the best performance over a wide range of road conditions out of all three suspension types, but it is also the most complex, is costly, and has a high energy demand [
5]. It follows that semi-active suspensions have been commercially favoured by automotive OEMs since the 1990s due to their ability to offer the best compromise of performance (comfort and handling) and cost (in terms of power consumption, weight, and power requirements) as compared to the active suspension. The MagneRide suspension is one such semi-active setup that has been used commercially by OEMs such as Cadillac and Land Rover since the 2000s [
8].
The research on controlled suspension systems is both vast and extensive, with numerous studies using experimental or simulation methods to investigate and improve the performance and control of both semi-active and full active suspension systems. Using MATLAB/Simulink, Gowda and Chakrasali [
9] modelled and observed the performance of semi-active and passive suspension systems controlled using P, PD, PI, and PID controllers, all of which were tuned using the trial and error method. The sprung mass displacement response was analysed for each road profile and used as an indicator of comfort and handling. The PID-controlled semi-active suspension offered the best comfort and handling performance when tested for three different road profiles.
Jamil et al. [
5] investigated the performance of semi-active suspensions by performing a simulated comparison between a quarter car PID-controlled semi-active suspension and a standard passive suspension, modelled in MATLAB/Simulink. The trial-and-error method was used for tuning the PID controller, and response plots for sprung mass displacement and suspension working space were obtained for three different road profiles and were used as indicators of ride comfort and stability. Based on results obtained in [
5], it was concluded that the addition of an active damping element can greatly enhance ride comfort and vehicle stability, especially over rough and uneven road surfaces.
Rashid et al. [
10] investigated the performance of different control strategies used in a semi-active suspension system (PID, fuzzy logic, and fuzzy-hybrid) in order to improve ride comfort and handling. The semi-active suspension was implemented with a controllable MR damper, and it was found that a semi-active suspension can effectively improve ride comfort and vehicle handling whereby the fuzzy and fuzzy-hybrid controllers’ performances were noticeably better than that of the PID controller.
Phalke and Mitra [
11] compared the performance of semi-active and passive quarter car suspension systems by simulating the response of the systems to different vehicle velocities of a half sine wave bump and for different road profiles, using MATLAB/Simulink. It was found that changing the vehicle velocity for the half-sine wave bump input affected the peak amplitude and settling time of the response plots for both the semi-active and passive suspensions. Furthermore, for the other road profiles, improved performance was noted using the PID-controlled semi-active suspension as opposed to the passive suspension. However, the response plots used in the study were only based on the sprung mass displacement, and little detail was provided on the PID gain values used as well as the tuning process. Nevertheless, Phalke and Mitra [
11] reached similar conclusions to the other researchers by stating that the use of a semi-active suspension can significantly improve ride comfort and road holding for different road profiles and vehicle velocities compared to a passive setup.
In [
12], MATLAB/Simulink was used to investigate active quarter car suspensions controlled with P, PI, PID, Genetic Algorithm (GA)-PID, and Auto-tuned PID controllers. The root curve seat method was used for the tuning of P, PI, and PID controllers. It was found that the PID controller produced a better performance than the P and PI variations, similar to the findings in [
8]. Further investigation showed that increased performance was achieved with the Auto-tuned and GA-PID controller. However, in [
12], only one road profile and response plot (suspension working space) was used in analysing the behaviour of the suspension systems.
Matrood and Nassar [
13] modelled and compared a passive suspension system to an active suspension system using a modified PID controller in MATLAB/Simulink. The modified PID controller had the proportional and derivative terms in the feedback path, while the integral term was left in the forward path. The controller was tuned using the trial and error method, and a range of response plots (sprung mass displacement, acceleration, velocity, suspension working space) was used to evaluate vehicle handling and ride comfort. Based on the results obtained in [
13], the proposed modified PID controller offered significant improvements over both the conventional PID controller and the passive suspension system, which, in turn, reflected improvements in car stability and comfort of passengers. However, only a single road profile was used in simulation testing. Sun et al. [
14] proposed an (ARC)-based H-infinity controller for an active suspension in order to improve ride comfort and to reduce vibrations. A full car model was used, and the active suspension was modelled with electrohydraulic actuators to represent the non-linear characteristics. It was seen that the proposed active suspension significantly improved passenger ride comfort over a traditional passive suspension. In [
15], a PID-controlled active suspension for a quarter car model was designed in MATLAB/Simulink in order to improve suspension performance over a traditional passive system. The PID controller was tuned using the Ziegler and Nichols method, and response plots of sprung mass displacement and acceleration, suspension working space, and tyre deflection were analysed. It was concluded that the active suspension had better performance capabilities than the passive suspension in terms of ride comfort and road-holding ability [
15]. The suspension systems were tested under two different road profiles (step input and random road input), but only the peak amplitudes of the response plots were compared. Moreover, other researchers, such as Samaroo et al. [
16], Zhang et al. [
17], and Qin et al. [
18], have utilised controlled suspension systems, namely semi-active suspension systems, as an optimisation technique to improve the suspension performance of in-wheel motor electric vehicles, solving one of their main drawbacks.
As seen, there is a wide range of research that quantifies the performance improvement when using controlled suspensions systems. However, in all the studies highlighted [
5,
9,
10,
11,
12,
13,
14,
15], researchers chose to focus the optimisation and comparison effort on either semi-active or active suspensions but never both systems at the same time in a single testing environment. Furthermore, previous work on the topic of controlled suspensions lacked comprehensiveness in terms of using multiple road profile inputs, a detailed performance criteria, and a range of response plots for analyses. This is an important area of further research in order to quantify and observe the trends of both the semi-active and active suspensions, which can then influence the choice of a controlled suspension system suitable for particular applications.
As such, the aim of this study is to investigate controlled suspension systems by modelling and tuning both a semi-active and fully active suspension, using a PID controller, in order to achieve optimised comfort and handling. The performances of the controlled suspension systems are then compared to a traditional passive setup. The current study uses a linear two-degree-of-freedom lumped element quarter car model, with vertical motion only. PID control was employed in both the semi-active and fully active suspension systems due to its wide industry usage as well as simplicity. Furthermore, simulated testing of the suspension systems was carried out in MATLAB/Simulink for three common road profiles/conditions a vehicle might undergo in a real-world scenario. Moreover, the sprung mass acceleration as well as sprung mass displacement w used as indicators of ride comfort based on [
2,
4,
19], whilst tyre deflection was used as a measure of road-holding ability (vehicle handling) based on [
4,
20]. Suspension working space was also analysed as it formed an important consideration when compromising between ride comfort and handling, based on [
21].
2. Methodology
2.1. Suspension Performance Criteria
Firstly, the suspension performance criteria for the evaluation of the passive, semi-active, and fully active suspensions were derived. The criteria are expressed as follows:
In the minimisation problem, and represent sprung mass acceleration and sprung mass displacement, respectively, which are both indicators of ride comfort. represents tyre deflection and is an indicator of road holding ability. is the suspension working space whereby precise limits for the suspension working space were not defined, but instead, the suspension working space response was simply analysed due to variations in the vehicle applications and design.
2.2. Road Profile Modelling
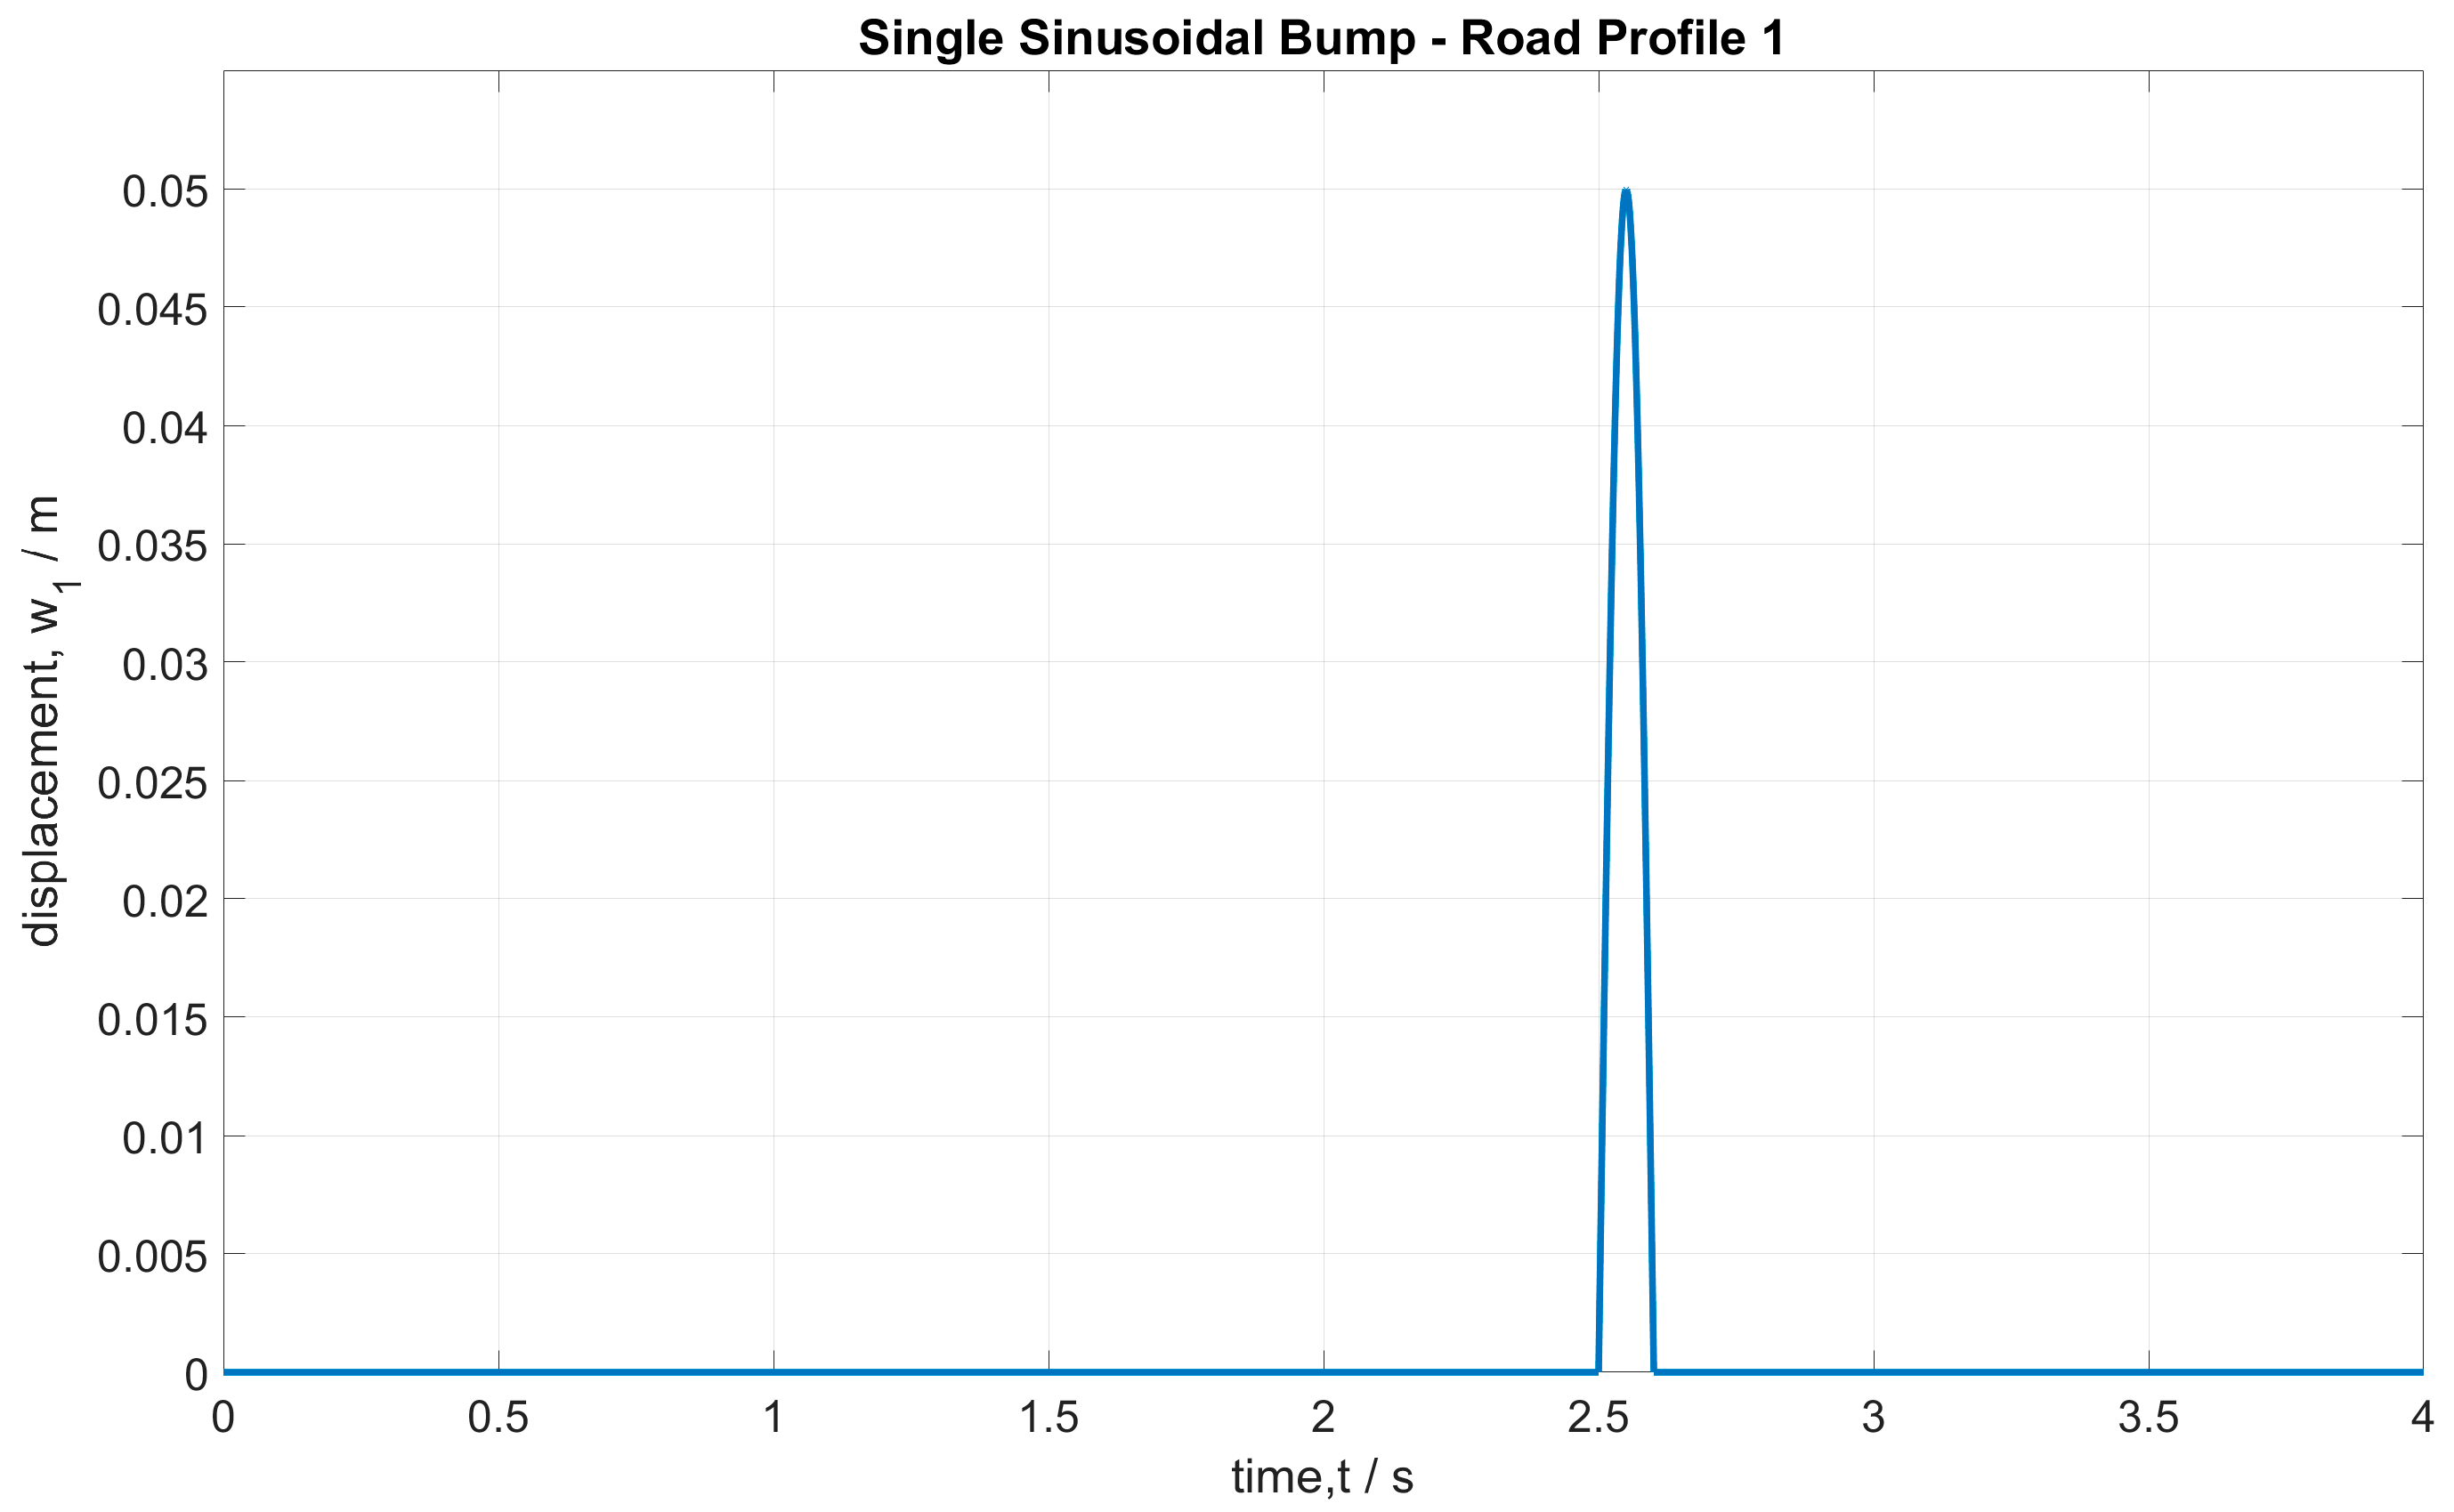
Road profile inputs were chosen based on common disturbances a vehicle might undergo in real-world usage. As such, road profile 1 models a simple sinusoidal bump, and road profile 2 models a vehicle mounting a typical curb height at a speed which qualifies it as an extreme circumstance. Road profile 3 models repeated sinusoidal bumps in order to test the response of the suspension systems under multiple, consecutive disturbance inputs.
Road profile 1 is a single sinusoidal bump, as indicated by Equation (2):
where
represents a road bump profile for a vehicle speed of 18 km/h, assuming a bump size (length) of 0.5 m and duration of 0.1 s, as shown in
Figure 1.
Road profile 2 is a 0.15 m sudden step, as indicated by Equation (3):
where
is a sudden step input of a height of 0.15 m, simulating the vehicle mounting a typical curb height, as shown in
Figure 2.
Road Profile 3 is consecutive bumps of increasing amplitude, as indicated by Equation (4):
where
simulates repeated speed bumps for a vehicle speed of 18 km/h, assuming a bump size (length) of 0.5 m and duration of 0.1 s, as shown in
Figure 3.
2.3. Passive Suspension System and Semi-Active Suspenion System Modelling
Mathematical equations were derived from first principles to describe the response of the passive suspension system under forced vibration.
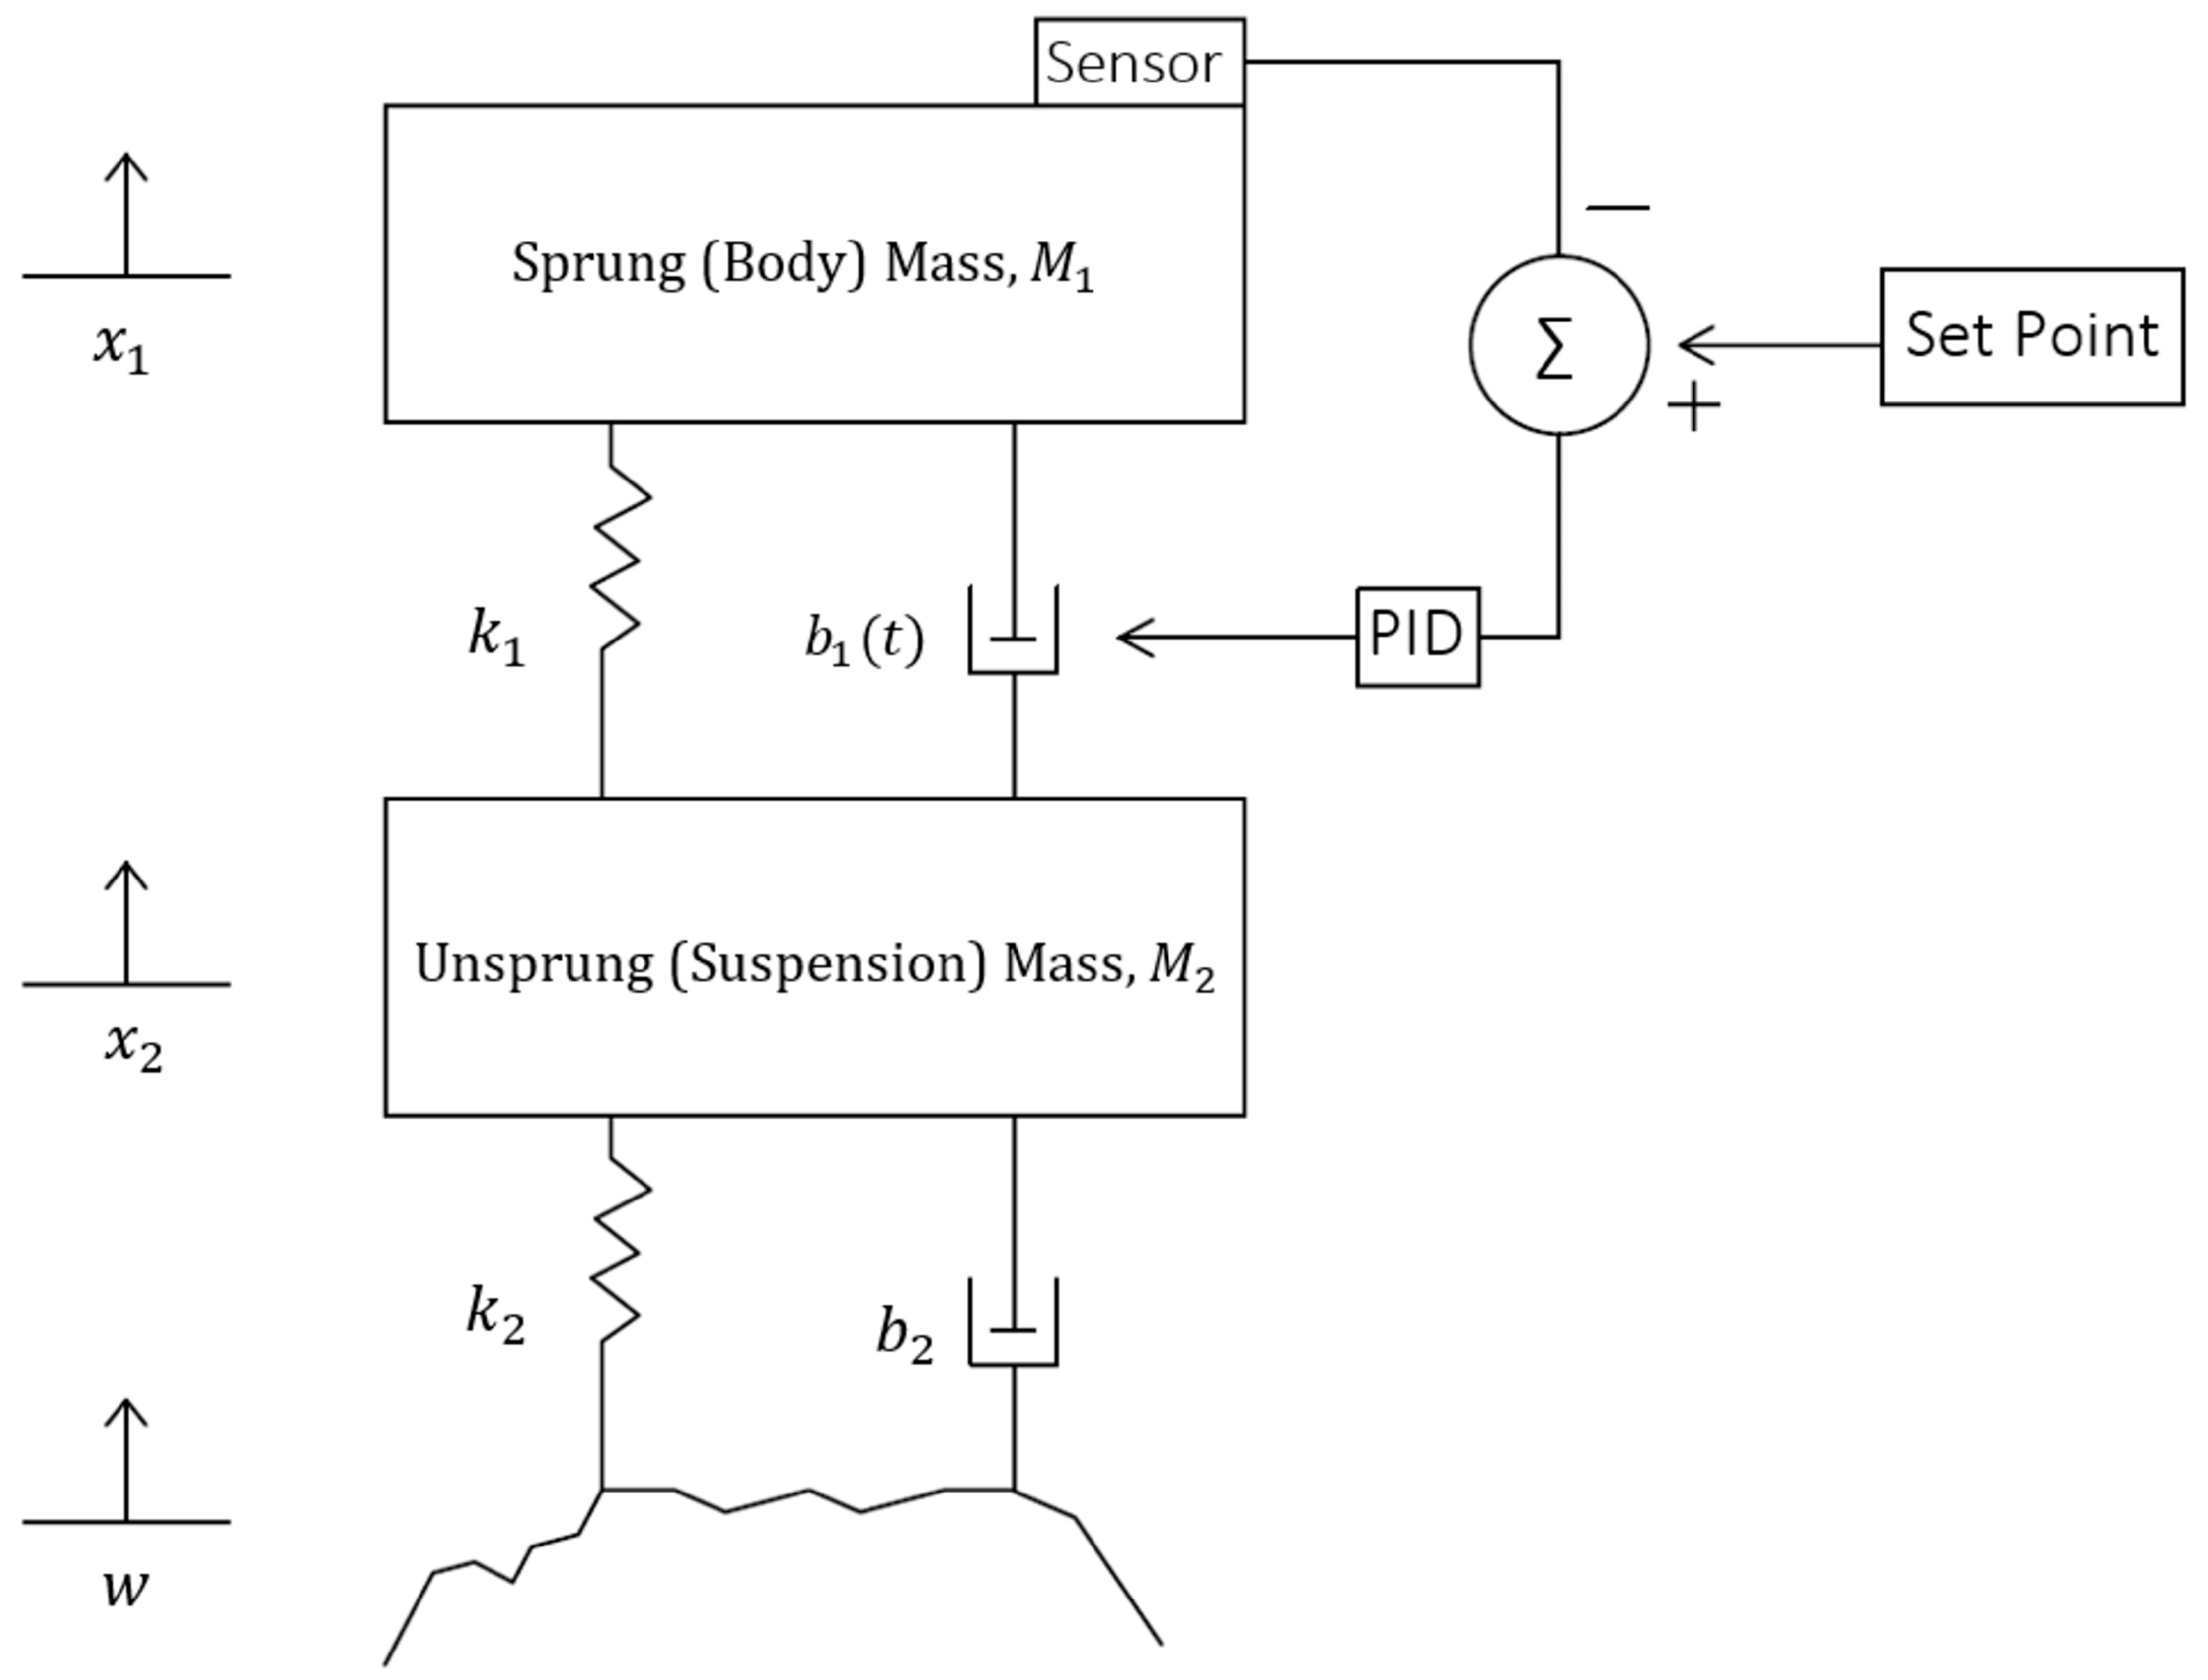
The quarter car passive suspension system is represented as a damped two-degree-of-freedom spring mass system under a forced vibration described by the displacement of the sprung and unsprung masses,
and
, respectively, and input road displacement
, as shown in
Figure 4.
Applying Newton’s 2nd law,
Equations (5) and (6) are derived by considering the forces acting on the sprung mass, , and unsprung mass, , respectively.
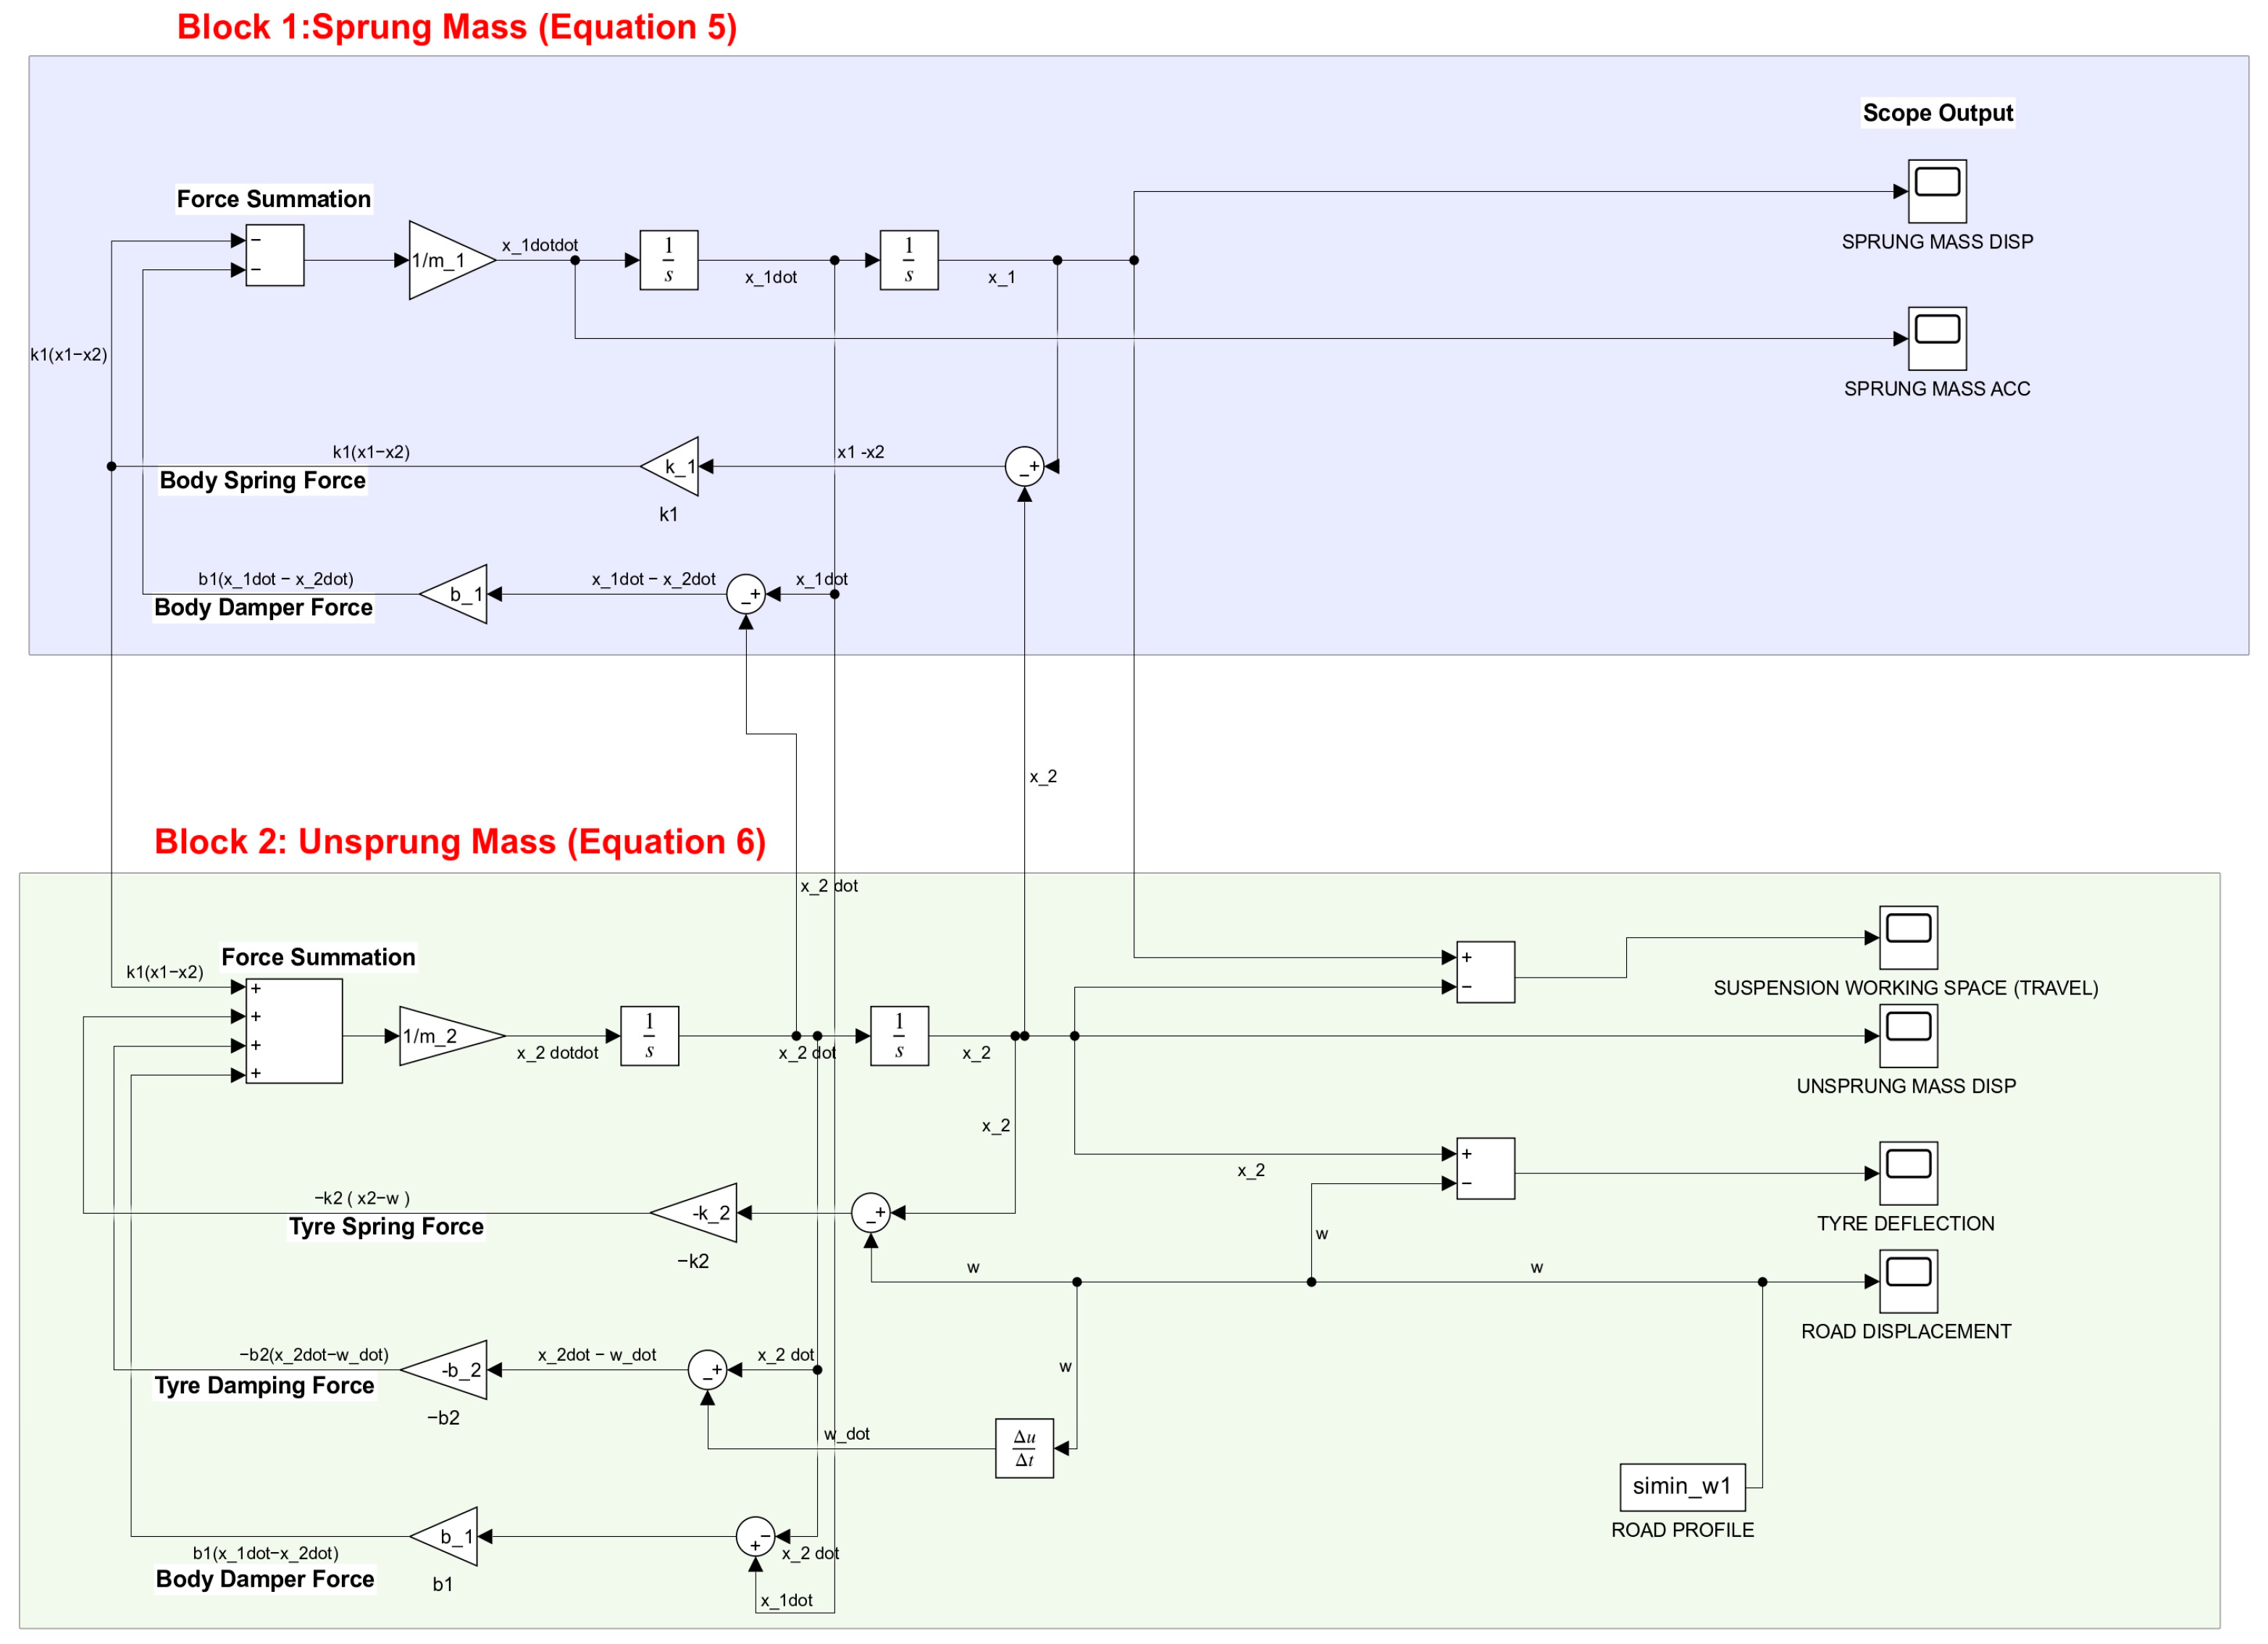
The semi-active suspension system was developed by the implementation of a PID closed feedback loop on the original passive system.
Figure 5 shows the block diagram of the semi-active suspension system that contains a PID feedback loop and the variable damper
.
Figure 6 highlights the input and output parameters of the PID controller in the feedback control loop. The output of the PID controller is equal to the control input
for the quarter car suspension system. The control input, or variable damping coefficient,
, is therefore the sum of the proportional control, integral control, and derivative control terms, which act on the error signal
. This is represented mathematically in Equation (7), as follows:
2.4. Fully Active Suspension System Mathematical Modelling
Figure 7 highlights the quarter car model of the fully active suspension system that was used to derive the time domain equations of the fully active suspension system. As seen in
Figure 7, a variable force actuator,
, was used as opposed to the variable damper,
, of the semi-active suspension. Note that the passive spring and damper were still maintained in the fully active suspension.
Applying Newton’s 2nd Law,
Equations (8) and (9) are derived by considering the forces acting on the sprung mass, , and unsprung mass, , respectively.
With a control input of
, the subsequent control output,
, of the PID controller in the fully active suspension system was given by the following:
In Equation (10), is the sum of the proportional control, integral control, and derivative control terms that act on the error signal . Tuning of the controller gains, , , is required to achieve the desired output response for .
4. Results
As outlined previously, the design goal for the semi-active and fully active suspensions was to minimise sprung mass acceleration, sprung mass displacement, and tyre deflection. In analysing the response plots, parameters such as peak amplitude, settling time, and general shape/behaviour of the trace were taken into consideration. As such, the minimisation goal was achieved by the reduction of peak amplitudes, settling time, and by having a response shape that stayed tight to the equilibrium position. In this regard, the rms value was used to quantify the average magnitude of the response where relevant.
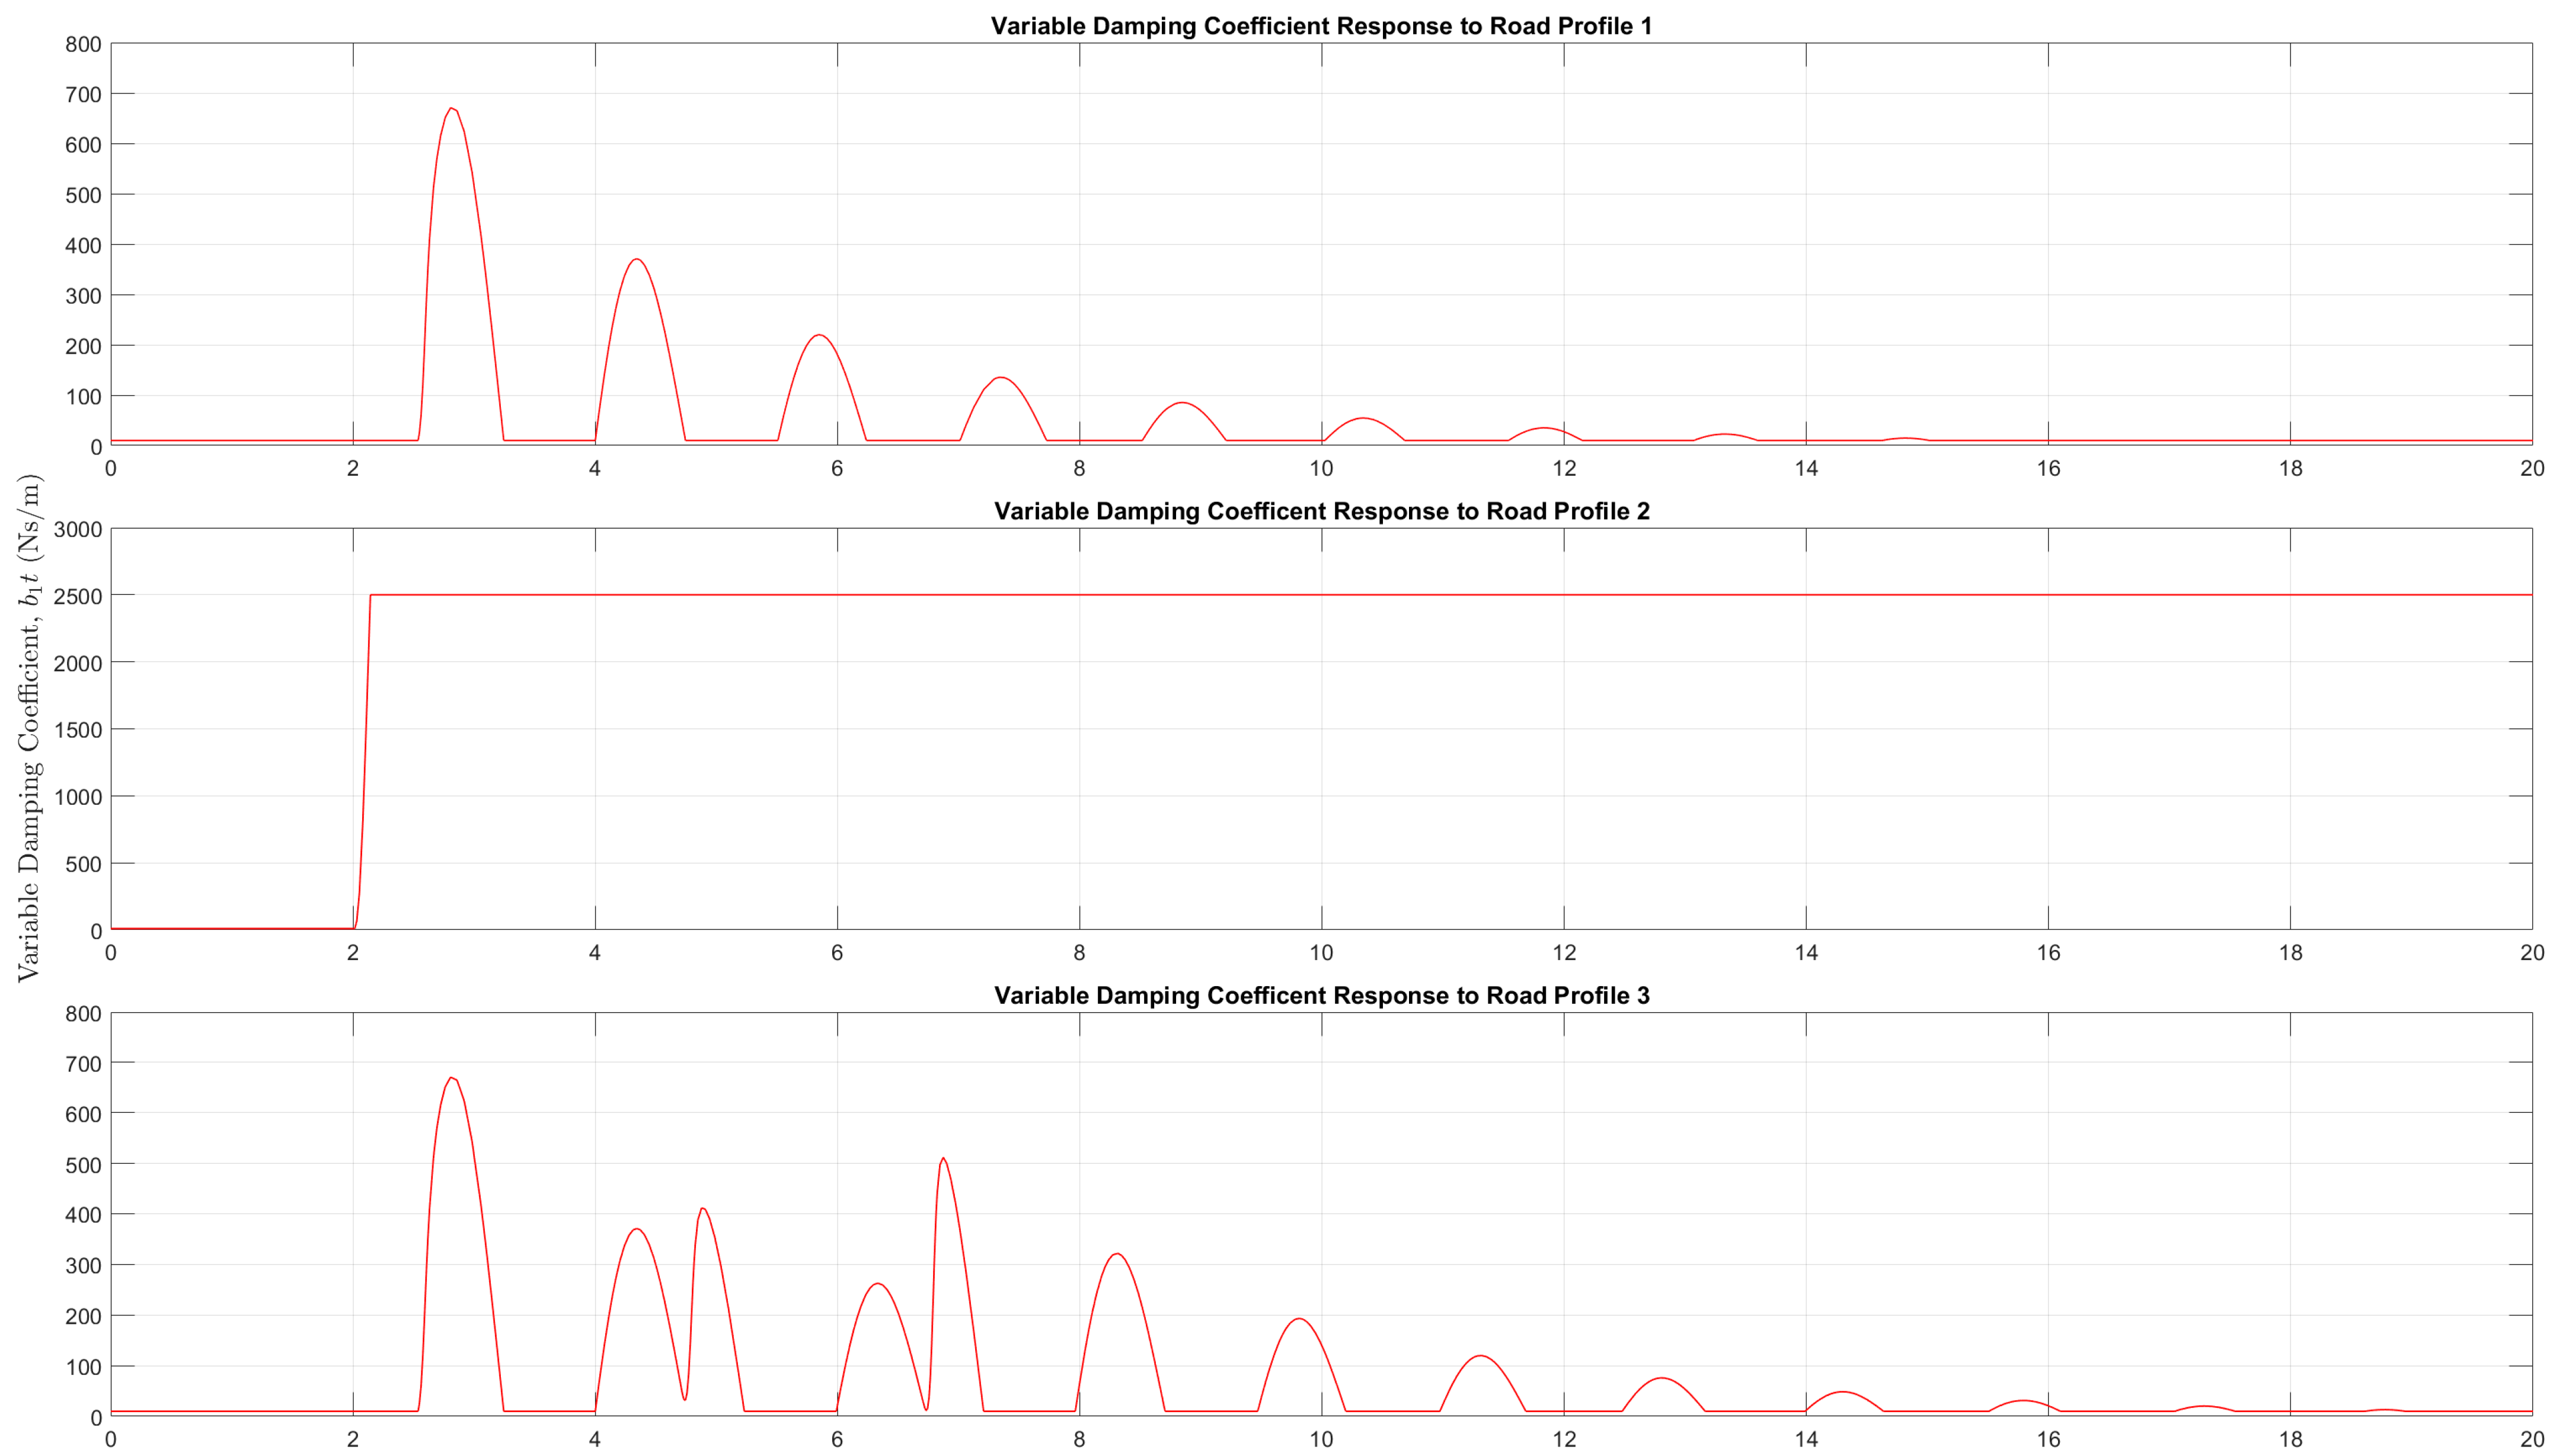
Figure 13 compares the sprung mass displacement of the suspension systems for each of the three road profiles. For road profiles 1, 2, and 3, it can be seen that the semi-active and fully active suspensions offered notable reductions of peak amplitudes and faster settling times over the passive suspension system in terms of sprung mass displacement, which would indicate an increased level of ride comfort. More specifically, for road profile 1, there was a 44% and 56% reduction of the passive rms displacement when using the semi-active and fully active suspensions, respectively. In road profile 2, the responses of the semi-active suspension and fully active suspension were near identical and eliminated the overshoot and oscillations seen in the passive suspension response. The variable damping coefficient response in
Figure 10 and the actuator force response in
Figure 11 show that the semi-active and fully active suspensions reached saturation limits at 2500 Ns/m and 500 N, respectively, in order to reduce the displacement. Ideally, a wider operating limit beyond −500 N ≤
(
t) ≤ 500 N for the force actuator could lead to improved performance particularly in an extreme road disturbance; however, this value has to be limited due to safety considerations and also due to power restrictions of a fully active setup.
For road profile 3, the semi-active suspension offered the best performance with a 32% reduction in rms displacement compared to the passive suspension, whilst the fully-active suspension offered a 26% reduction in rms displacement. In general, it was observed that, across all road profiles, the fully active suspension produced a less oscillatory response that returned quickly to equilibrium compared to the semi-active suspension. This may be explained by the fact that the fully active suspension introduces an active energy into the system in the form of a force, which stabilises the system response as opposed to the semi-active suspension, which simply adjusts the damping coefficient. This theory is further supported by the variable damping coefficient response and force actuator response seen in
Figure 10 and
Figure 11, respectively.
Figure 14 compares the sprung mass acceleration of the suspension systems for each of the three road profiles. For all road profiles, the semi-active and fully active suspensions displayed similar performances in terms of reduced peak amplitude and slightly faster settling time over the passive suspension system. Whilst similar, the semi-active suspension actually offered a slightly greater performance over the active setup. For example, in road profile 1, the semi-active suspension offered a 39% reduction in rms sprung mass acceleration over the passive setup compared to the 27% reduction of the fully active suspension. In road profiles 2 and 3, the semi-active suspension reduced the rms sprung mass acceleration of the passive setup by 65% and 32%, respectively, whilst the fully active suspension reduced the passive rms sprung mass acceleration by 40% and 26%, respectively. Furthermore, as observed in the sprung mass displacement, the fully active suspension returned quickly to equilibrium with less oscillations than the semi-active suspension. Based on the sprung mass acceleration response, it can be said that the semi-active and fully active suspensions displayed improved levels of comfort over the passive suspension, with the semi-active suspension had a slightly greater performance than the fully active setup.
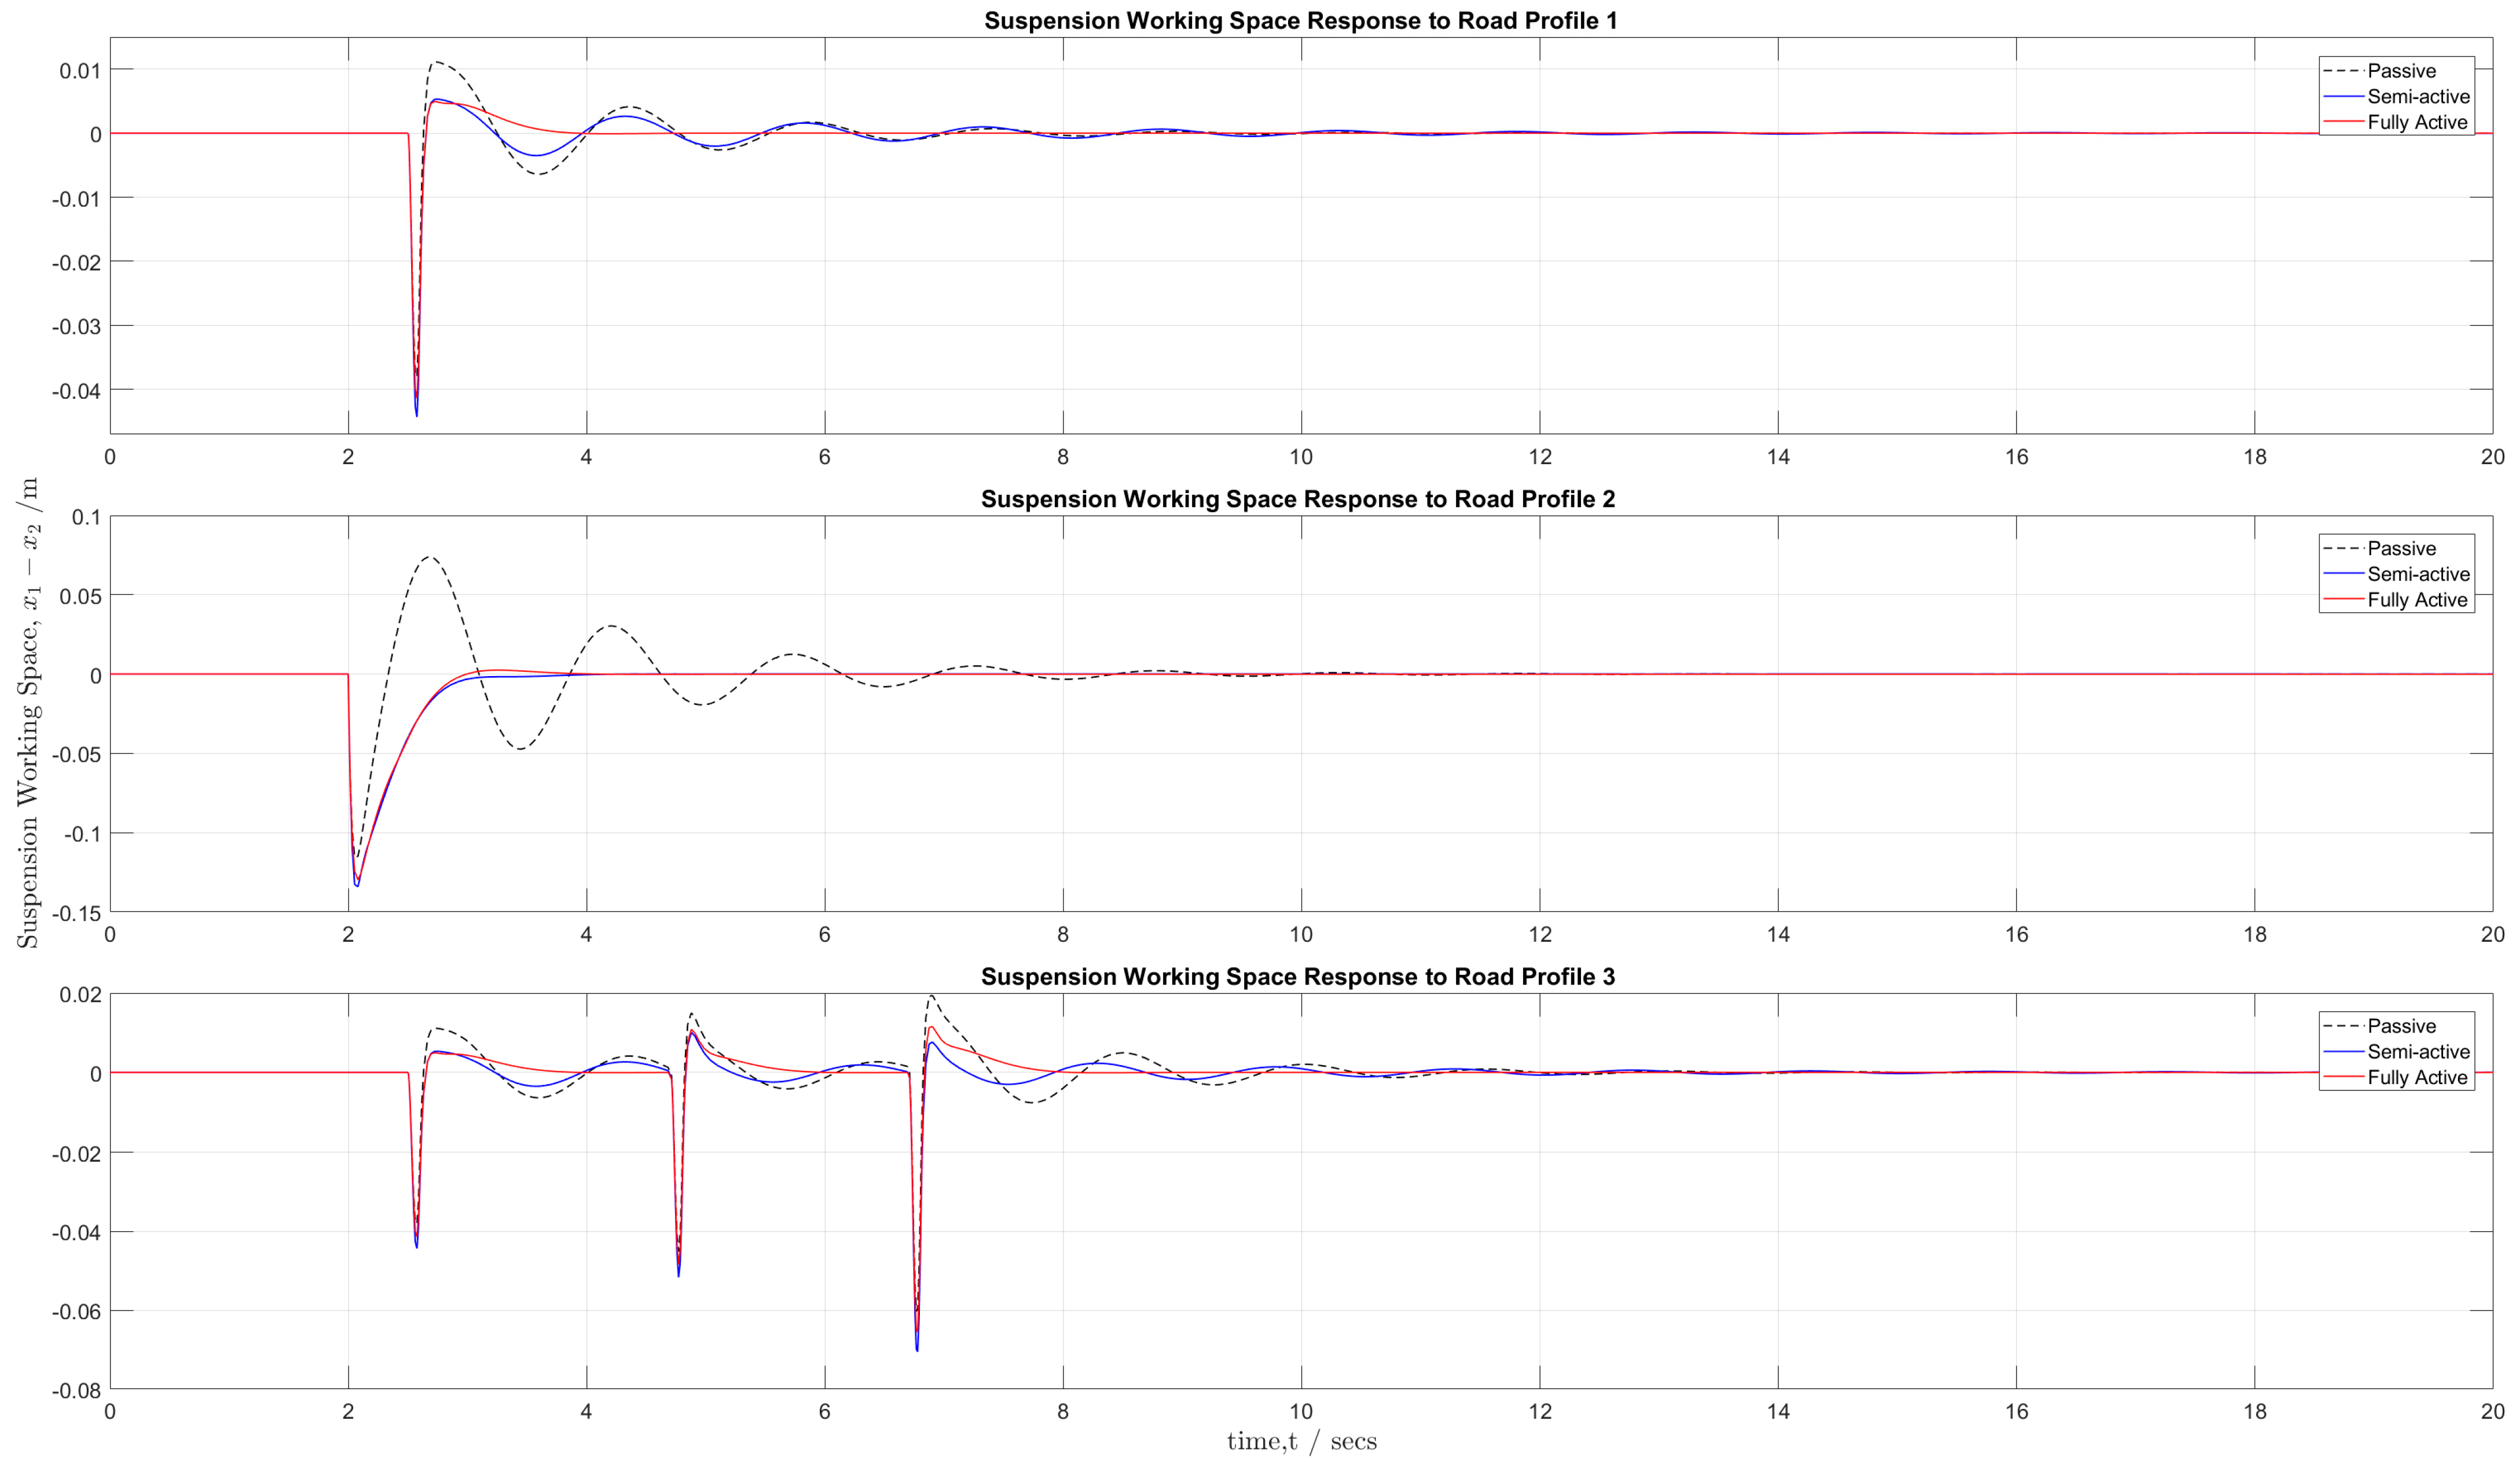
Figure 15 compares the suspension working space of the passive, active, and semi-active suspension systems for each of the three road profiles. In this case, only the peak amplitude of the working space response was of interest since it would need to be accommodated in the vehicle design. For all three road profiles, the semi-active and fully active suspensions increased the peak suspension working space by a maximum of 17% and 9%, respectively, over the passive suspension system, which represented a decreased level of performance.
Figure 16 compares the tyre deflection responses of the suspension systems for each of the three road profiles. Across all three road profiles, the semi-active and fully active suspensions had quite similar responses in terms of noticeably higher peak amplitudes of tyre deflection than the passive suspension system, but it had improvements of slightly lower settling times and less overshoot. This resulted in both the fully active and semi-active suspensions offering only a 6% reduction of rms tyre deflection compared to the passive suspension system, which represents a marginal improvement in road-holding ability.

 ,
, 


