Article

Divergence Shepherd Feature Optimization-Based Stochastic-Tuned Deep Multilayer Perceptron for Emotional Footprint Identification

by
Karthikeyan Jagadeesan
* and
Annapurani Kumarappan
Department of Networking and Communications, School of Computing, SRM Institute of Science and Technology, Kattankulathur, Chennai 603203, India
*
Author to whom correspondence should be addressed.
Algorithms 2025, 18(12), 801; https://doi.org/10.3390/a18120801
Submission received: 28 October 2025 / Revised: 5 December 2025 / Accepted: 11 December 2025 / Published: 17 December 2025

Abstract

Emotional Footprint Identification refers to the process of recognizing or understanding the emotional impact that a person, experience, or interaction leaves on others. Emotion Recognition plays an important role in human–computer interaction for identifying emotions such as fear, sadness, anger, happiness, and surprise on the human face during the conversation. However, accurate emotional footprint identification plays a crucial role due to the dynamic changes. Conventional deep learning techniques integrate advanced technologies for emotional footprint identification, but challenges in accurately detecting emotions in minimal time. To address these challenges, a novel Divergence Shepherd Feature Optimization-based Stochastic-Tuned Deep Multilayer Perceptron (DSFO-STDMP) is proposed. The proposed DSFO-STDMP model consists of three distinct processes namely data acquisition, feature selection or reduction, and classification. First, the data acquisition phase collects a number of conversation data samples from a dataset to train the model. These conversation samples are given to the Sokal–Sneath Divergence shuffling shepherd optimization to select more important features and remove the others. This optimization process accurately performs the feature reduction process to minimize the emotional footprint identification time. Once the features are selected, classification is carried out using the Rosenthal correlative stochastic-tuned deep multilayer perceptron classifier, which analyzes the correlation score between data samples. Based on this analysis, the system successfully classifies different emotions footprints during the conversations. In the fine-tuning phase, the stochastic gradient method is applied to adjust the weights between layers of deep learning architecture for minimizing errors and improving the model’s accuracy. Experimental evaluations are conducted using various performance metrics, including accuracy, precision, recall, F1 score, and emotional footprint identification time. The quantitative results reveal enhancement in the 95% accuracy, 93% precision, 97% recall and 97% F1 score. Additionally, the DSFO-STDMP minimized the in training time by 35% when compared to traditional techniques.

1. Introduction

Emotion footprint recognition focuses on detecting the emotions conveyed through each utterance within conversational contexts. Due to the rapid growth of the digital world, identifying human emotions has become vital across different applications. These emotional traces or footprints are captured through various modalities such as text, speech, facial expressions, physiological signals, and behavioral data. Detection of Emotion footprint using conventional machine learning (ML) and deep learning techniques has gained significant attention for analyzing structured data samples and offering decision support. However, they face several limitations for accurate Emotion footprint identification.
Emotional Voice Conversion with Emotion Intensity Control (EMOVOX) was introduced in [1] to detect and regulate fine-grained emotion intensity while reducing emotion classification loss. However, the model was not efficient in minimizing the training time for emotion intensity prediction during conversations. The Spectral Domain Reconstruction Graph Neural Network (SDR-GNN) was proposed in [2] for accurate emotion recognition in conversations by modeling utterance-level semantic interactions based on both speaker and contextual relationships. Though the model effectively reduces training time and error rate, performance in terms of precision and recall was not evaluated.
A Graph-Spectrum-based learning framework was introduced in [3] for emotion recognition by employing a sliding window approach and analyzing conversational relationships. While the model successfully reduces loss and training time, achieving higher accuracy remains a significant concern. The emotion–cause pair extraction in conversation (ECPEC) model was developed in [4], with the intent to extract pairs of emotional utterances within conversations. However, the model did not efficiently minimize the training time. A new cross-speaker emotion transfer system was designed in [5] for accurately predicting the emotion intensity and extracting the identity of emotion type. However, the more optimal feature selection was a major issue for accurate emotion identification. In order to extract salient features, Kernel Principal Component Analysis (K-PCA) was designed in [6], aiming to obtain meaningful attributes for accurate multimodal emotion recognition. However, the K-PCA was more time-consuming and had a high computational cost, especially in large datasets. The CNN classifier model was introduced in [7] for emotional speech recognition based on feature extraction and minimizing the error rate. However, fine-tuning of the CNN model remained unaddressed.
A deep neural network model was proposed in [8] for emotion recognition during speech conversations by leveraging both textual and audio features. However, the model was limited in its capability to recognize a limited set of emotion classes. A Masked Graph Learning with Recursive Alignment (MGLRA) model was designed in [9] to enhance the emotion recognition by extracting the multimodal features. However, it failed to optimize multimodal fusion and semantic information arrangement for accurate emotion recognition. A multi-task graph neural network was introduced in [10] for emotion recognition within conversations by extracting the semantic information and obtaining discriminative feature representations. However, the network failed to focus on applying larger datasets to validate the model’s ability in terms of achieving high accuracy and minimal time complexity. A graph neural network was introduced in [11] that utilizes an LSTM for accurate emotion recognition during the speech conversation. The model failed to address the issue of redundant feature elimination to further reduce the requirement of size and optimize the model. A lightweight, compact one-dimensional deep convolutional neural network was introduced in [12] to minimize the computational complexity of emotion recognition by extracting the relevant speech features.
A lightweight deep neural ensemble model was designed in [13] with the intent of automatic emotion detection by using handcrafted features. However, it failed to explore advanced models for the automated extraction of audio speech features integrated with the robust classification method to accurately classify the speech emotions. A multimodal conversational emotion recognition method was designed in [14] by combining text and audio features to improve the accuracy and robustness of emotion recognition. However, the time complexity of the method was high. An audio-based emotion recognition model was developed in [15] using a recurrent neural network (RNN). However, the model imposes a high computational burden during emotion recognition.

1.1. Motivation

Emotion recognition is an important part in human–computer interaction (HCI) schemes. Emotion recognition aims to recognize emotions in text, audio, image, and video. Emotions are identified from the posture of the human body, facial expressions, and speech. It is employed in numerous fields, namely medical diagnosis, opinion mining, fake news detection, and dialog generation to offer high-quality and humanized empathetic services. Several DL methods have been developed for emotion identification. But precise emotional footprint identification was a demanding task, owing to the dynamic changes in emotion and high computation time. To overcome this issue, DSFO-STDMP is designed to exactly determine emotions in less time.

1.2. Major Contributions

To overcome the issues, a DSFO-STDMP is introduced, with the following novel contributions as follows:
To enhance the accuracy of emotion footprint identification, a novel DSFO-STDMP model has been developed by including two processes: feature selection and classification.
To minimize the emotion footprint identification time, the DSFO-STDMP model executes a feature selection process by applying a shuffling shepherd optimization. To enhance the performance of optimization, the Sokal–Sneath similarity index and Jensen Jensen–Shannon divergence function are applied. This helps to minimize the dimensionality by reducing the redundant features.
To improve the precision and recall, a Rosenthal correlative stochastic-tuned deep multilayer perceptron classifier is used to analyze the correlation between data samples. Based on this analysis, different emotional footprints are correctly classified. In the fine-tuning phase, the stochastic gradient method is employed to minimize error.
Extensive experimentation is carried out to estimate the performance of the PRGKDFC model and other related works with different metrics.

1.3. Organization of Paper

The structure of the DSFO-STDMP model is as follows: Section 2 describes related words. Section 3 explains the proposed DSFO-STDMP model and its main process. Section 4 outlines the experimental environment and dataset description. Section 5 offers a comparative evaluation based on various performance metrics. Finally, Section 6 summarizes the conclusion.

2. Related Works

A unique deep multimodal emotion recognition model was proposed in [16], designed to learn meaningful multimodal representations and perform emotion classification. However, the fine-tuning of the deep learning architecture was not addressed. A directed Graph-based Cross-modal Feature Complementation (GraphCFC) approach was developed in [17] for accurate emotion recognition during the conversation of speakers based on contextual and interactive information. However, the error rate was not minimized. A Residual Relation-Aware Attention (RRAA) model with Positional Encoding was introduced in [18] to enhance emotion recognition in conversations by leveraging speaker relationship context. However, the model’s performance was not improved in emotion recognition tasks due to the lack of fine-tuning mechanisms. A Graph network-based Multimodal Fusion Technique (GraphMFT) was designed in [19] for emotion recognition within conversation. However, the model failed to support multimodal dialog generation. A new framework named Fusing Pairwise Modalities was developed in [20] for multimodal fusion to enhance emotion recognition model performance. However, the framework failed to enhance efficiency and accuracy. A BLSTM network model was designed in [21] for speech emotion recognition by extracting the high-level features. However, it failed to detect emotions expressed by the speakers in each utterance of the conversation. To address these issues, Low-Rank Matching Attention Method (LMAM) was designed in [22] by utilizing the contextual emotional semantic information and reducing the complexity. However, it failed to achieve the efficient fusion of multi-modal features without losing relative information. Large-scale pretrained models were introduced in [23] for accurate emotion recognition. However, the performance of emotion recognition accuracy remained unaddressed. A Zero-shot model was developed in [24] for accurate emotion recognition. However, more optimal feature selection was required to improve the model’s performance and reduce computational complexity. The Random Forest classifier model was introduced in [25] for accurate emotion recognition based on hand-crafted features. However, the model failed to accurately minimize the error.
A self-supervised utterance order prediction model was developed in [26] for emotion recognition within conversations by learning the logical order of utterance. However, the prediction model was inefficient for large-scale data samples. A new approach was designed in [27] using CNNs for multimodal emotion recognition by integrating speech and text modalities. However, the model complexity was not reduced. A hypergraph-based method was designed in [28] for multimodal emotion recognition within conversation by extracting features from modalities. However, it failed to enhance the performance of multimodal conversation emotion analysis. A new Hierarchically Stacked Graph Convolution Framework (HSGCF) was developed in [29] for emotion recognition by extracting the emotional discriminative features. However, it failed to improve the performance of emotion recognition. The Bi-stream Graph Learning-based Multimodal Fusion (BiGMF) model was designed in [30] for emotion recognition by analyzing the context information. However, it failed to boost predictive emotion recognition accuracy.
Human emotion recognition is vital in different domains. Facial expressions play an essential role in transmitting and protecting human emotions. Visual-Geometry-Group (VGG19) and input into Long-Short-Term-Memory (LSTM) was developed in [31] for capturing spatiotemporal information, but it failed to detect several diseases. Autism diagnosis is an important healthcare issue. Fully automated DL methods were not considered. Multimodal Large Language Models (LLMs) were introduced in [32] for human annotation in AI-based autism detection. However, the accuracy was not improved.

3. Proposal Methodology

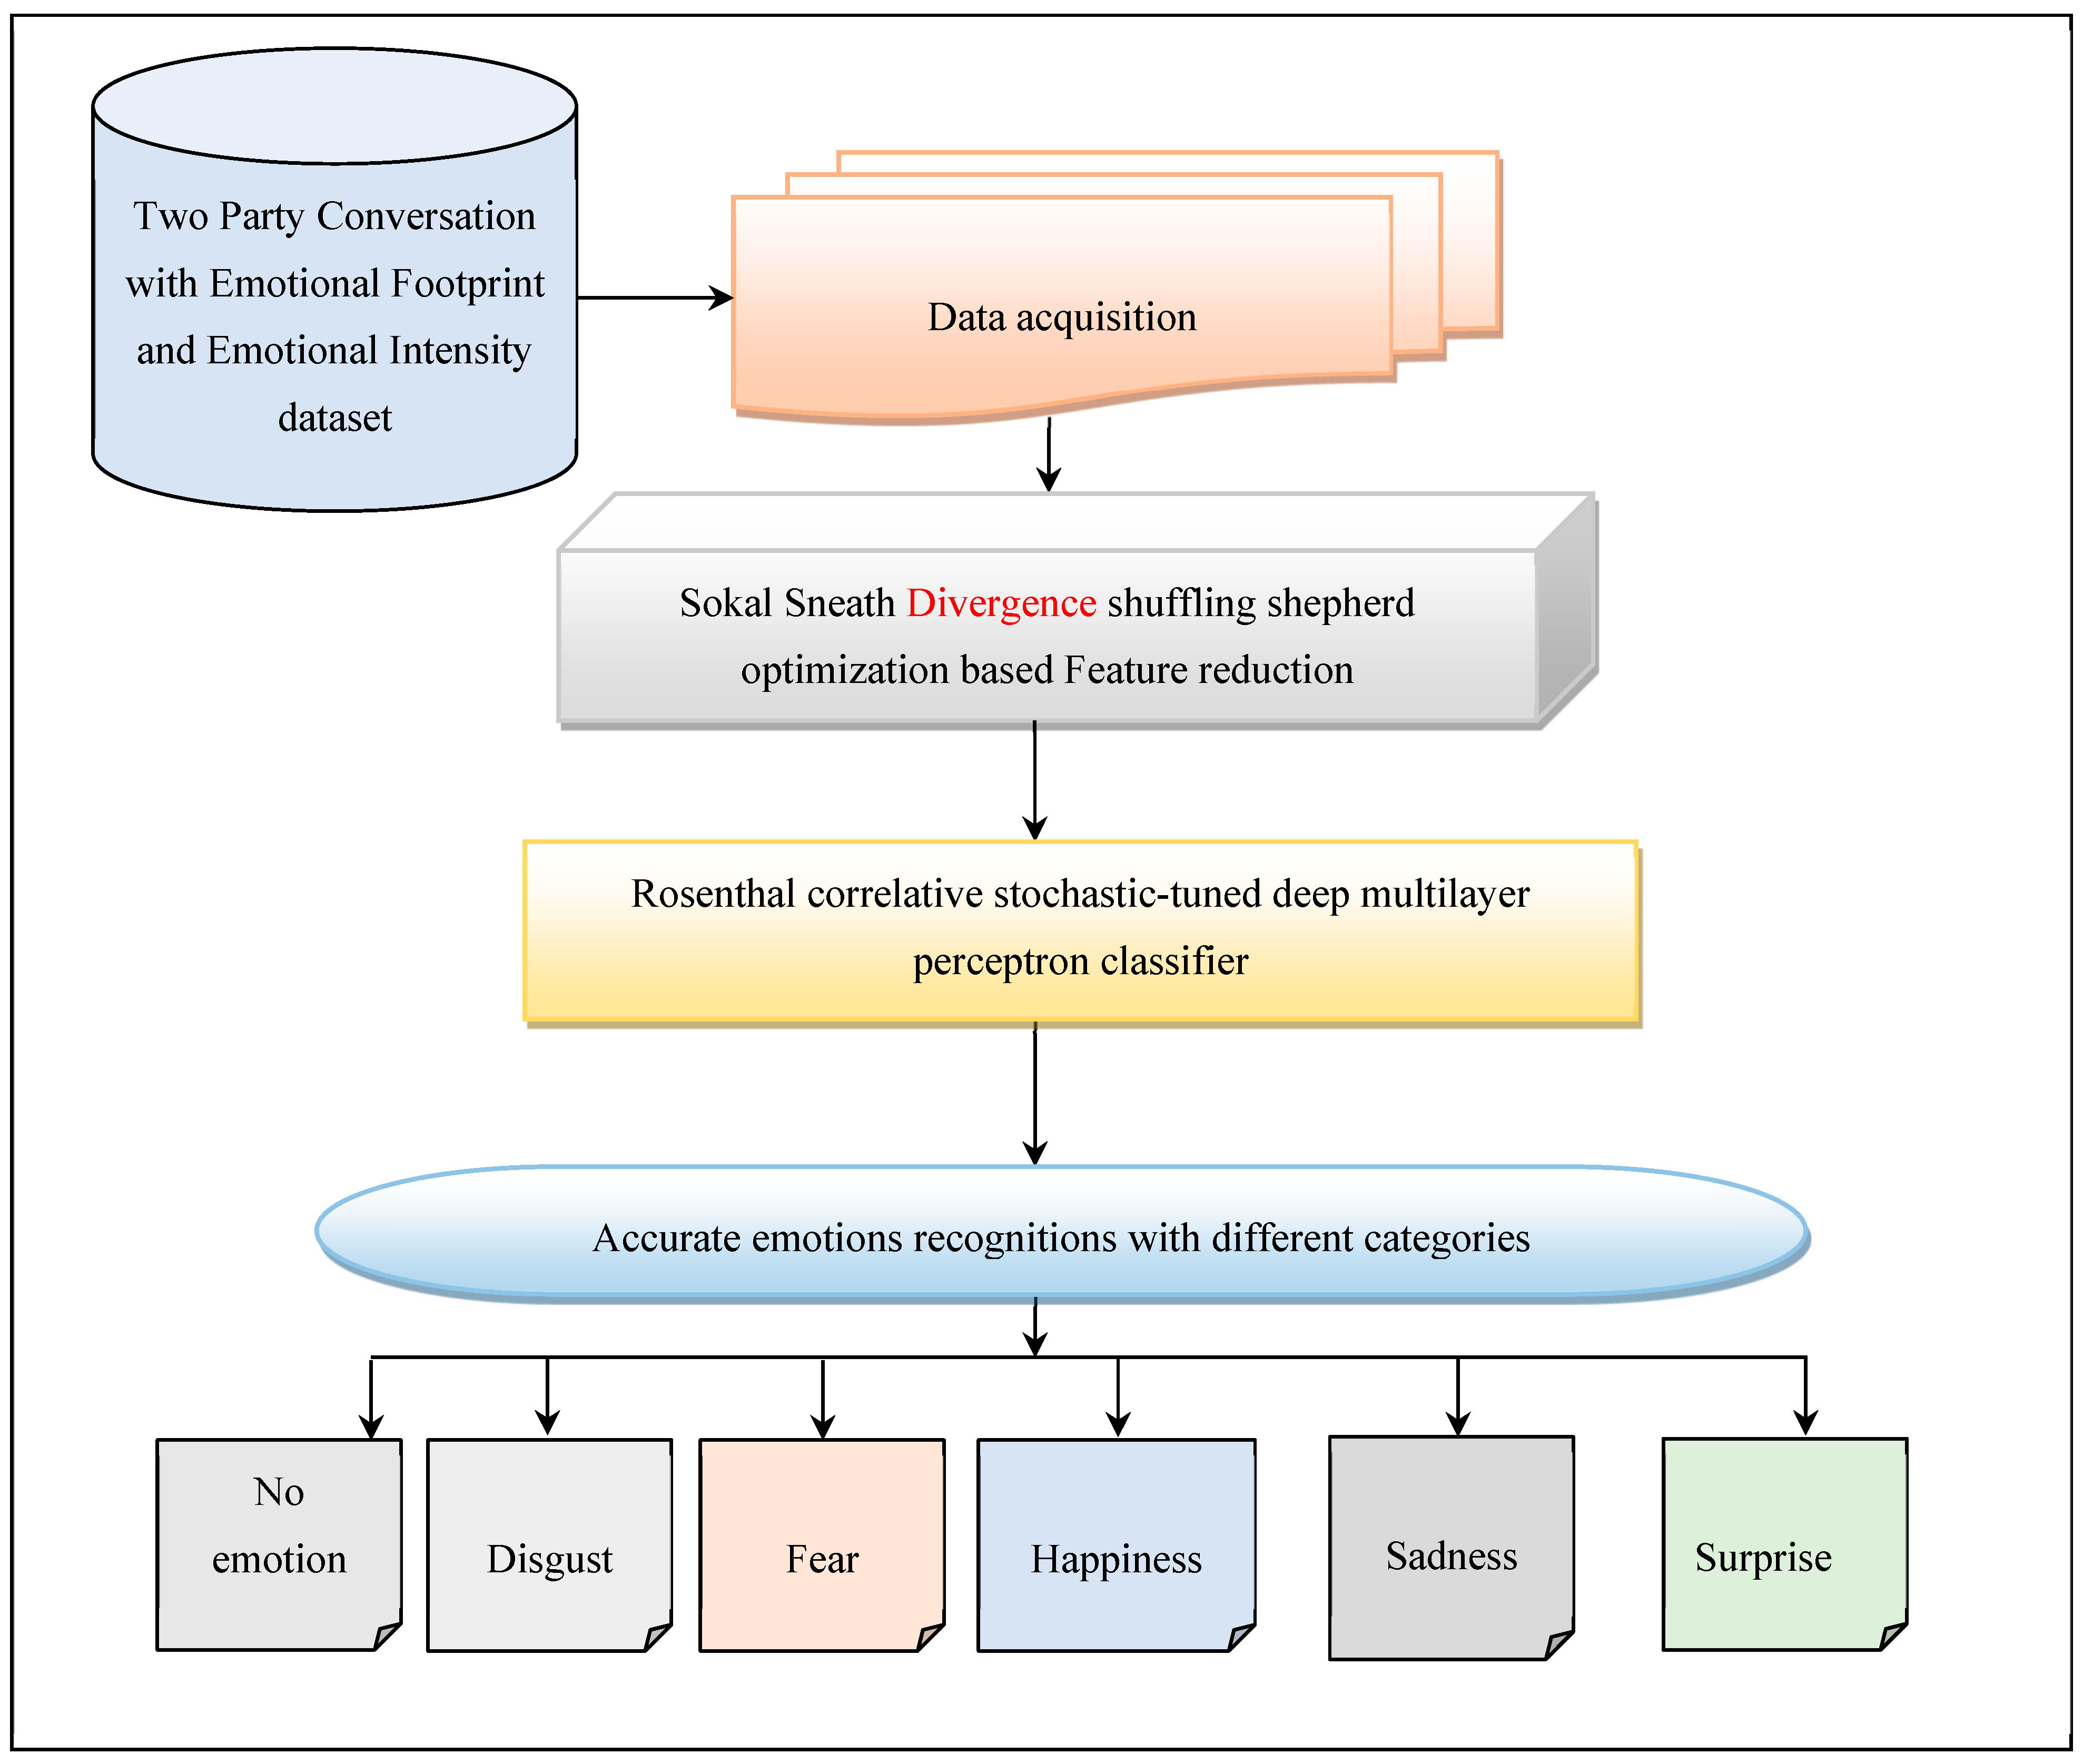
Emotional footprint refers to the unique, consistent way a person expresses emotions through facial micro-expressions during conversation or interaction. In real-time applications, facial expression systems not only identify individuals but also evaluate their emotional states. The system interprets and classifies human emotions by analyzing fine changes in facial features, using machine learning algorithms and computer vision techniques. In order to achieve the above objective, a novel deep learning model called DSFO-STDMP is developed in this section. The working process of the model is partitioned into three major processes, namely data acquisition, feature selection, and classification. The purpose of the study is to find emotional footprints that measure the impression of emotions on human behavior. The objective of the DSFO-STDMP model is to achieve accurate emotional footprint identification with higher accuracy and less time. Figure 1 provides an outline of the overall working process of the proposed DSFO-STDMP model.
Figure 1 shows the architecture of proposed DSFO-STDMP model, which helps to achieve accurate emotion footprint identification from the two party conversation dataset. The model combines the different three basic steps that work collaboratively to enhance the accuracy of the emotion identification. These processes include data acquisition, feature reduction, and classification. Initially, the number of conversation data samples is gathered in data acquisition from a dataset. Next, the feature reduction is performed by using Sokal–Sneath Divergence shuffling shepherd optimization. More vital features are chosen, and irrelevant features are removed. Finally, the Rosenthal correlative stochastic-tuned deep multilayer perceptron classifier is employed to precisely find the emotion into different categories such as no emotion, angry, disgust, fear, happiness, sadness and surprise. Each of these different processes is explained in detail in the following subsections.

3.1. Data Acquisition

The primary process of the proposed DSFO-STDMP model is data acquisition for collecting the data samples from the Two Party Conversation with Emotional Footprint and Emotional Intensity dataset [30], extracted from https://data.mendeley.com/datasets/fvfjp6n3x9/1 (accessed on 15 November 2023). The dataset comprises 1857 interpreted conversations and 48 features. Each captured data point gives information about the emotional footprint and emotional intensity of both participants toward the end of the dialog. The first row includes the column headers, and each following row corresponds to data from a single conversation.

3.2. Sokal–Sneath Divergence Shuffling Shepherd Optimization-Based Feature Reduction

Feature reduction is the second process of the proposed DSFO-STDMP model for accurate emotional footprint identification systems. It helps to improve the performance and reduce computational time, especially when dealing with high-dimensional data. The proposed technique utilizes the Sokal–Sneath divergence shuffling shepherd optimization (SSDSSO) algorithm for feature reduction from the dataset by selecting the significant features and removing the others from the dataset. SSO is a metaheuristic optimization algorithm inspired by shepherding behavior, particularly the process of guiding, controlling, and directing the scattered into optimal formations. In the SSO algorithm, the main aim is that sheep move through the search space influenced by the best sheep in their herd and some random behavior of the sheep controlled by shepherds. In contrast to existing SSO optimization algorithms, the proposed algorithm implements the censored regression and Jensen–Shannon divergence algorithm to further enhance the performance of the existing SSO optimization. In this optimization algorithm, sheep are represented as the number of features in the dataset. The main advantage of the proposed SSO optimization is that it requires significantly less computational time and memory than the existing classical optimization algorithms.
The Sokal–Sneath divergence is used to measure the similarity between features. Thie aim is to select relevant features that are highly relevant and remove irrelevant features that are of low similarity. Feature redundancy is considered to reduce complexity and overfitting and enhance stability. High-dimensional data with many redundant features increases the computational time for classification.
Features are screened out in an iterative process within SSO algorithm. The SSO algorithm explores the feature space and generates applicant feature subsets. Each subset is evaluated using a criterion function that balances relevance (accuracy) and redundancy (using the Sokal–Sneath divergence). If a feature value is highly similar (above a certain threshold), then the feature is removed.
The threshold is set for Sokal–Sneath similarity based on performance-based tuning. The threshold value is adjusted by estimating the feature selection performance. A higher threshold value allows for more unnecessary features, while a lower threshold enforces stricter non-redundancy. The optimal threshold reduces the combination of false positives and false negatives in the feature selection.
Let us consider the Two Party Conversation with Emotional Footprint and Emotional Intensity dataset ‘ D S ’ and data samples S 1 ,   S 2 ,   , S n , as well as the features F 1 ,   F 2 ,   , F m arranged in the form of a matrix. Therefore, the input matrix is formulated as follows:
K = F 1 F 2 F m S 11 S 12 S 1 n S 21 S 22 S 2 n S m 1 S m 2 S m n
where K indicates an input data matrix where each column indicates a number of features F = F 1 ,   F 2 ,   , F m , and each row indicates a number of data samples or instances or records ‘ S = S 1 ,   S 2 ,   , S n ’, respectively.
By applying the proposed optimization algorithm, the initial populations of the features (Sheep’s) are randomly initialized in the search space.
F = F 1 ,   F 2 ,   , F m ;     1 m 48
The initial position of each sheep is formulated in the form of a vector as follows:
P i 0 = P m i n +   R 0,1     P m a x P m i n
where P i 0 denotes the initial position of each sheep at iteration ‘0’, P m i n and P m a x denotes a lower and upper position bound of the vector, R 0,1 indicates a random number between 0 and 1. After generating the initial population of features, the fitness is measured between the features and the target with the help of the Sokal–Sneath similarity coefficient.
φ F = S S S = F j T F j T F j T ·
where S S S denotes Sokal–Sneath similarity between features F j and target T (emotion identification), and φ F indicates the fitness of each feature. The ‘ S S S ’ provides the output ranges from 0 to 1.
Based on the similarity score, sheep are sorted into ascending order to divide the total populations into a number of herds by using the following function:
f = arg min φ F j φ F k
where f denotes a function to find the minimum distance between the fitness of features ‘ φ F j ’ and φ F k . Based on the above function, the sheep are divided into a number of herds. In other words, the minimal distance between the fitness of the sheep has a high probability of grouping them into a particular herd. In this way, different numbers of herds are formed.
For each herd, the shepherd or agent is allotted to guide the sheep to search for a better grazing area. The sheep’s position in the particular herd is updated as follows:
P i t + 1 = P i t +   α . 0.5 P b e s t t P i t + β . R ( 0,1 )
where P i t + 1 denotes an updated position of the sheep in the particular herd, P i t indicates the current position of the sheep, α ,   β are parameters that control exploration and exploitation, respectively, 0.5 P b e s t t P i t denotes a Jensen–Shannon divergence, R ( 0,1 ) indicates a random number between 0 and 1, and P b e s t t denotes a current best solution in a particular herd that has high fitness.
In the SSDSSO, the hyperparameters ‘ α   ’ and ‘ β ’ are used to control the balance between the exploration and exploitation capabilities. The specific values of α = 0.5 and β = 2.4 are used in the experiments for handling optimization problems to obtain the best performance. The role of ‘ α ’ is associated with the movement towards a worse member (sheep) in the current community (herd). This mechanism is used to search a wider area of the search space and prevent it from becoming trapped in local optima. The role of ‘ β ’ is linked with the movement towards a better member (horse) in the current community. It is employed to purify the current solutions and converge towards the global optimum. After updating the position, the shuffling process is executed to enhance exploration and avoid local optima.
In order to perform the shuffling, the sheep from the herd are randomly selected as follows:
h = r a n d   F j   H l
where F is the set of sheep selected for shuffling from the herd, and H l , h denotes a sheep randomly chosen from F j using a random integer function ‘ r a n d   F j ’. Then, we combine all the sheep selected from the herd.
F m e r g e d = j = 1 n F j ·
where F m e r g e d denotes a merged sheep from the herd H l . After merging, the global best position of the sheep is identified based on fitness as follows:
Y = arg max φ F
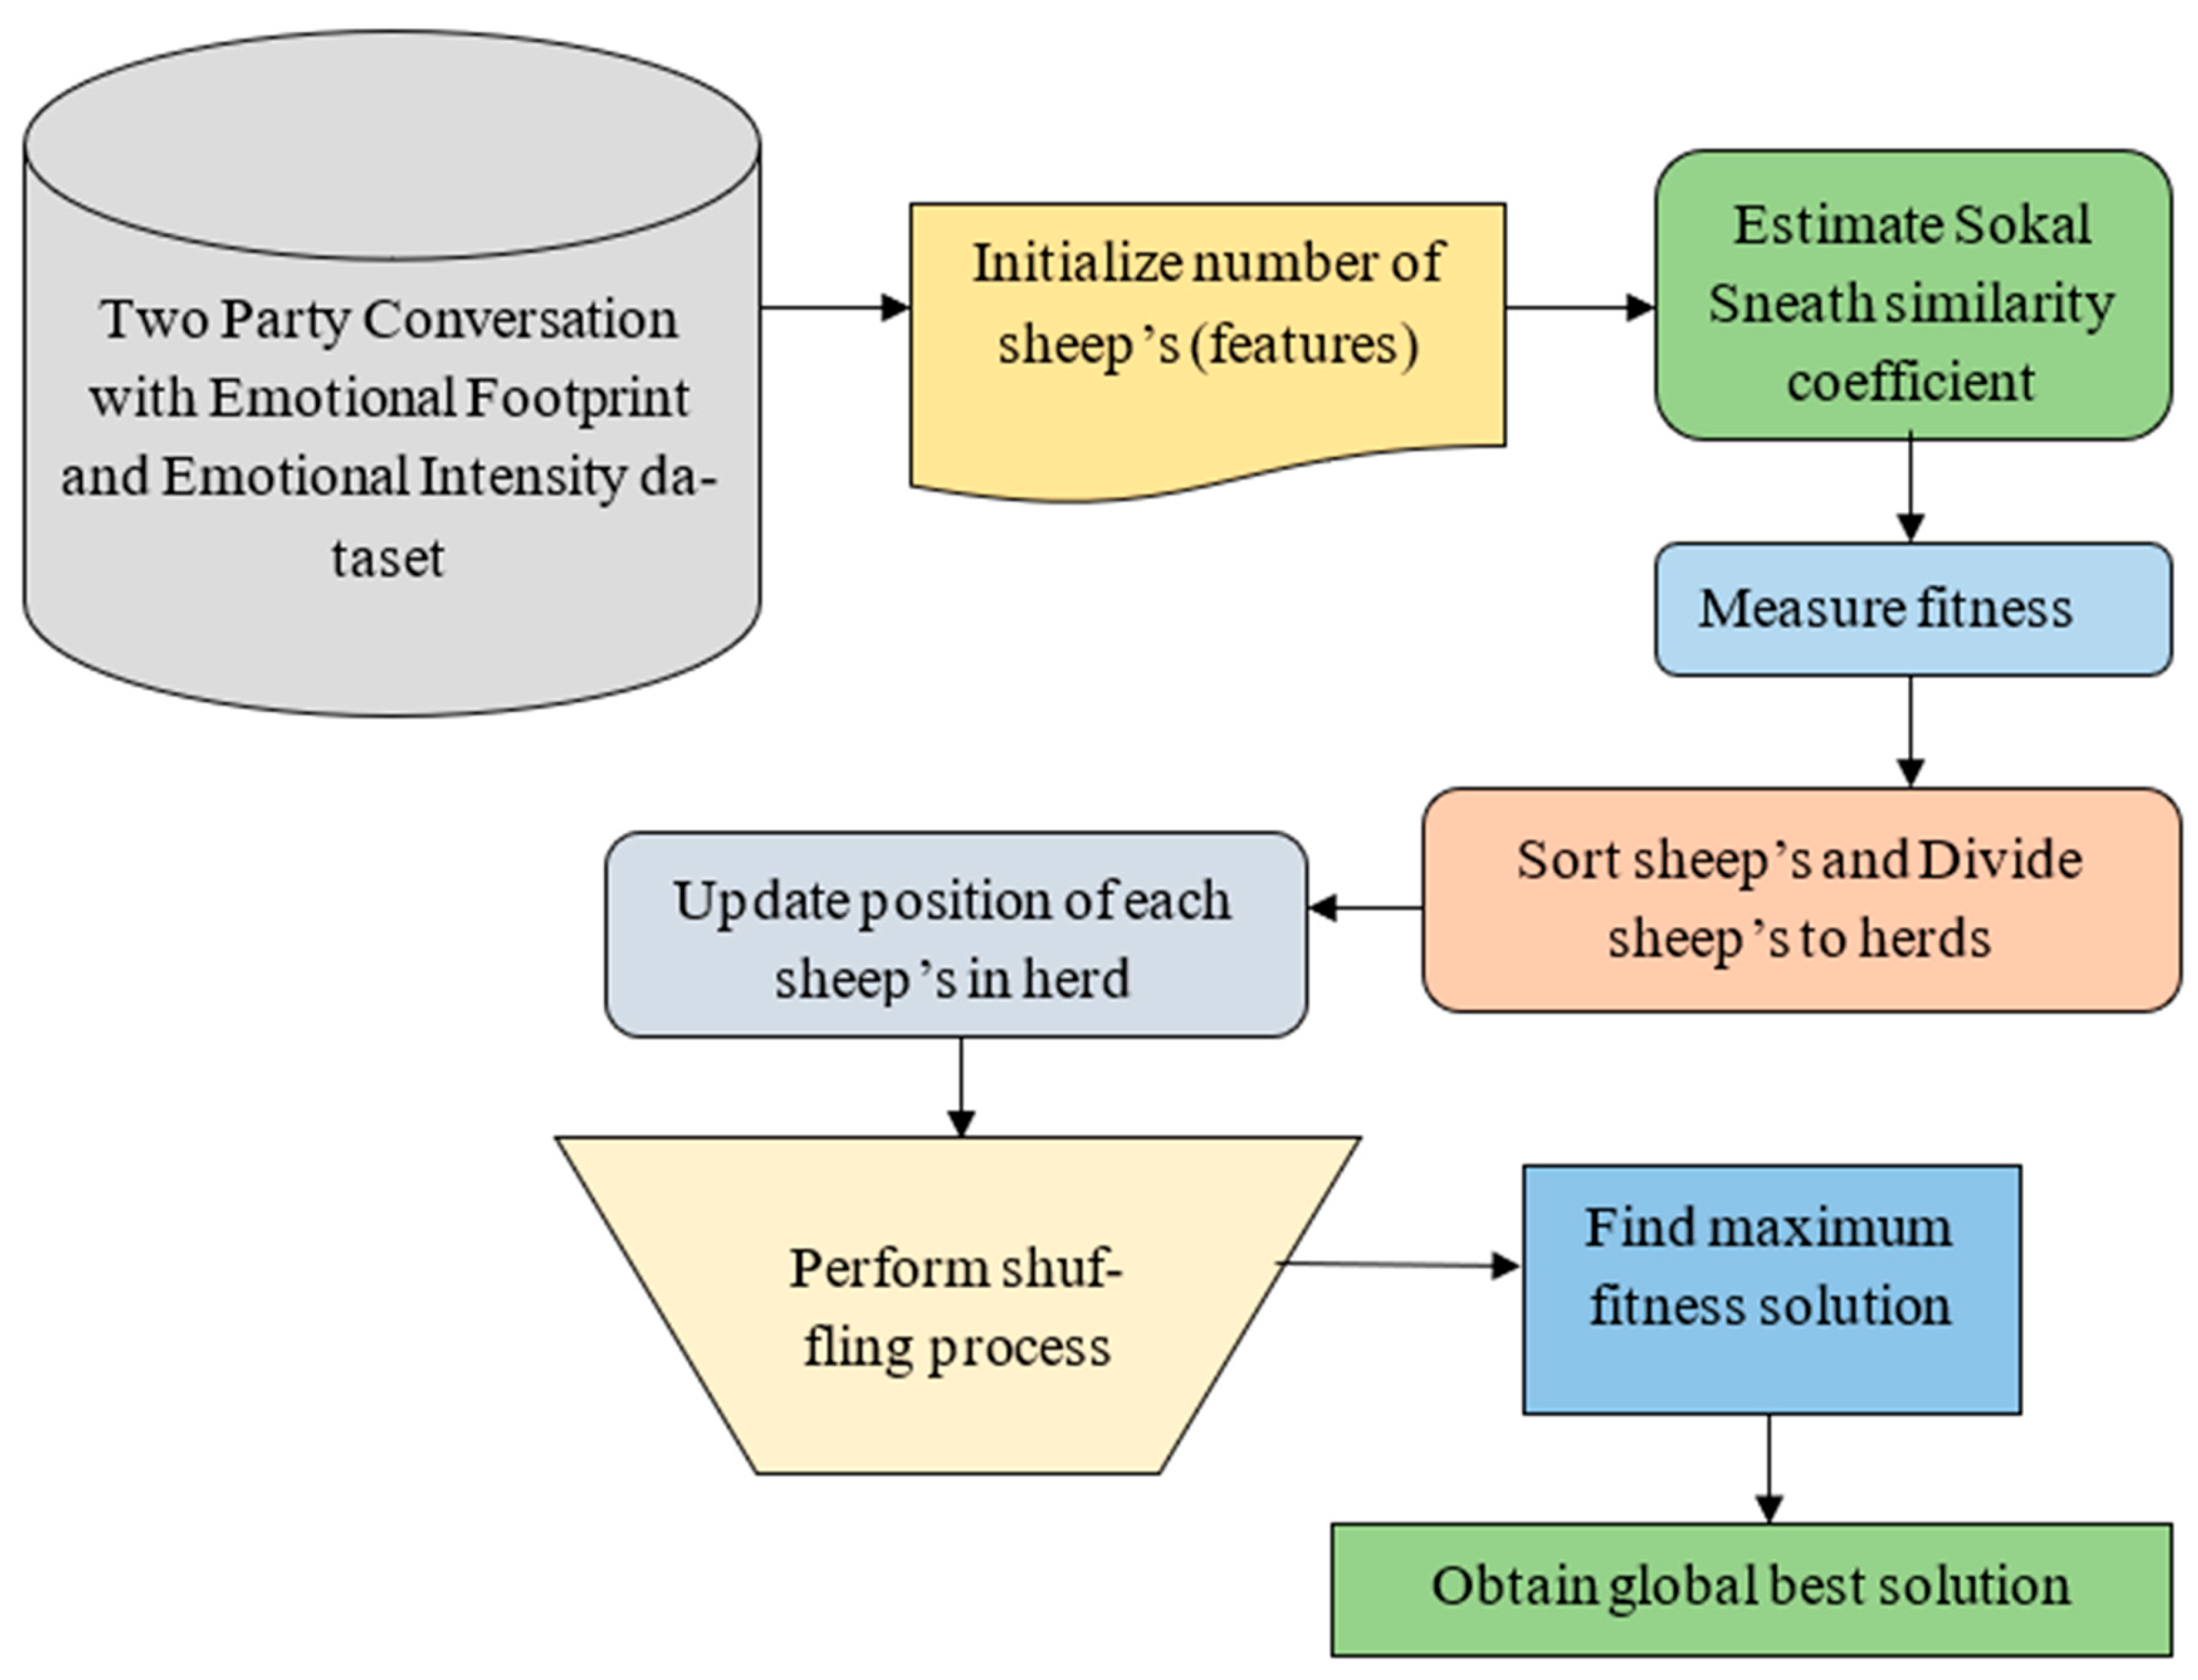
where Y denotes a final global best optimum output, and arg max φ F denotes an argument maximum fitness of the feature. If the fitness of the updated position is higher than that of the old position, it replaces the current best solution. This process continues until the maximum number of iterations is reached. Finally, the optimal solution (i.e., optimal features) is selected for emotion footprint identification. The flow diagram of the proposed optimization algorithm is described as follows.
Algorithm 1 describes a step-by-step process of optimal feature selection. The initial phase involves generating a population of features (i.e., sheep) within the search space. For each feature in the population, the proposed technique calculates a fitness value. Subsequently, the total population is divided into a number of herds based on the fitness function. Following this process, a new position of features is updated. Then the shuffling process is executed to avoid a local optimum solution. After shuffling, the global best solution is obtained based on maximum fitness. This entire process iterates until the algorithm reaches its maximum iterations. This iterative approach enables the algorithm to identify the optimal features with the aim of achieving higher accuracy and minimal time in emotion footprint identification.
Algorithm 1: Sokal Sneath Divergence Shuffling Shepherd Optimization-based feature selection
Input: Number of features F = F 1 ,   F 2 ,   , F m , data samples ‘ S = S 1 ,   S 2 ,   , S n
Output: select the optimal features
Begin
1. Initialize the population of features F = F 1 ,   F 2 ,   , F m
2.    Initialize the position of features using (3)
3.    While ( t   <   m a x _ i t e r )
4. For each features F j
5.        Calculate the fitness using (4)
6.       End for
7.     Sort the features based on fitness
8.     Divide features into herds using (5)
9.   For each features F j in herd ‘ H l
10.      update the position using (6)
11.     End for
12.    Perform shuffling process using (7)and (8)
13.     For each features F j in merged herd ‘ H l
14.       find maximum fitness using (9)
15.     End for
16.   Replace global best solution
17.   t = t + 1
18.   Go to step 3
19.  End while
20.  Return (optimal features)
End
Figure 2 below illustrates the block diagram of Sokal–Sneath divergence shuffling shepherd optimization. At first, the numbers of sheep (i.e., features) are randomly initialized in the search space. After the initialization, the fitness is measured based on the similarity index functions. Then, the sheep are divided into herds based on the similarity values; following that, the position of each sheep in the herd is updated. Then, the shuffling process is executed, and it finds the global best solution. As a result, the optimal features are identified and others are removed.

3.3. Rosenthal Correlative Stochastic-Tuned Deep Multilayer Perceptron Classifier-Based Emotional Footprint Identification

The final process of the proposed DSFO-STDMP model is emotional footprint identification with the selected optimal features by using Rosenthal correlative stochastic-tuned deep multilayer perceptron classifier. It is a type of deep neural network composed of numerous interconnected layers, designed to learn complex data samples from an input dataset. Deep learning (DL) is executed with different building blocks to learn from data, make predictions, and optimize performance. It comprises layers, activation functions, loss functions, and optimization algorithms, each playing a vital role in the model’s ability to learn and generalize from data.
Layers are the basic structure blocks of DL models, determining how data samples are processed and transformed during the network. It comprises an input layer, one or more hidden layers, and an output layer. The input layer receives the raw data, such as data or text, which are then passed through the hidden layers. The hidden layers are used to extract relevant features from the data. Finally, the output layer provides the final prediction or classification based on the processed information. Activation functions are critical to learn complex patterns and make sophisticated predictions. Loss functions are also called objective functions for measuring the difference between observed values and the actual values. Stochastic Gradient Descent is an optimization algorithm employed in DL to adjust the weights to minimize the loss function.
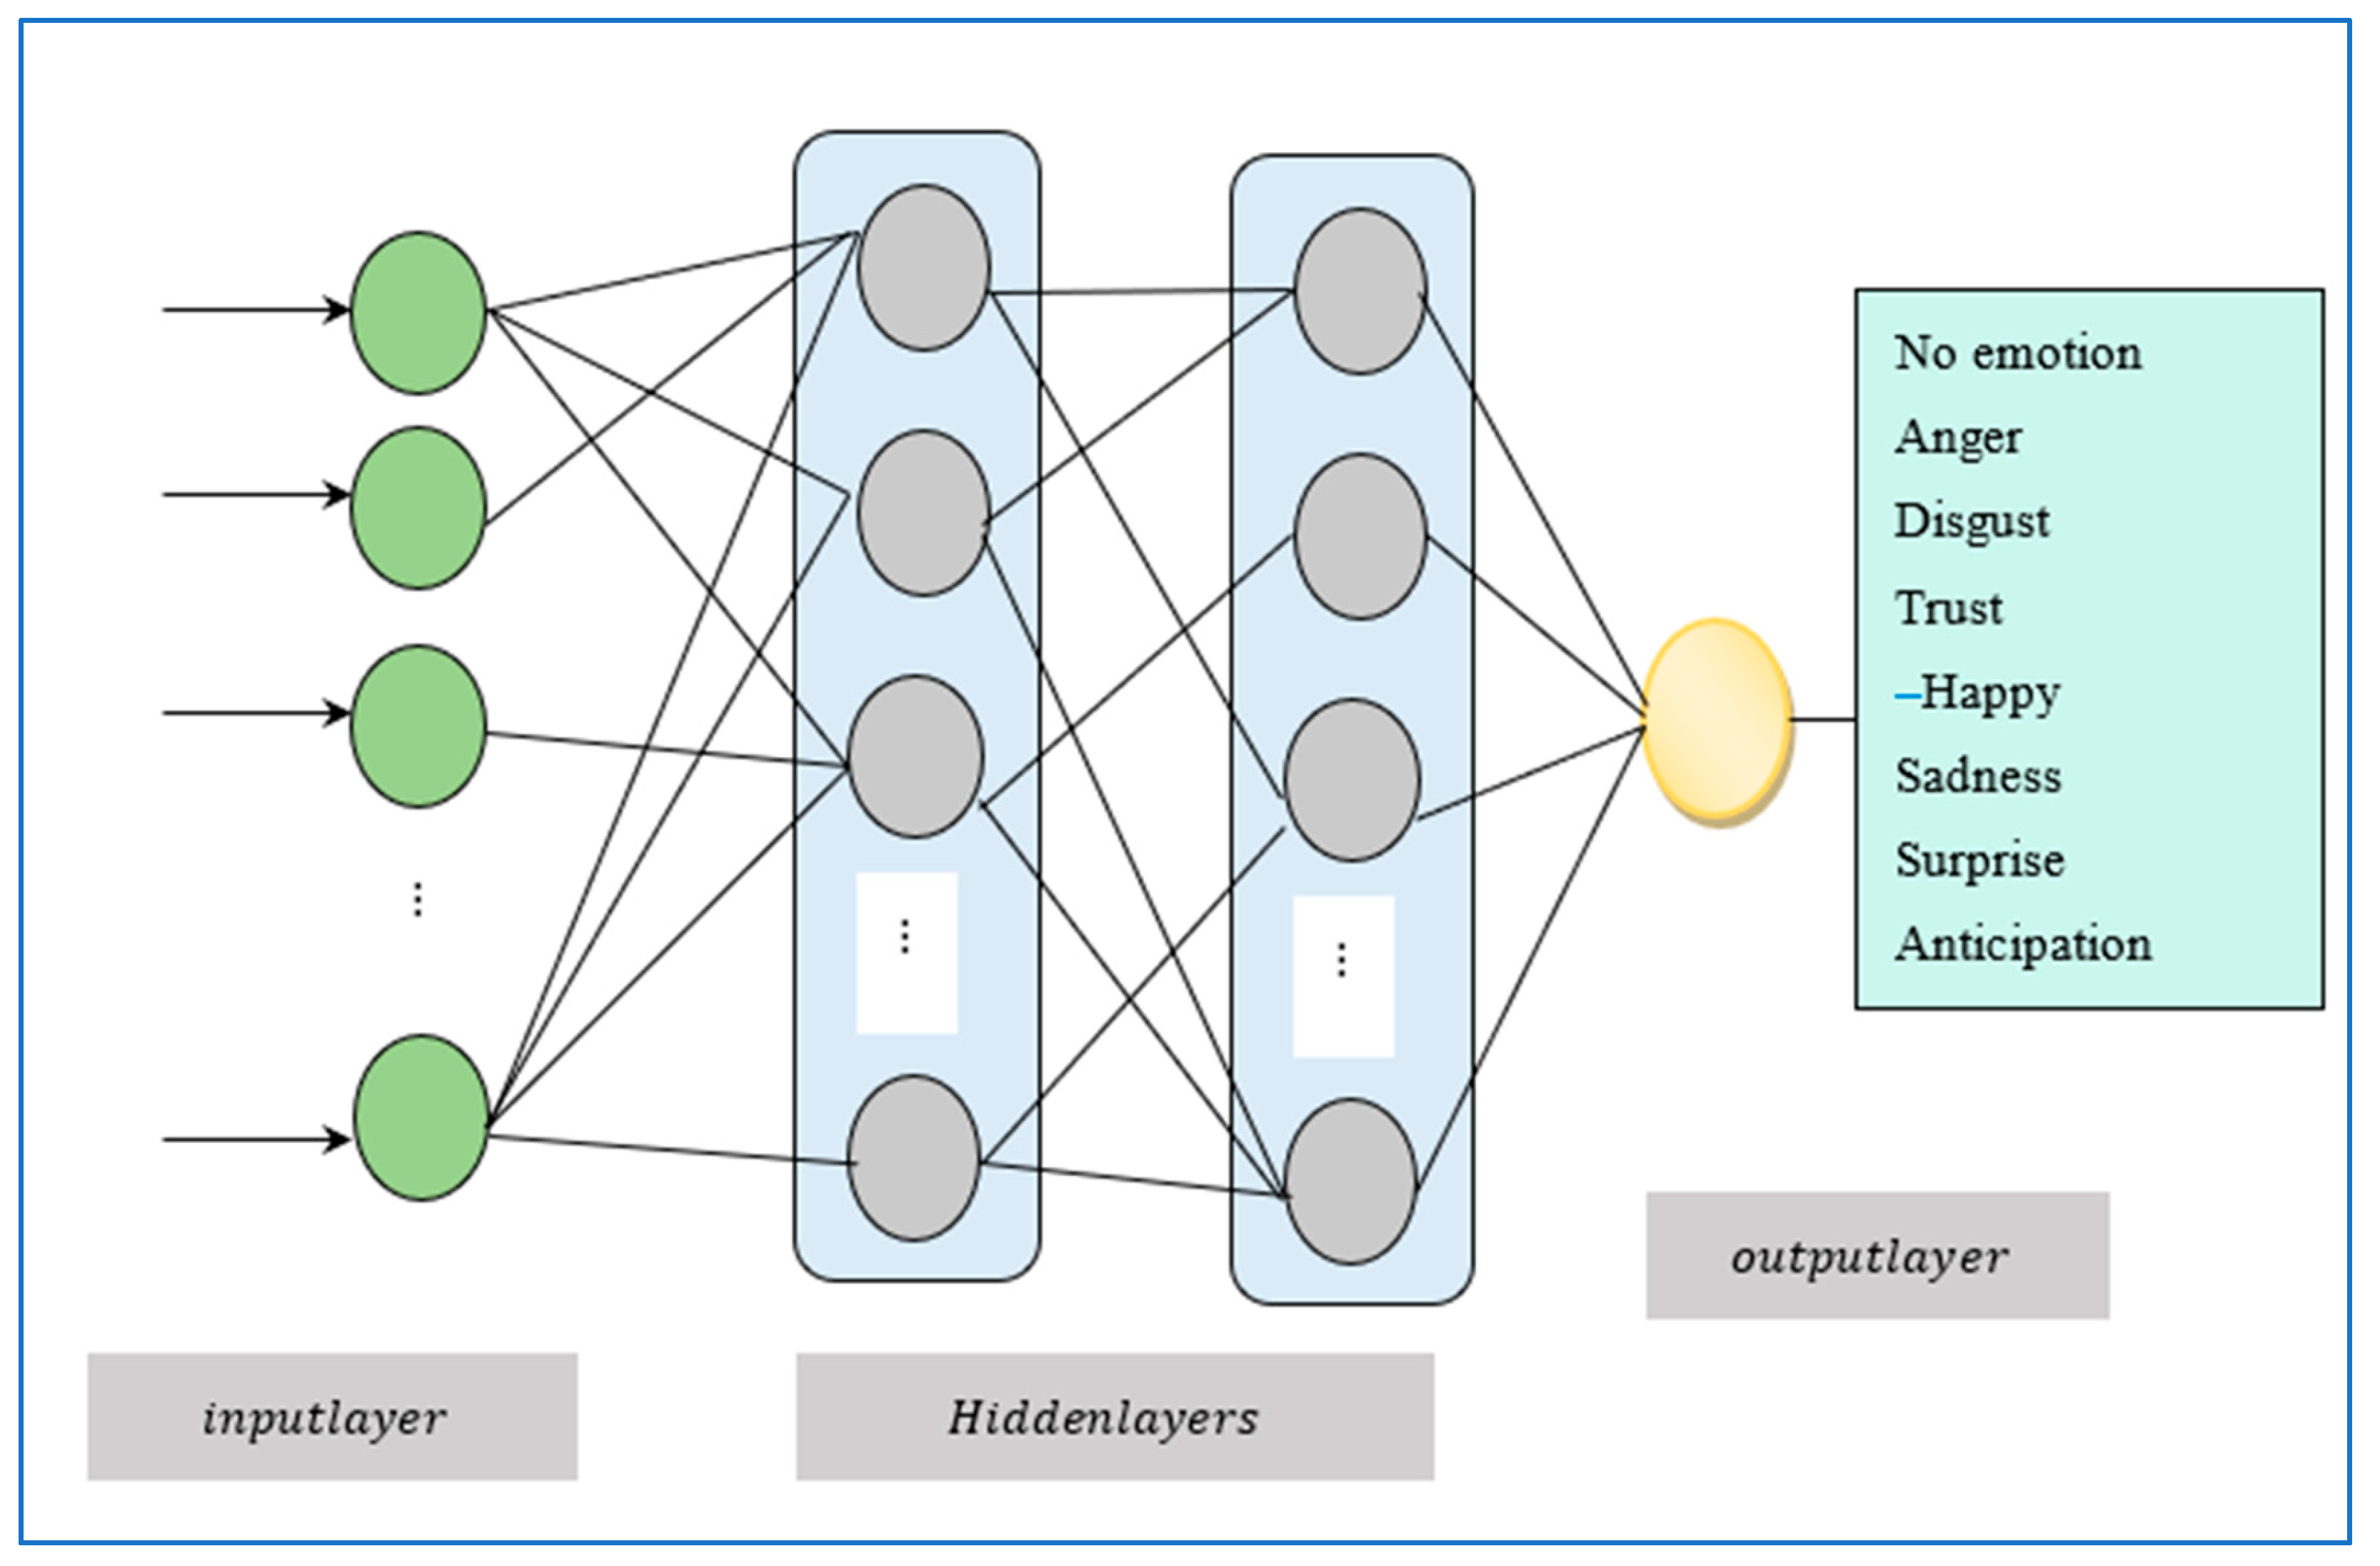
Deep multi-layer neural networks are advanced for DL. It considers multiple layers to learn complex, hierarchical patterns from data. Deep multi-layer neural networks are tricky and handle several issues, namely huge data availability, local optima, and vanishing/exploding gradient problems. To address this issue, a back-propagated gradient descent optimization algorithm termed oriented stochastic loss descent (OSLD) is introduced in [33] to train deep multi-layer neural networks. The performance of OSLD is directly affected by the specific values of its hyperparameters such as learning rate. In our work, the Rosenthal correlative stochastic-tuned deep multilayer perceptron classifier is introduced for hyperparameter tuning for adjusting the weights of the network structure iteratively to minimize error and improve classification accuracy. This structure of the multilayer perceptron classifier enables the network to capture intricate relationships, making it particularly effective for the classification of emotional footprints. A schematic structure of the stochastic gradient deep multilayer perceptron classifier is shown in Figure 3.
Figure 3 illustrates the schematic structure of a deep multilayer perceptron classifier model. A deep multilayer perceptron is a type of feed-forward neural network that consists of three main components such as an input layer, one or more hidden layers, and an output layer, all connected in a forward direction. As illustrated in Figure 3, the input layer receives the initial data samples and passes them to the hidden layers, where the computation process takes place. Each layer is made up of artificial neurons that process and transmit the input data through the network. Finally, the output layer generates the emotion classification results. Each neuron in a given layer sends its output to the neurons in the next layer, allowing the network to progressively refine the information and improve classification performance.
The Rosenthal correlative stochastic-tuned deep multilayer perceptron (RCG-FT-DMLP) is used to strengthen key features with the aid of a deep multilayer perceptron, Stochastic gradient, and Rosenthal correlation. The Deep Multilayer Perceptron is utilized to learn features by using multiple hidden layers. Deeper layers merge more complexly and effectively strengthen high-level features for the final prediction. The correlation is employed to measure the relationships between training data samples and the data samples of observed classes. By using correlation, RCG-FT-DMLP assigns greater significance to features that are strongly related to the target output. It effectively strengthens the final prediction. The stochastic gradient function is employed with hyperparameter tuning to adjust weights. Learned features are optimally suited for classification and improving performance.
The proposed deep learning classifier model considers the training set S i ,   Z k , where S i indicates a training sample ‘ S i = S 1 , S 2 , S 3 , S n ’ and Z k indicates the multiclass classification outcomes of emotion footprints such as 0—no emotion, 1—angry, 2—disgust, 3—fear, 4—happiness, 5—sadness, 6—surprise. The number of data samples is given as input to the input layer of the deep learning classifier model. Then, the input data is simply passed to the first hidden layer. When the data are transferred from the input layer to the hidden layer, the hyperparameters, such as weights and bias, are initialized. As a result, each input samples’ data are multiplied by an equivalent weight before being passed on to the next layer. The weighted sum of each neuron is computed as follows:
X =   i = 1 n S i     w i h + b ·
where ‘ X ’ represents the weighted sum output, S i indicates the data samples, ‘ w i h ’ symbolizes the weights between the input layer and the hidden layer neuron and the bias function ‘ b ’ that stored the value ‘1’.
In the hidden layer, semantic correlation between the attributes of training samples and attributes of observed classes is measured using Rosnow correlation. It is a statistical method used to measure the correlation and efficient features interpretations. Based on this data analysis, classification of various emotions is performed as follows:
Z = C o r   S t r , S C
where Z denotes a multi-classification output, and C o r   S t r , S C indicates a Rosenthal correlation between the training data samples ‘ S r ’ and data samples of observed classes ‘ S C ’. It is measured as follows,
C o r   S t r , S C = 1 n     S T S   ·
S T S = S t r S C 2 V a r ( S t r , S C ) ·
where C o r   S t r , S C specifies a Rosenthal correlation between the training data samples S t r ’ and samples of observed classes ‘ S C ’, S T S indicates Standardized test statistics, ‘ n ’ indicates the total number of data samples, and V a r ( S t r , S C ) refers to a variance between the data samples. The correlation C o r   S t r , S C provides the output ranges from ‘0’ to ‘1’.
For each classification result, the error rate is measured based on the squared difference between the actual results and the predicted output. The error rate is estimated as follows:
E R R = Q a c t Q o b s 2
where E R R indicates the error rate, Q a c t indicates the actual classification output, and Q o b s indicates the observed output. The proposed deep learning classifier minimizes the objective function, i.e., error and increases the accuracy by using adaptive accelerated gradient method.
w n e w = w η ( E R R ) w ·
where w n e w symbolizes a new weight, w indicates old weights between the layers, η indicates a learning rate ( η < 1 ) , and ‘ E R R w ’ represents a partial derivative of the error rate ‘ ( E R R ) ’ with respect to the partial derivative of the current weight ‘ w ’. After updating the weights, the deep classifier model provides the final classification outcomes at the output layer with minimal error.
G = a r g min E R R
where G denotes objective function, and a r g min E R R denotes an argument to minimize the error rate. Finally, the output classification with minimal error is observed by means of softmax activation functions.
Y = σ s o f t m a x   ( h o     w h o )
σ s o f t m a x = exp ( Y C ) C = 1 k exp ( Y C ) ·
where σ s o f t m a x indicates a softmax activation function at the output layer used to provide multiple classification results, Y C indicates an output of the k t h class, and C represents the total number of output emotion classes. In this way, accurate emotional classification is obtained at the output layer. The algorithmic process of the new classifier model is given below.
Algorithm 2 presents a proposed Rosenthal Correlative Gradient Fine-Tuned Deep Multilayer Perceptron (RCG-FT-DMLP) classifier aimed at improving the accuracy of emotional footprint classification while minimizing error rates. Initially, weights and biases are assigned to the training data samples. These samples are then passed through the hidden neurons, where the Rosenthal correlation is applied to evaluate the relationship between the training data and class labels, thereby enhancing classification accuracy. After the initial classification, a fine-tuning stage is performed, during which the weights between layers are updated using a stochastic gradient function. This process is repeated iteratively until the minimal error is achieved. Finally, the algorithm identifies the optimal weight values that provide the minimal classification errors. A softmax activation function is applied at the output layer to produce the final, accurate emotion classification results.
Algorithm 2: Rosenthal Correlative Stochastic-Tuned Deep Multilayer Perceptron Classifier-Based Emotional Footprint Classification
Input: Dataset, selected optimal features F = F 1 ,   F 2 ,   , F k , data samples ‘ S = S 1 ,   S 2 ,   , S n
Output: Increase the emotional footprint classification accuracy
Begin
  • Collect   number   of   optimal   features   F = F 1 ,   F 2 ,   , F k ,   data   samples   S = S 1 ,   S 2 ,   , S n —input layer
  • For   each   sample   S i
  • Compute the weighted sum using (10)
  • End for
  • For   each   sample   S i
  • Measure the correlation using (11)—[Hidden layer 1]
  • Obtain the emotional classification results
  • End for
  • For each classification results—[Hidden layer 2]
  • Measure   the   error   rate       E R R using (11)
  • Apply stochastic gradient to update the weight using (15)
  • If   a r g min E R R then
  • Obtain final classification results with softmax activation function using (17) at output layer
  • else
  • Go to step 11
  • End if
End

4. Experimental Setup

In this section, comprehensive experiments are conducted to evaluate the performance of three methods, namely DSFO-STDMP, EMOVOX [1] and SDR-GNN [2], using Python programming, a high-level language. The implementation is carried out using Python (version 3.11.2), utilizing the “Two-Party Conversation with Emotional Footprint and Emotional Intensity” dataset taken from https://data.mendeley.com/datasets/fvfjp6n3x9/1 (accessed on 15 November 2023). The dataset consists of 1857 annotated conversational instances, each represented by distinct features. These features capture details related to the Emotional Footprint and Emotional Intensity exhibited by both participants at the time of conversation. The implementation is conducted with the hardware specification of Windows 10 Operating system, core i3-4130 3.40 GHZ Processor, 8 GB RAM, 1 TB (1000 GB) Hard disk, ASUSTek P5G41C-M Motherboard, Internet Protocol. The distinct emotional attributes are summarized in Table 1.
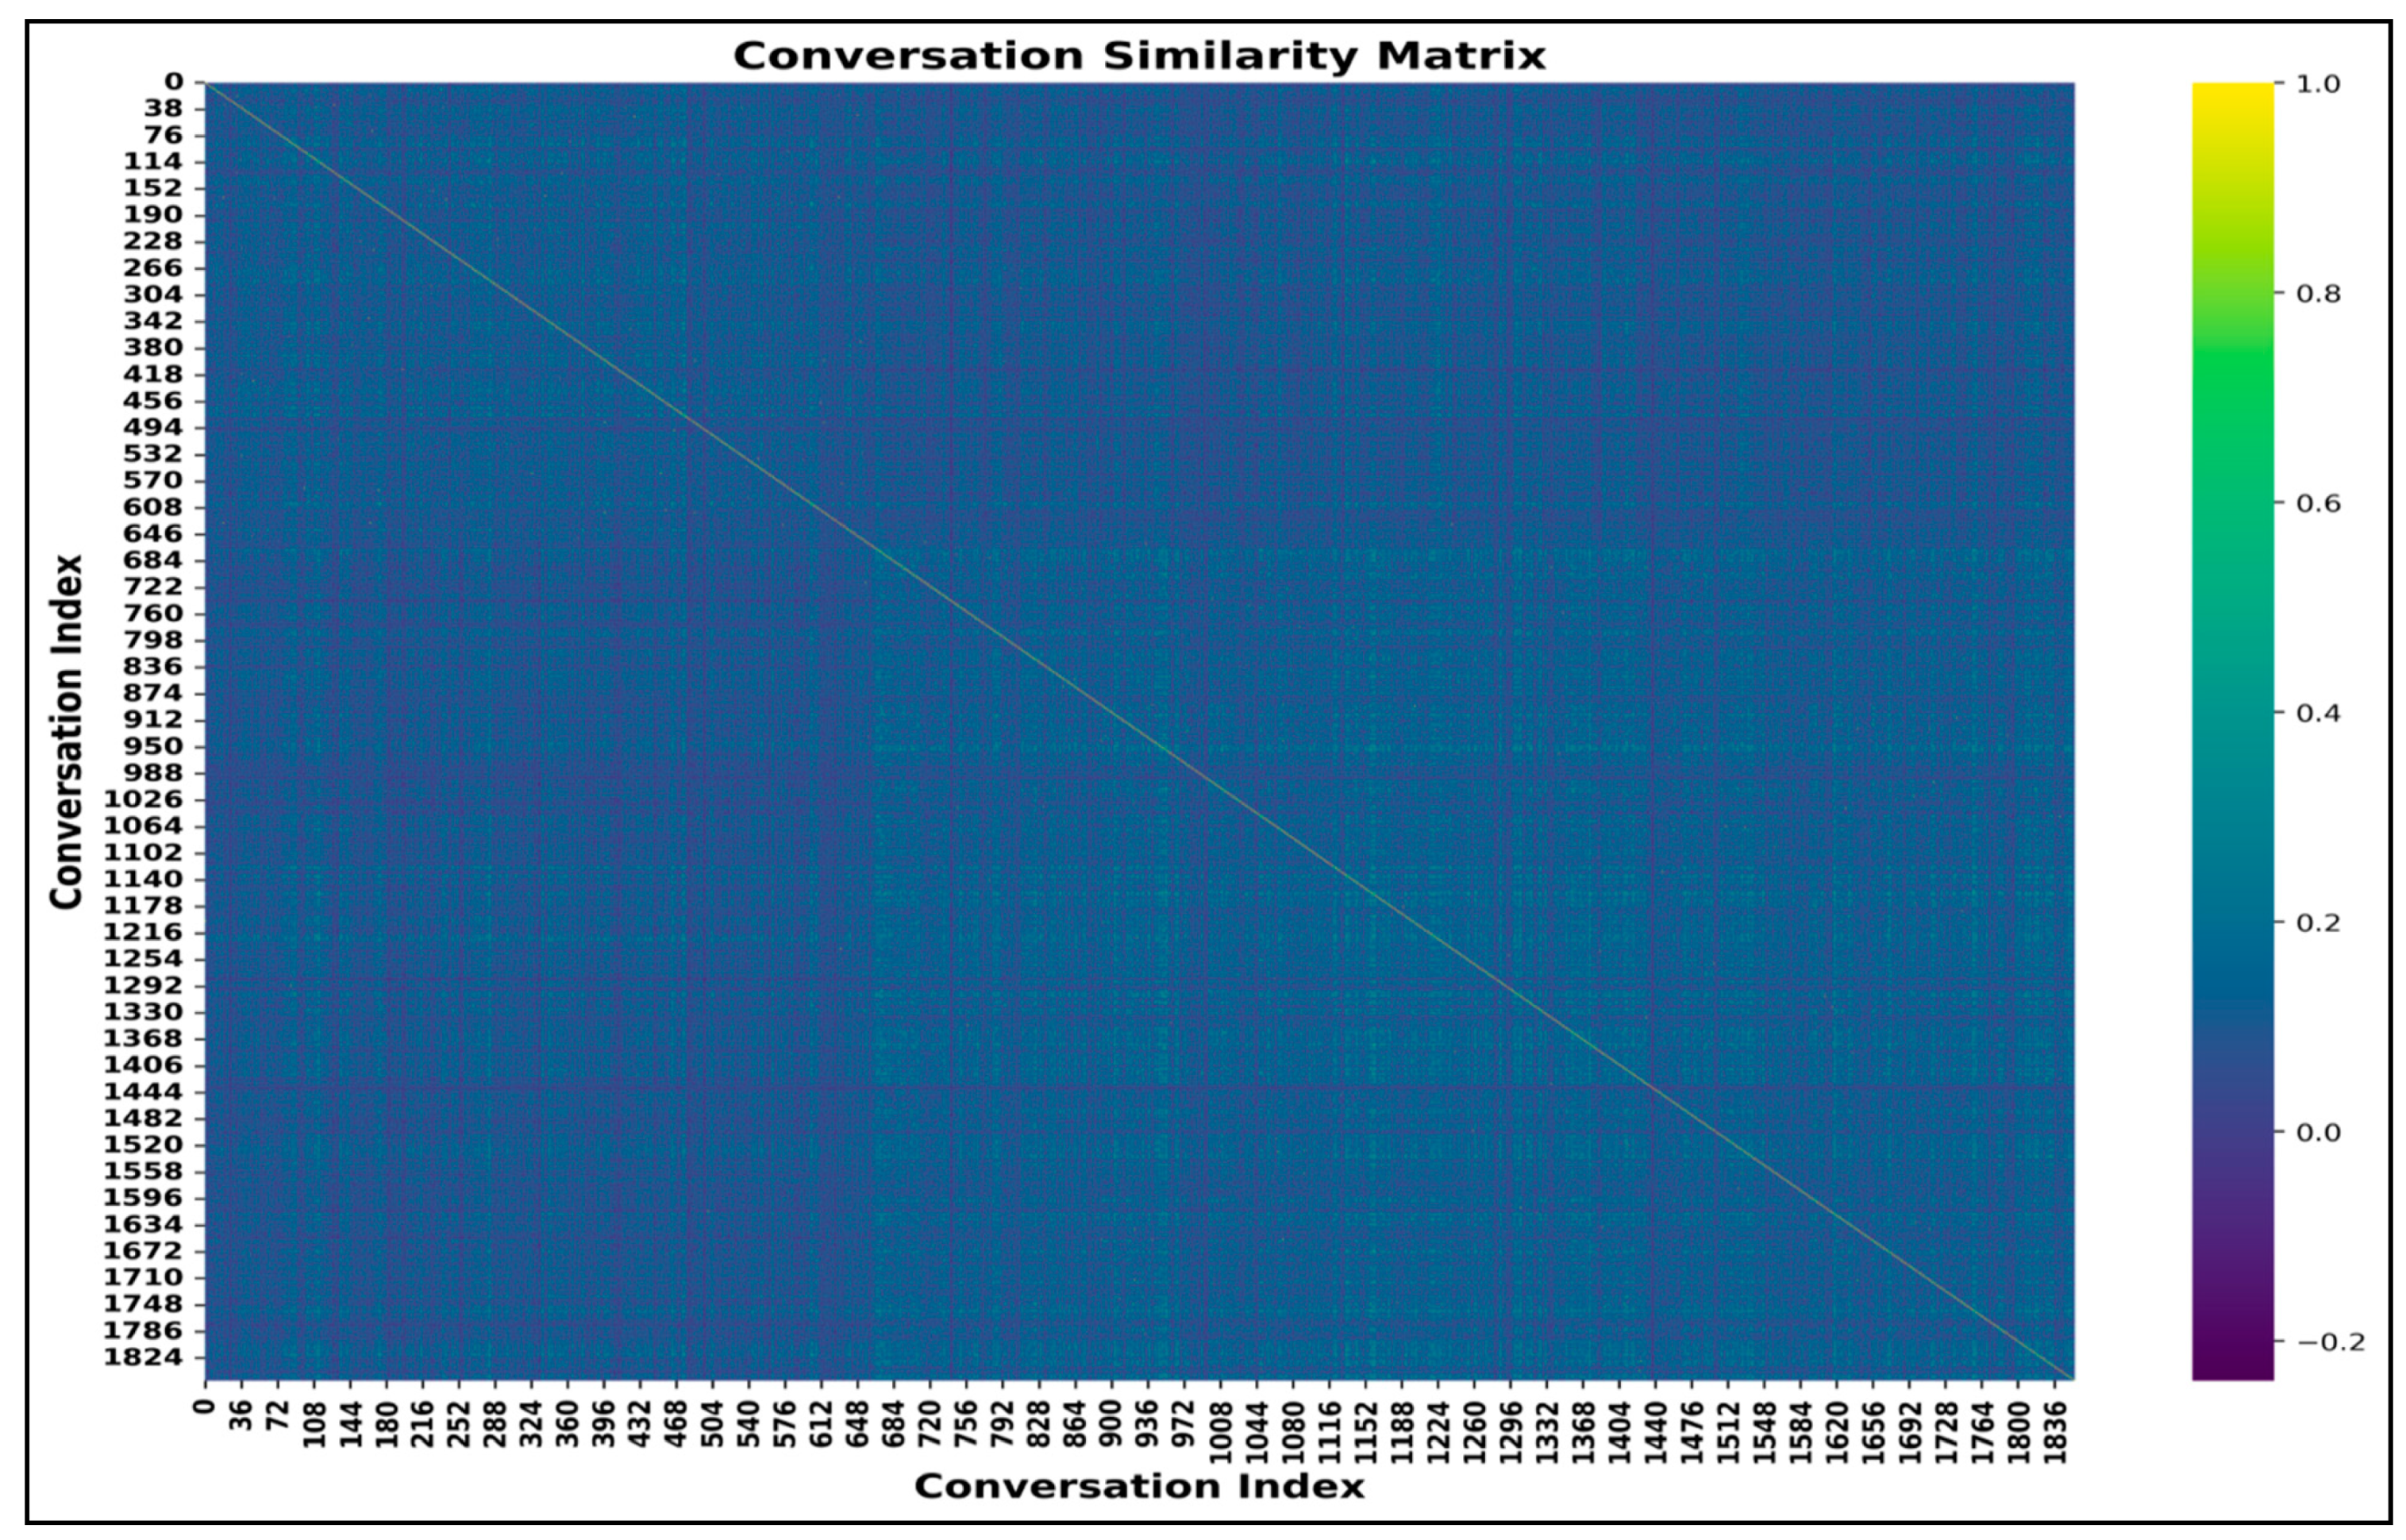
After collecting the data samples, DSFO-STDMP executes the feature reduction process using Sokal–Sneath divergence shuffling shepherd optimization. This technique helps to select more important features and remove the others. Similarity matrix visualization occurs through a heatmap to show pairwise relationships in features.
Figure 4 shows the similarity matrix outcomes. Similarity matrix visualization is a vital technique in emotional analysis, employed to estimate the relationships between different emotions in both human subjects and deep learning models. A similarity matrix for emotional footprint identification receives quantitative and visual representations of specific emotions that are perceived as being similar or that are misclassified. By comparing the high similarity within the same emotion category (Happy-to-Happy) versus the lower similarity across different categories (Happy-to-Sad), the emotion detection method was enhanced.
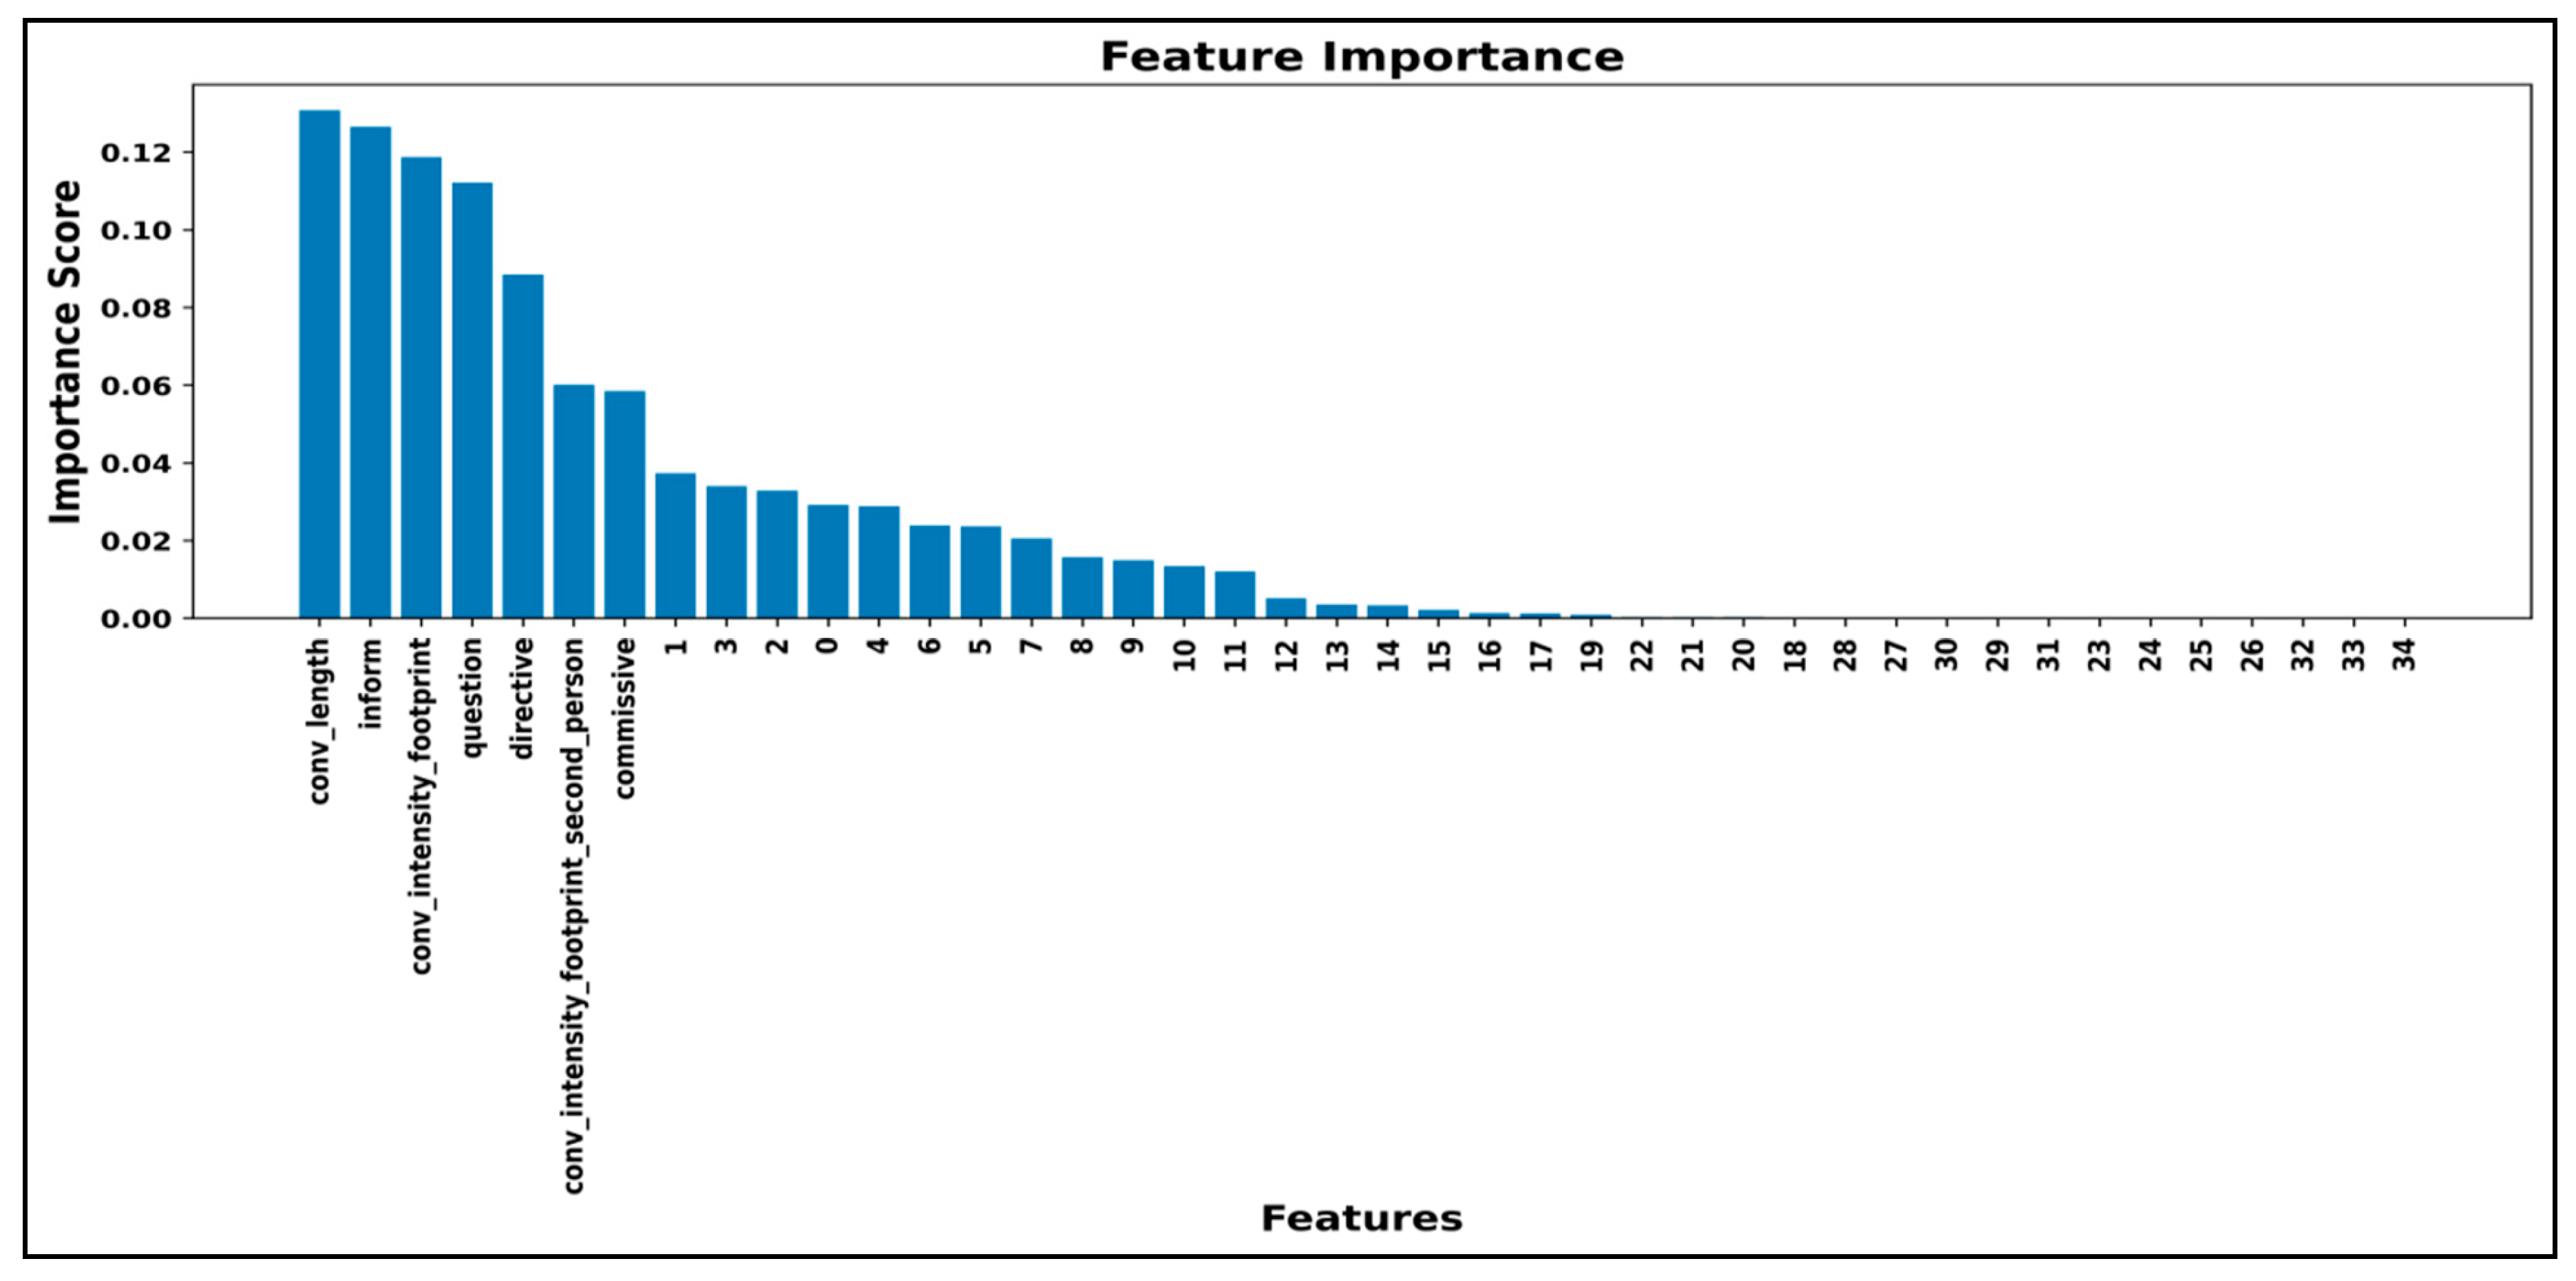
The proposed DSFO-STDMP model is used for identifying and retaining only the most important attributes from the dataset. As shown in Figure 5, feature important results are obtained due to their relevance. Feature importance visualization for emotional footprint identification involves data inputs (facial features, acoustic cues, text terms, physiological signals, etc.) to enhance the prediction of a specific emotion.
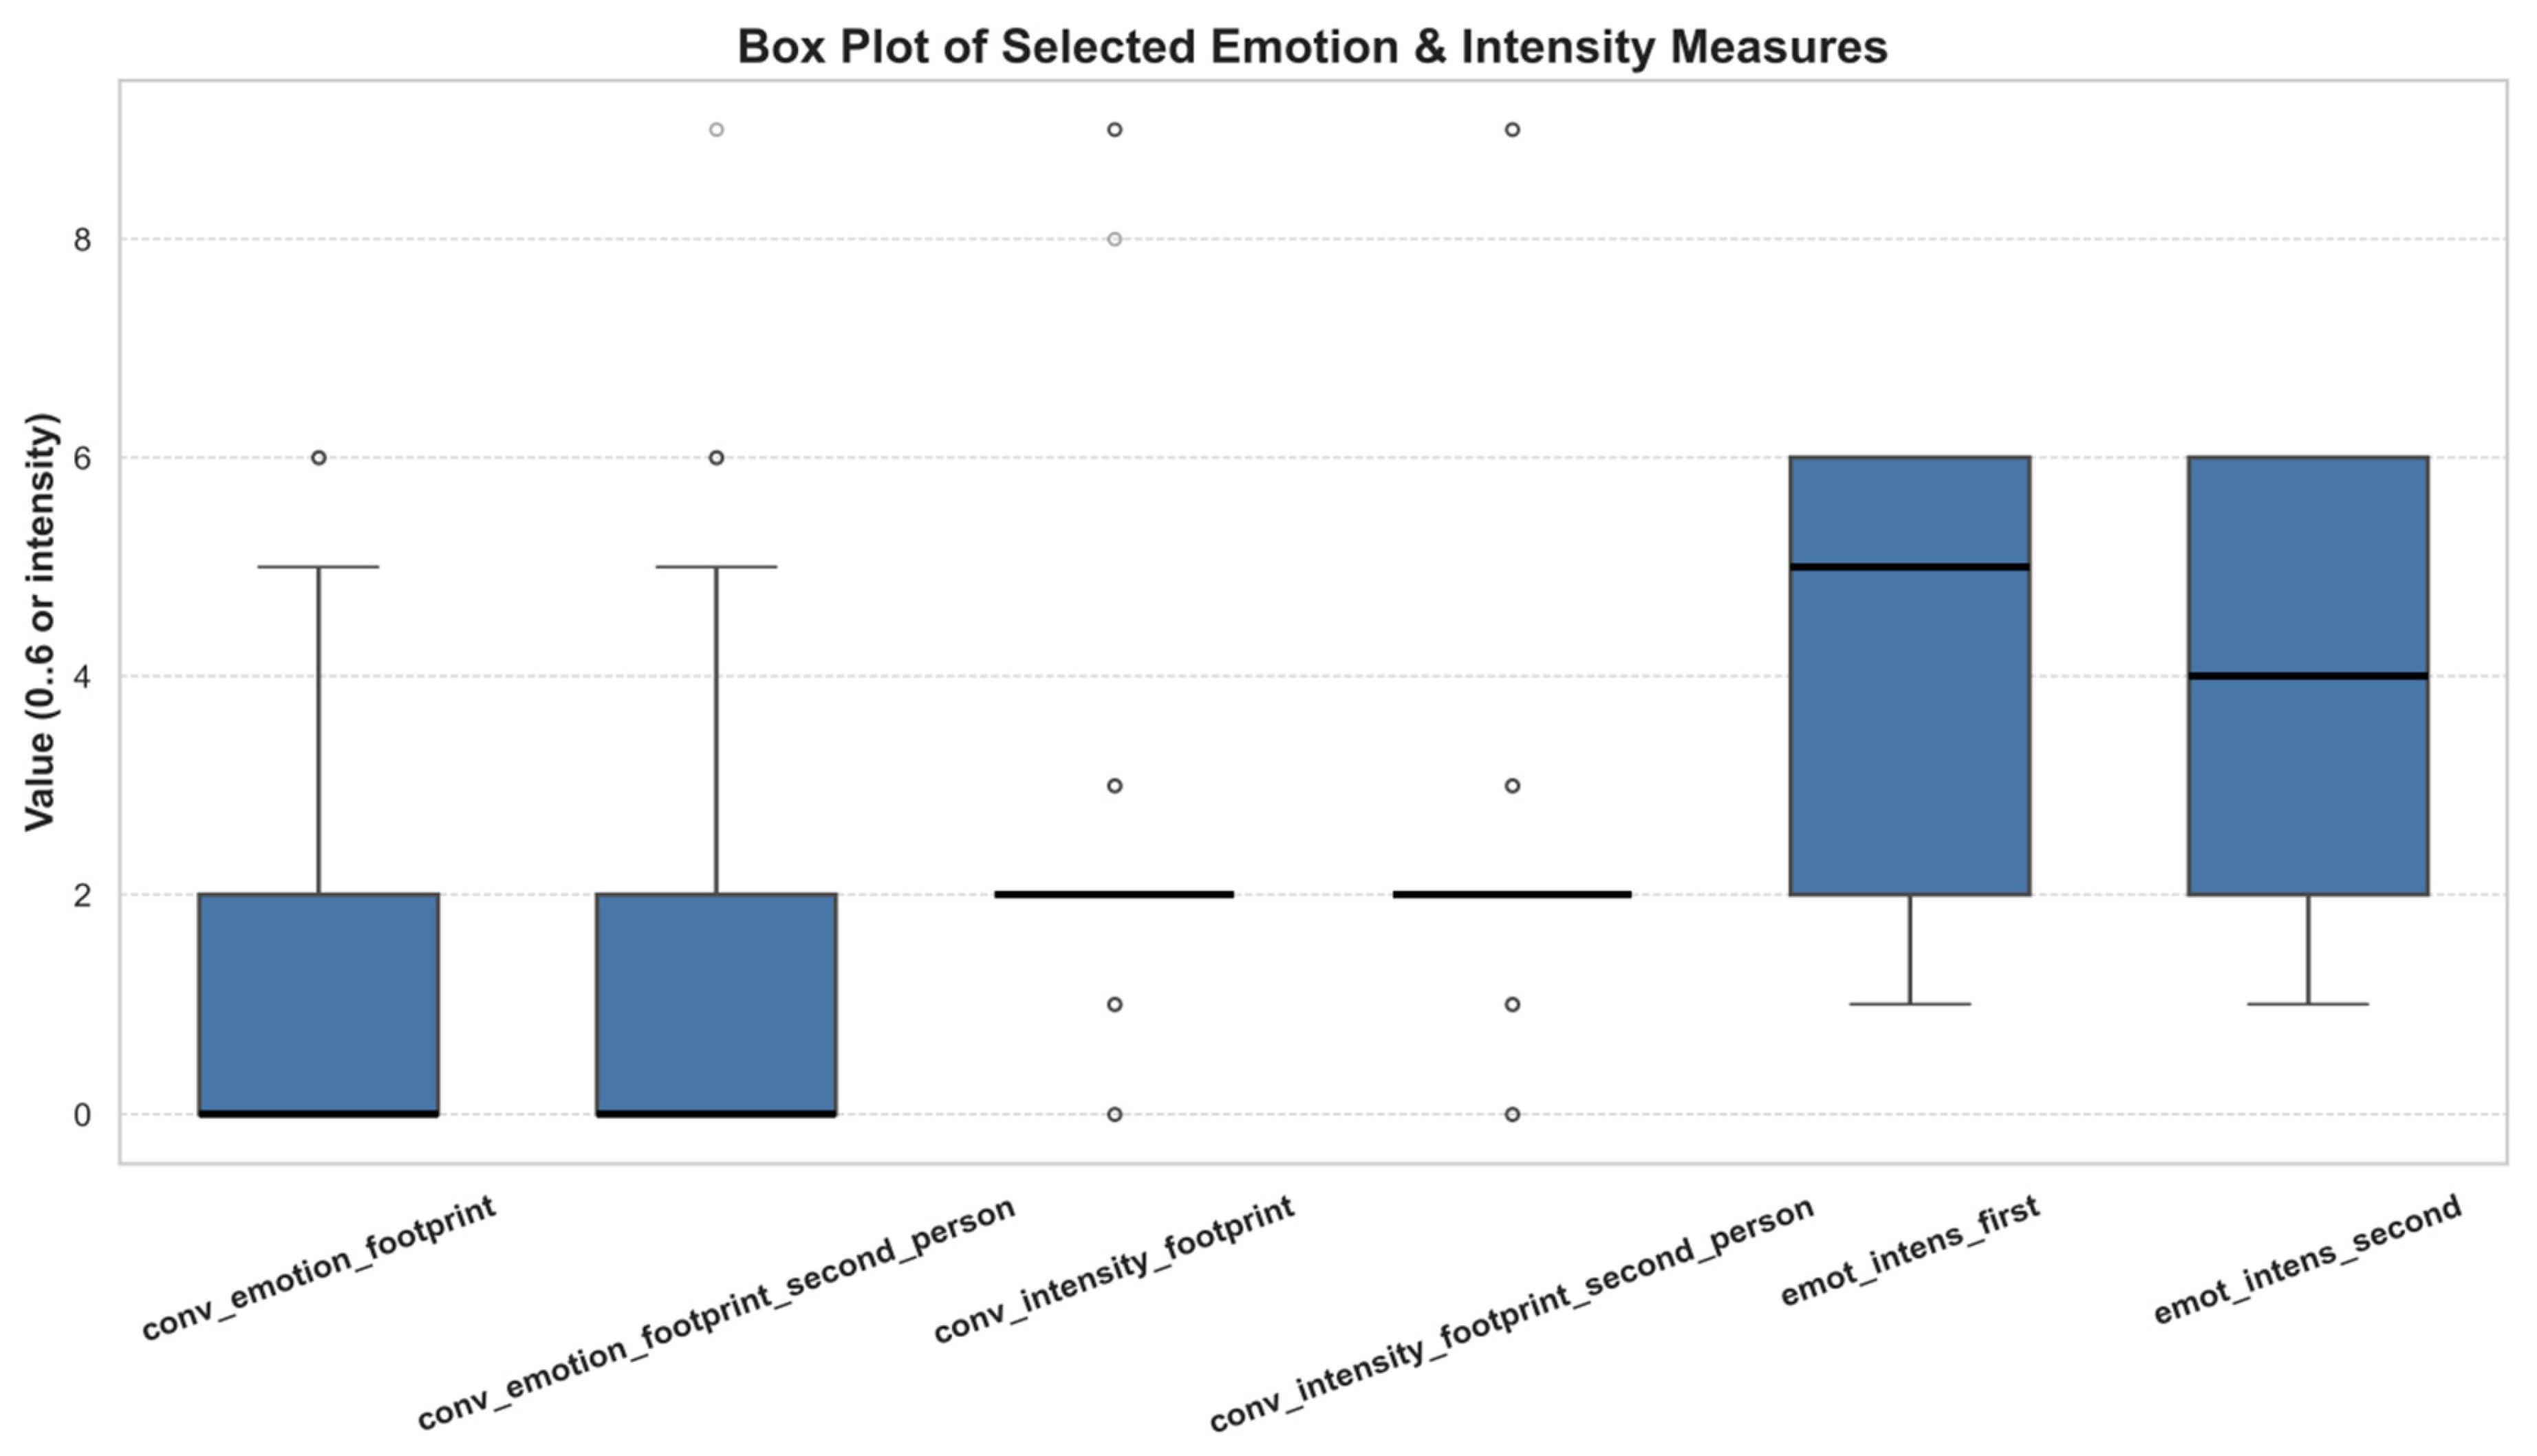
In Figure 6, the box plot denotes the distribution of intensity measures across different emotions for each emotion category. After the feature selection, different classes of emotional footprint for a particular person are carried out using the Rosenthal correlative stochastic-tuned deep multilayer perceptron classifier, which analyzes the correlation score between data samples and provides the final multiclass classification outputs.

5. Performance Comparison Analysis

The performance of the proposed DSFO-STDMP is compared with EMOVOX [1] and SDR-GNN [2] using multiple evaluation metrics, such as accuracy, precision, recall, F1 score, and training time, across varying data samples.

5.1. Performance Analysis of Accuracy

Accuracy in emotional classification refers to a model or system that correctly identifies and classifies emotions expressed in input data samples taken from the dataset. Accordingly, the accuracy is measured using the following mathematical formula:
A c c = T P + T N T P + T N + F P + F N ·
where A c c dentoes an accuracy or emotional footprint identification accuracy, true positive value is denoted by ‘ T P ’, true negative value is denoted by ‘ T N ’, F P represents a false positive value, and ‘ F N ’ denotes a false negative value.
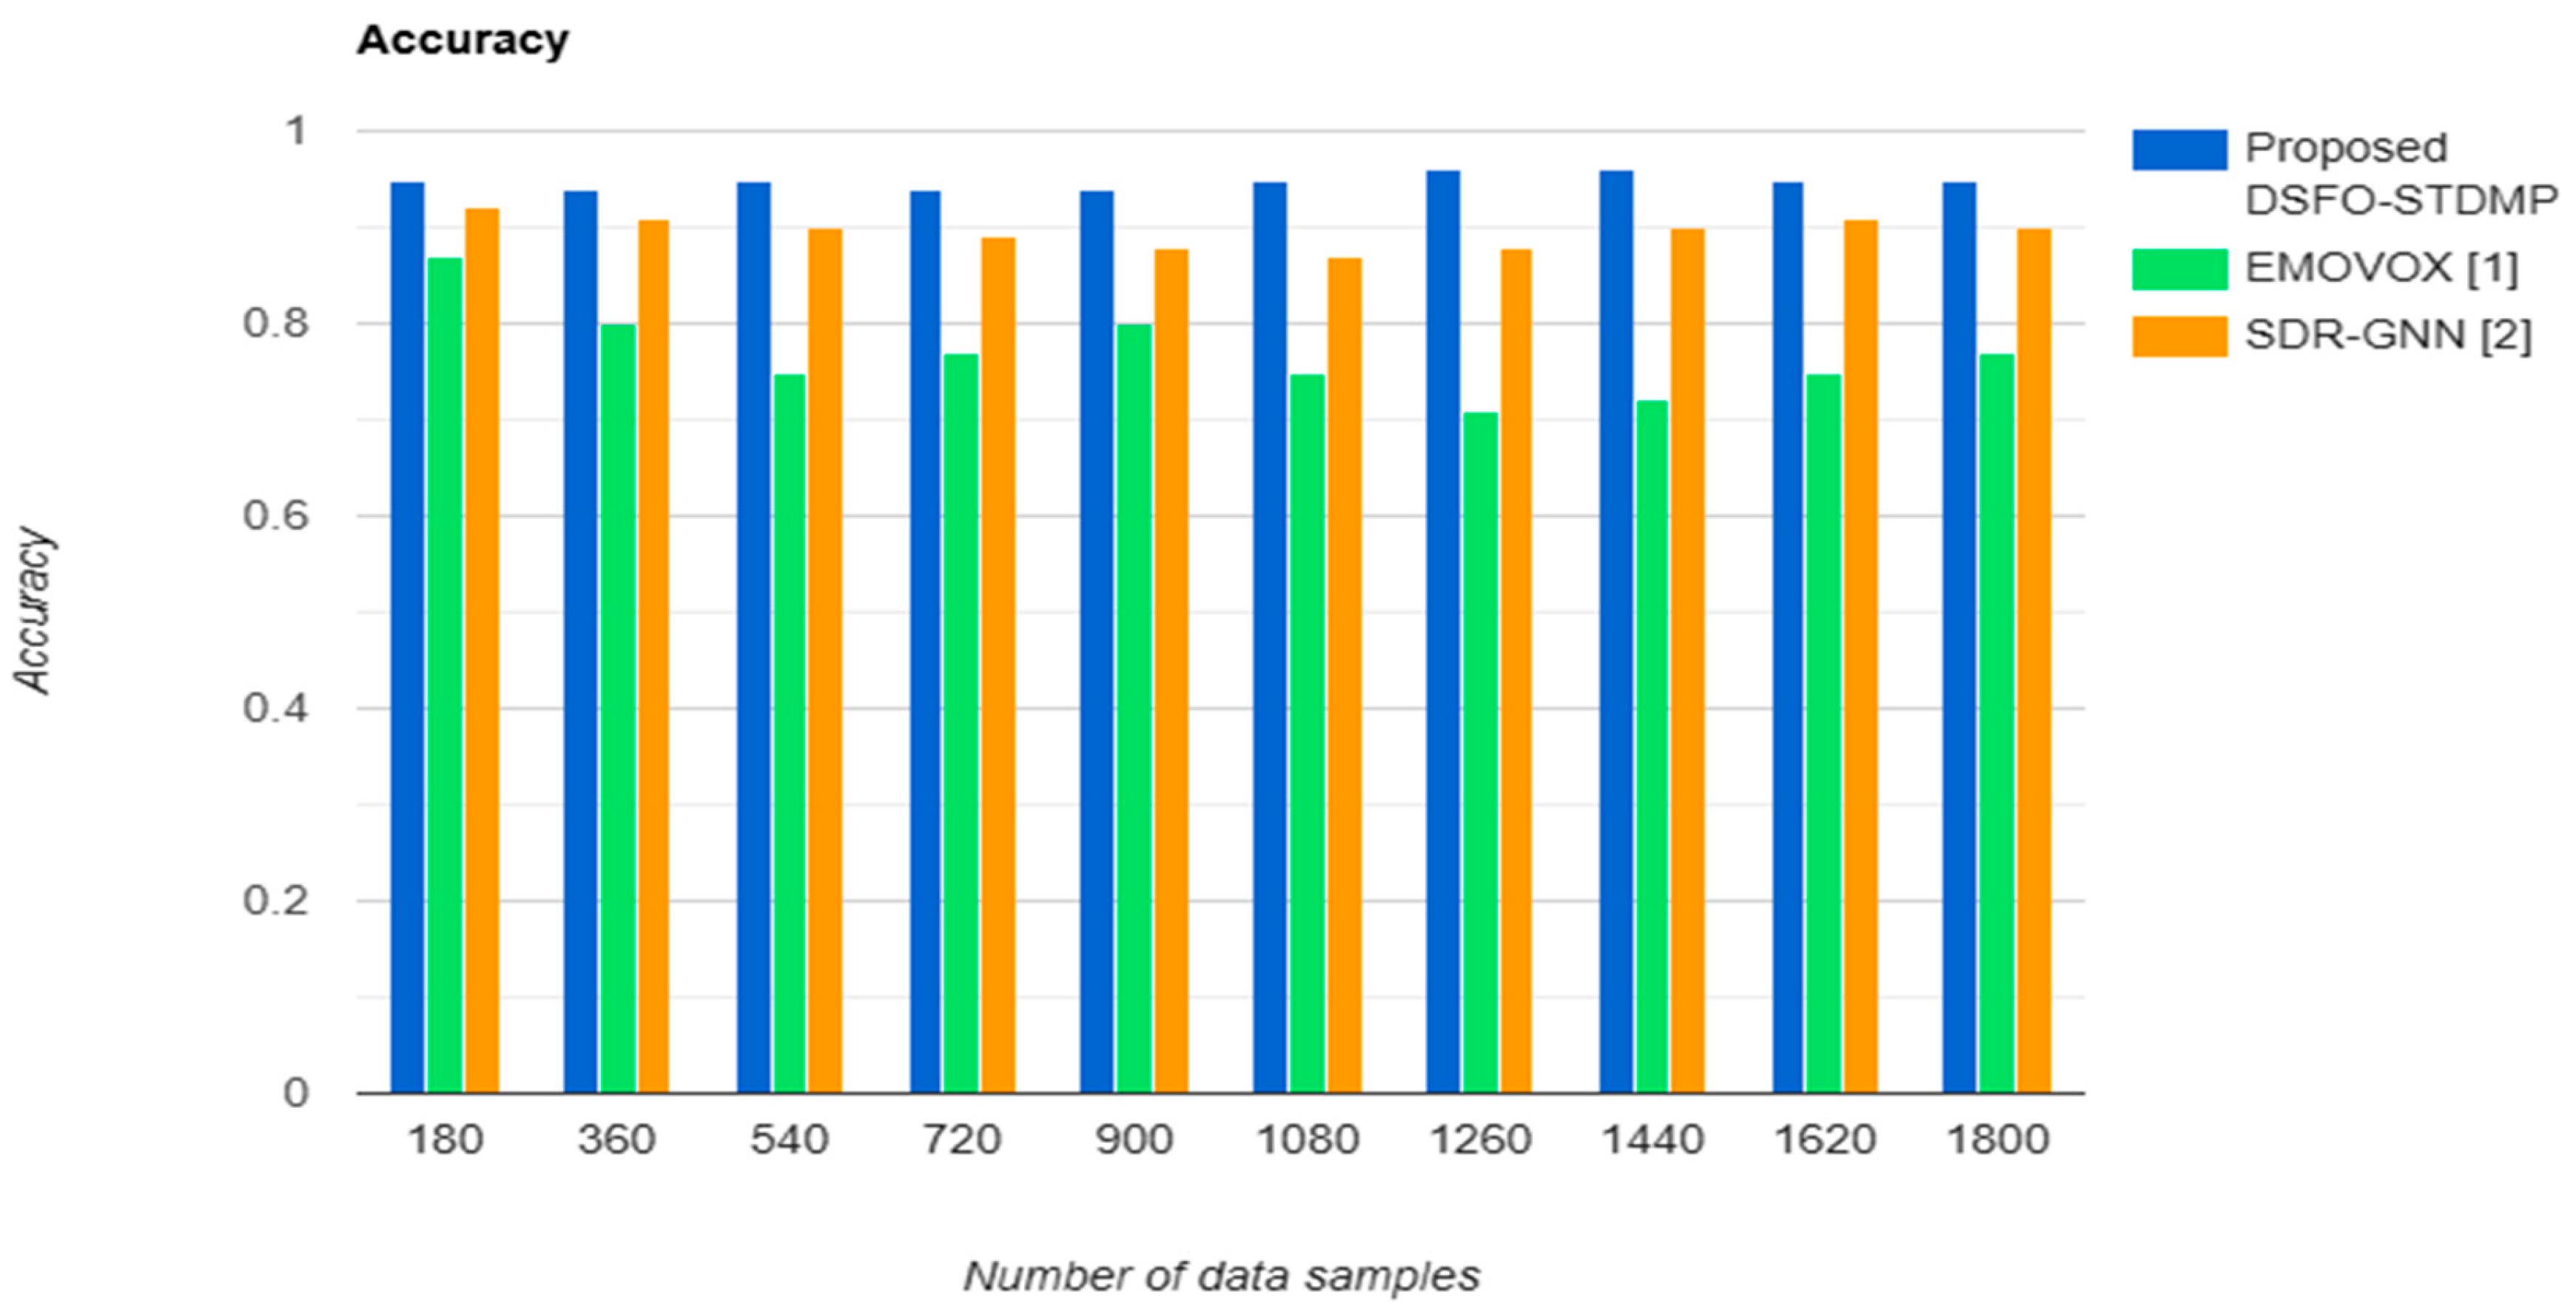
Table 2 reports the simulation outcomes of the accuracy while utilizing the three various methods regarding different numbers of data samples taken from the given dataset. Several data samples between 180 and 1800 were considered for the experimental scenario. The performance outcome in terms of accuracy of the proposed research work was evaluated by comparing the proposed DSFO-STDMP with the two existing methods. Using the data samples from the given dataset, as shown in Table 2, the average of 10 companion findings demonstrates that the proposed DSFO-STDMP model outperforms the two current methods in terms of accuracy. The graph is constructed based on the number of data samples and accuracy as below Figure 7 by considering the values obtained in Table 2.
Figure 7 presents a graphical comparison of the accuracy using the proposed DSFO-STDMP compared with EMOVOX [1] and SDR-GNN [2]. In Figure 7, the x-axis represents the number of data samples, while the y-axis indicates the accuracy results produced within 10 iterations when performing the emotional footprint identification using the three different techniques. The blue, green and yellow colors denote the proposed DSFO-STDMP, EMOVOX [1] and SDR-GNN [2]. The results clearly demonstrate that the DSFO-STDMP model significantly outperforms the other two existing methods. Considering 180 data samples, the DSFO-STDMP model accurately finds 171 emotions, and the accuracy is 0.95. Similarly, the 157 and 166 emotions are correctly determined, and the accuracy is 0.87 and 0.92, respectively, with similar counts of input. For each method, ten different accuracy results are attained. The average of ten various results indicates that the accuracy is found to be increased by 24% when compared to [1] and 6% when compared to [2], respectively.
These results highlight the effectiveness of the DSFO-STDMP model in enhancing emotional footprint identification performance. The DSFO-STDMP utilizes the use of a Rosenthal correlative stochastic-tuned deep multilayer perceptron classifier, which offers better accuracy in emotional footprint identification tasks. The deep learning classifier analyzes the data samples of the conversations with the help of the Rosenthal correlation function. Finally, the overall emotional identification is made, thereby improving the accuracy.

5.2. Performance Analysis of Precision

Precision is a performance metric that measures the accuracy of emotion-specific classification made by a model. In emotional recognition, precision indicates if data samples classified as a particular emotion were actually correct. Precision is defined as follows:
P r e = T P T P + F P ·
where precision ‘ P r e ’ is measured using the true positive instances ‘ T P ’ and the false positive instances ‘ F P ’, respectively.
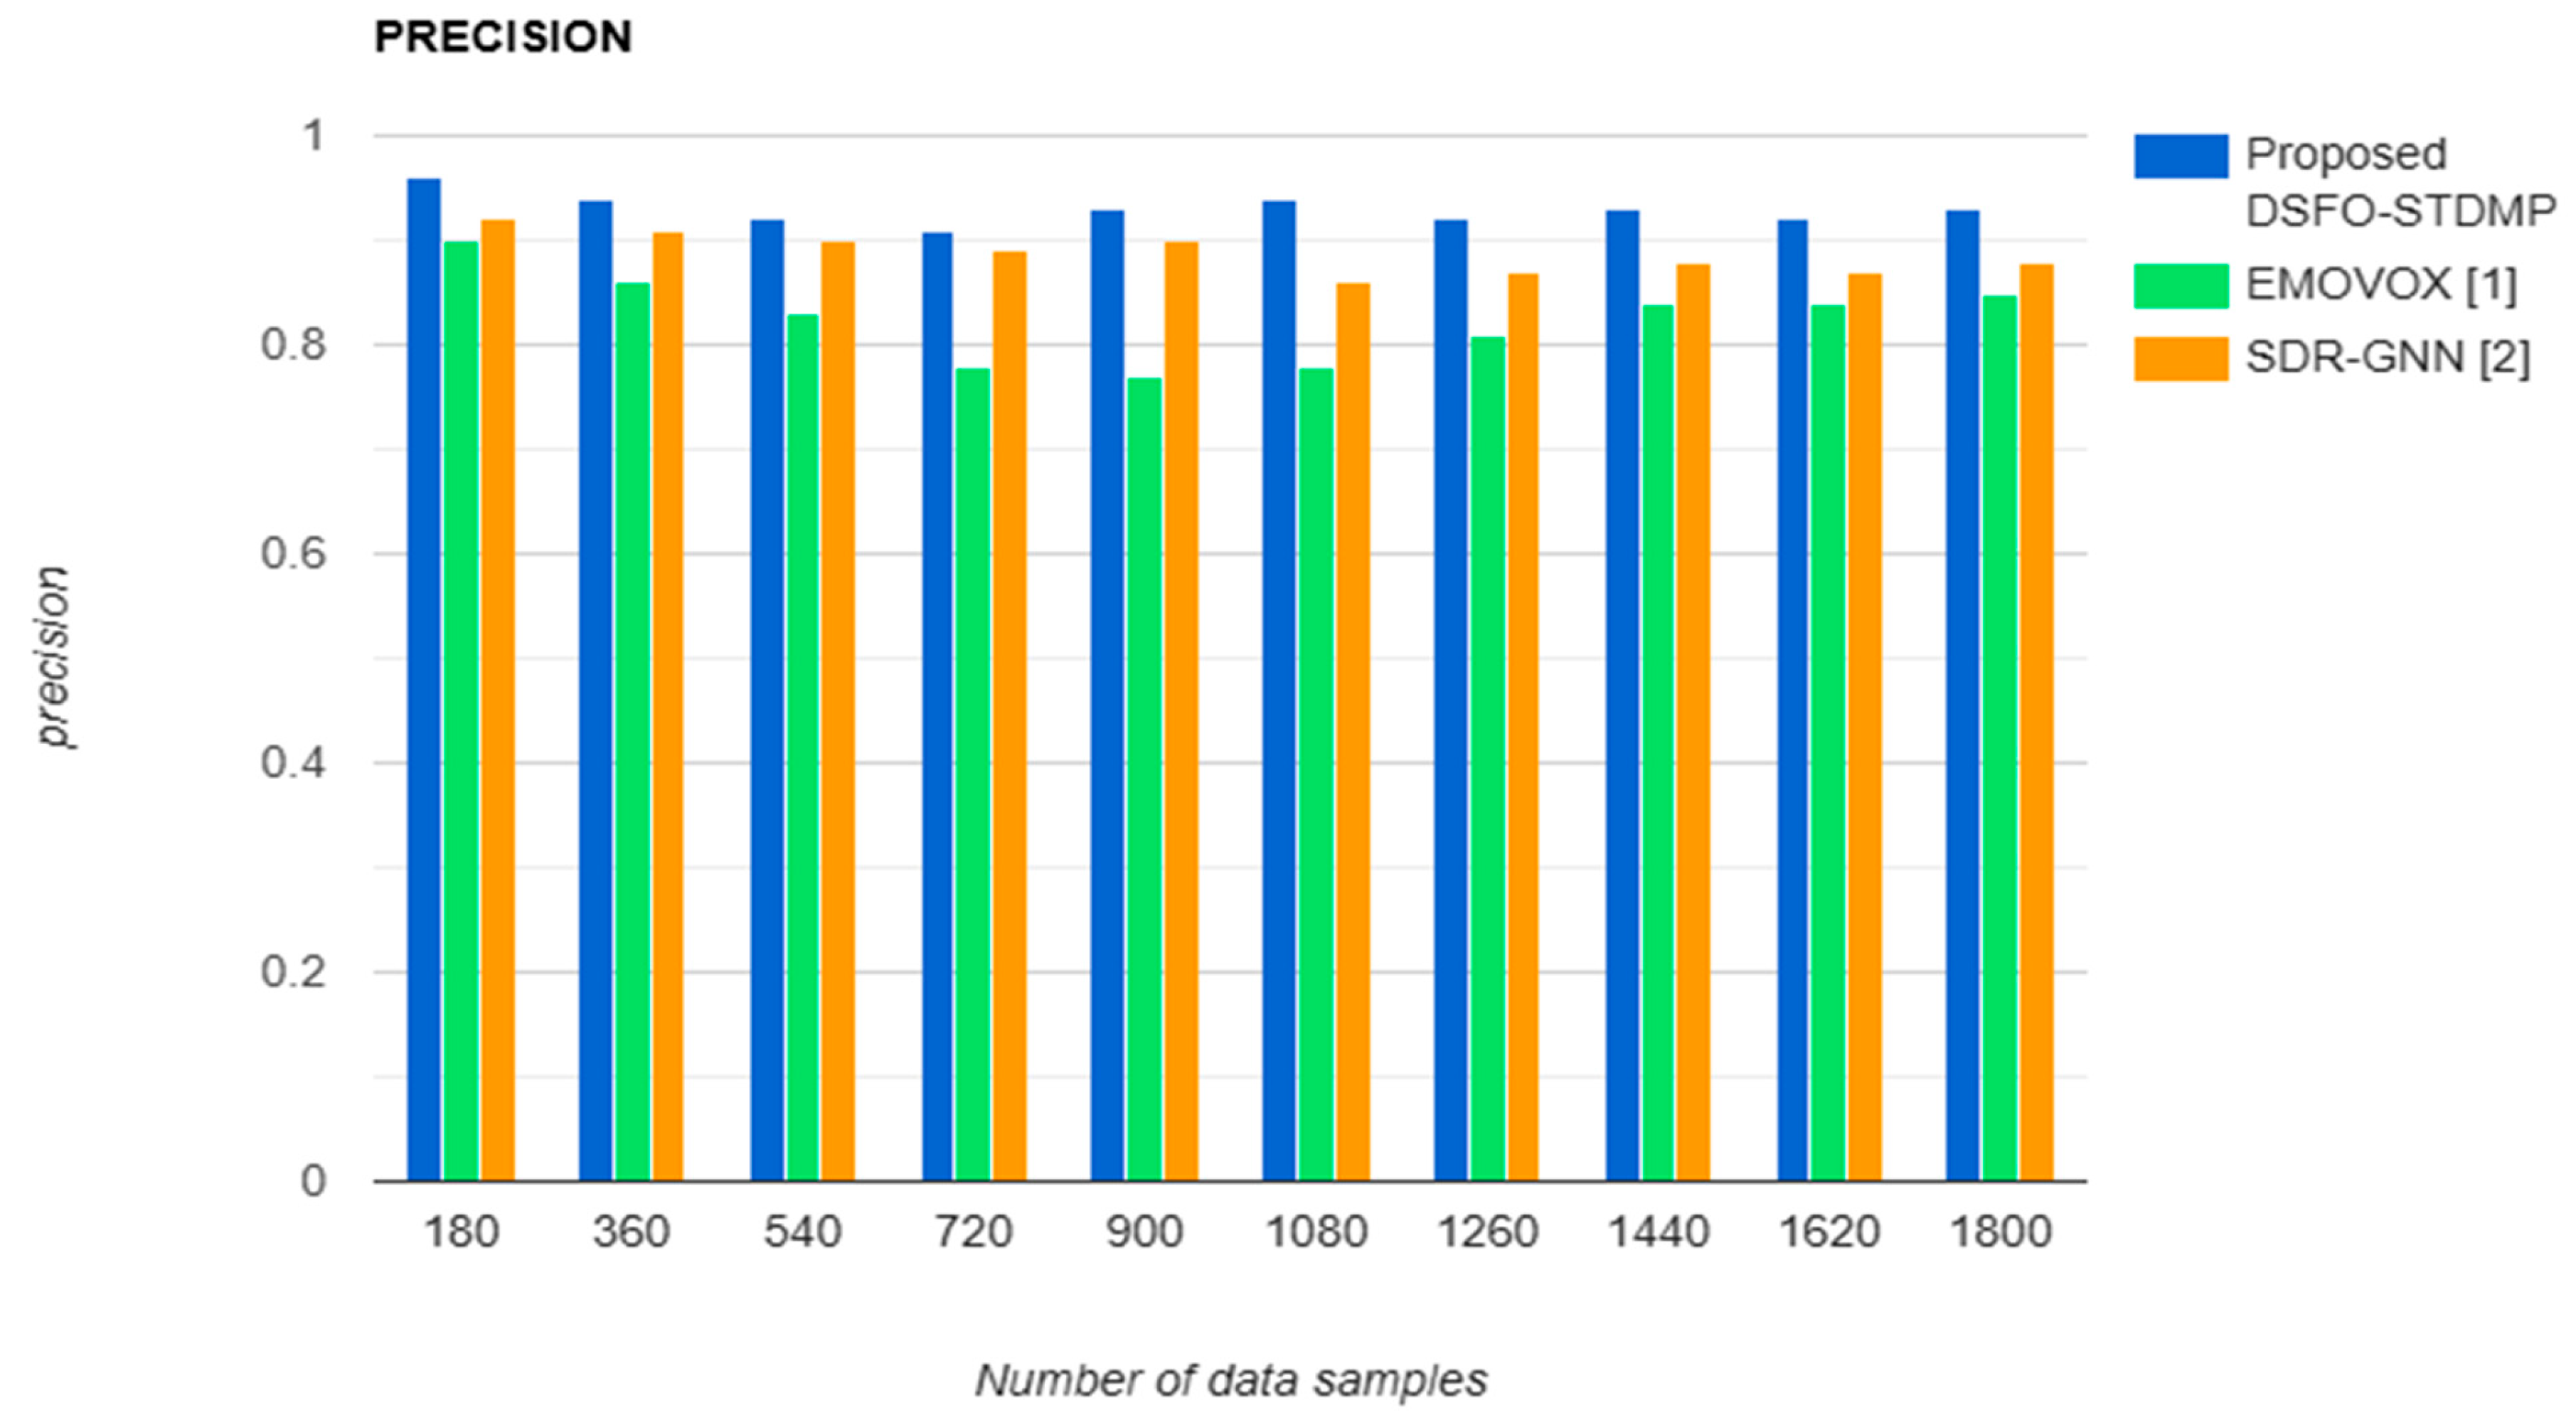
Table 3 compares the precision of the three distinct approaches, such as existing EMOVOX [1], SDR-GNN [2], and the proposed DSFO-STDMP method, regarding data samples in the given dataset. The experiment results show that the performance of precision using the three techniques successfully increased the precision while predicting the emotion footprint. In comparison to the other two existing approaches, the proposed DSFO-STDMP method predicts the emotion footprint more effectively with a higher precision. According to the values in Table 3, a graph was plotted based on data samples and precision, as shown in Figure 8.
Figure 8 above depicts the precision performance of emotional footprint identification across a varying number of data samples, ranging from 180 to 1800. The precision of the three models was evaluated, comparing the proposed DSFO-STDMP with EMOVOX [1] and SDR-GNN [2]. In the graph, the x-axis represents the number of data samples, while the y-axis indicates the precision scores of each method. The results clearly illustrate that the DSFO-STDMP model considerably delivers higher precision compared to the other two methods. For instance, with 180 data samples, the DSFO-STDMP model achieved precision scores of 0.96, whereas the other methods recorded values of 0.9 [1] and 0.92 [2]. Finally, the average of ten results indicates that the DSFO-STDMP model enhanced the performance of precision by 13% and 5% when compared to methods [1] and [2], respectively. This enhanced precision is achieved by applying a Rosenthal correlative stochastic-tuned deep multilayer perceptron classifier. In the fine-tuning phase of a deep learning model, the stochastic gradient method is employed to adjust the weights between layers to minimize the emotional identification error. The deep learning structure improves emotional footprint identification by increasing the true positive rate and minimizing false positives, finally leading to more accurate results.

5.3. Performance Analysis of Recall

Recall, also known as sensitivity, measures the ability of the model to correctly identify actual positive cases. It is defined as the proportion of true positives (TPs) to the sum of true positives (TPs) and false negatives (FNs). The recall is measured as follows:
R e c = T P T P + F N ·
where ‘ R e c ’ indicates recall, T P ’ denotes a true positive rate, and F N ’ denotes a false negative rate.
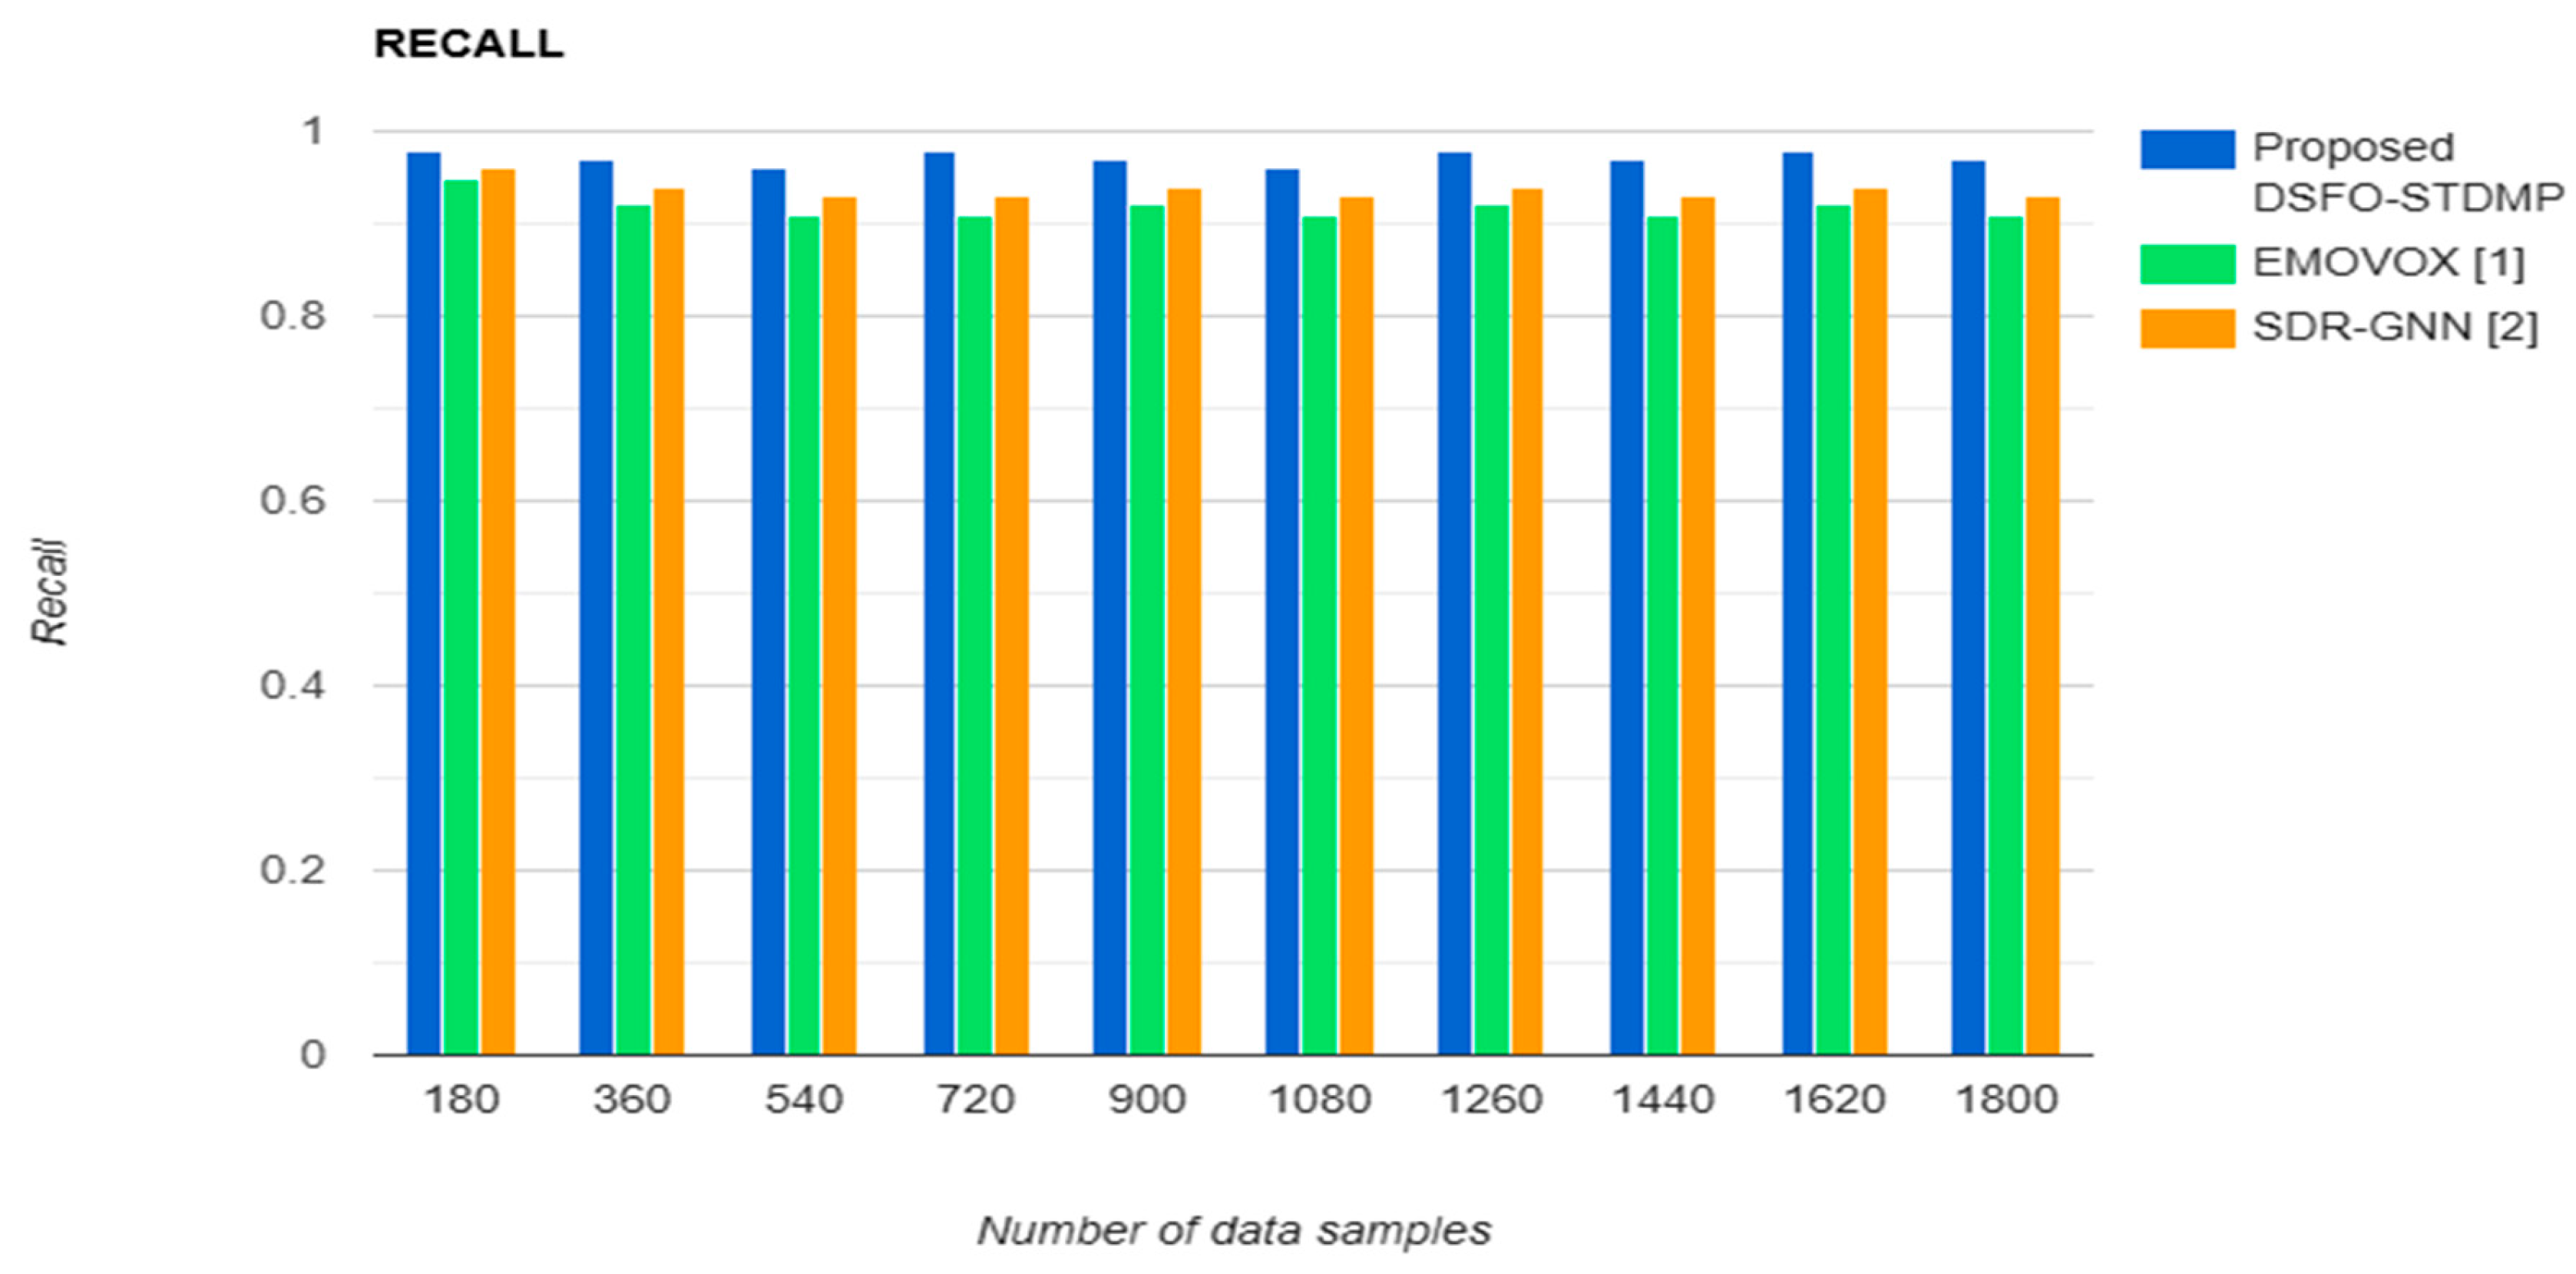
The experimental results of the recall using three different methods under consideration for various numbers of data samples are shown in Table 4. Two existing approaches are compared to the proposed DSFO-STDMP to assess its efficacy in emotion footprint identification. During emotion footprint identification, the recall is successfully improved by the proposed DSFO-STDMP when compared to the other two existing methods. The graph is plotted as shown in Figure 9, based on the values in Table 4.
Figure 9 above depicts the recall performance in emotional footprint identification relative to the number of data samples, ranging from 180 to 1800. The x-axis denotes the number of data samples, while the y-axis represents the corresponding recall values achieved by each method. The three models, namely the proposed DSFO-STDMP EMOVOX [1] and SDR-GNN [2] models, have been applied to evaluate the performance of precision. Among the three methods, the DSFO-STDMP model consistently achieves superior recall performance. For example, with 180 data samples, the DSFO-STDMP model attained a recall score of 0.98, compared to 0.95 for [1] and 0.96 for [2]. The average of ten separate trials indicates that the DSFO-STDMP model demonstrated a better improvement in recall of 6% compared to [1] and 4% compared to [2]. This enhanced recall is achieved due to the model’s use of a deep learning classifier framework. In this approach, the stochastic gradient method is applied based on their error rates. This strategy effectively reduces false negatives and enhances the true positive rate, thereby significantly improving the overall recall performance.

5.4. Performance Analysis of F1 Scores

F1 score, also known as the F measure, refers to the harmonic mean of precision as well as recall, and it is formulated as follows:
F 1   s c o r e = 2     P r e R e c P r e + R e c ·
where P r e denotes a precision, and R e c denotes a recall.
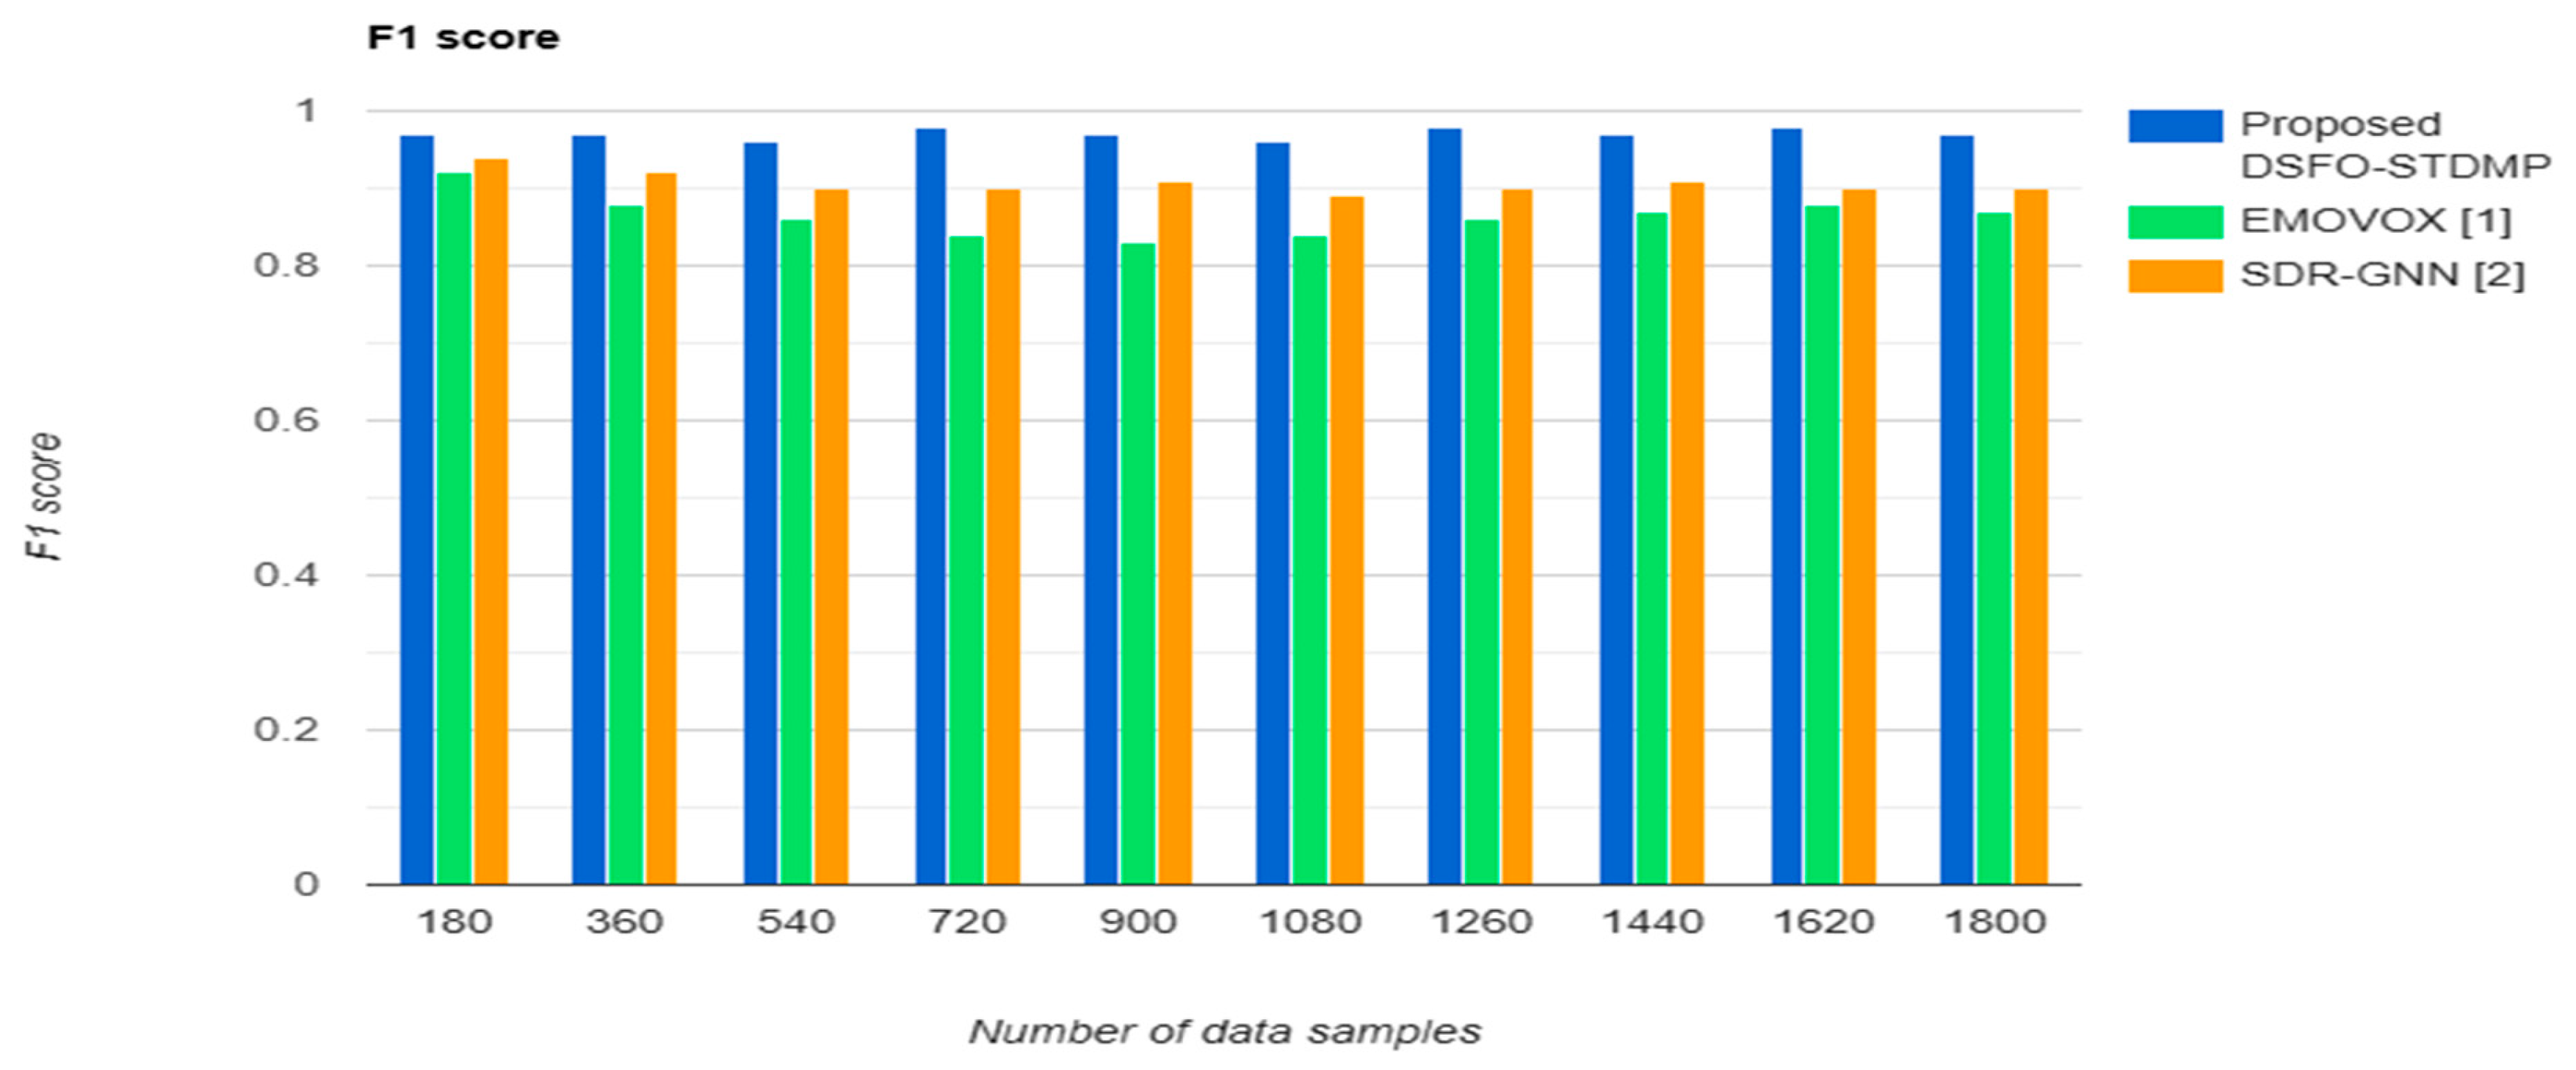
Table 5 reports the simulation results of the F1 score. In order to calculate the F1 score, 180 to 1800 data samples were considered as input. In particular, when experimented with 180 samples, the DSFO-STDMP model, [1,2] achieved F1 scores of 0.97, 0.92, and 0.94, respectively. From the results above, it is evident that the F1 score of the DSFO-STDMP model is enhanced. The ten different results of the F1 scores of the three methods are shown in Figure 10.
Figure 10 illustrates the F1-score performance versus the number of data samples, comparing the three models: the proposed DSFO-STDMP, EMOVOX [1] and SDR-GNN [2]. From the figure, it is illustrative that the number of data samples is taken as the input in the ‘ X -axis and the performance results of the F1 score are obtained at the ‘ y ’ axis. As shown in Figure 8, the proposed DSFO-STDMP model has a higher F1 score as compared to EMOVOX [1] and SDR-GNN [2]. In addition, while increasing the number of data samples, F1 score is also increased using all three methods.
The F1-score balances both precision and recall, serving as a key assessment metric in this comparison. The results clearly illustrate that the DSFO-STDMP model achieves significantly superior F1-scores compared to the other two methods. This enhanced performance is achieved due to the model’s ability to concurrently improve both precision and recall in emotion footprint identification tasks. The improvement is achieved due to the effective use of a deep learning classifier within the DSFO-STDMP model, which delivers more robust and accurate predictions. Overall, the F1-score of the DSFO-STDMP model is observed to be 12% higher than that of [1], and 7% higher than that of [2].

5.5. Performance Analysis of Emotional Footprint Identification Time

It is defined as the amount of time consumed by the algorithm for emotional footprint identification. Therefore, the overall training time is formulated as follows:
E F I T = i = 1 n S i     T i m e   E F I ·
where the emotional footprint identification time ‘ E M I T ’ is measured based on the total number of conversation data samples ‘ S i ’ and the time involved in identifying the emotional footprint ‘ T i m e   E F I ’. It is measured in seconds (sec).
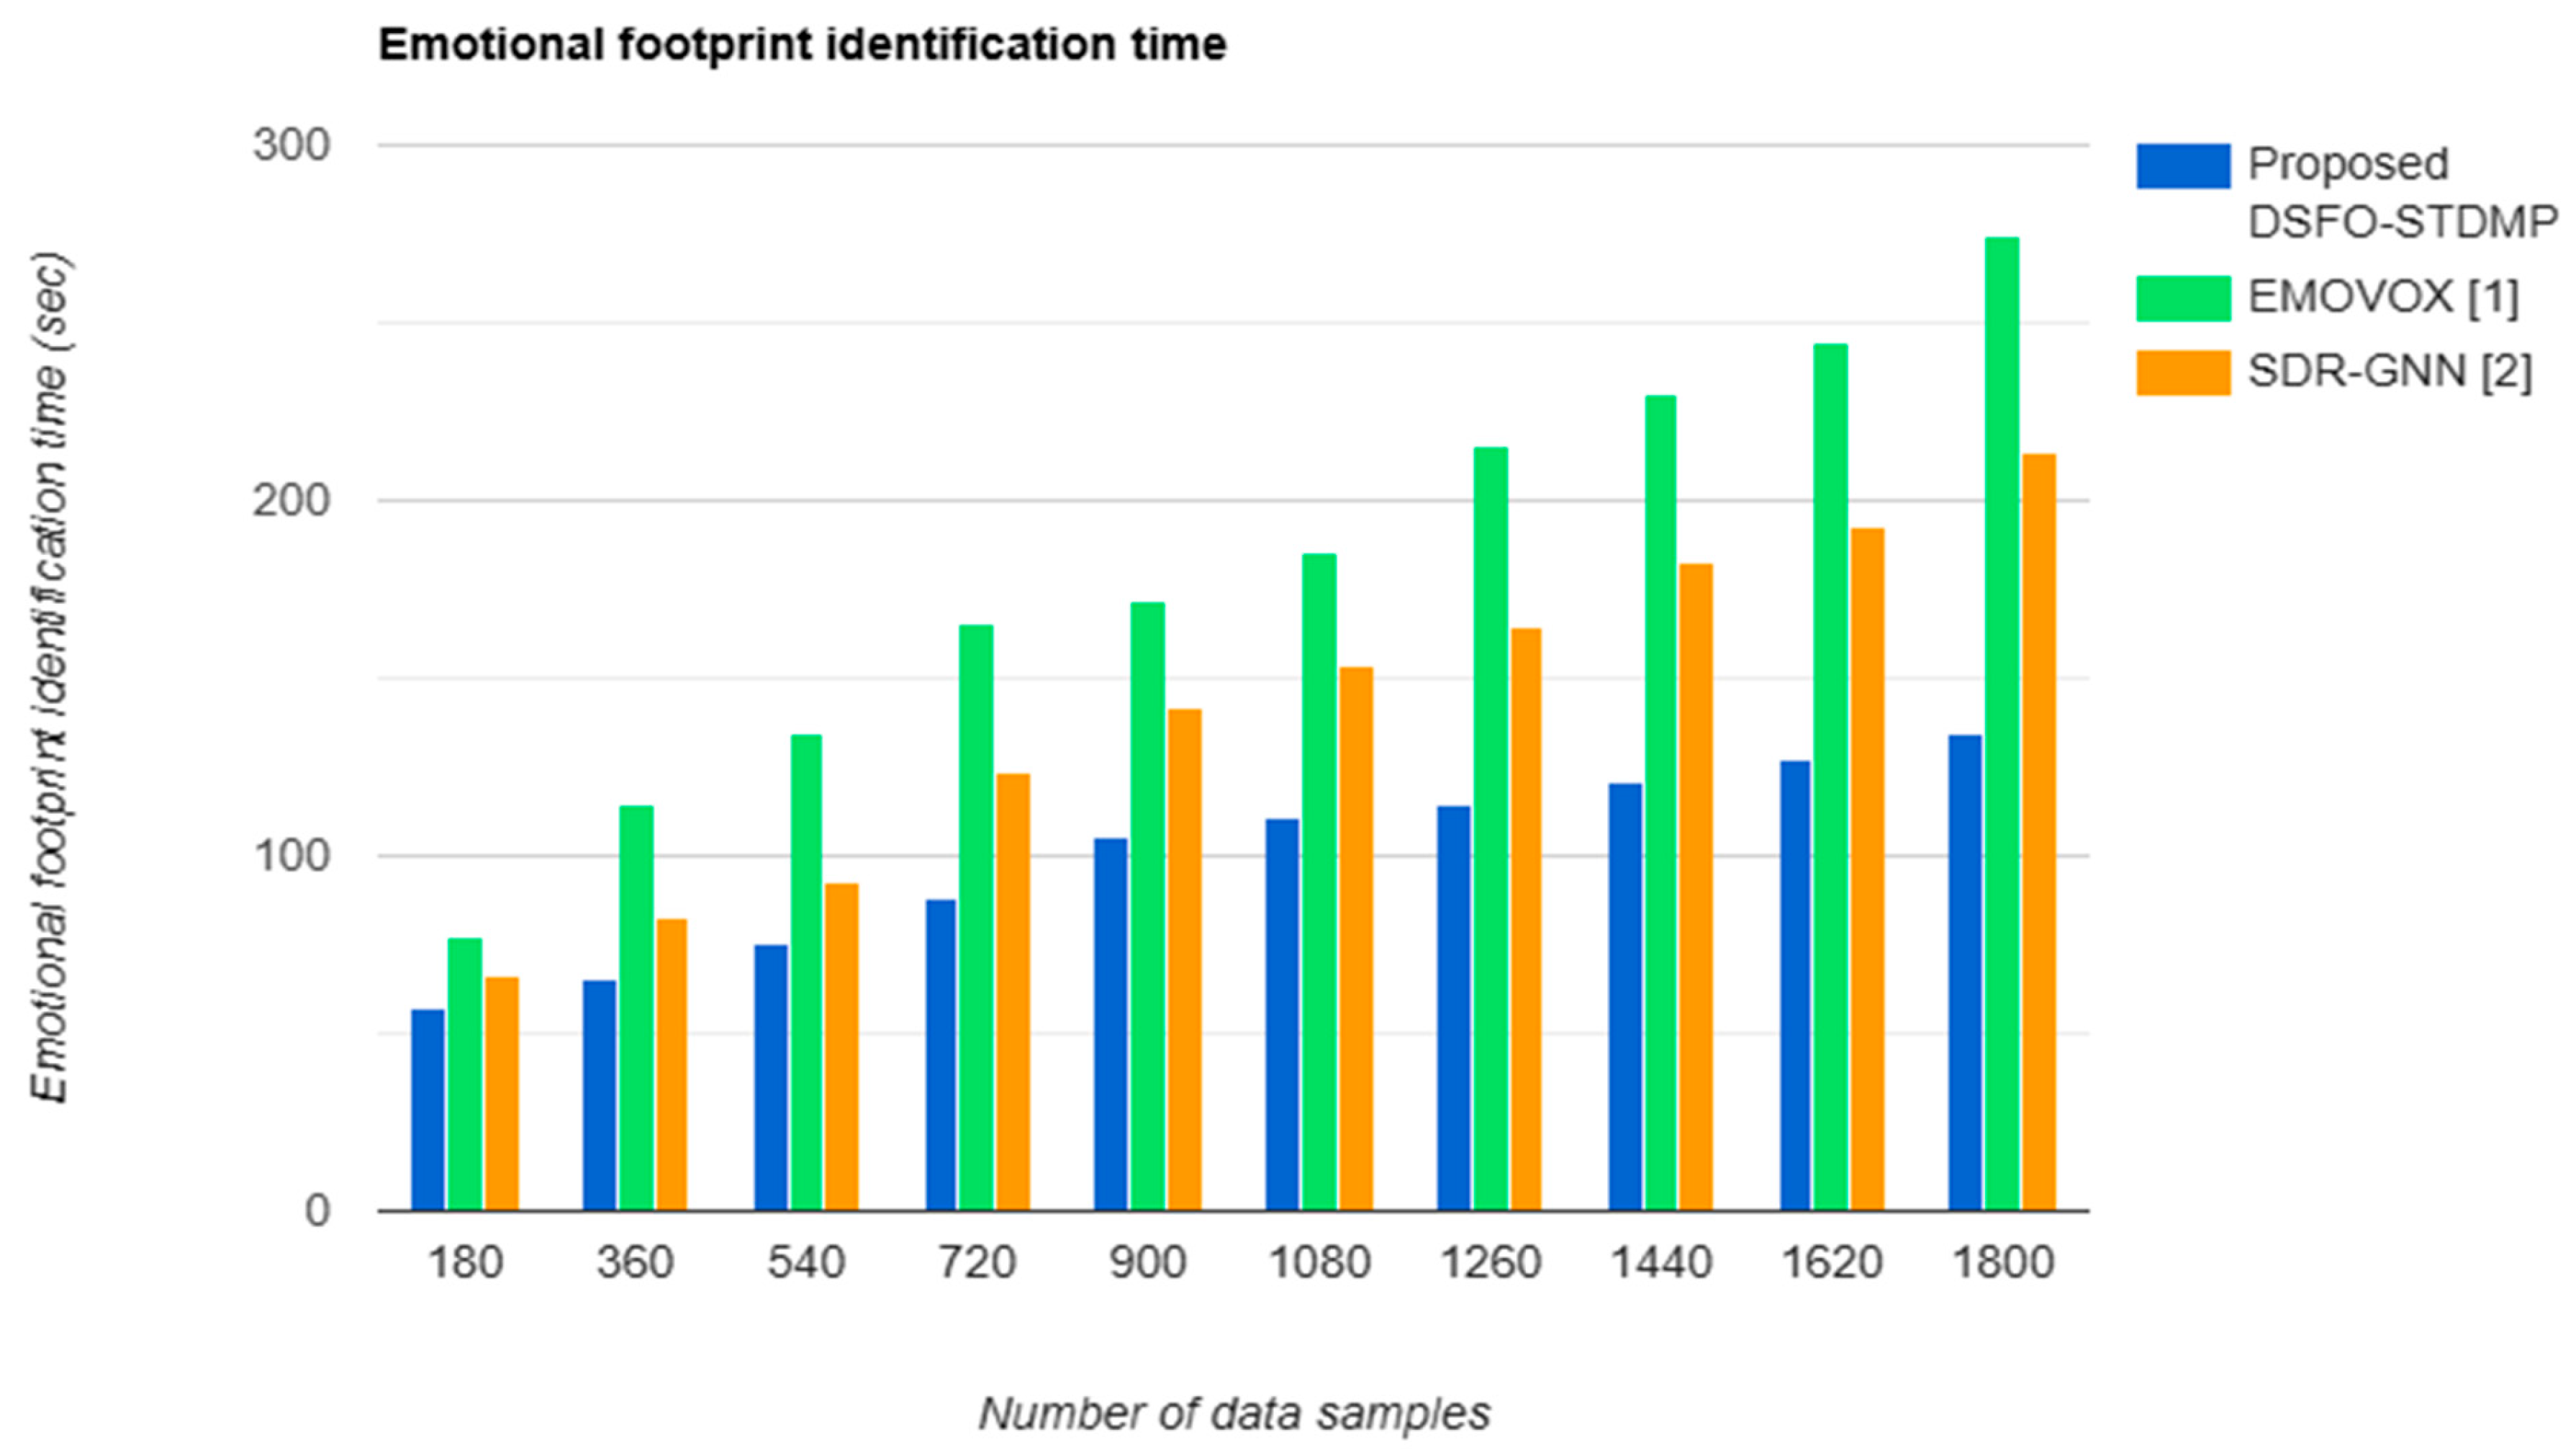
According to the consideration of different numbers of data samples, the performance of the emotional footprint identification time for the existing EMOVOX [1] and SDR-GNN [2], and the proposed DSFO-STDMP, is shown in Table 6. The numbers of data points taken for this experiment were 180, 360, 540… and 1800, and subsequently, the emotional footprint identification times are estimated. As shown in Table 6, even if three methods minimize the time for emotional footprint identification, the proposed DSFO-STDMP predicts emotional footprint in a shorter amount of time than the other two existing methods. Based on the values in Table 6, the graph is plotted as shown in Figure 11.
Figure 11 presents the overall performance of the emotional footprint identification time using three different models, namely the proposed DSFO-STDMP, EMOVOX [1], and SDR-GNN [2]. Each model was evaluated through ten simulation runs using 1800 distinct data samples. As illustrated in Figure 11, an increase in the number of data samples corresponds to a rise in identification time across all models. However, in a specific experiment involving 180 data samples, the DSFO-STDMP model needed only 57.6 ms to complete the emotional footprint identification, compared to 77.4 ms for [1] and 66.6 ms for [2]. Likewise, different counts of samples were taken for experimentation and obtained different results. The DSFO-STDMP model is efficient, and it requires less time. The average emotional footprint identification was found to be reduced by 43% compared to [1] and 27% compared to [2].
The improvement was achieved due to the feature selection steps incorporated in the DSFO-STDMP model. The Sokal–Sneath divergence shuffling shepherd optimization was applied in the DSFO-STDMP model to select more important features and remove the others. This optimization step of the proposed model accurately performs the feature reduction process, thereby minimizing the overall time consumption of emotional footprint identification.

5.6. Confusion Matrix

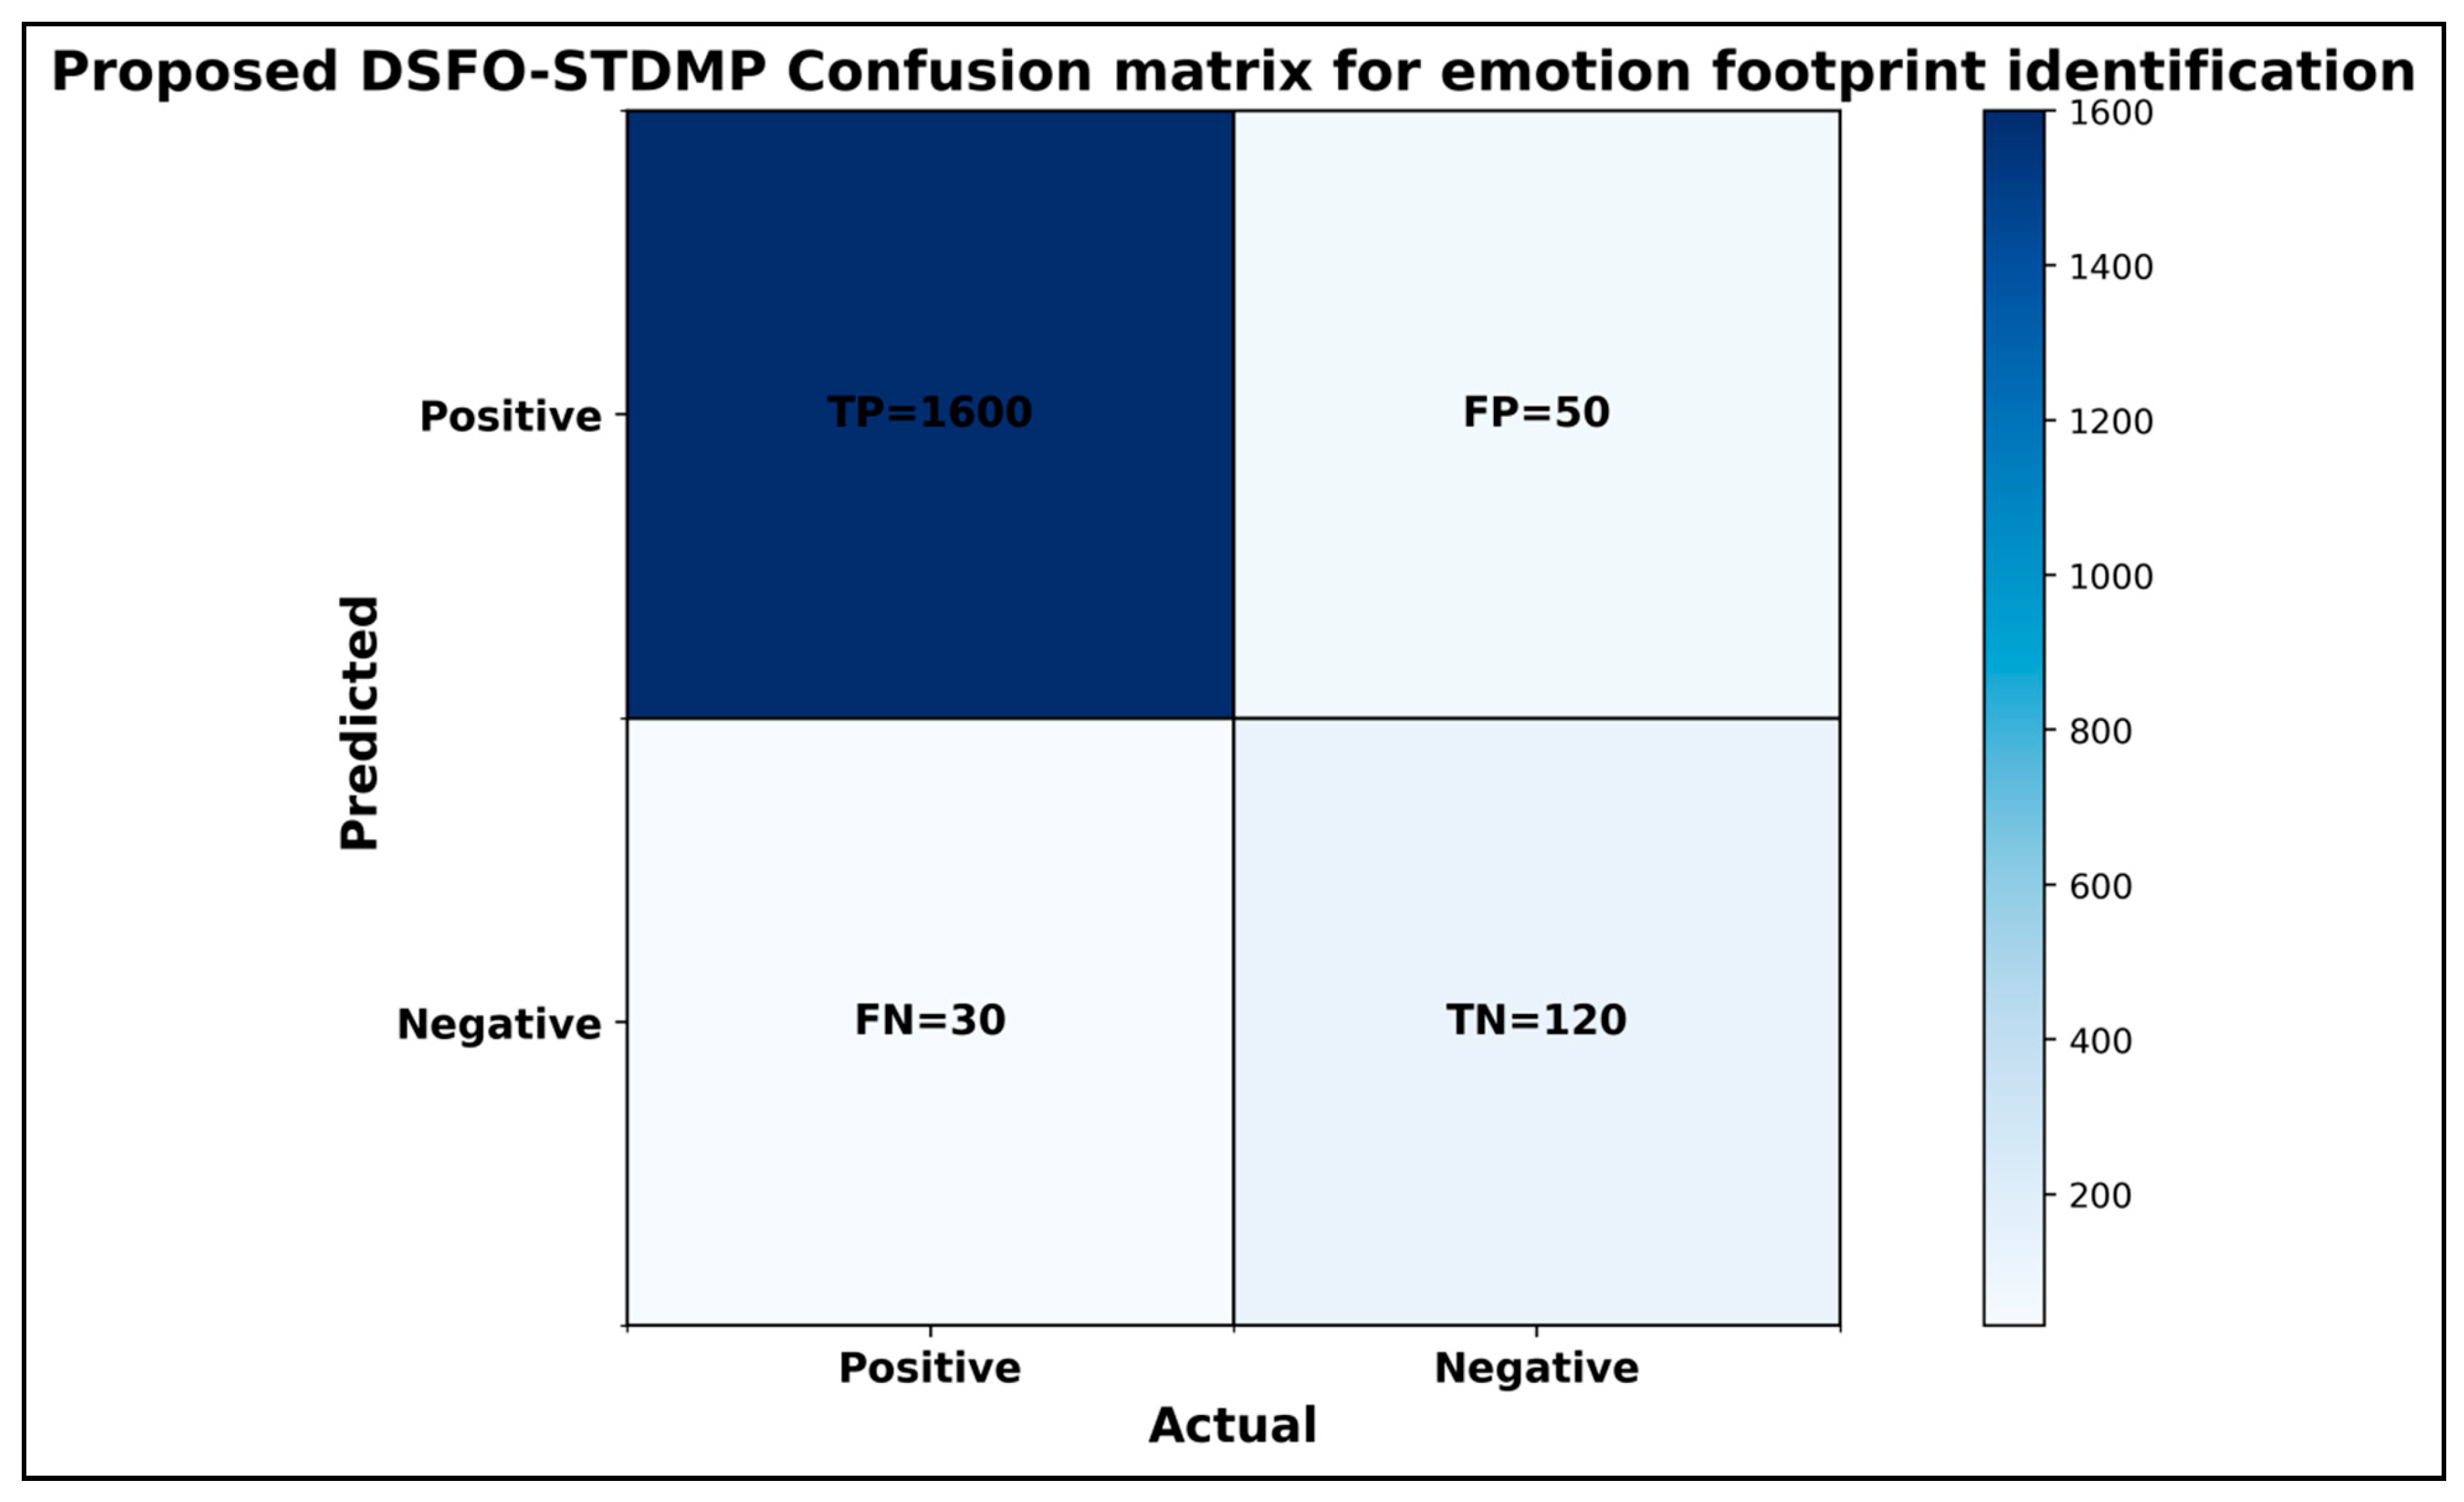
A confusion matrix is a valuable tool in classification and was used for evaluating the performance of the proposed DSFO-STDMP model. It summarizes the classification results by comparing the actual (true) labels with the predicted labels generated by the model.
As shown in Figure 12, the confusion matrix of the proposed DSFO-STDMP is presented using 1800 data samples. The analysis of the results shows that the DSFO-STDMP achieved 1600 true positives ‘TPs’ and 120 true negatives ‘TNs’, with 50 false positives ‘FPs’ and 30 false negatives ‘FNs’.

5.7. Ablation Study

The ablation study was carried out in a deep multilayer perceptron (DMP) to implement the contributions of data collection, feature selection and classification to enhance the overall performance. The DMP was carried out to perform accurate emotional footprint identification. The DMP was combined with the Sokal–Sneath divergence shepherd feature optimization (SSDSSO) to choose optimal features and eradicate others from the dataset. Finally, Rosenthal correlation, stochastic gradient, and softmax activation functions were integrated in RCG-FT-DMLP for efficient classification. The assessment was carried out to improve the accuracy in minimal time. The ablation study is illustrated in Table 7.
Table 7 shows the performance of four methods, SSDSSO, DMP, RCG-FT-DMLP and DSFO-STDMP, on the Two-Party Conversation with Emotional Footprint and Emotional Intensity dataset. The DMP model achieved an accuracy and precision of 0.85 and 0.80, respectively. The proposed DSFO-STDMP attained a higher accuracy of 0.92 on a cardiovascular dataset. The experimental results show the efficiency of DSFO-STDMP.

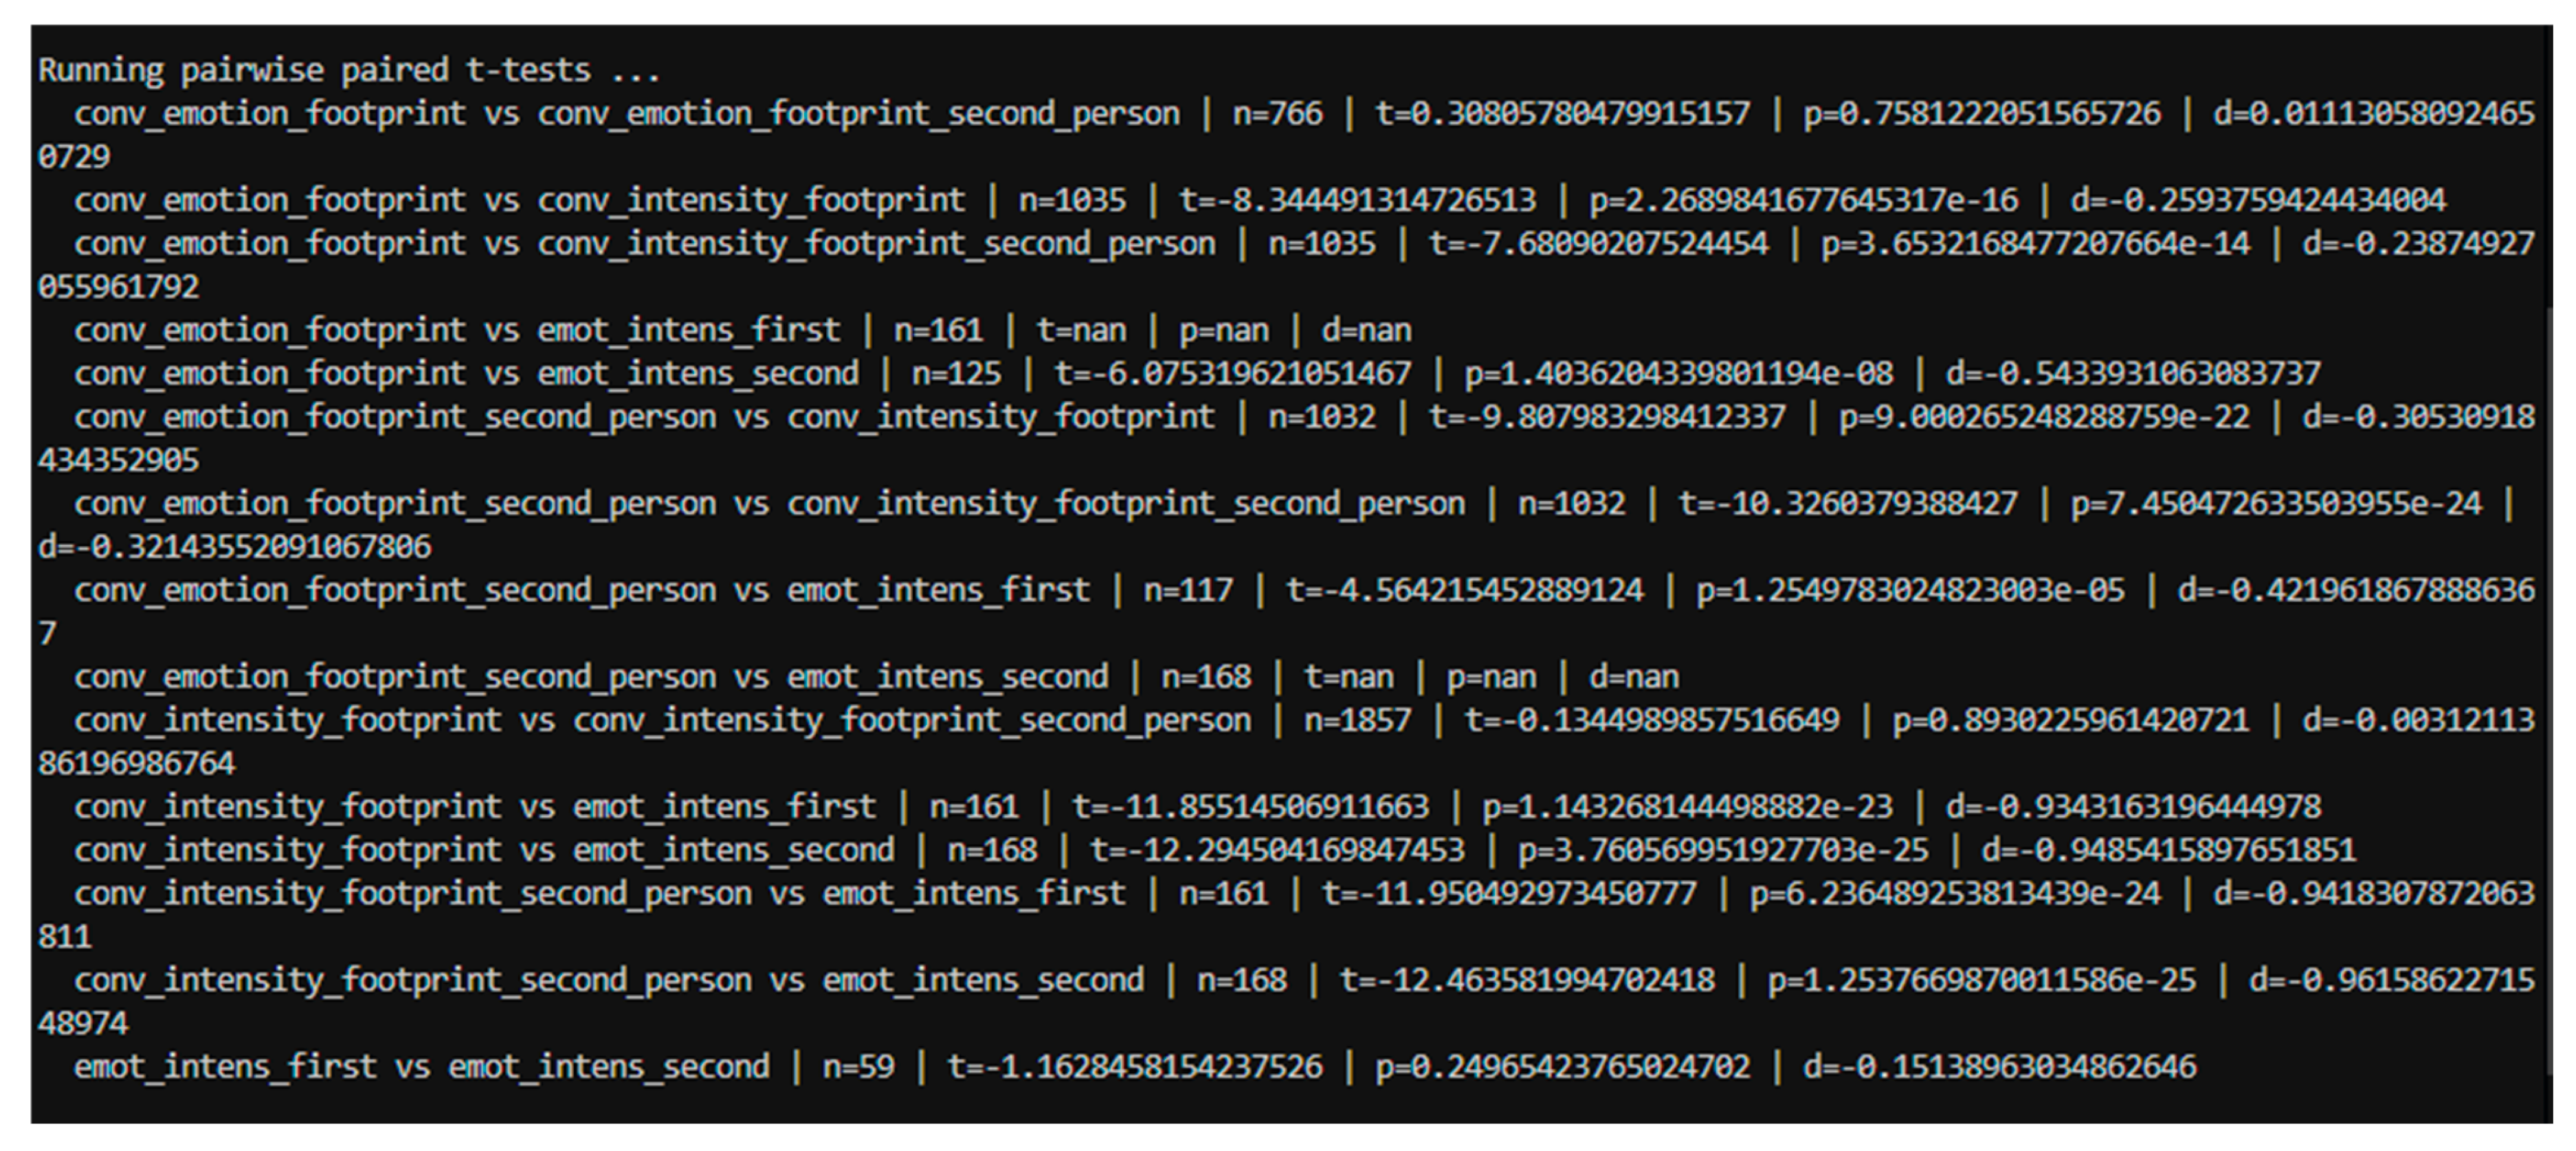
5.8. Pairwise Paired T-Test

A pairwise paired t-test is a standardized test statistic for emotional footprint identification. It is also called a dependent samples t-test. It compares the mean differences between specific conditions, or in this case emotional states.
P a i r w i s e   p a i r e d   t t e s t = m μ s n ·
where ‘ m ’ indicates sample mean difference, ‘ μ ’ denotes population mean difference, ‘ s ’ represents standard deviation, and ‘ n ’ indicates number of samples. Figure 13 shows the pairwise paired t-test outcome for the DSFO-STDMP model.
By analyzing major differences across these pairs, the DSFO-STDMP model was employed to identify distinct footprints associated with specific emotions to validate the effectiveness of different emotions.

6. Conclusions

Emotional footprint identification refers to the process of detecting, analyzing, and interpreting emotional patterns of individuals through interactions or conversation. In this paper, a novel DSFO-STDMP model is developed for achieving accurate and efficient emotional footprint identification, reducing both time consumption and error rate. The DSFO-STDMP model begins with a robust feature selection process to select the more relevant features, which significantly reduces the overall emotional footprint identification time. Finally, Rosenthal’s correlative stochastic-tuned deep multilayer perceptron classifier is employed to analyze both training data samples to provide emotional footprint identification outcomes with minimal error and higher accuracy. To assess the effectiveness of the proposed DSFO-STDMP model, comprehensive experiments were conducted using multiple performance metrics, including accuracy, precision, recall, F1 score and emotional footprint identification time, across varying volumes of data samples. The observed results show that the DSFO-STDMP model outperforms conventional deep learning methods, delivering significant improvements of 95% accuracy, 93% precision, 97% recall, and 97% F1 score. Moreover, the DSFO-STDMP achieved a 35% reduction in training time compared to existing methods.

Author Contributions

All the authors contributed equally to the conceptualization, formal analysis, investigation, methodology, writing, and editing of the original draft. All authors have read and agreed to the published version of the manuscript.

Funding

This research received no external funding.

Institutional Review Board Statement

Not applicable. This study did not involve any human participation or animals.

Informed Consent Statement

Not applicable. This manuscript does not contain any individual person’s data in any format.

Data Availability Statement

The datasets used and analyzed during the current study are available from the corresponding author upon request.

Conflicts of Interest

The authors declare no conflict of interest.

References

  1. Zhou, K.; Sisman, B.; Rana, R.; Schuller, B.W.; Li, H. Emotion Intensity and its Control for Emotional Voice Conversion. IEEE Trans. Affect. Comput. 2023, 14, 31–48. [Google Scholar] [CrossRef] [Scilit]
  2. Fu, F.; Ai, W.; Yang, F.; Shou, Y.; Meng, T.; Li, K. SDR-GNN: Spectral Domain Reconstruction Graph Neural Network for incomplete multimodal learning in conversational emotion recognition. Knowl.-Based Syst. 2025, 309, 112825. [Google Scholar] [CrossRef] [Scilit]
  3. Ai, W.; Zhang, F.; Shou, Y.; Meng, T.; Chen, H.; Li, K. Revisiting Multimodal Emotion Recognition in Conversation from the Perspective of Graph Spectrum. Proc. AAAI Conf. Artif. Intell. 2025, 39, 11418–11426. [Google Scholar] [CrossRef] [Scilit]
  4. Li, W.; Li, Y.; Pandelea, V.; Ge, M.; Zhu, L.; Cambria, E. ECPEC: Emotion-Cause Pair Extraction in Conversations. IEEE Trans. Affect. Comput. 2023, 14, 1754–1765. [Google Scholar] [CrossRef] [Scilit]
  5. Zhang, G.; Qin, Y.; Zhang, W.; Wu, J.; Li, M.; Gai, Y.; Jiang, F.; Lee, T. iEmoTTS: Toward Robust Cross-Speaker Emotion Transfer and Control for Speech Synthesis based on Disentanglement between Prosody and Timbre. IEEE/ACM Trans. Audio Speech Lang. Process. 2023, 31, 1693–1705. [Google Scholar] [CrossRef] [Scilit]
  6. Alsaadawı, H.F.T.; Daş, R. Multimodal Emotion Recognition Using Bi-LG-GCN for MELD Dataset. Balk. J. Electr. Comput. Eng. 2024, 12, 36–46. [Google Scholar] [CrossRef] [Scilit]
  7. Nassif, A.B.; Shahin, I.; Lataifeh, M.; Elnagar, A.; Nemmour, N. Empirical Comparison between Deep and Classical Classifiers for Speaker Verification in Emotional Talking Environments. Information 2022, 13, 456. [Google Scholar] [CrossRef] [Scilit]
  8. Triantafyllopoulos, A.; Reichel, U.; Liu, S.; Huber, S.; Eyben, F.; Schuller, B.W. Multistage linguistic conditioning of convolutional layers for speech emotion recognition. Front. Comput. Sci. 2023, 5, 1072479. [Google Scholar] [CrossRef] [Scilit]
  9. Meng, T.; Zhang, F.; Shou, Y.; Shao, H.; Ai, W.; Li, K. Masked Graph Learning With Recurrent Alignment for Multimodal Emotion Recognition in Conversation. IEEE/ACM Trans. Audio Speech Lang. Process. 2024, 32, 4298–4312. [Google Scholar] [CrossRef] [Scilit]
  10. Meng, T.; Shou, Y.; Ai, W.; Yin, N.; Li, K. Deep Imbalanced Learning for Multimodal Emotion Recognition in Conversations. IEEE Trans. Artif. Intell. 2024, 5, 6472–6487. [Google Scholar] [CrossRef] [Scilit]
  11. Li, Y.; Wang, Y.; Yang, X.; Im, S.-K. Speech emotion recognition based on Graph-LSTM neural network. EURASIP J. Audio, Speech, Music. Process. 2023, 2023, 40. [Google Scholar] [CrossRef] [Scilit]
  12. Bhangale, K.; Kothandaraman, M. Speech Emotion Recognition Based on Multiple Acoustic Features and Deep Convolutional Neural Network. Electronics 2023, 12, 839. [Google Scholar] [CrossRef] [Scilit]
  13. Chowdhury, J.H.; Ramanna, S.; Kotecha, K. Speech emotion recognition with light weight deep neural ensemble model using hand crafted features. Sci. Rep. 2025, 15, 11824. [Google Scholar] [CrossRef] [Scilit]
  14. Wu, Y.; Zhang, S.; Li, P. Multi-modal emotion recognition in conversation based on prompt learning with text-audio fusion features. Sci. Rep. 2025, 15, 8855. [Google Scholar] [CrossRef] [Scilit]
  15. Pallewela, N.; Alahakoon, D.; Adikari, A.; Pierce, J.E.; Rose, M.L. Optimizing Speech Emotion Recognition with Machine Learning Based Advanced Audio Cue Analysis. Technologies 2024, 12, 111. [Google Scholar] [CrossRef] [Scilit]
  16. Filali, H.; Boulealam, C.; El Fazazy, K.; Mahraz, A.M.; Tairi, H.; Riffi, J. Meaningful Multimodal Emotion Recognition Based on Capsule Graph Transformer Architecture. Information 2025, 16, 40. [Google Scholar] [CrossRef] [Scilit]
  17. Li, J.; Wang, X.; Lv, G.; Zeng, Z. GraphCFC: A Directed Graph Based Cross-Modal Feature Complementation Approach for Multimodal Conversational Emotion Recognition. IEEE Trans. Multimed. 2023, 26, 77–89. [Google Scholar] [CrossRef] [Scilit]
  18. Duong, A.-Q.; Ho, N.-H.; Pant, S.; Kim, S.; Kim, S.-H.; Yang, H.-J. Residual Relation-Aware Attention Deep Graph-Recurrent Model for Emotion Recognition in Conversation. IEEE Access 2024, 12, 2349–2360. [Google Scholar] [CrossRef] [Scilit]
  19. Li, J.; Wang, X.; Lv, G.; Zeng, Z. GraphMFT: A graph network based multimodal fusion technique for emotion recognition in conversation. Neurocomputing 2023, 550, 126427. [Google Scholar] [CrossRef] [Scilit]
  20. Fan, C.; Lin, J.; Mao, R.; Cambria, E. Fusing pairwise modalities for emotion recognition in conversations. Inf. Fusion 2024, 106, 102306. [Google Scholar] [CrossRef] [Scilit]
  21. Shixin, P.; Kai, C.; Tian, T.; Jingying, C. An autoencoder-based feature level fusion for speech emotion recognition. Digit. Commun. Networks 2024, 10, 1341–1351. [Google Scholar] [CrossRef] [Scilit]
  22. Shou, Y.; Liu, H.; Cao, X.; Meng, D.; Dong, B. A Low-Rank Matching Attention Based Cross-Modal Feature Fusion Method for Conversational Emotion Recognition. IEEE Trans. Affect. Comput. 2024, 16, 1177–1189. [Google Scholar] [CrossRef] [Scilit]
  23. Chen, W.; Xing, X.; Chen, P.; Xu, X. Vesper: A Compact and Effective Pretrained Model for Speech Emotion Recognition. IEEE Trans. Affect. Comput. 2024, 15, 1711–1724. [Google Scholar] [CrossRef] [Scilit]
  24. Lian, Z.; Sun, L.; Sun, H.; Chen, K.; Wen, Z.; Gu, H.; Liu, B.; Tao, J. GPT-4V with Emotion: A Zero-shot Benchmark for Generalized Emotion Recognition. Inf. Fusion 2024, 108, 102367. [Google Scholar] [CrossRef] [Scilit]
  25. Pentari, A.; Kafentzis, G.; Tsiknakis, M. Speech emotion recognition via graph-based representations. Sci. Rep. 2024, 14, 4484. [Google Scholar] [CrossRef] [Scilit]
  26. Jiang, D.; Liu, H.; Tu, G.; Wei, R.; Cambria, E. Self-supervised utterance order prediction for emotion recognition in conversations. Neurocomputing 2024, 577, 127370. [Google Scholar] [CrossRef] [Scilit]
  27. Makhmudov, F.; Kultimuratov, A.; Cho, Y.-I. Enhancing Multimodal Emotion Recognition through Attention Mechanisms in BERT and CNN Architectures. Appl. Sci. 2024, 14, 4199. [Google Scholar] [CrossRef] [Scilit]
  28. Li, J.; Mei, H.; Jia, L.; Zhang, X. Multimodal Emotion Recognition in Conversation Based on Hypergraphs. Electronics 2023, 12, 4703. [Google Scholar] [CrossRef] [Scilit]
  29. Wang, B.; Dong, G.; Zhao, Y.; Li, R.; Cao, Q.; Hu, K.; Jiang, D. Hierarchically stacked graph convolution for emotion recognition in conversation. Knowl.-Based Syst. 2023, 263, 110285. [Google Scholar] [CrossRef] [Scilit]
  30. Lu, N.; Han, Z.; Han, M.; Qian, J. Bi-stream graph learning based multimodal fusion for emotion recognition in conversation. Inf. Fusion 2024, 106, 102272. [Google Scholar] [CrossRef] [Scilit]
  31. Chouhayebi, H.; Mahraz, M.A.; Riffi, J.; Tairi, H.; Alioua, N. Human Emotion Recognition Based on Spatio-Temporal Facial Features Using HOG-HOF and VGG-LSTM. Computers 2024, 13, 101. [Google Scholar] [CrossRef] [Scilit]
  32. Azizian, P.; Honarmand, M.; Jaiswal, A.; Kline, A.; Dunlap, K.; Washington, P.; Wall, D.P. Multimodal LLM vs. Human-Measured Features for AI Predictions of Autism in Home Videos. Algorithms 2025, 18, 687. [Google Scholar] [CrossRef] [Scilit]
  33. Abuqaddom, I.; Mahafzah, B.A.; Faris, H. Oriented stochastic loss descent algorithm to train very deep multi-layer neural networks without vanishing gradients. Knowl.-Based Syst. 2021, 230, 107391. [Google Scholar] [CrossRef] [Scilit]
Figure 1. Architecture of proposed DSFO-STDMP model.
Algorithms 18 00801 g001
Figure 2. Block diagram of Sokal–Sneath divergence shuffling shepherd optimization-based feature selection.
Algorithms 18 00801 g002
Figure 3. Schematic structure of Rosenthal correlative stochastic-tuned deep multilayer perceptron classifier.
Algorithms 18 00801 g003
Figure 4. Similarity matrix results.
Algorithms 18 00801 g004
Figure 5. Feature important results.
Algorithms 18 00801 g005
Figure 6. Multi-feature results.
Algorithms 18 00801 g006
Figure 7. Accuracy comparison of Proposed DSFO-STDMP with EMOVOX [1] and SDR-GNN [2].
Algorithms 18 00801 g007
Figure 8. Precision comparison of Proposed DSFO-STDMP with EMOVOX [1] and SDR-GNN [2].
Algorithms 18 00801 g008
Figure 9. Recall comparison of Proposed DSFO-STDMP with EMOVOX [1] and SDR-GNN [2].
Algorithms 18 00801 g009
Figure 10. F1-Score comparison of Proposed DSFO-STDMP with EMOVOX [1] and SDR-GNN [2].
Algorithms 18 00801 g010
Figure 11. Emotional Footprint Identification time comparison of Proposed DSFO-STDMP with EMOVOX [1] and SDR-GNN [2].
Algorithms 18 00801 g011
Figure 12. Proposed DSFO-STDMP confusion matrix for emotional footprint identification time.
Algorithms 18 00801 g012
Figure 13. Pairwise paired t-test outcome for DSFO-STDMP model.
Algorithms 18 00801 g013
Table 1. Two-party conversation dataset.
S. NoColumn HeadersFeaturesDescription
1“0”–“34”Emotional categories
[0–6]
0—no emotion
1—angry
2—disgust
3—fear
4—happiness
5—sadness
6—surprise
Length of conversation
2“35”Conv_length Length of conversation
3“36”–“39”Inform, question, directive, commissive Number of utterances within the conversation that fall into their respective categories
4“40”Emotion_footprint_first_person Emotional footprint of the first person in conversation
[No emotion, Anger, Disgust, Trust, Happy, Sadness, Surprise
Anticipation]
5“41”Emotion_footprint_second_personEmotional footprint of the second person in conversation
[No emotion, Anger, Disgust, Trust, Happy, Sadness, Surprise
Anticipation]
6“42”Conv_intensity_footprint_first_personEmotional footprint and intensity of the first person in conversation
7“43”Conv_intensity_footprint_second_personEmotional footprint and intensity of the second person in conversation
8“44”Emotion_intensity _first_personIntensity of emotion experienced by first person in conversation
9“45”Emotion_intensity_second_personIntensity of emotion experienced by second person in conversation
10“46”Conversation Complete and unchanged conversation between two parties
11“47”Speaker 1Utterances made by first speaker within the conversation
12“48”Speaker 2Utterances made by second speaker within the conversation
Table 2. Comparison of accuracy.
Number of Data SamplesAccuracy
Proposed DSFO-STDMPEMOVOX [1]SDR-GNN [2]
1800.950.870.92
3600.940.80.91
5400.950.750.9
7200.940.770.89
9000.940.80.88
10800.950.750.87
12600.960.710.88
14400.960.720.9
16200.950.750.91
18000.950.770.9
Table 3. Comparison of precision.
Number of Data SamplesPrecision
Proposed DSFO-STDMPEMOVOX [1]SDR-GNN [2]
1800.960.90.92
3600.940.860.91
5400.920.830.89
7200.910.780.88
9000.930.770.89
10800.940.780.86
12600.920.810.87
14400.930.840.9
16200.920.840.88
18000.930.850.89
Table 4. Comparison of recall.
Number of Data SamplesRecall
Proposed DSFO-STDMPEMOVOX [1]SDR-GNN [2]
1800.980.950.96
3600.970.920.94
5400.960.910.93
7200.980.910.93
9000.970.920.94
10800.960.910.93
12600.980.920.94
14400.970.910.93
16200.980.920.94
18000.970.910.93
Table 5. Comparison of F1 score.
Number of Data SamplesF1 Score
Proposed DSFO-STDMPEMOVOX [1]SDR-GNN [2]
1800.970.920.94
3600.970.880.92
5400.960.860.90
7200.980.840.90
9000.970.830.91
10800.960.840.89
12600.980.860.90
14400.970.870.91
16200.980.880.90
18000.970.870.90
Table 6. Comparison of emotional footprint identification time.
Number of Data SamplesEmotional Footprint Identification Time (Sec)
Proposed DSFO-STDMPEMOVOX [1]SDR-GNN [2]
18057.677.466.6
36065.811582.5
54075.613592.6
72088.3165123.5
900105.7172141.6
1080110.5185153.8
1260114.6215164.4
1440121.3230182.3
1620127.5245192.3
1800134.9275213.2
Table 7. Ablation study for comparison of methods.
MethodsTwo-Party Conversation with Emotional Footprint and Emotional Intensity Dataset
Accuracy (%)PrecisionRecallF1 ScoreEmotional Footprint Identification Time (Sec.)
SSDSSO0.810.780.850.82145
DMP0.850.800.890.84128
RCG-FT-DMLP0.880.840.920.88112
DSFO-STDMP0.920.910.960.9395
Disclaimer/Publisher’s Note: The statements, opinions and data contained in all publications are solely those of the individual author(s) and contributor(s) and not of MDPI and/or the editor(s). MDPI and/or the editor(s) disclaim responsibility for any injury to people or property resulting from any ideas, methods, instructions or products referred to in the content.