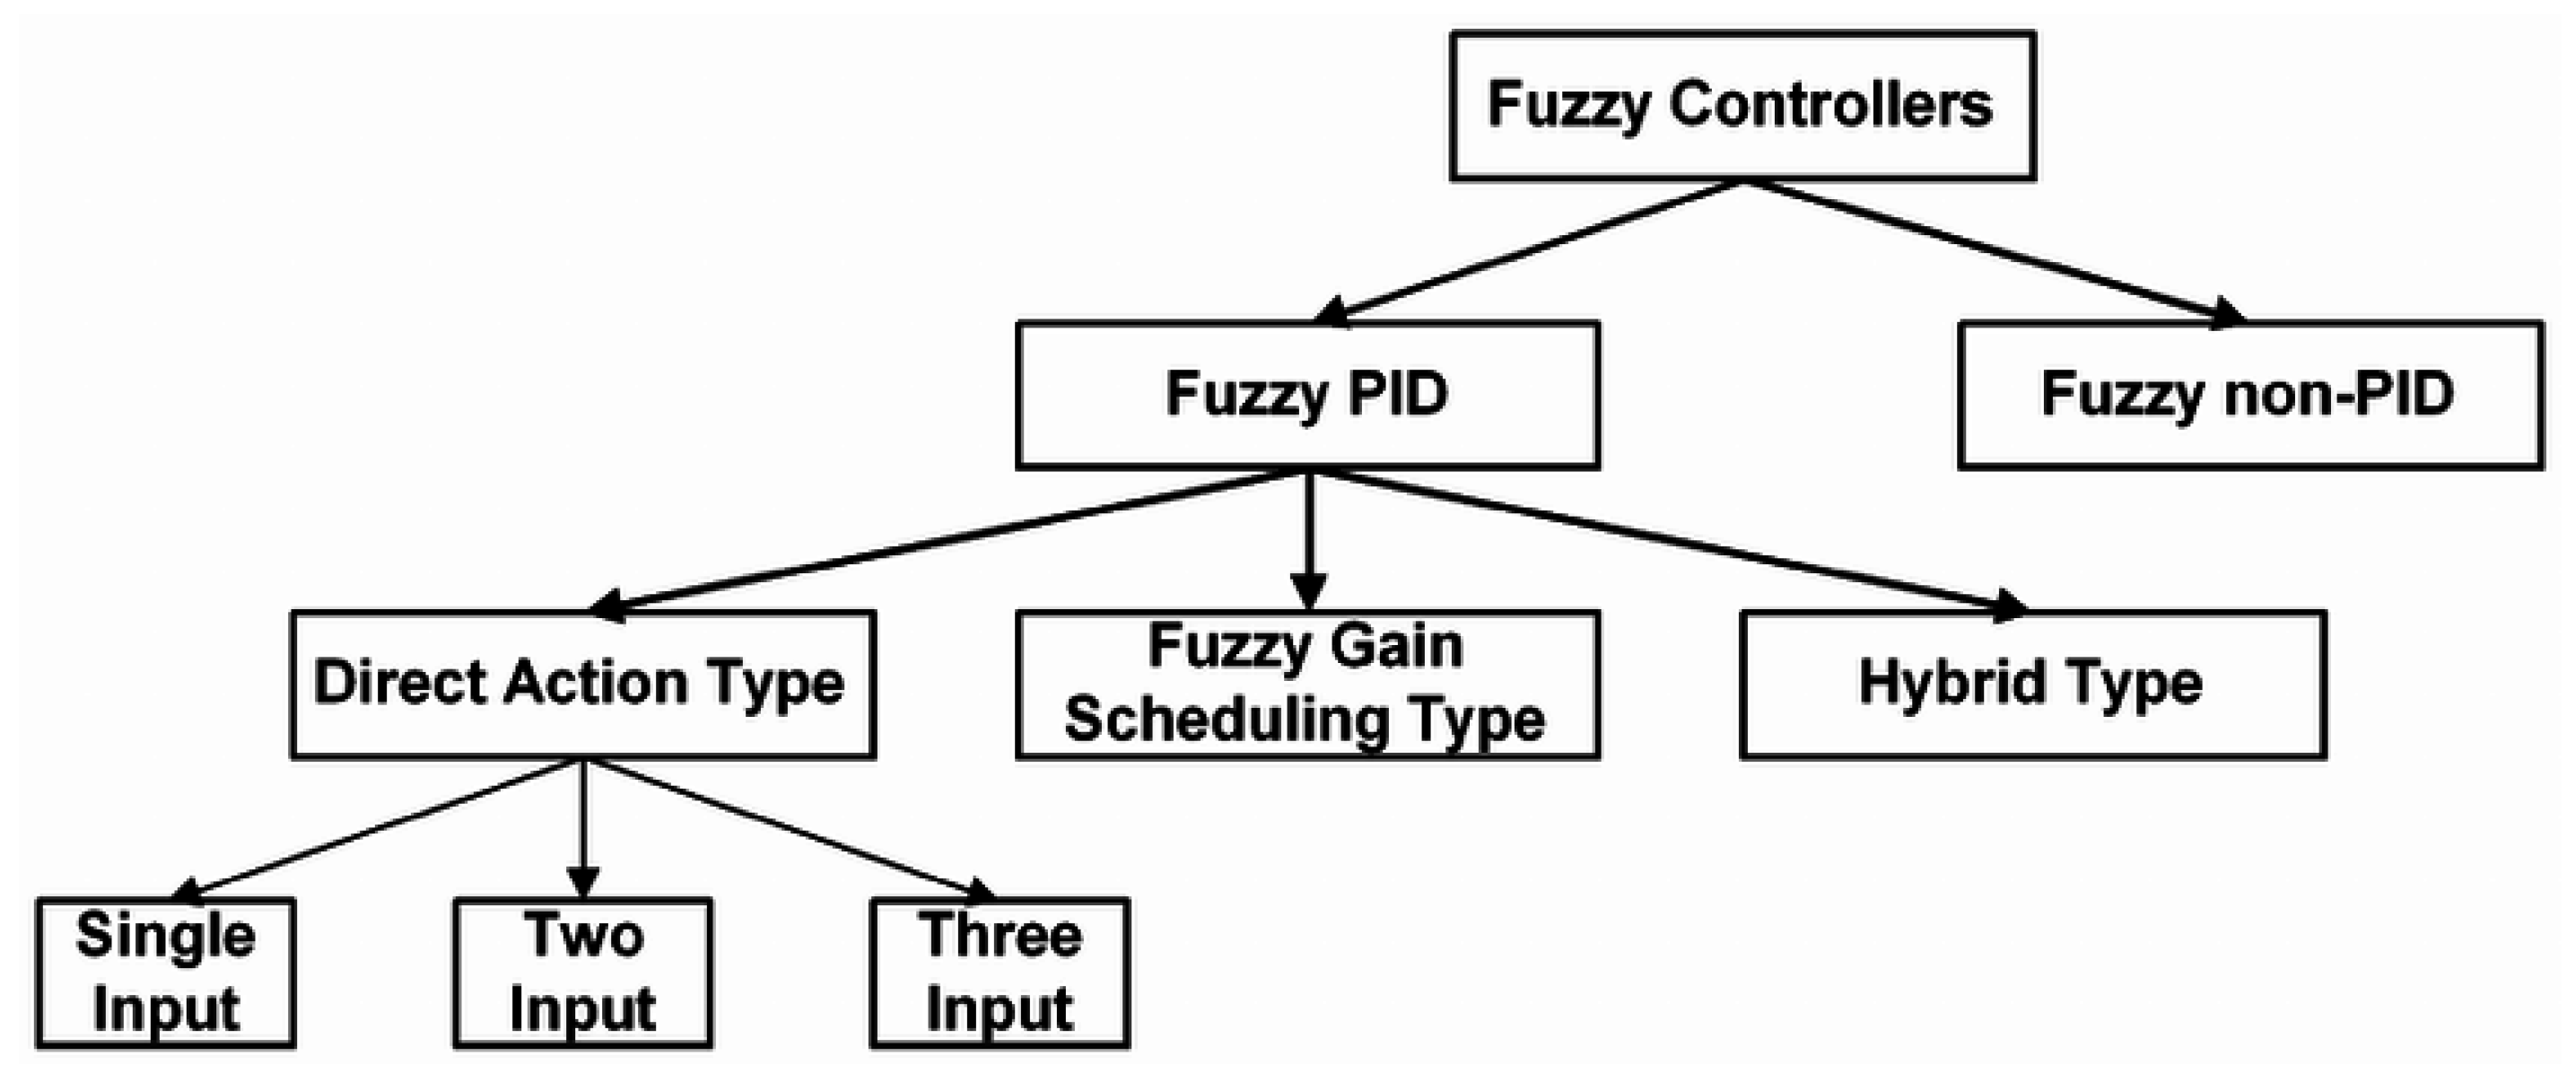
Figure 1.
Classification of fuzzy controllers [
23].
Figure 1.
Classification of fuzzy controllers [
23].
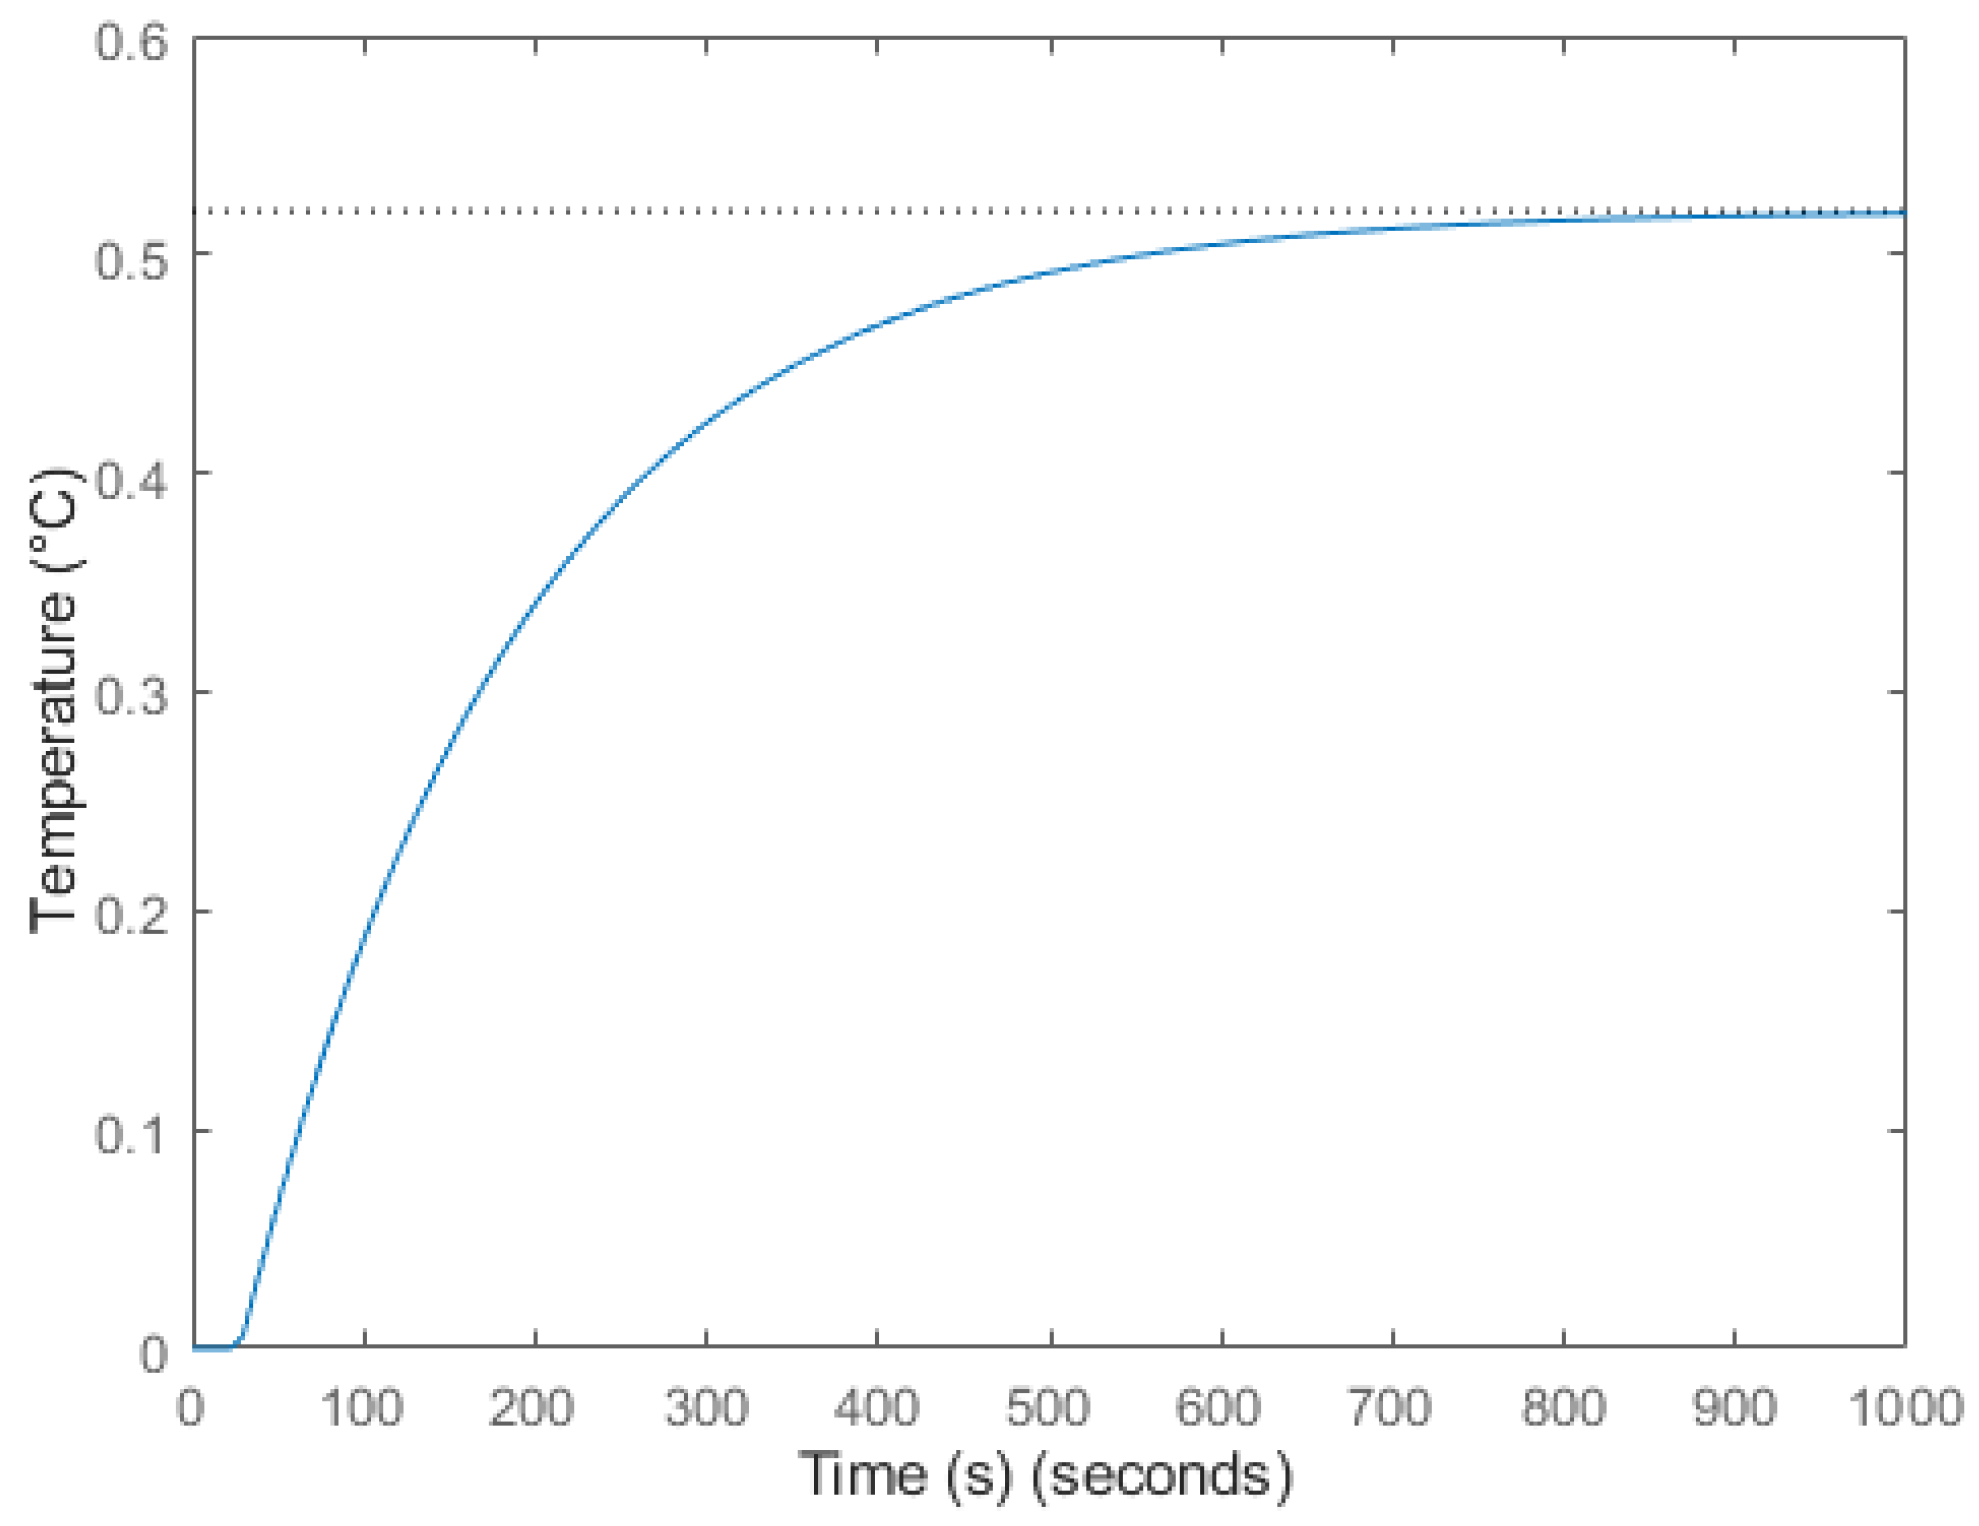
Figure 2.
Step response of the heat diffusion system, with the dashed line showing the steady-state value.
Figure 2.
Step response of the heat diffusion system, with the dashed line showing the steady-state value.
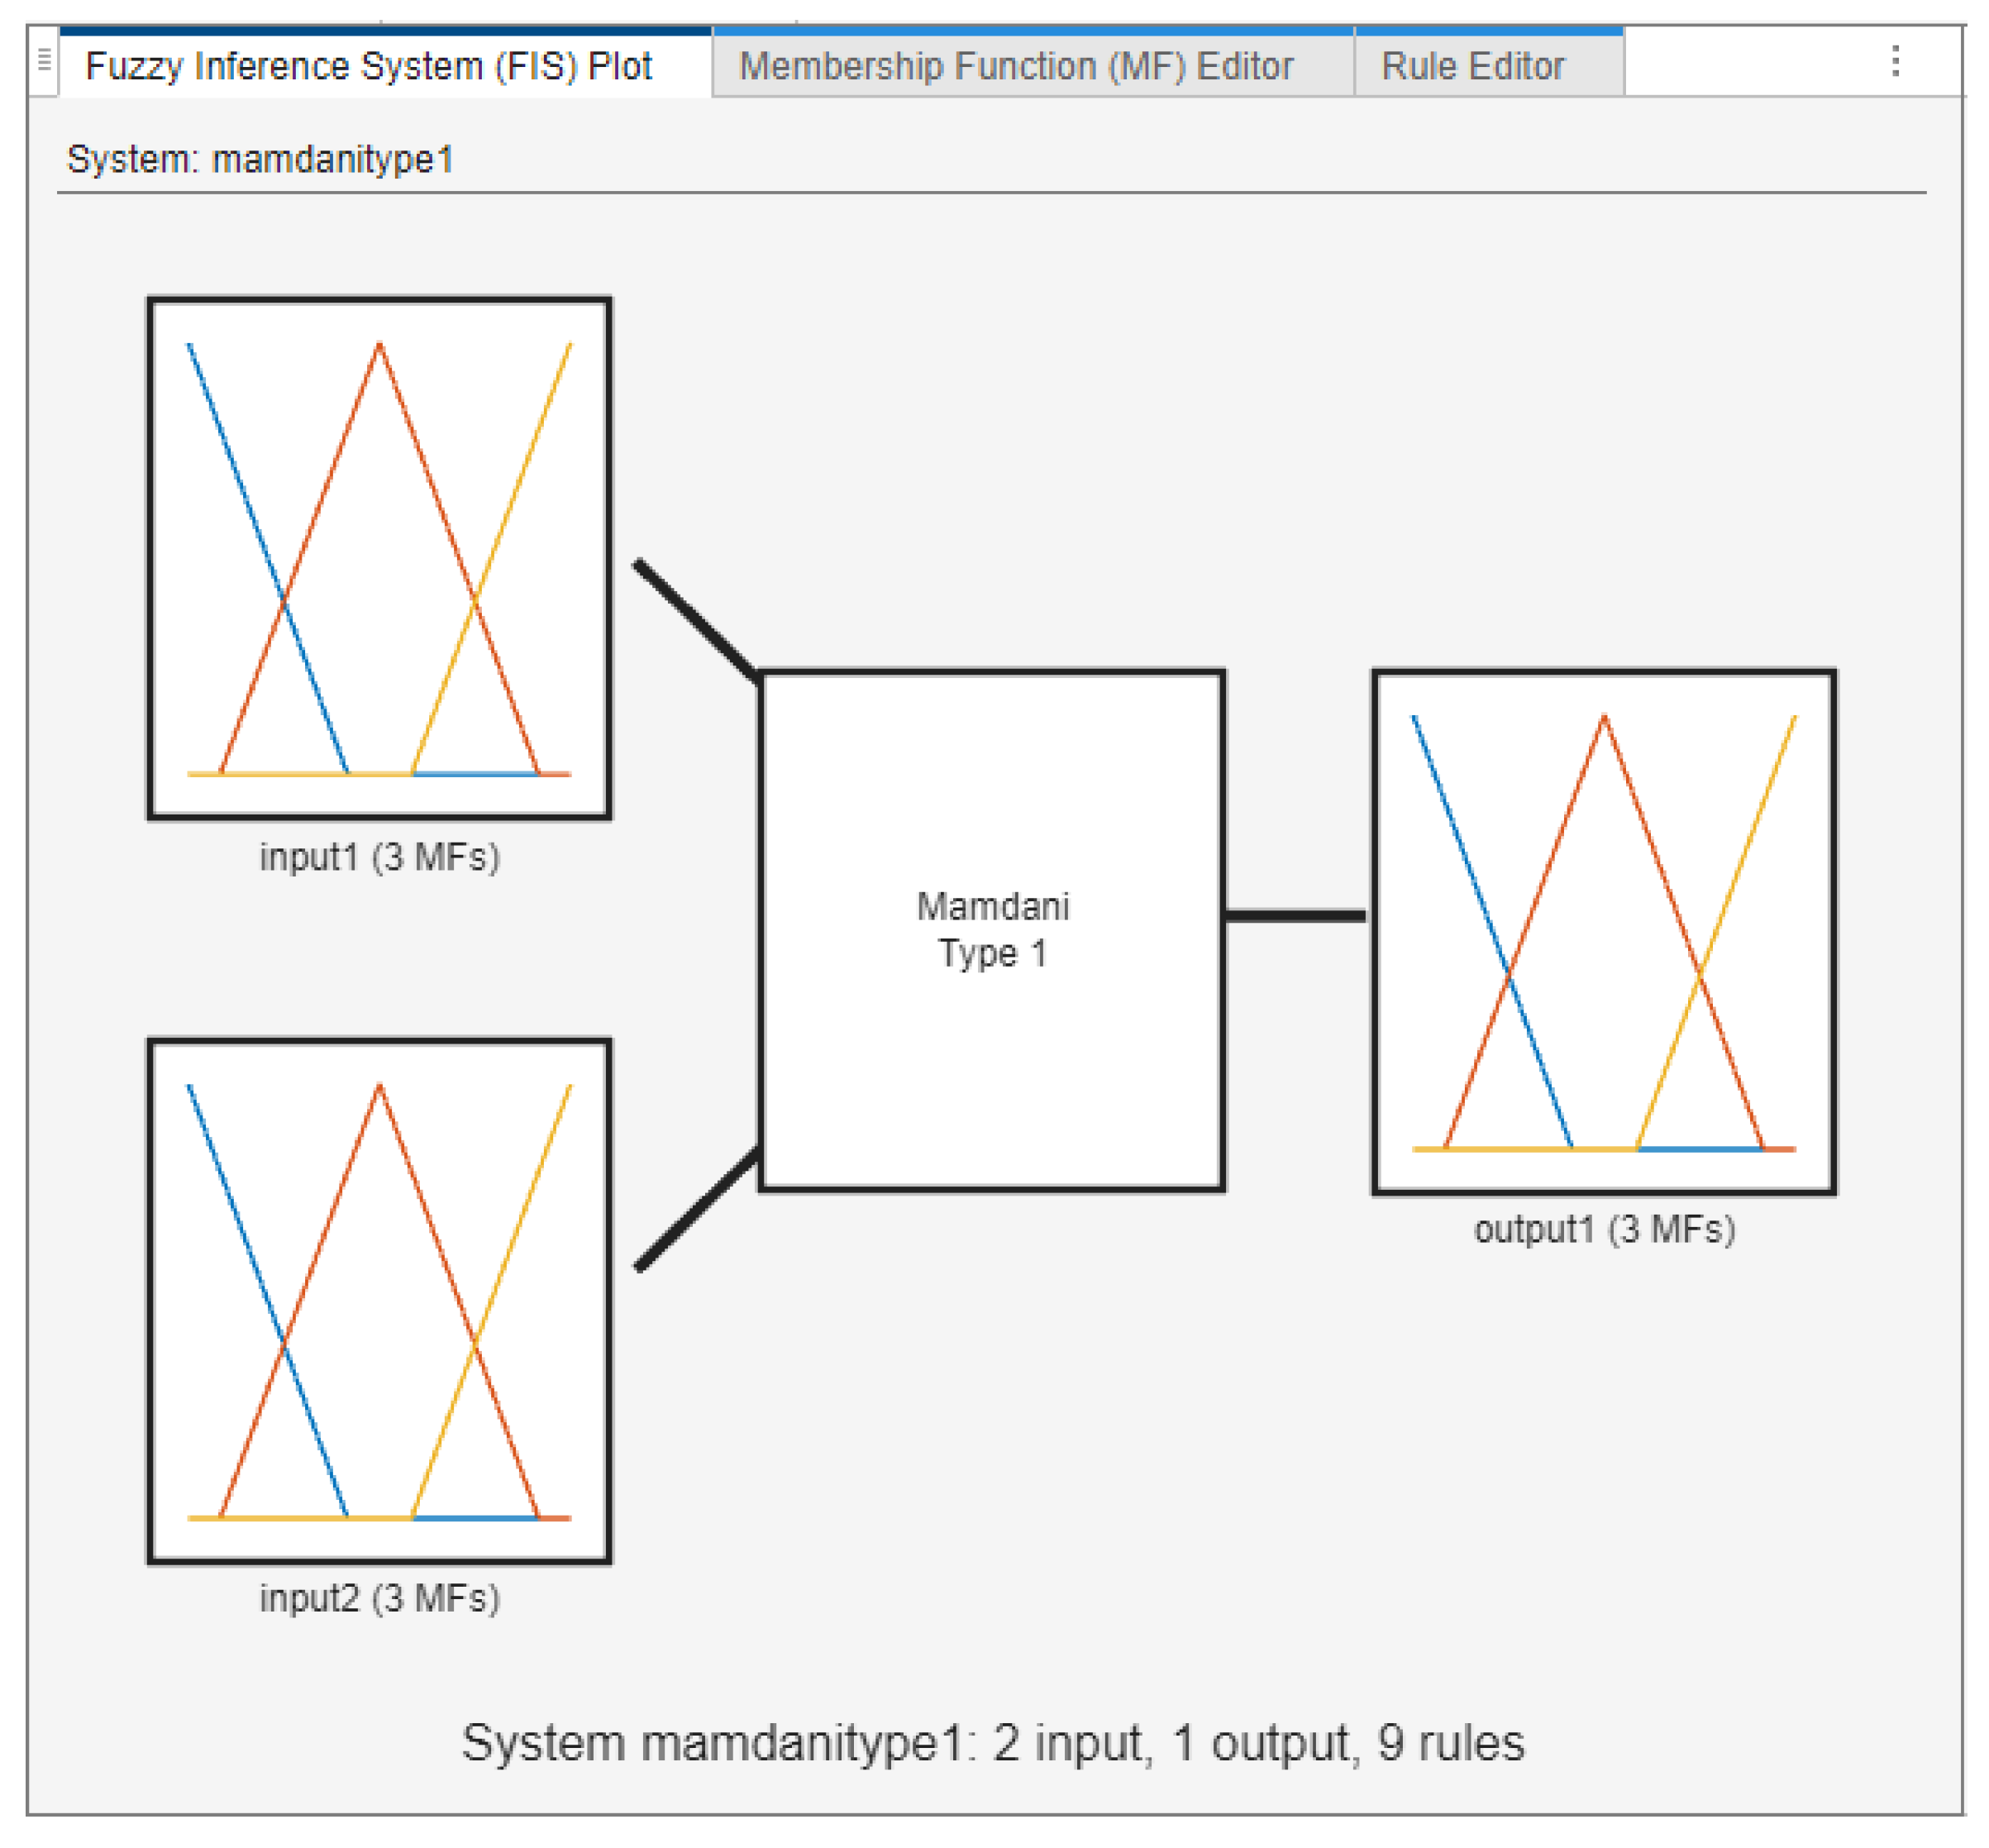
Figure 3.
General structure of the Mamdani Type 1 fuzzy controller.
Figure 3.
General structure of the Mamdani Type 1 fuzzy controller.
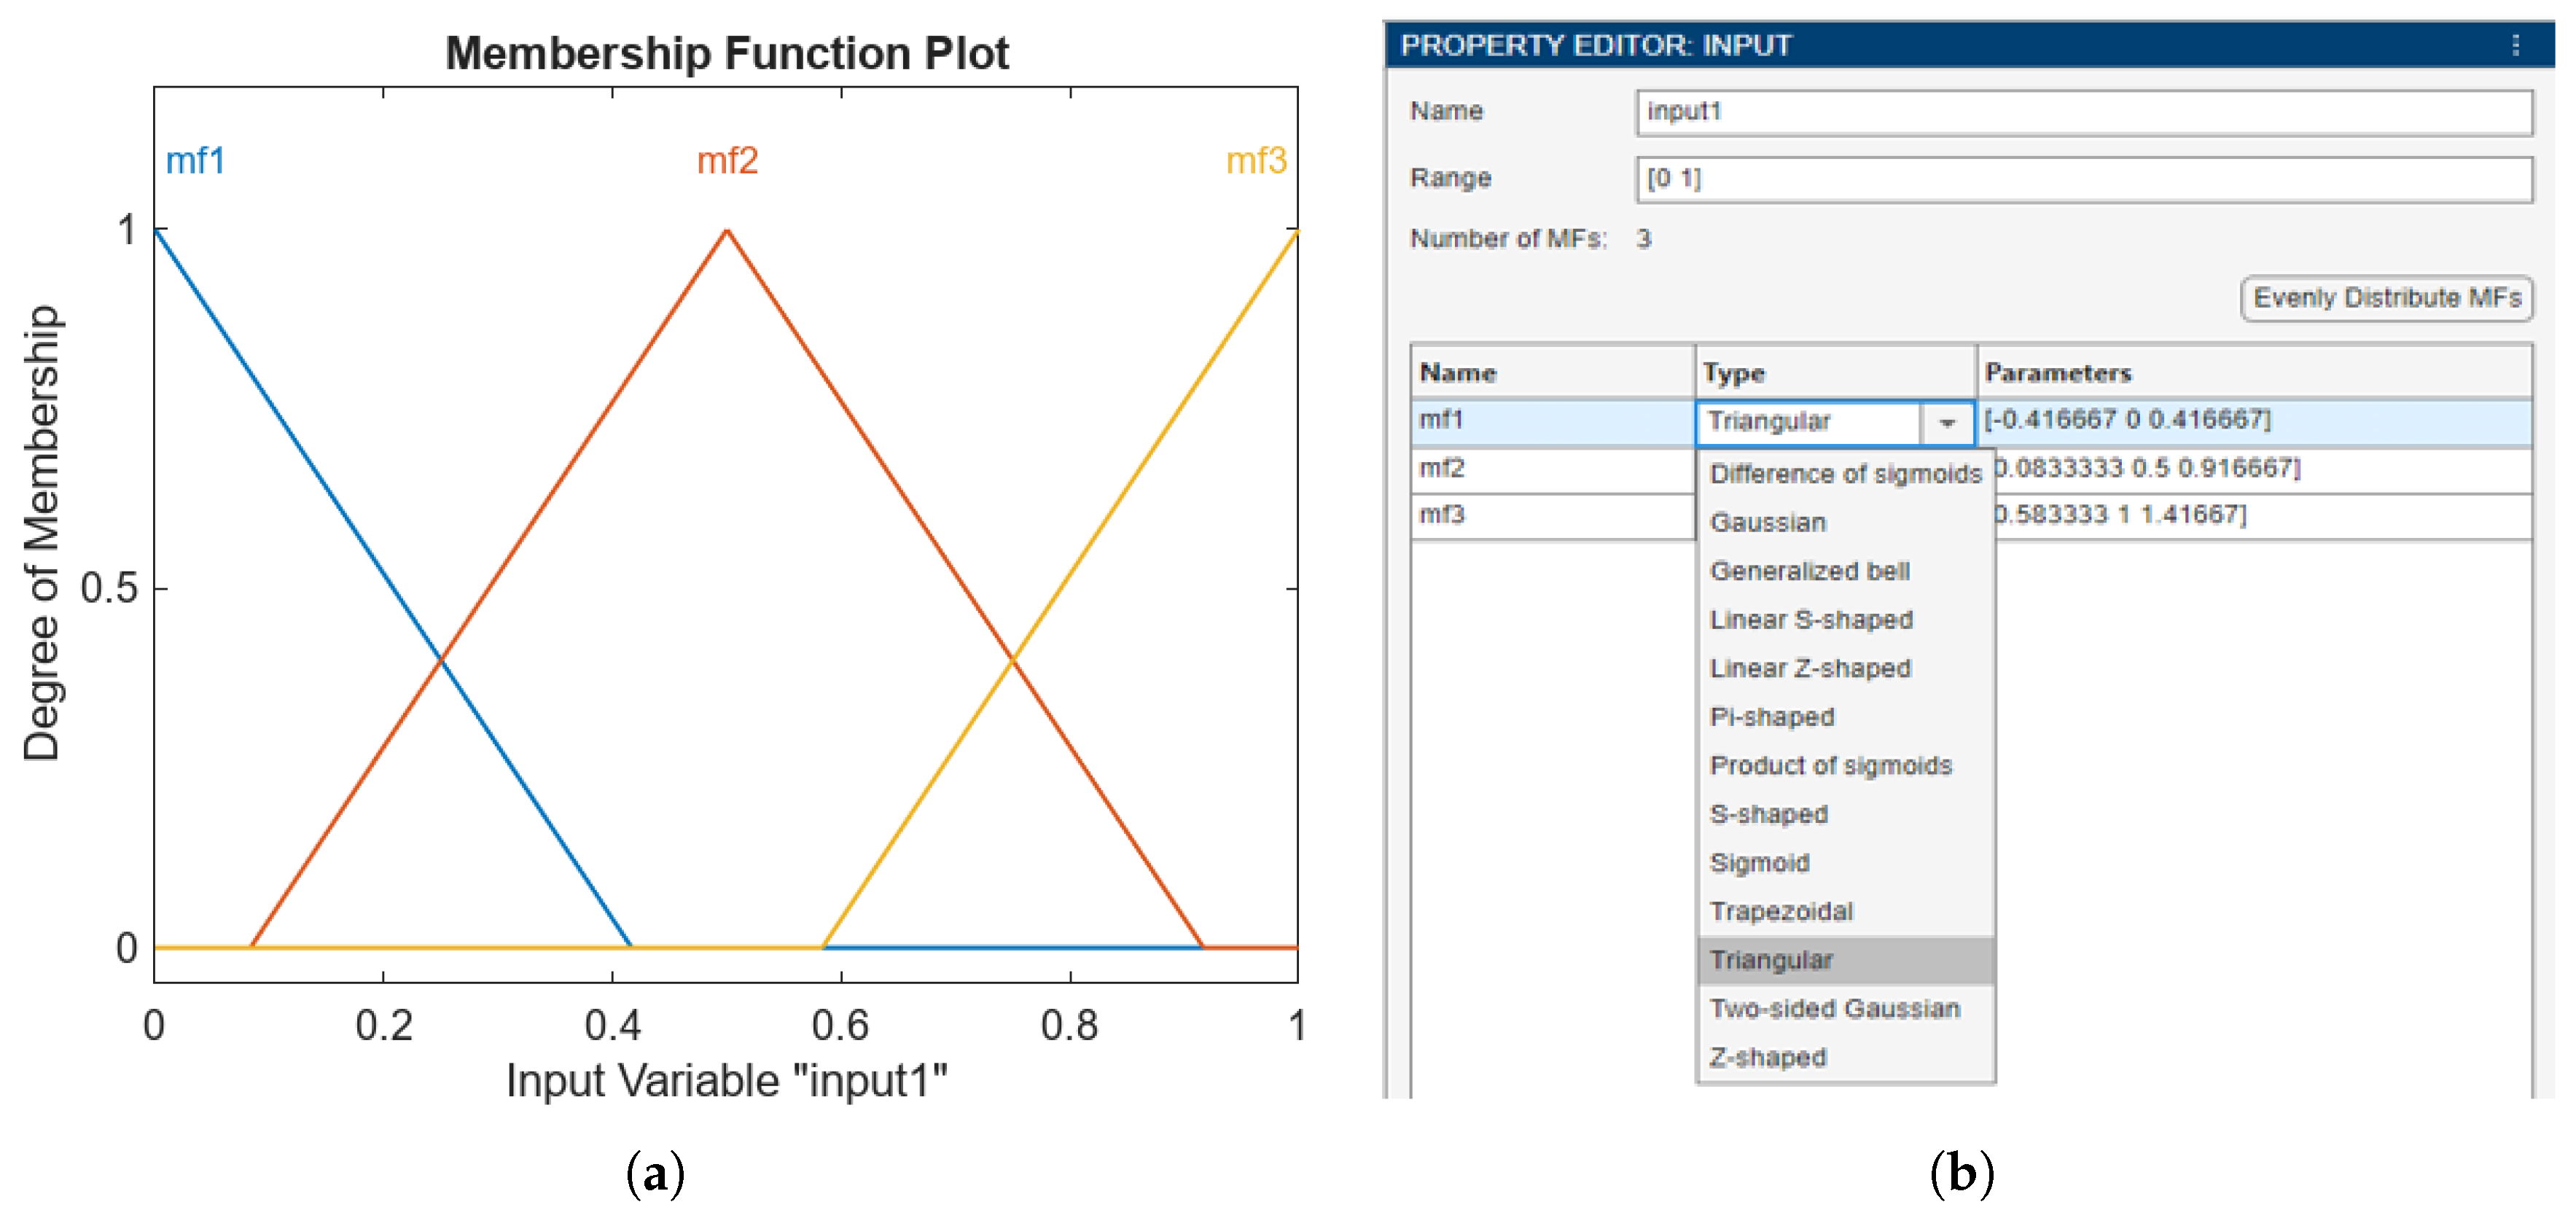
Figure 4.
Configuration of fuzzy system member ship functions: (a) Membership function visualization; (b) Membership function property editor.
Figure 4.
Configuration of fuzzy system member ship functions: (a) Membership function visualization; (b) Membership function property editor.
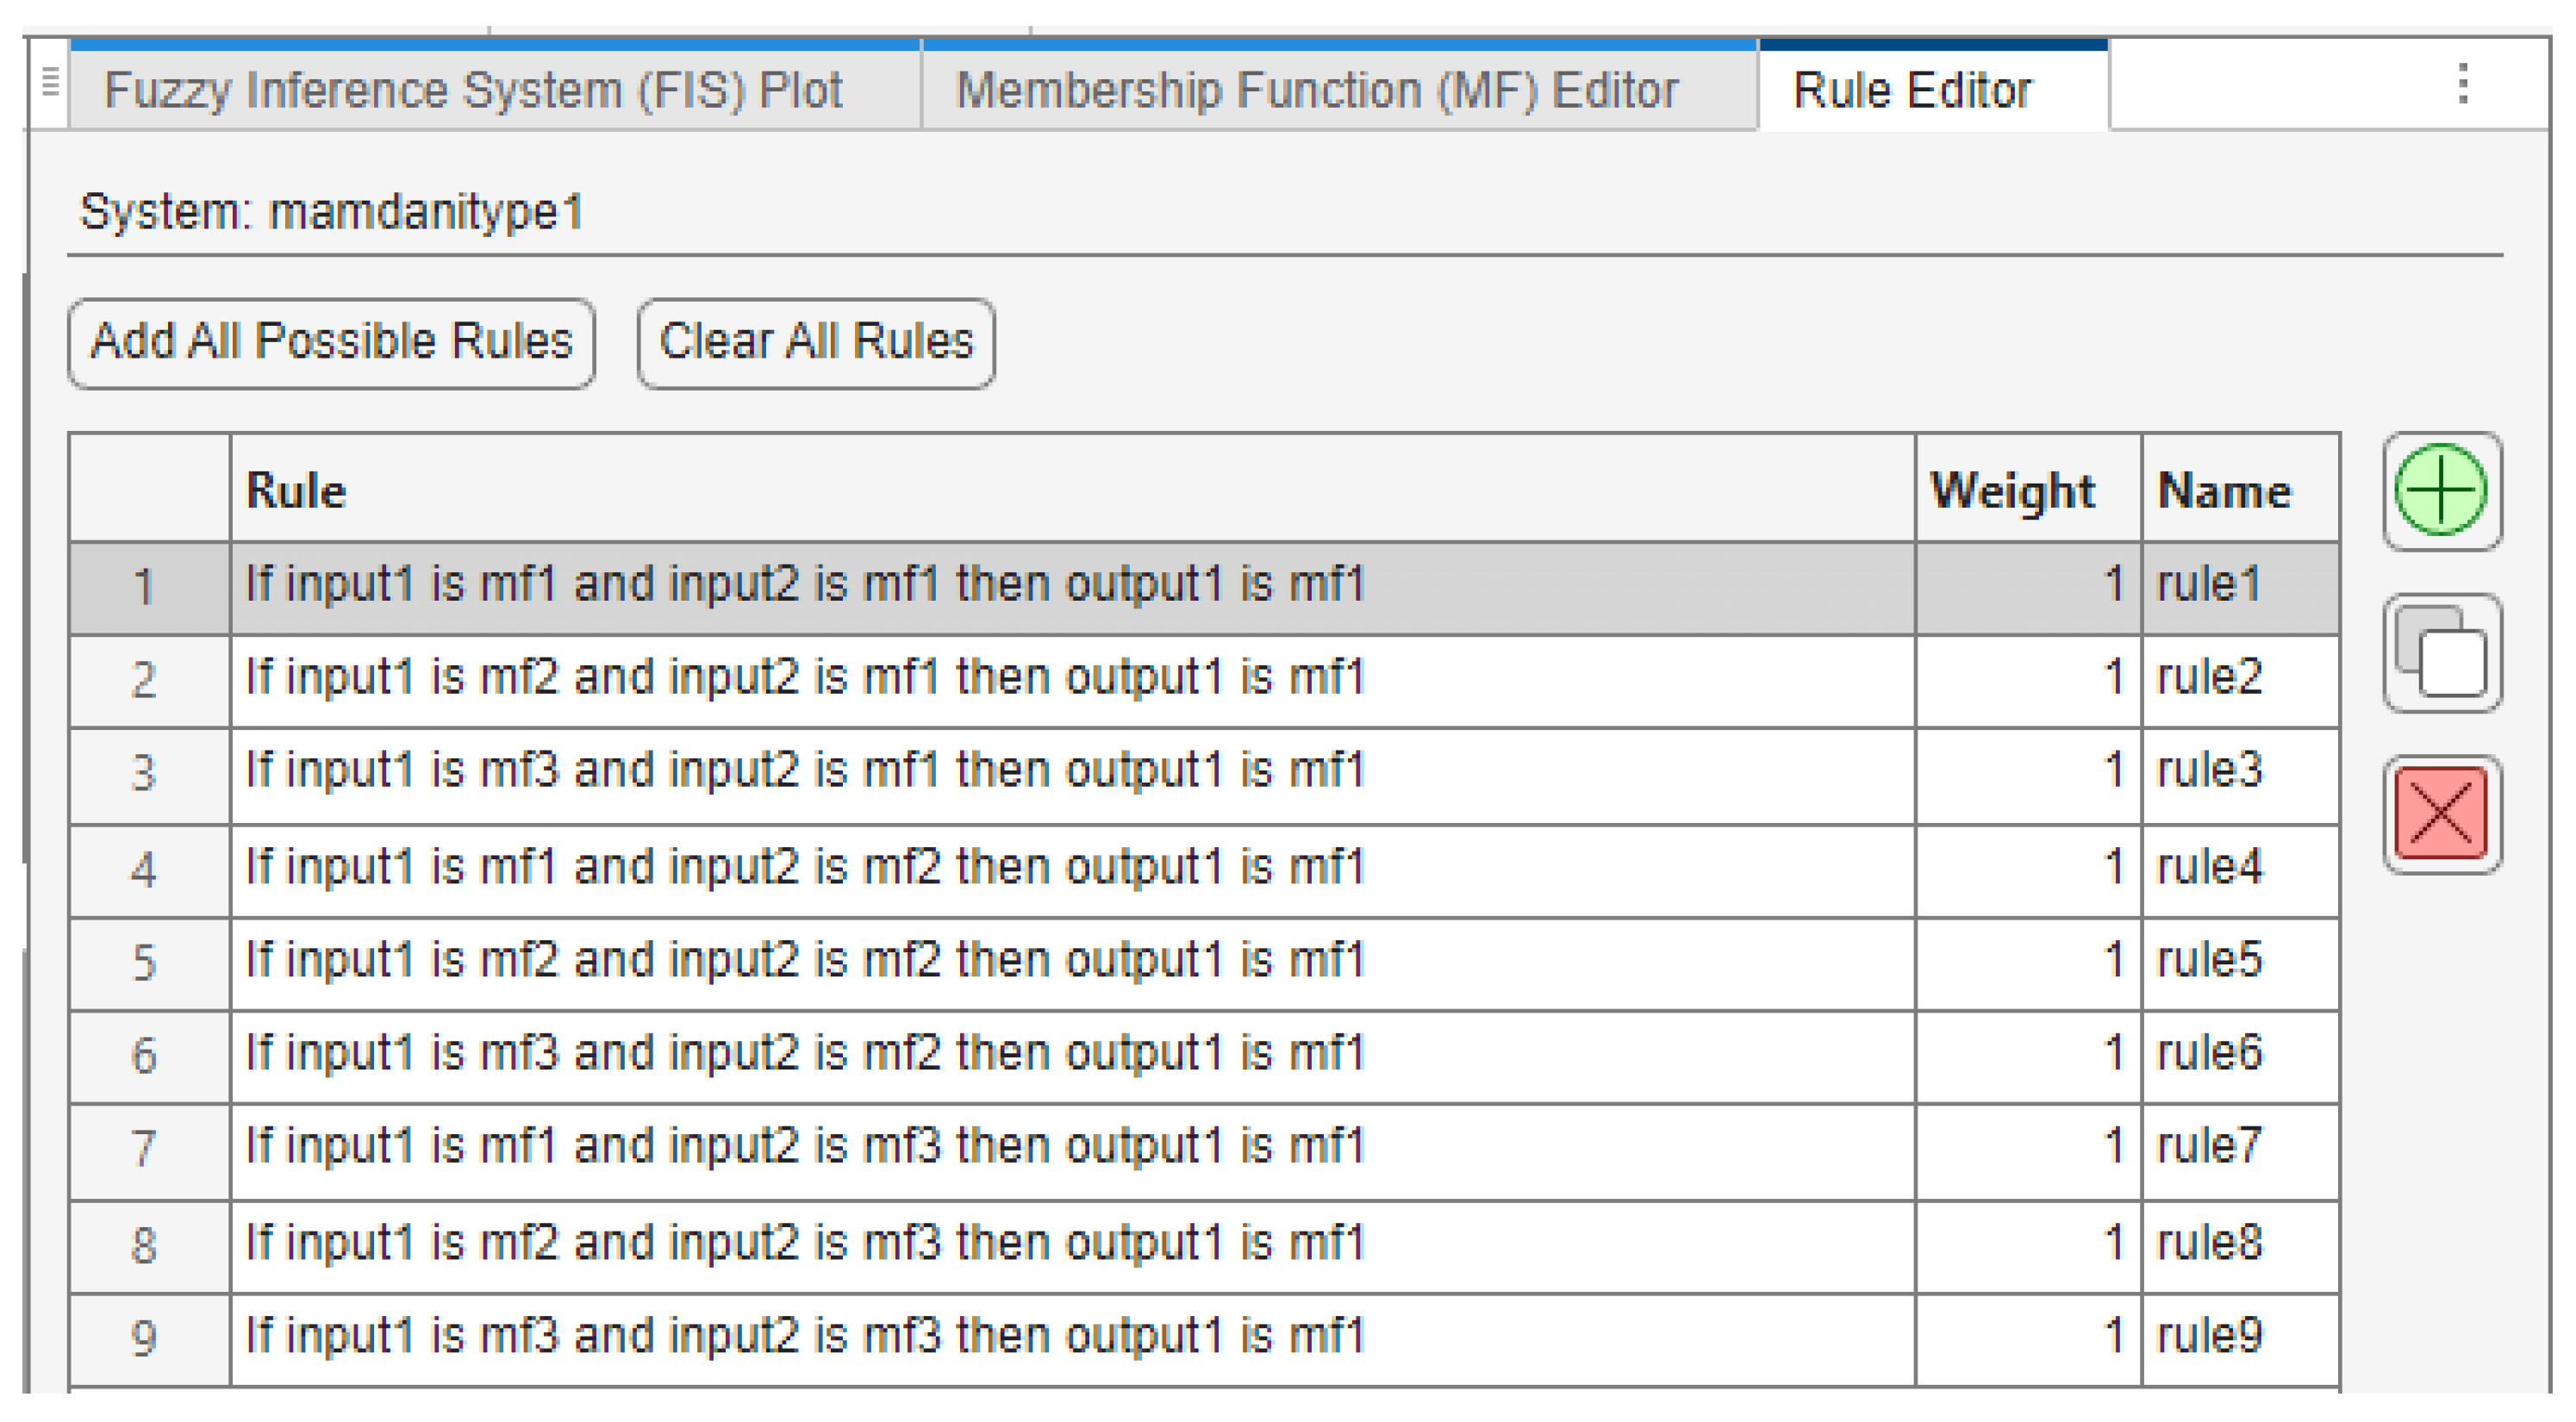
Figure 5.
Fuzzy rule base defined in the MATLAB Rule Editor.
Figure 5.
Fuzzy rule base defined in the MATLAB Rule Editor.
Figure 6.
Block diagram for PD and Fuzzy-PD controllers.
Figure 6.
Block diagram for PD and Fuzzy-PD controllers.
Figure 7.
Fuzzy-P controller rule base.
Figure 7.
Fuzzy-P controller rule base.
Figure 8.
Fuzzy-PD controller rule base.
Figure 8.
Fuzzy-PD controller rule base.
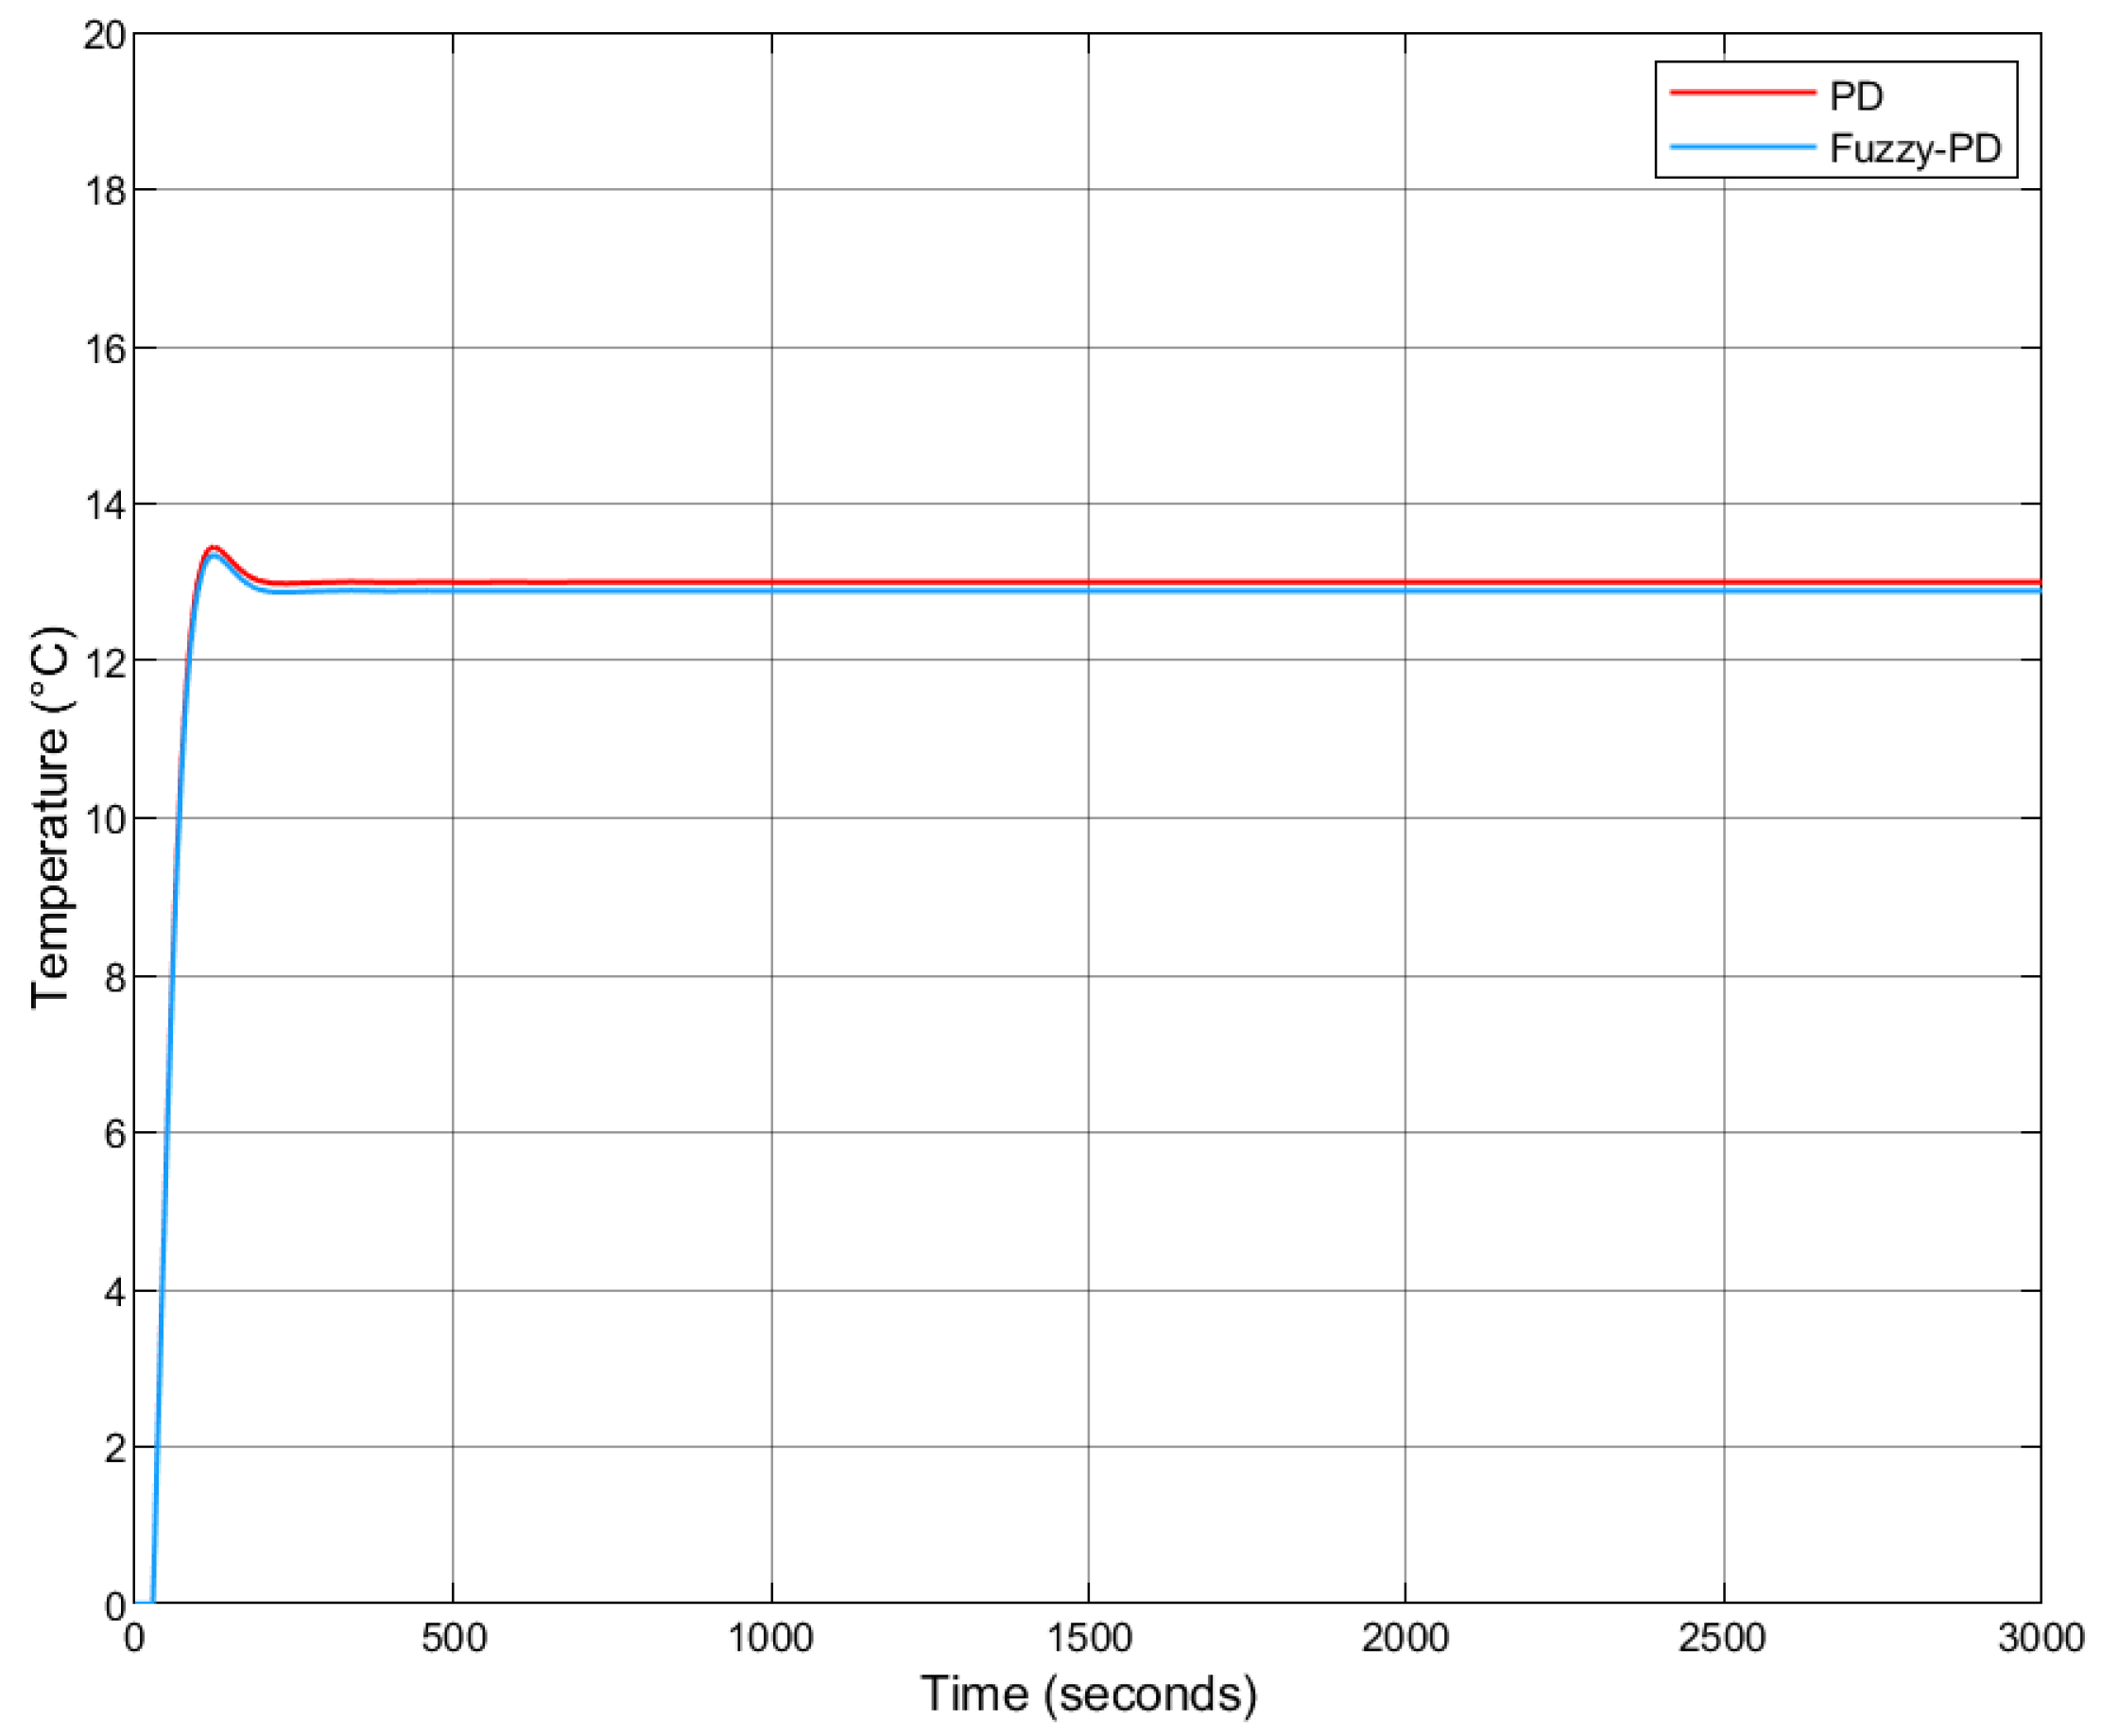
Figure 9.
Step response comparison: Fuzzy-PD vs. classical PD (reference = 18 °C).
Figure 9.
Step response comparison: Fuzzy-PD vs. classical PD (reference = 18 °C).
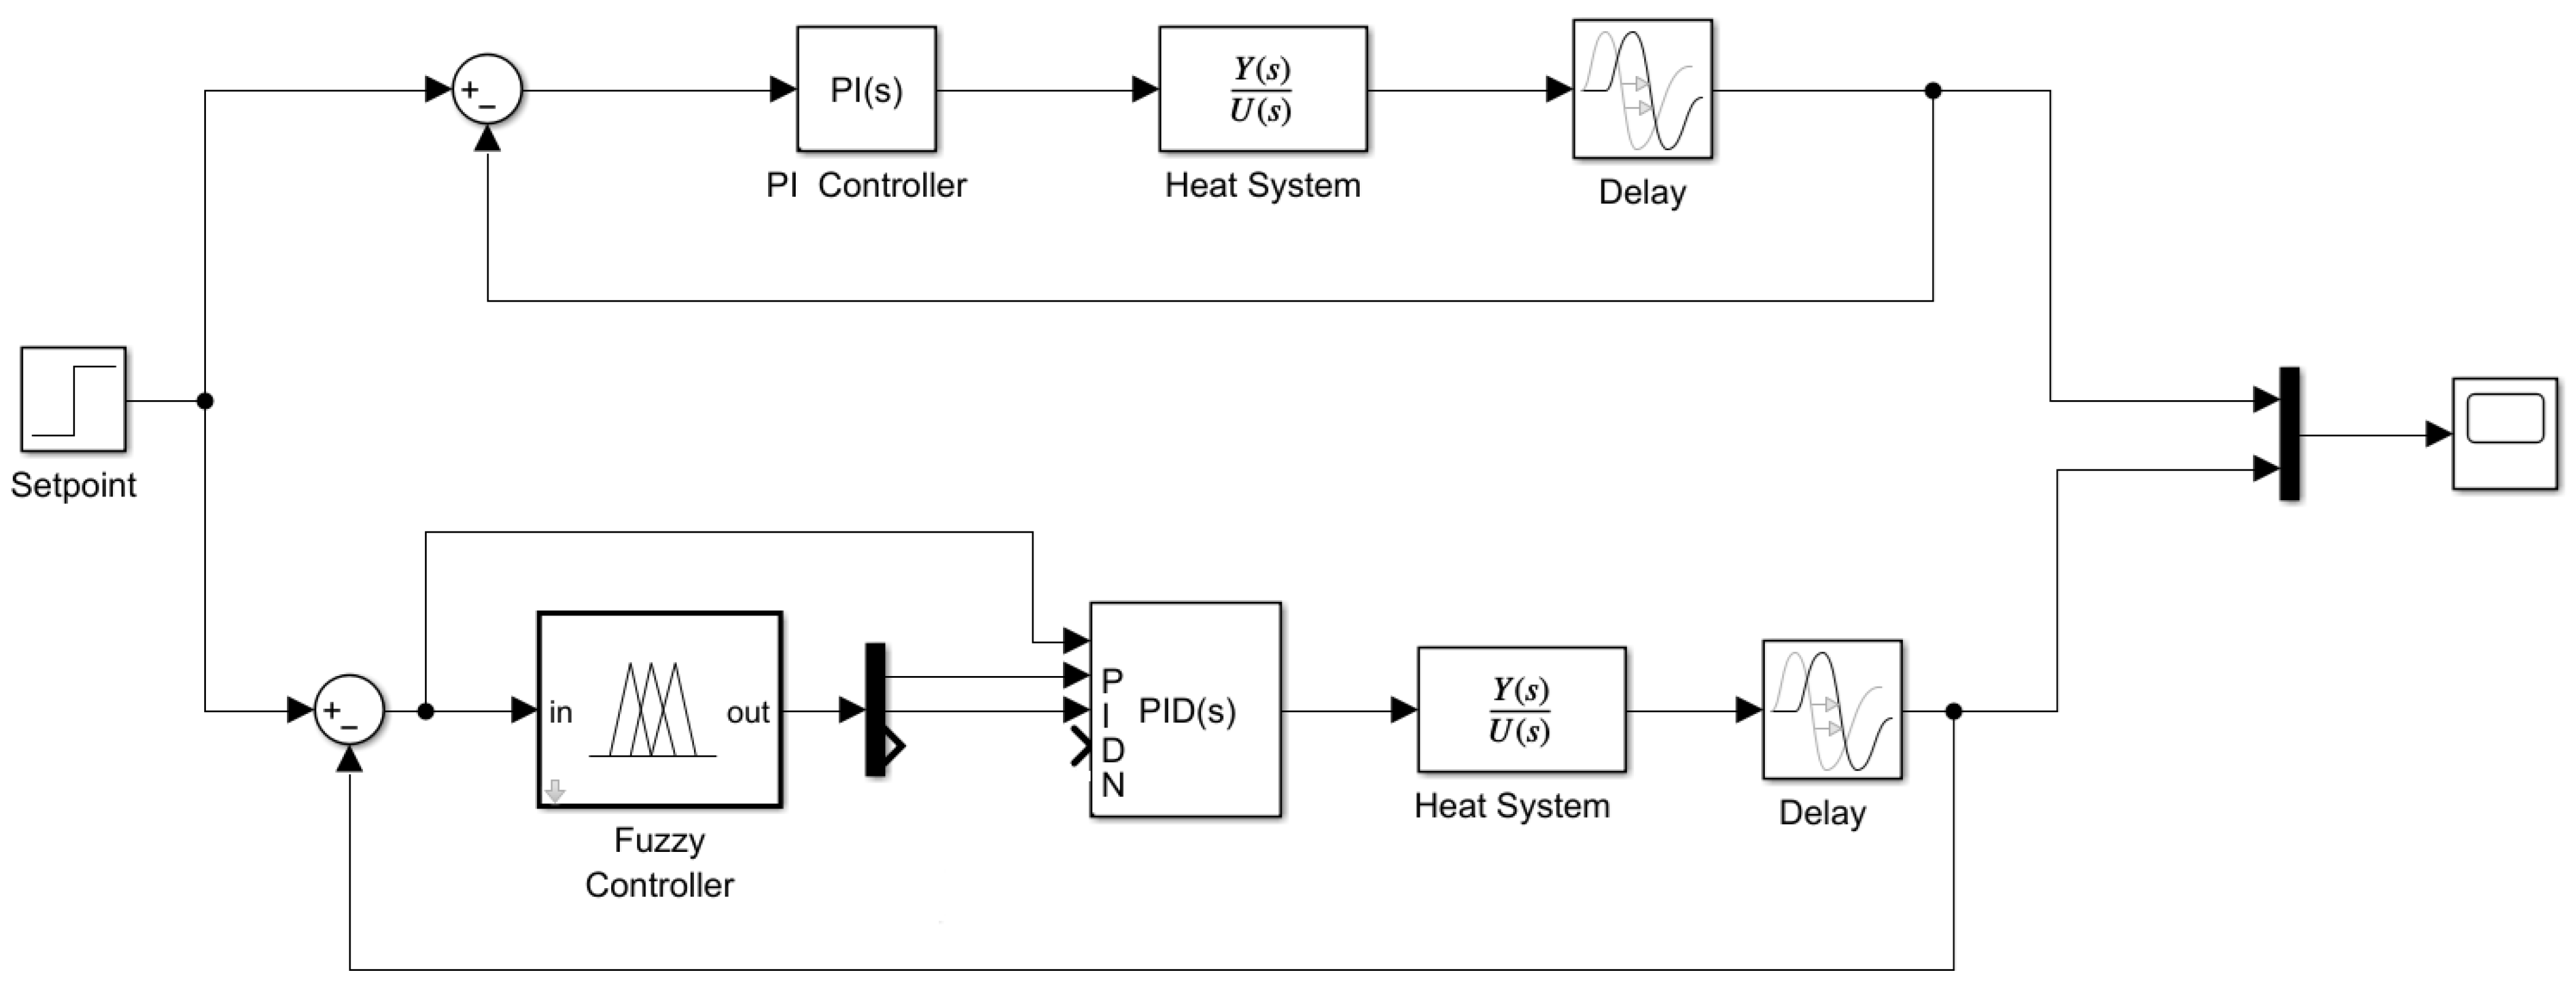
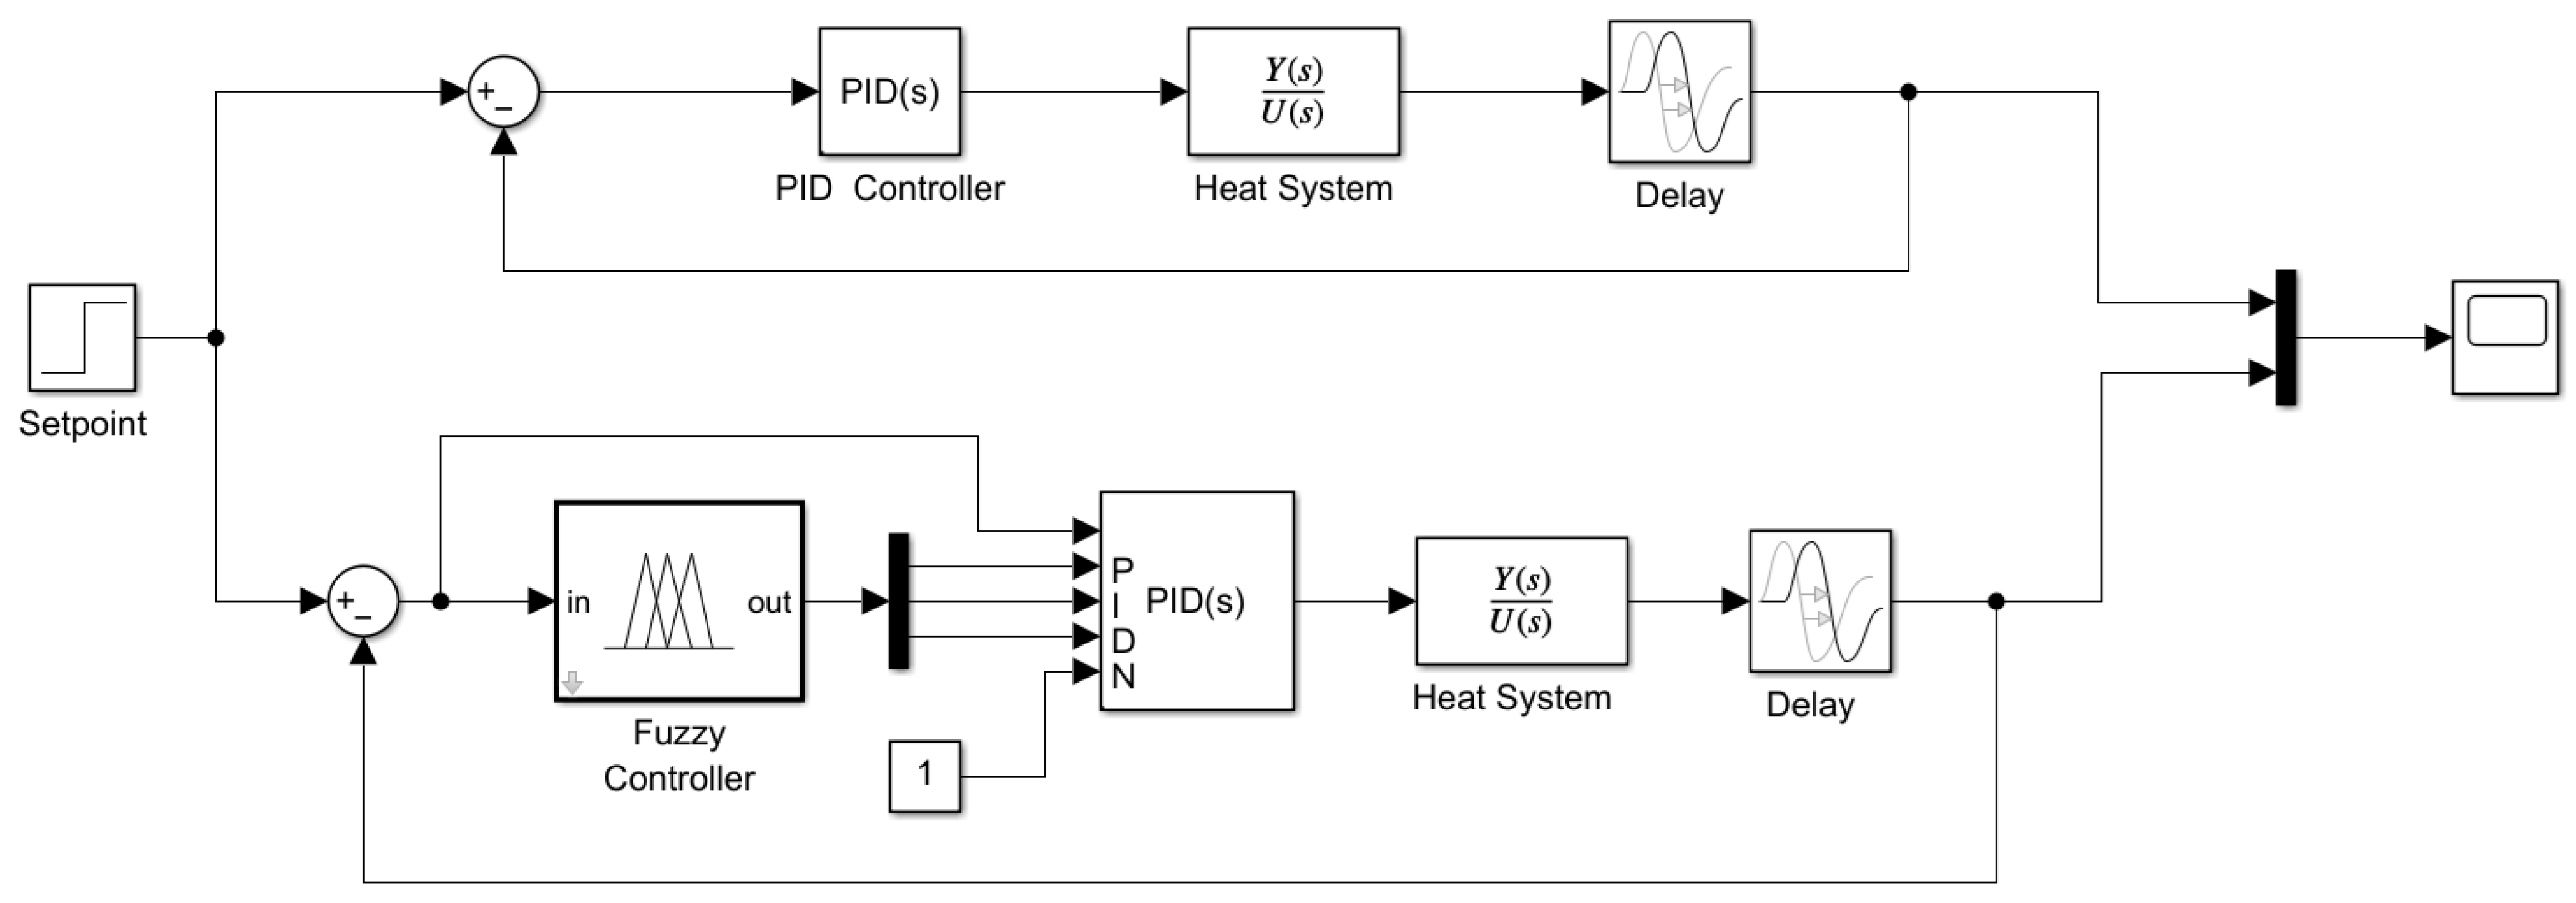
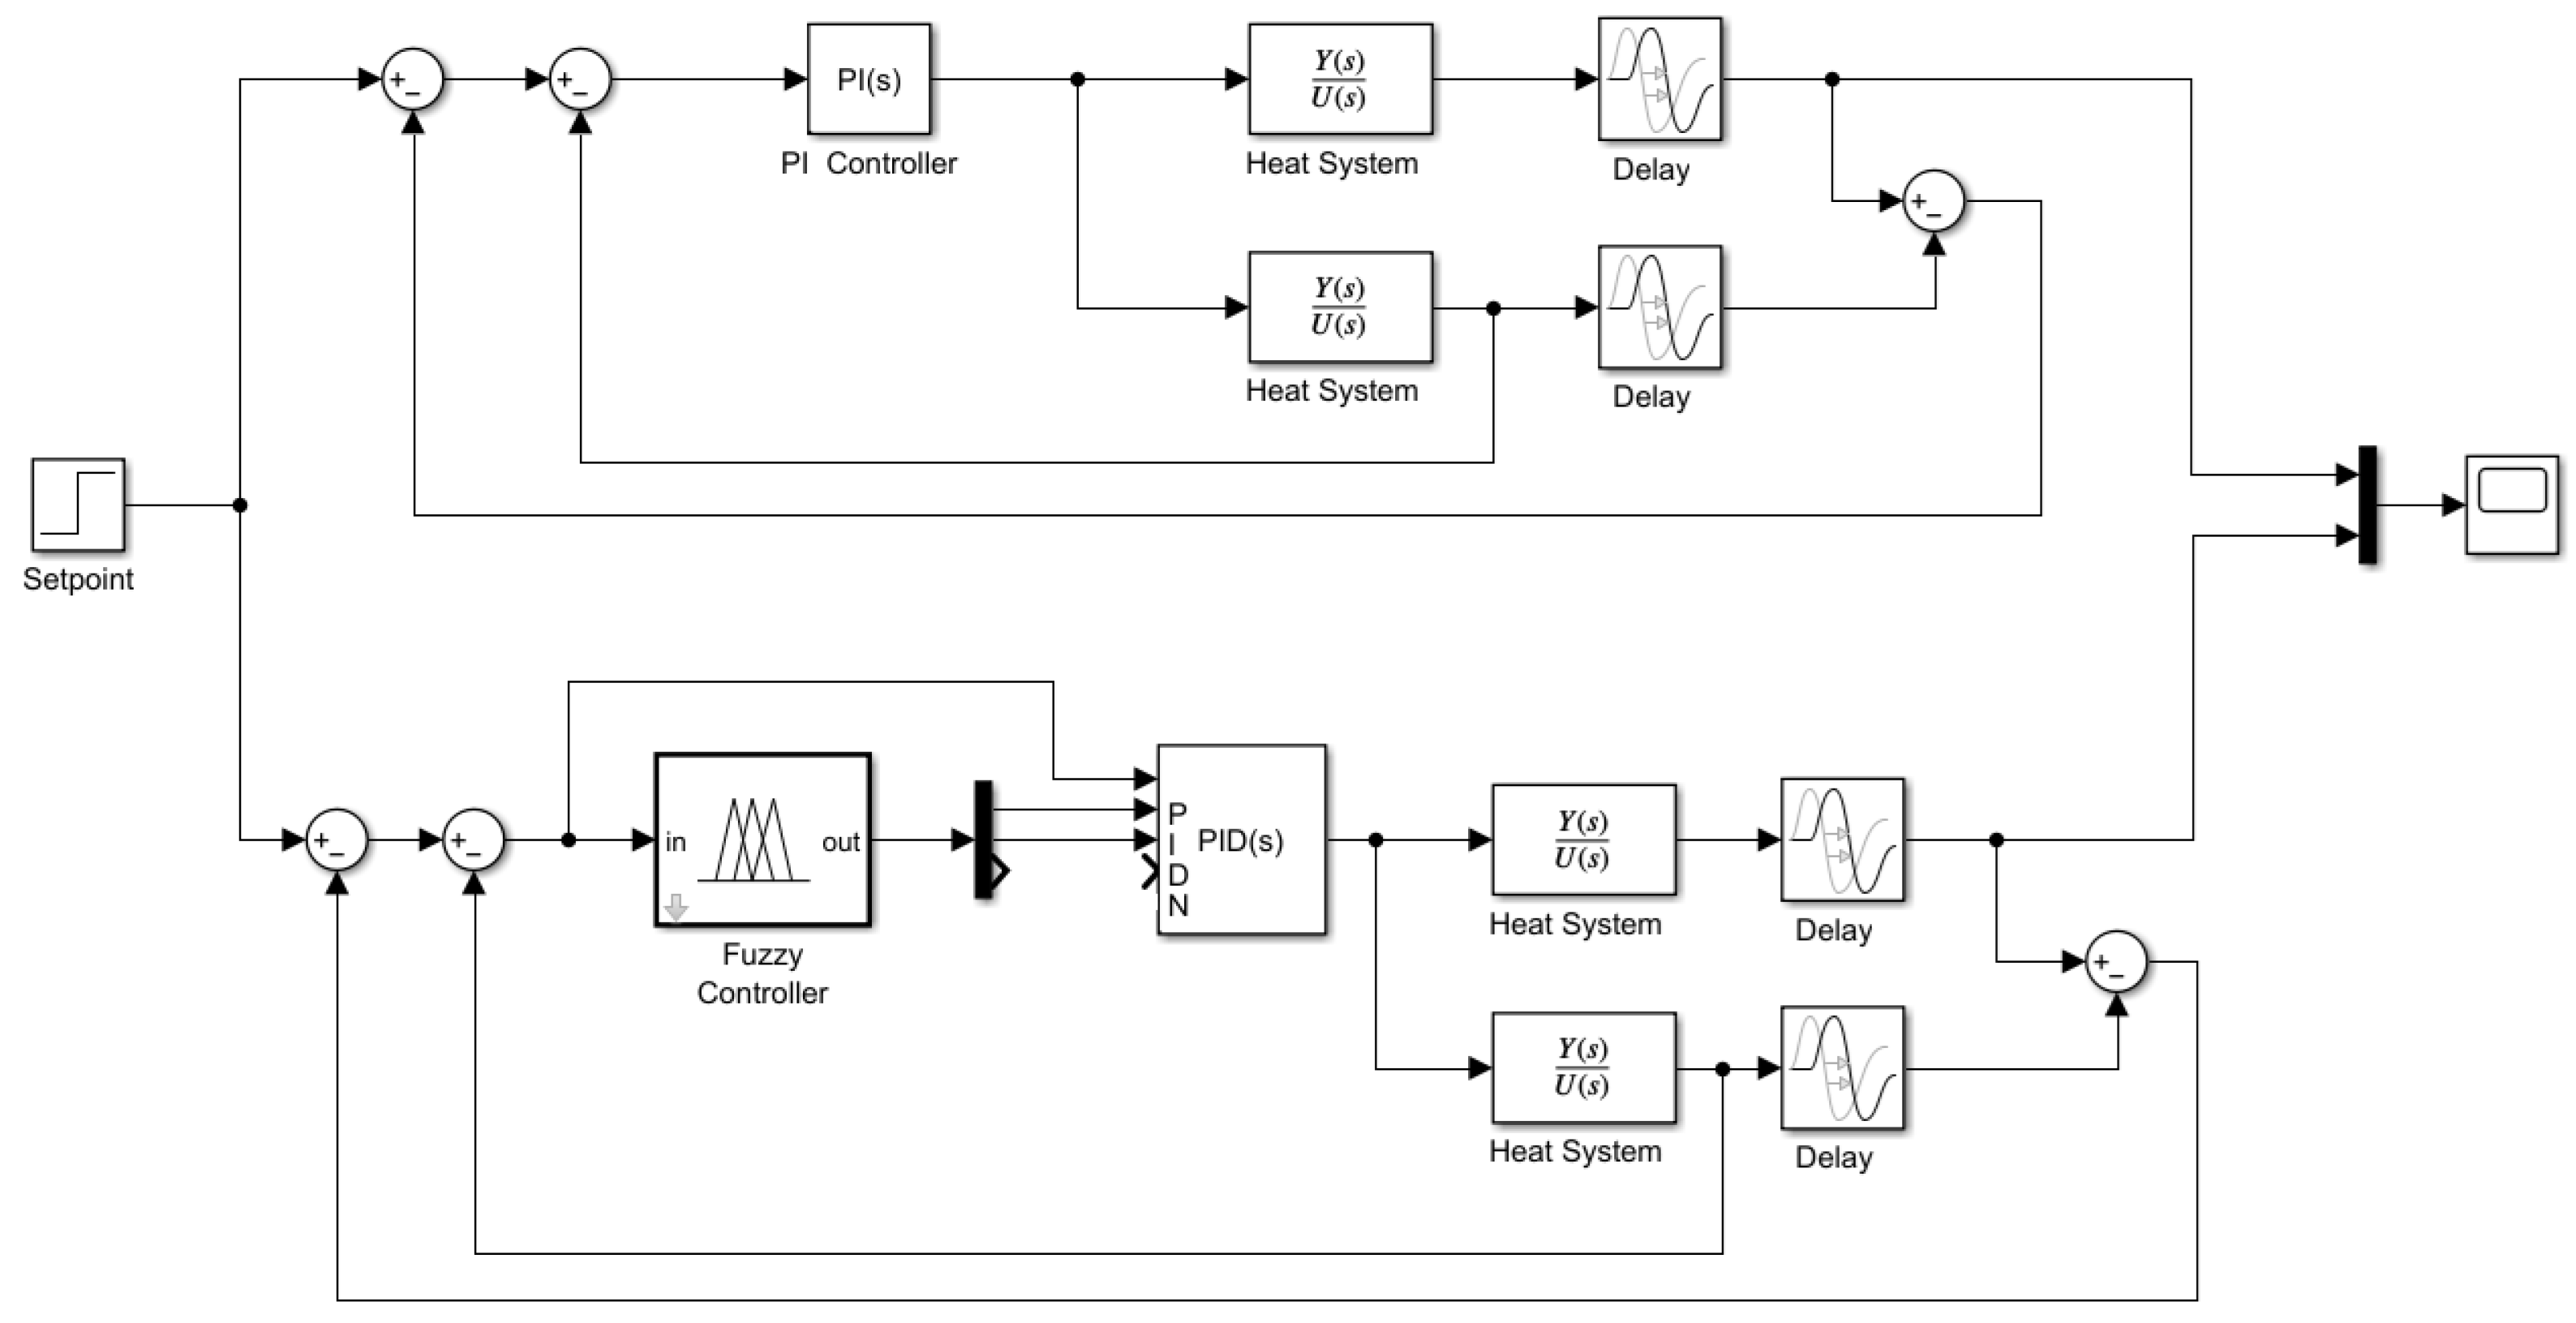
Figure 10.
Block diagram: Fuzzy-PI vs. classical PI controller.
Figure 10.
Block diagram: Fuzzy-PI vs. classical PI controller.
Figure 11.
Fuzzy-PI controller rule base.
Figure 11.
Fuzzy-PI controller rule base.
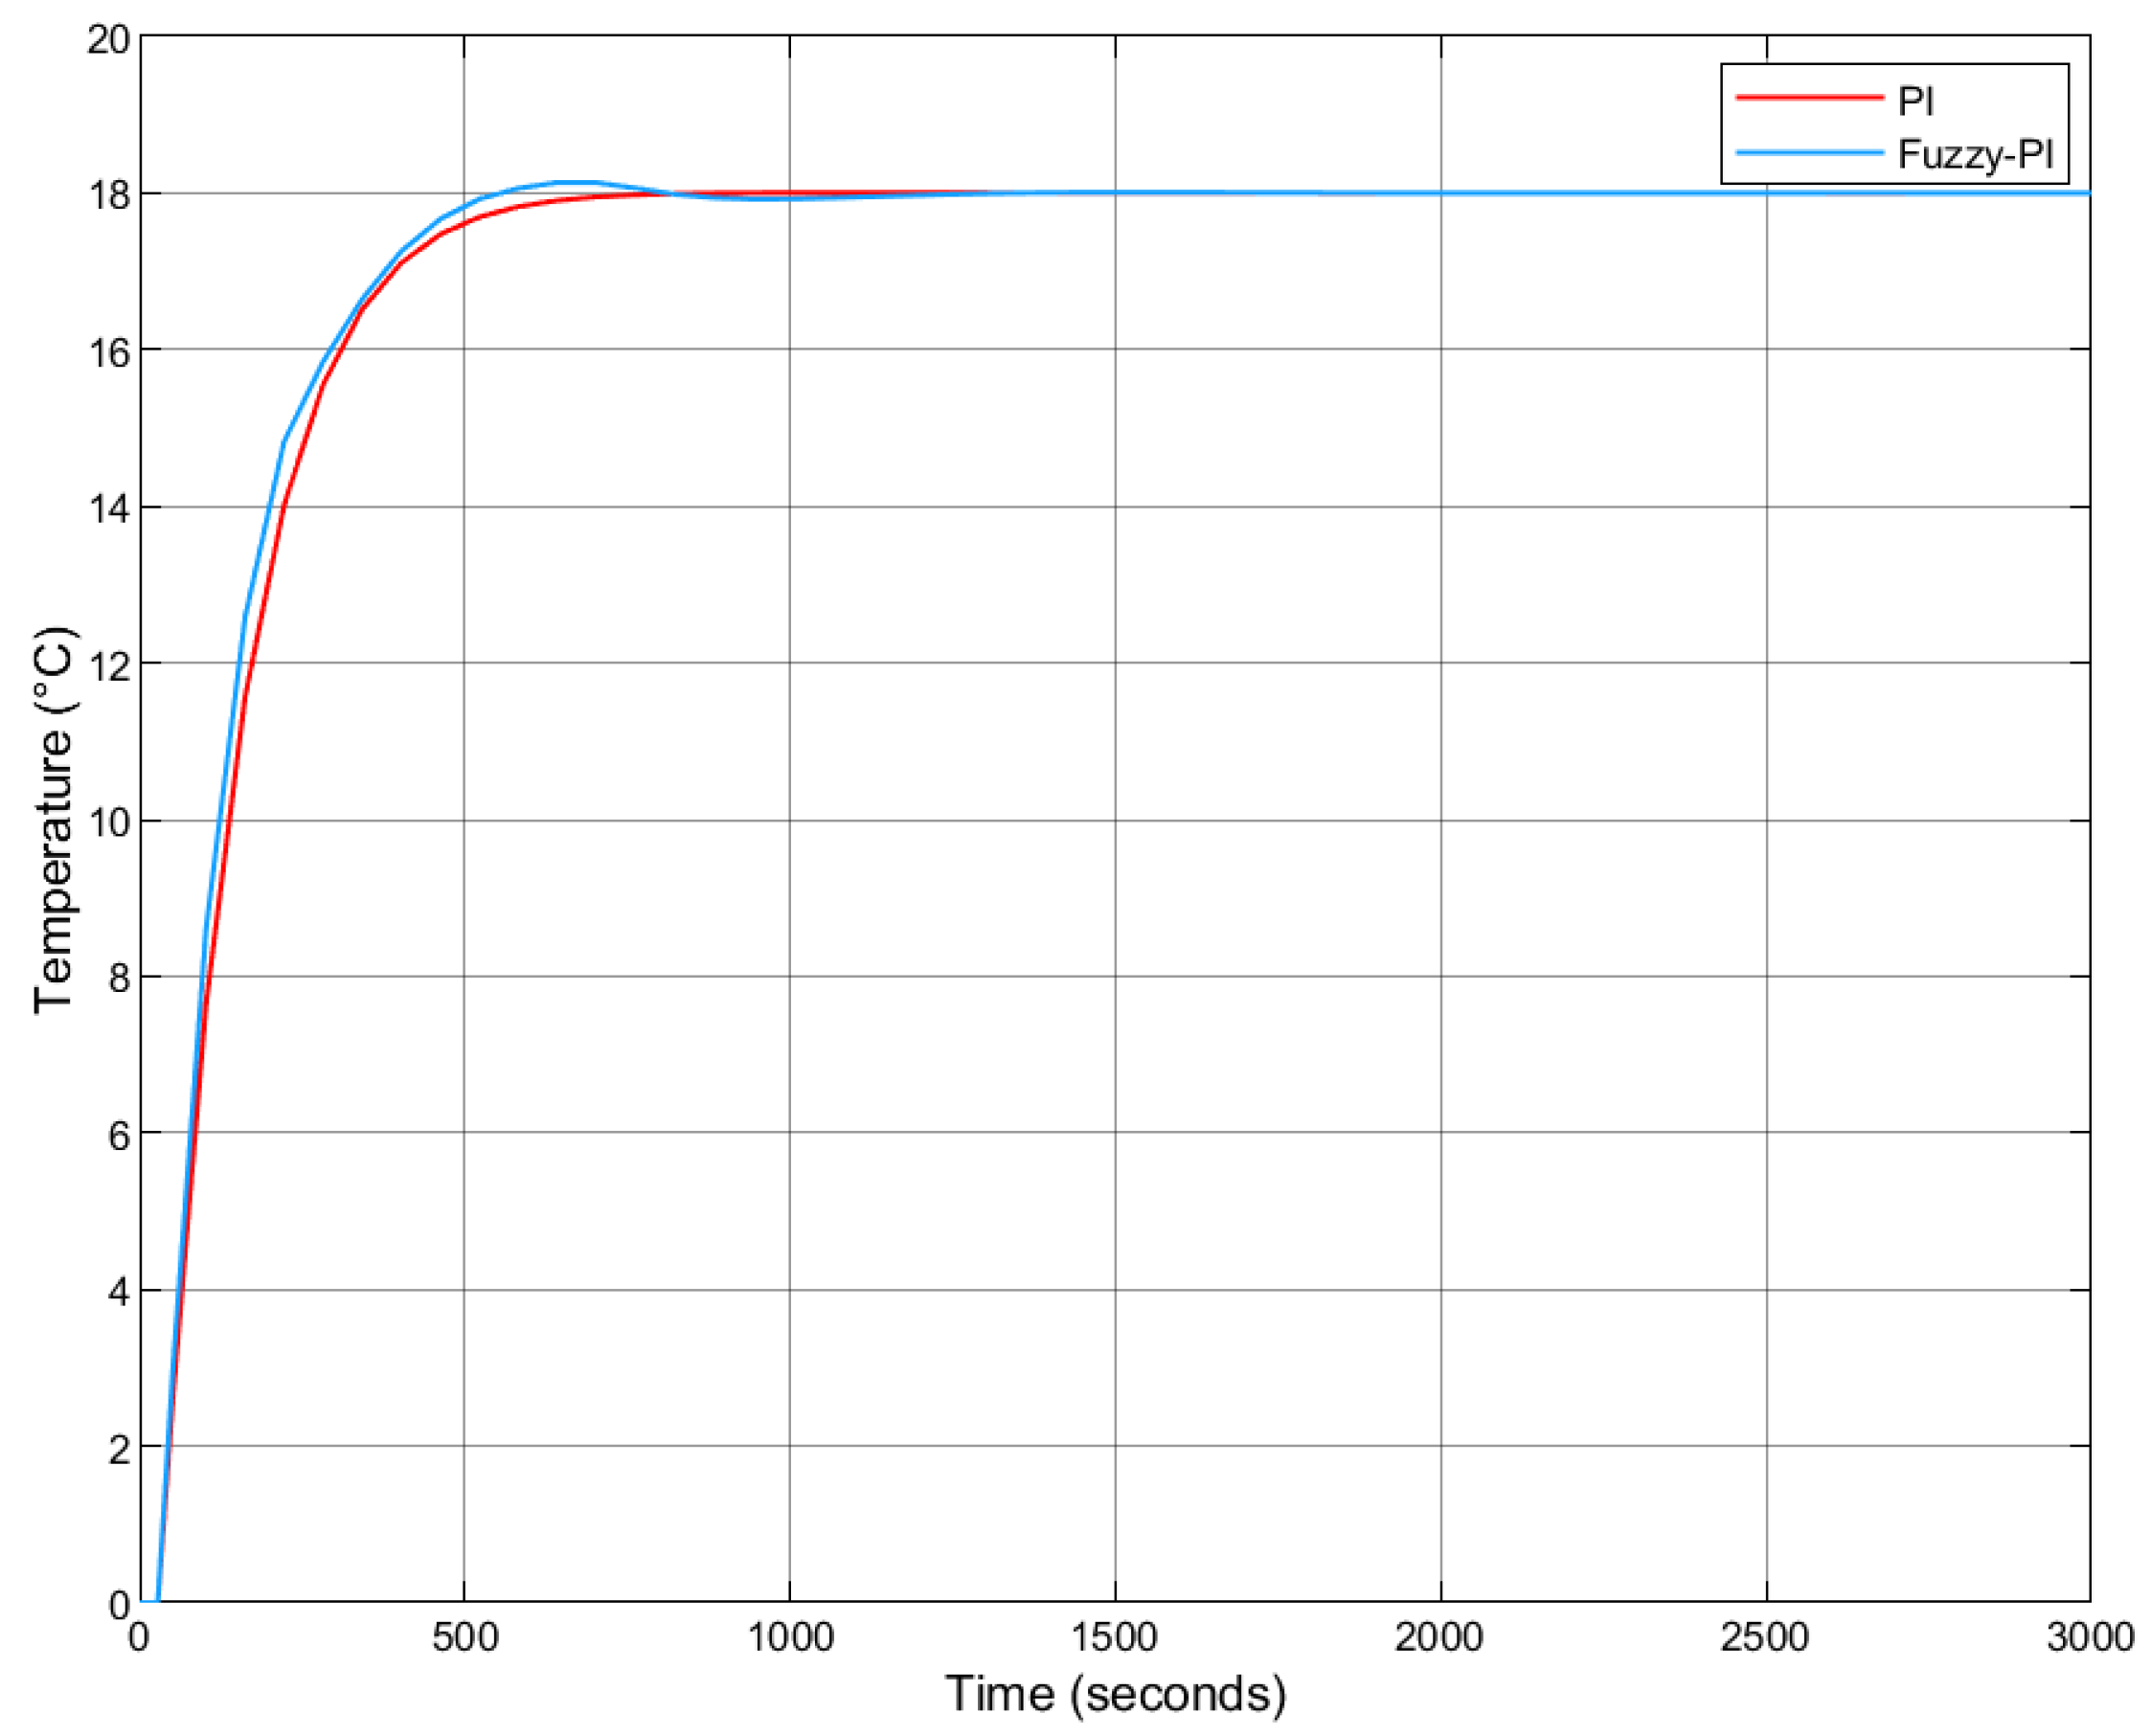
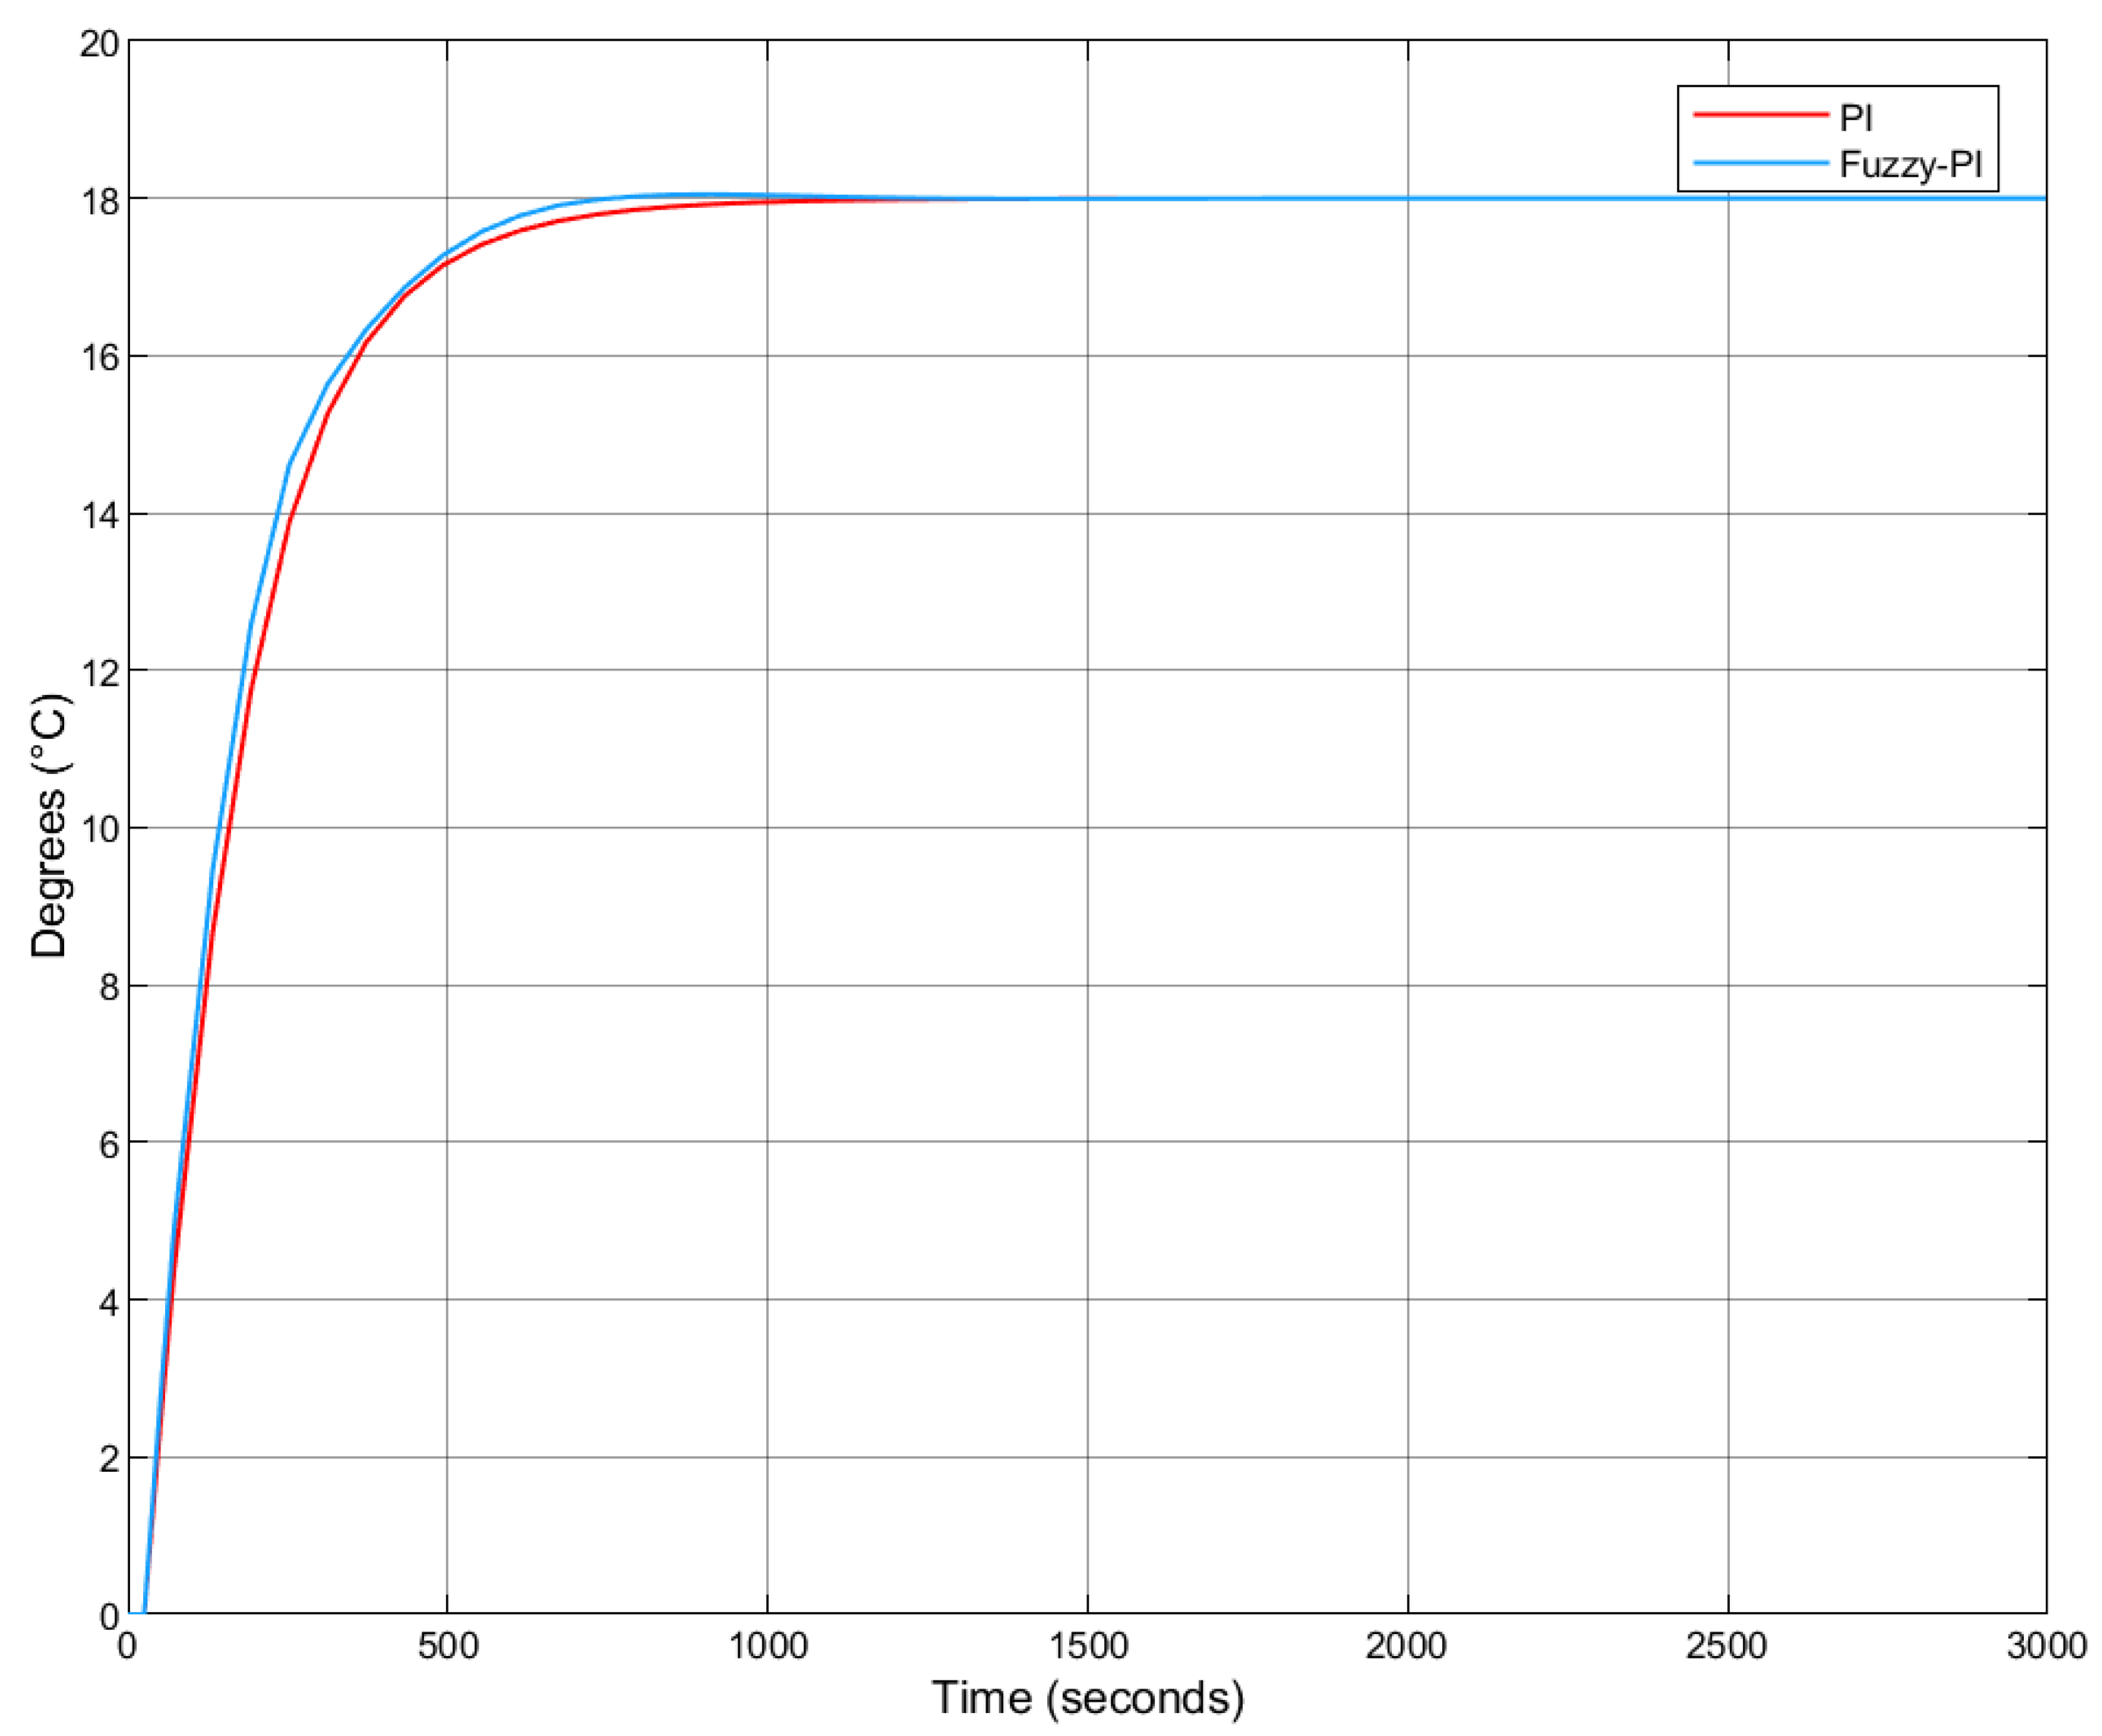
Figure 12.
Step response comparison: Fuzzy-PI vs. PI.
Figure 12.
Step response comparison: Fuzzy-PI vs. PI.
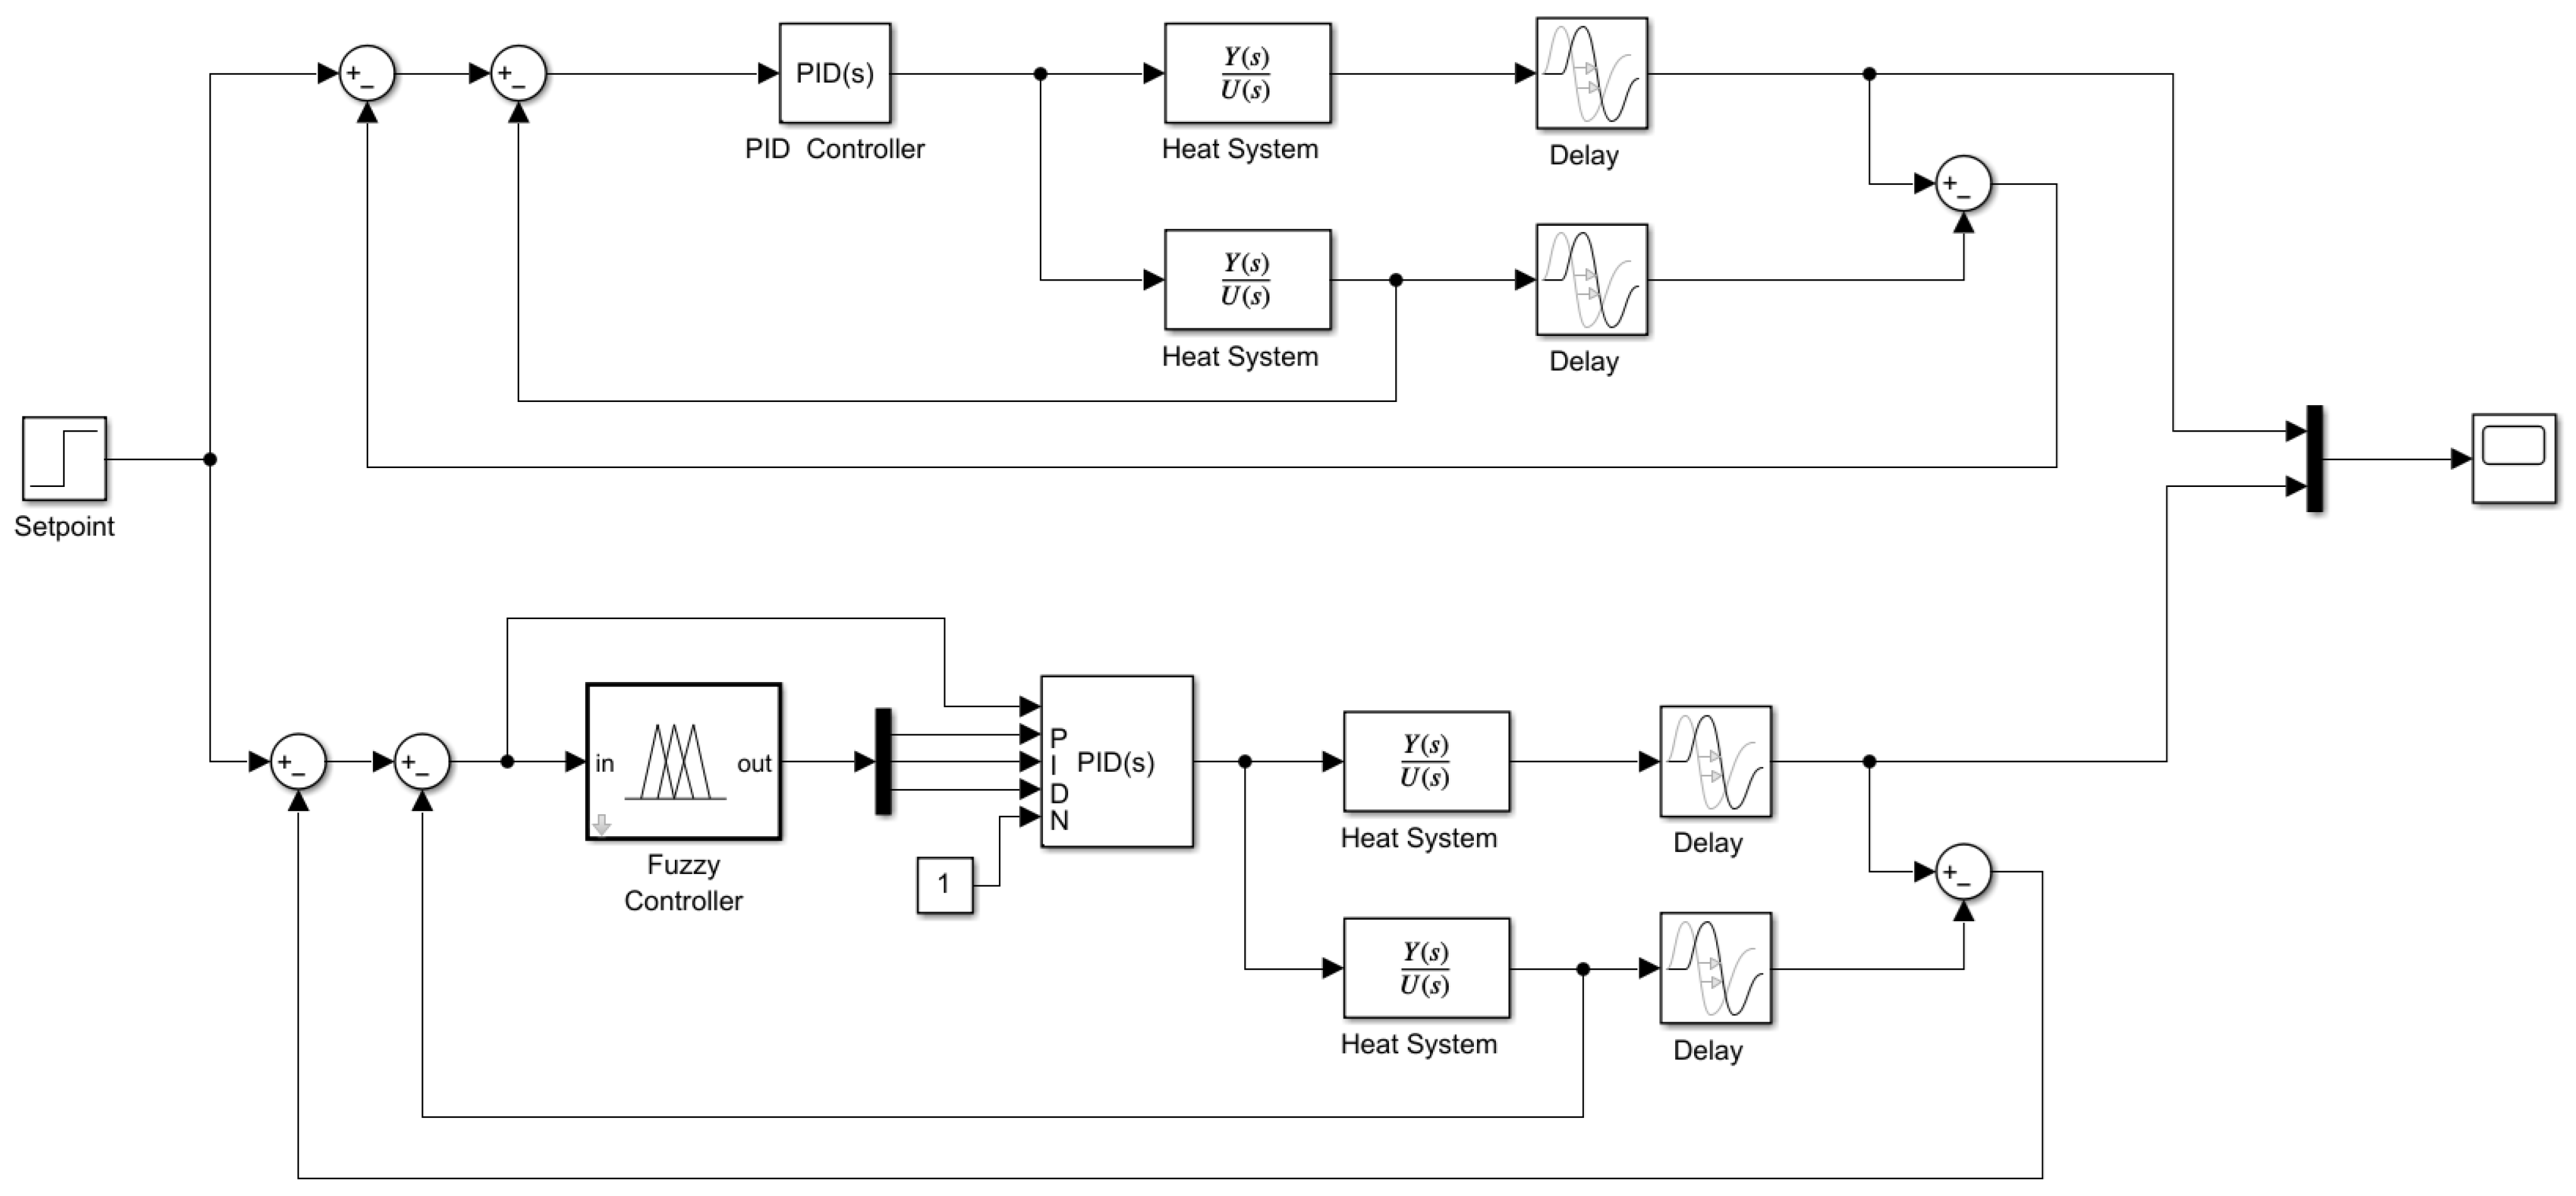
Figure 13.
Block diagram: Fuzzy-PID vs. classical PID controller.
Figure 13.
Block diagram: Fuzzy-PID vs. classical PID controller.
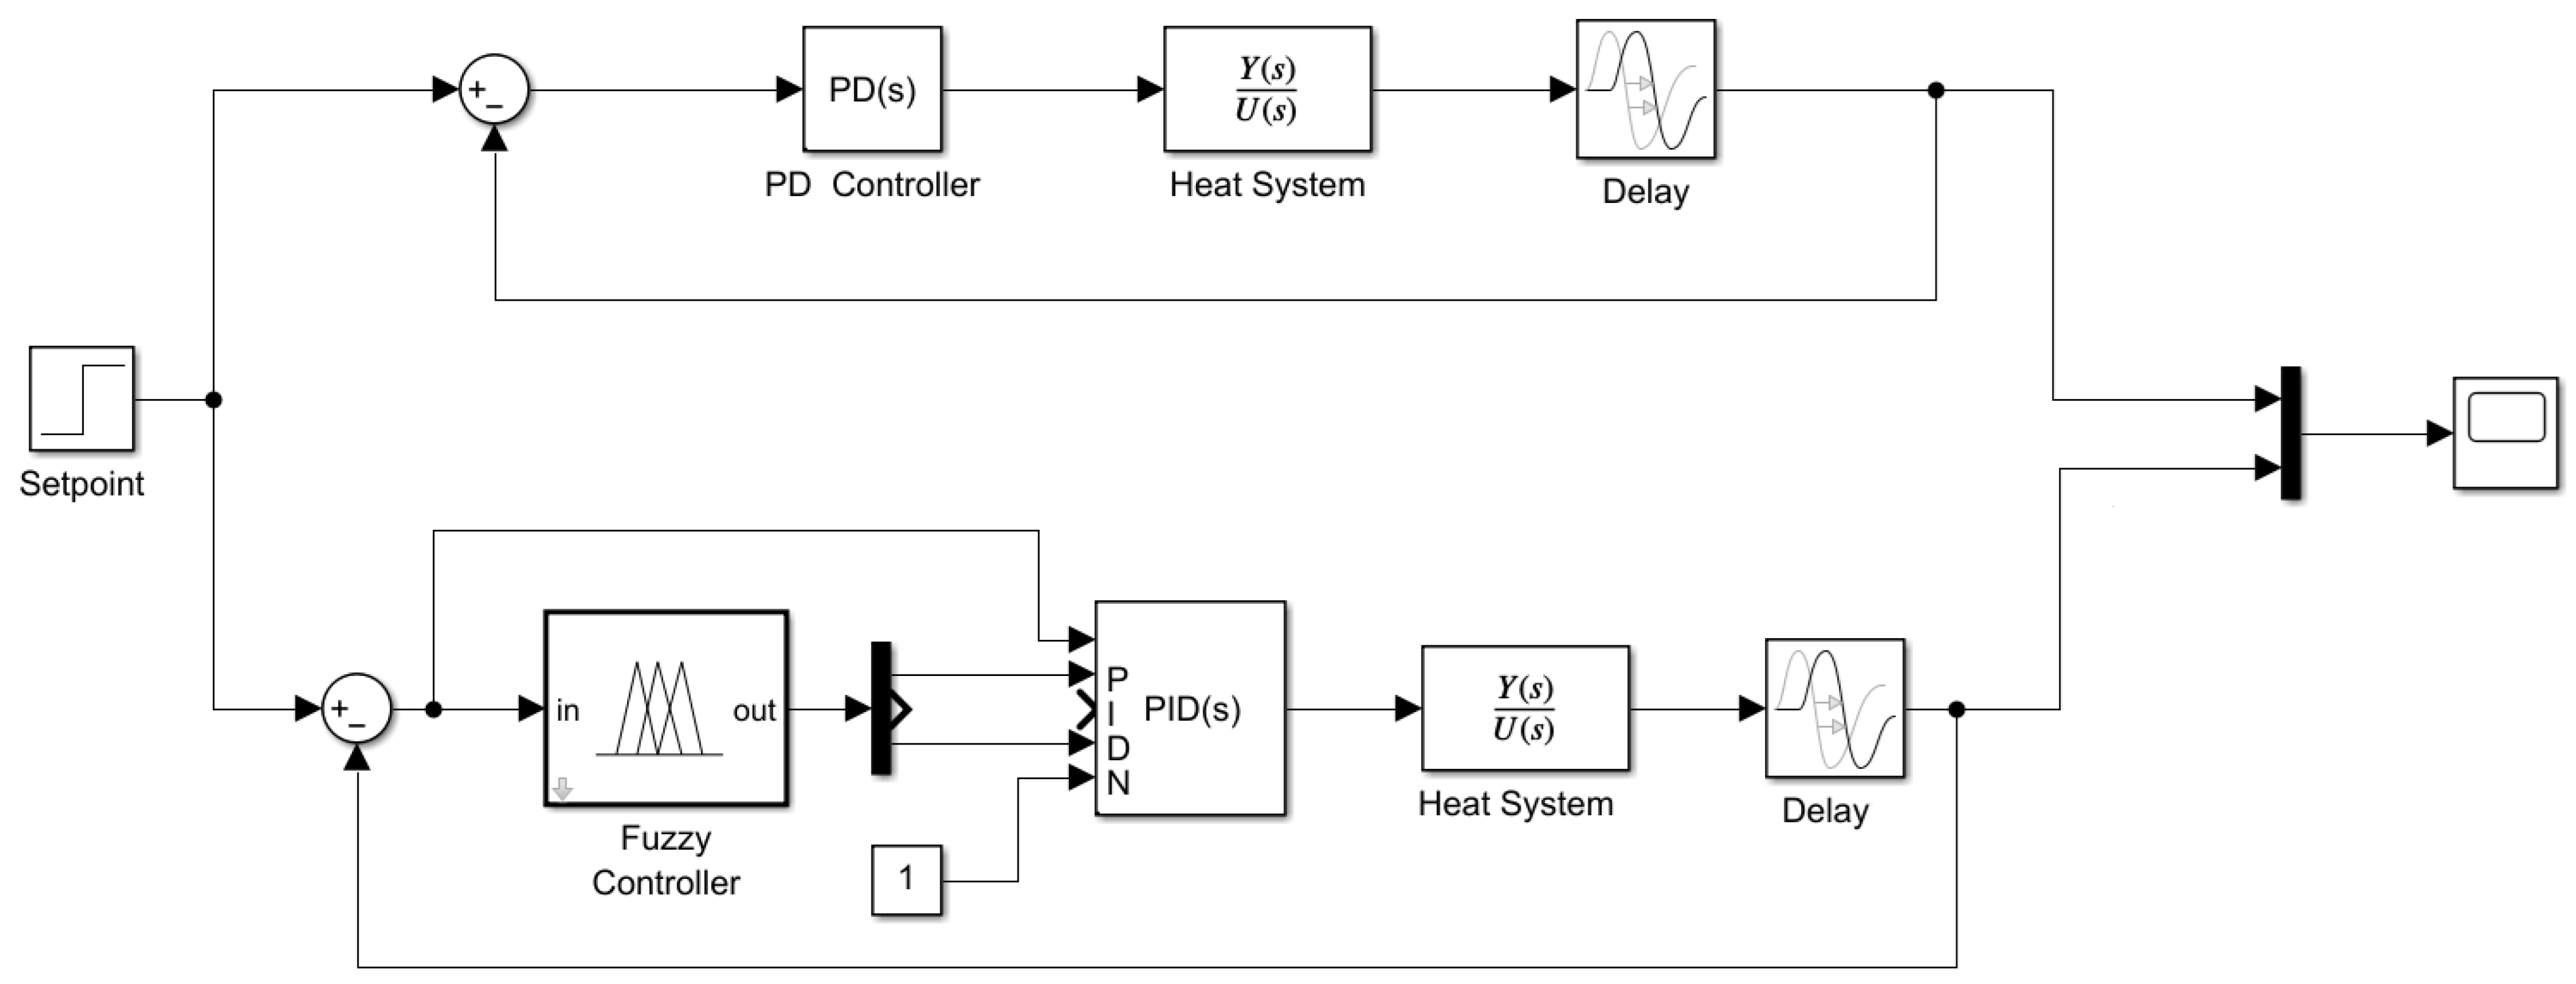
Figure 14.
Fuzzy-PID rule base.
Figure 14.
Fuzzy-PID rule base.
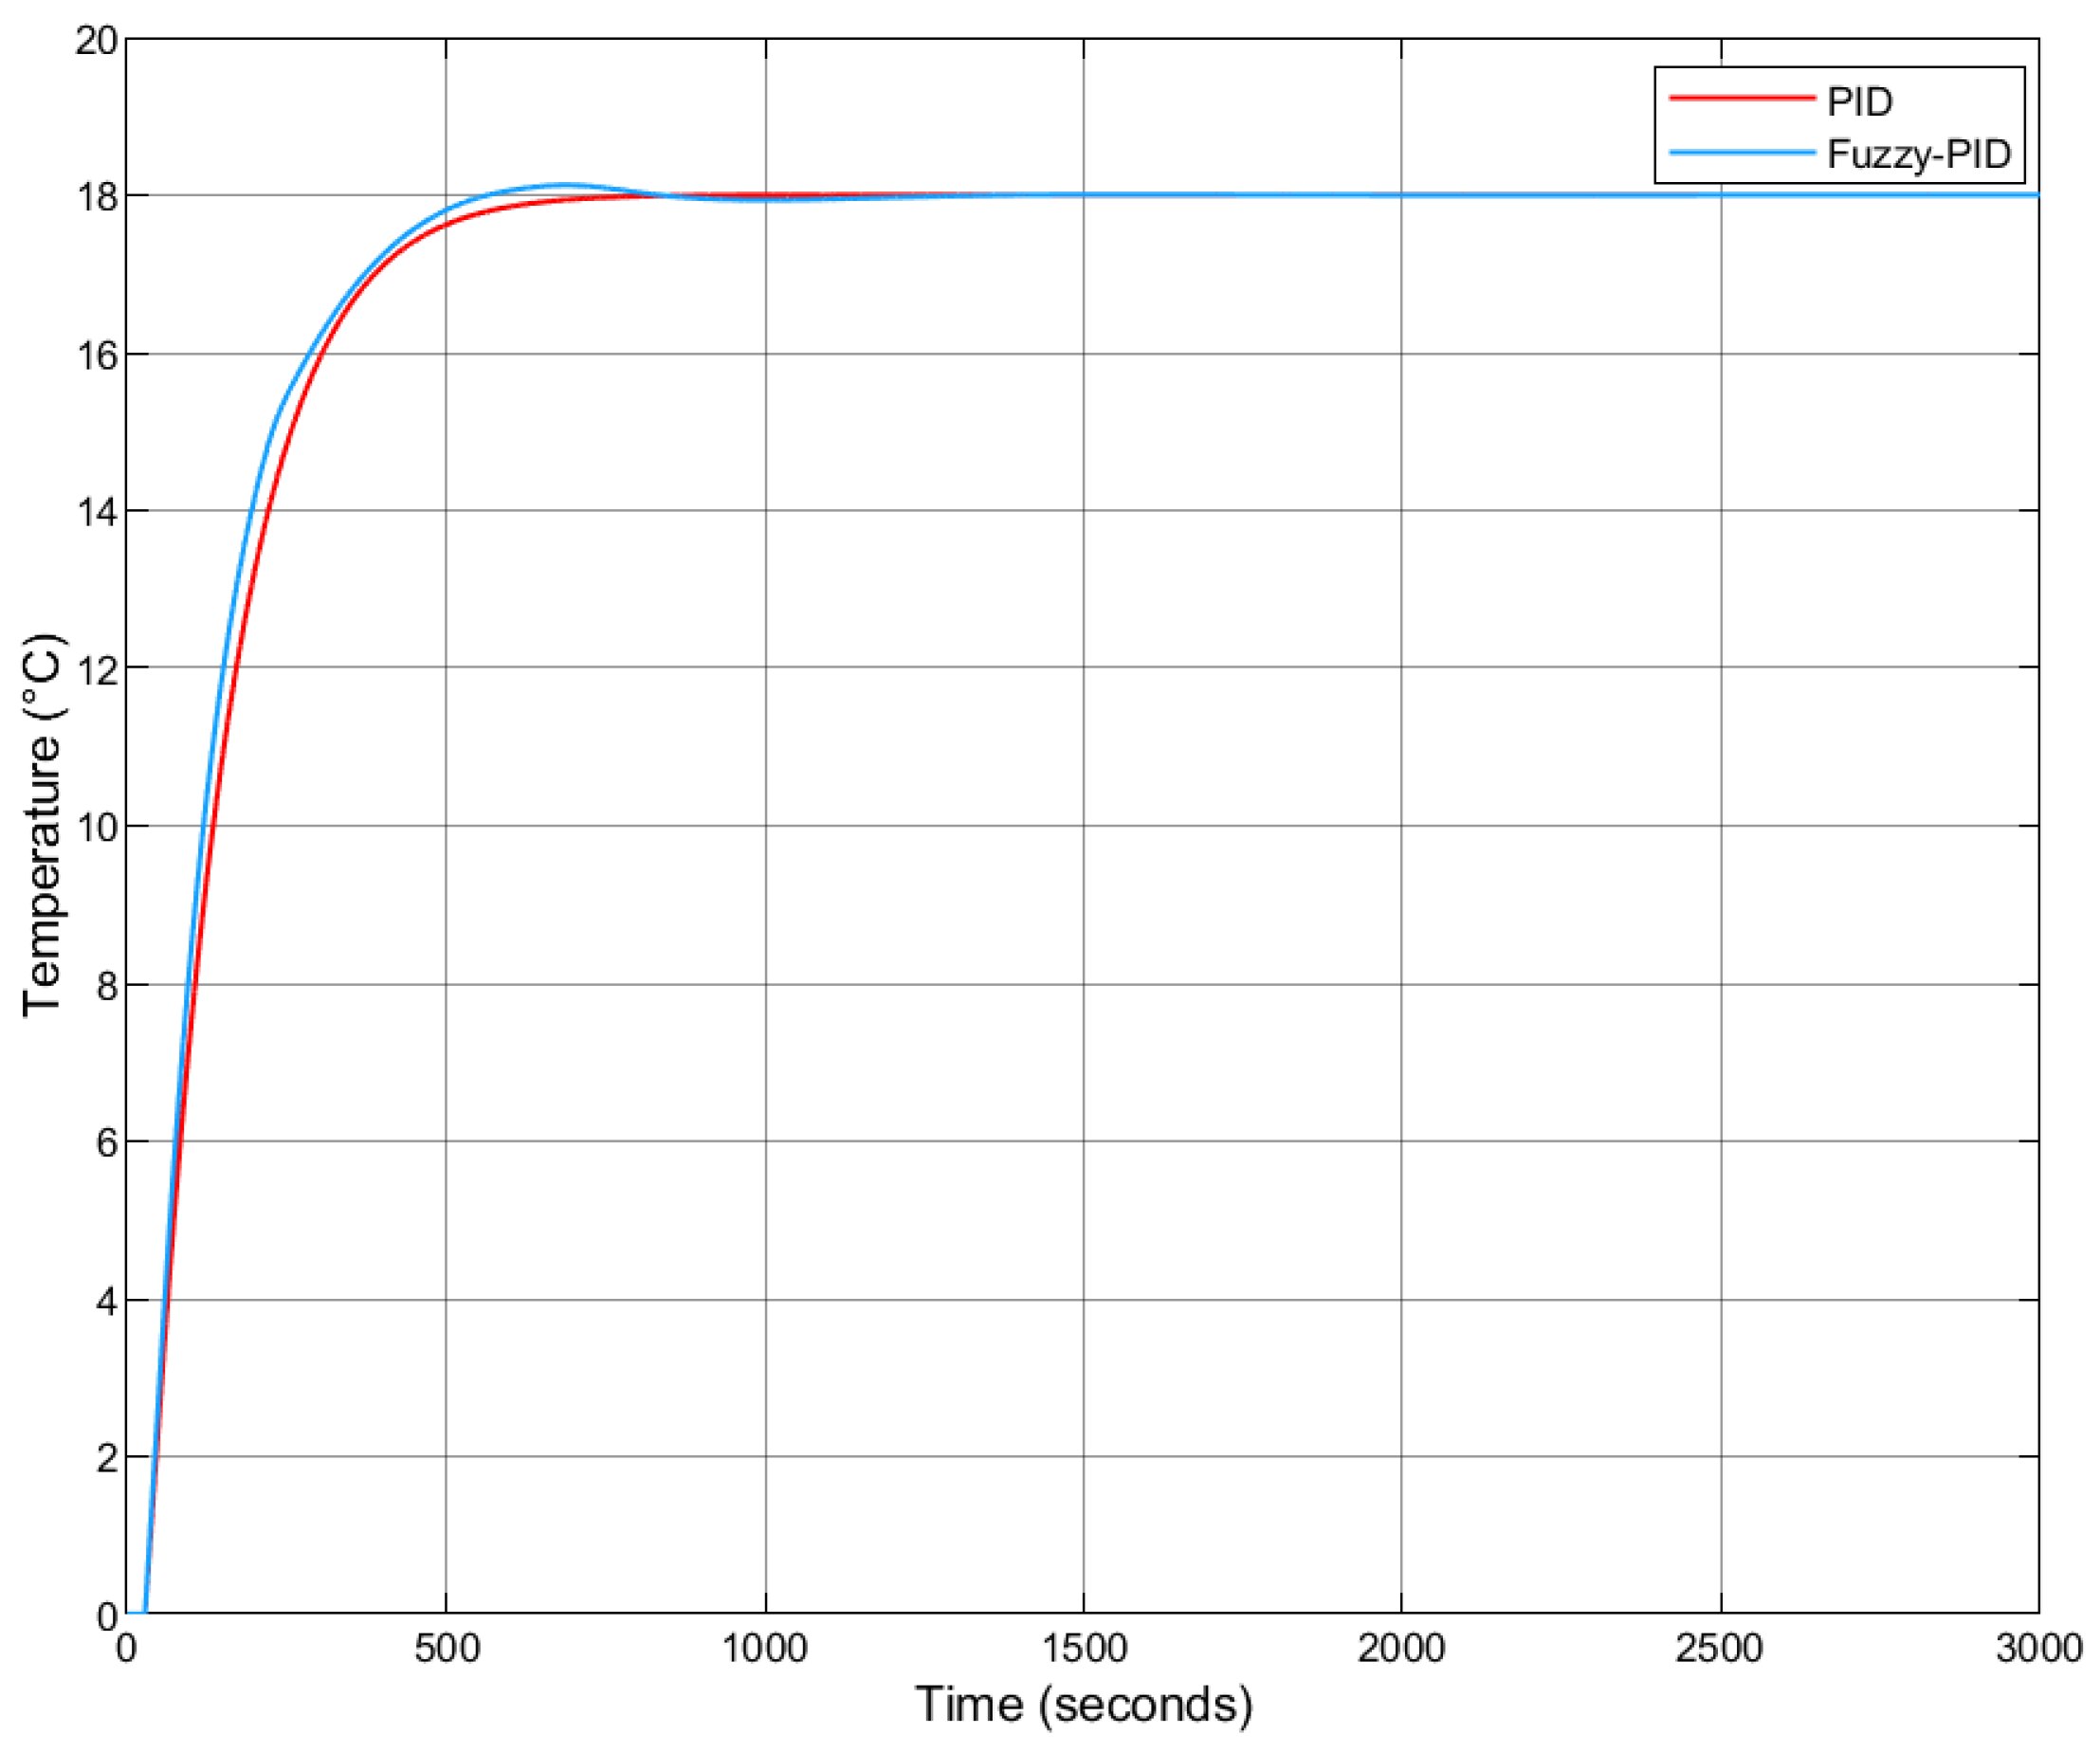
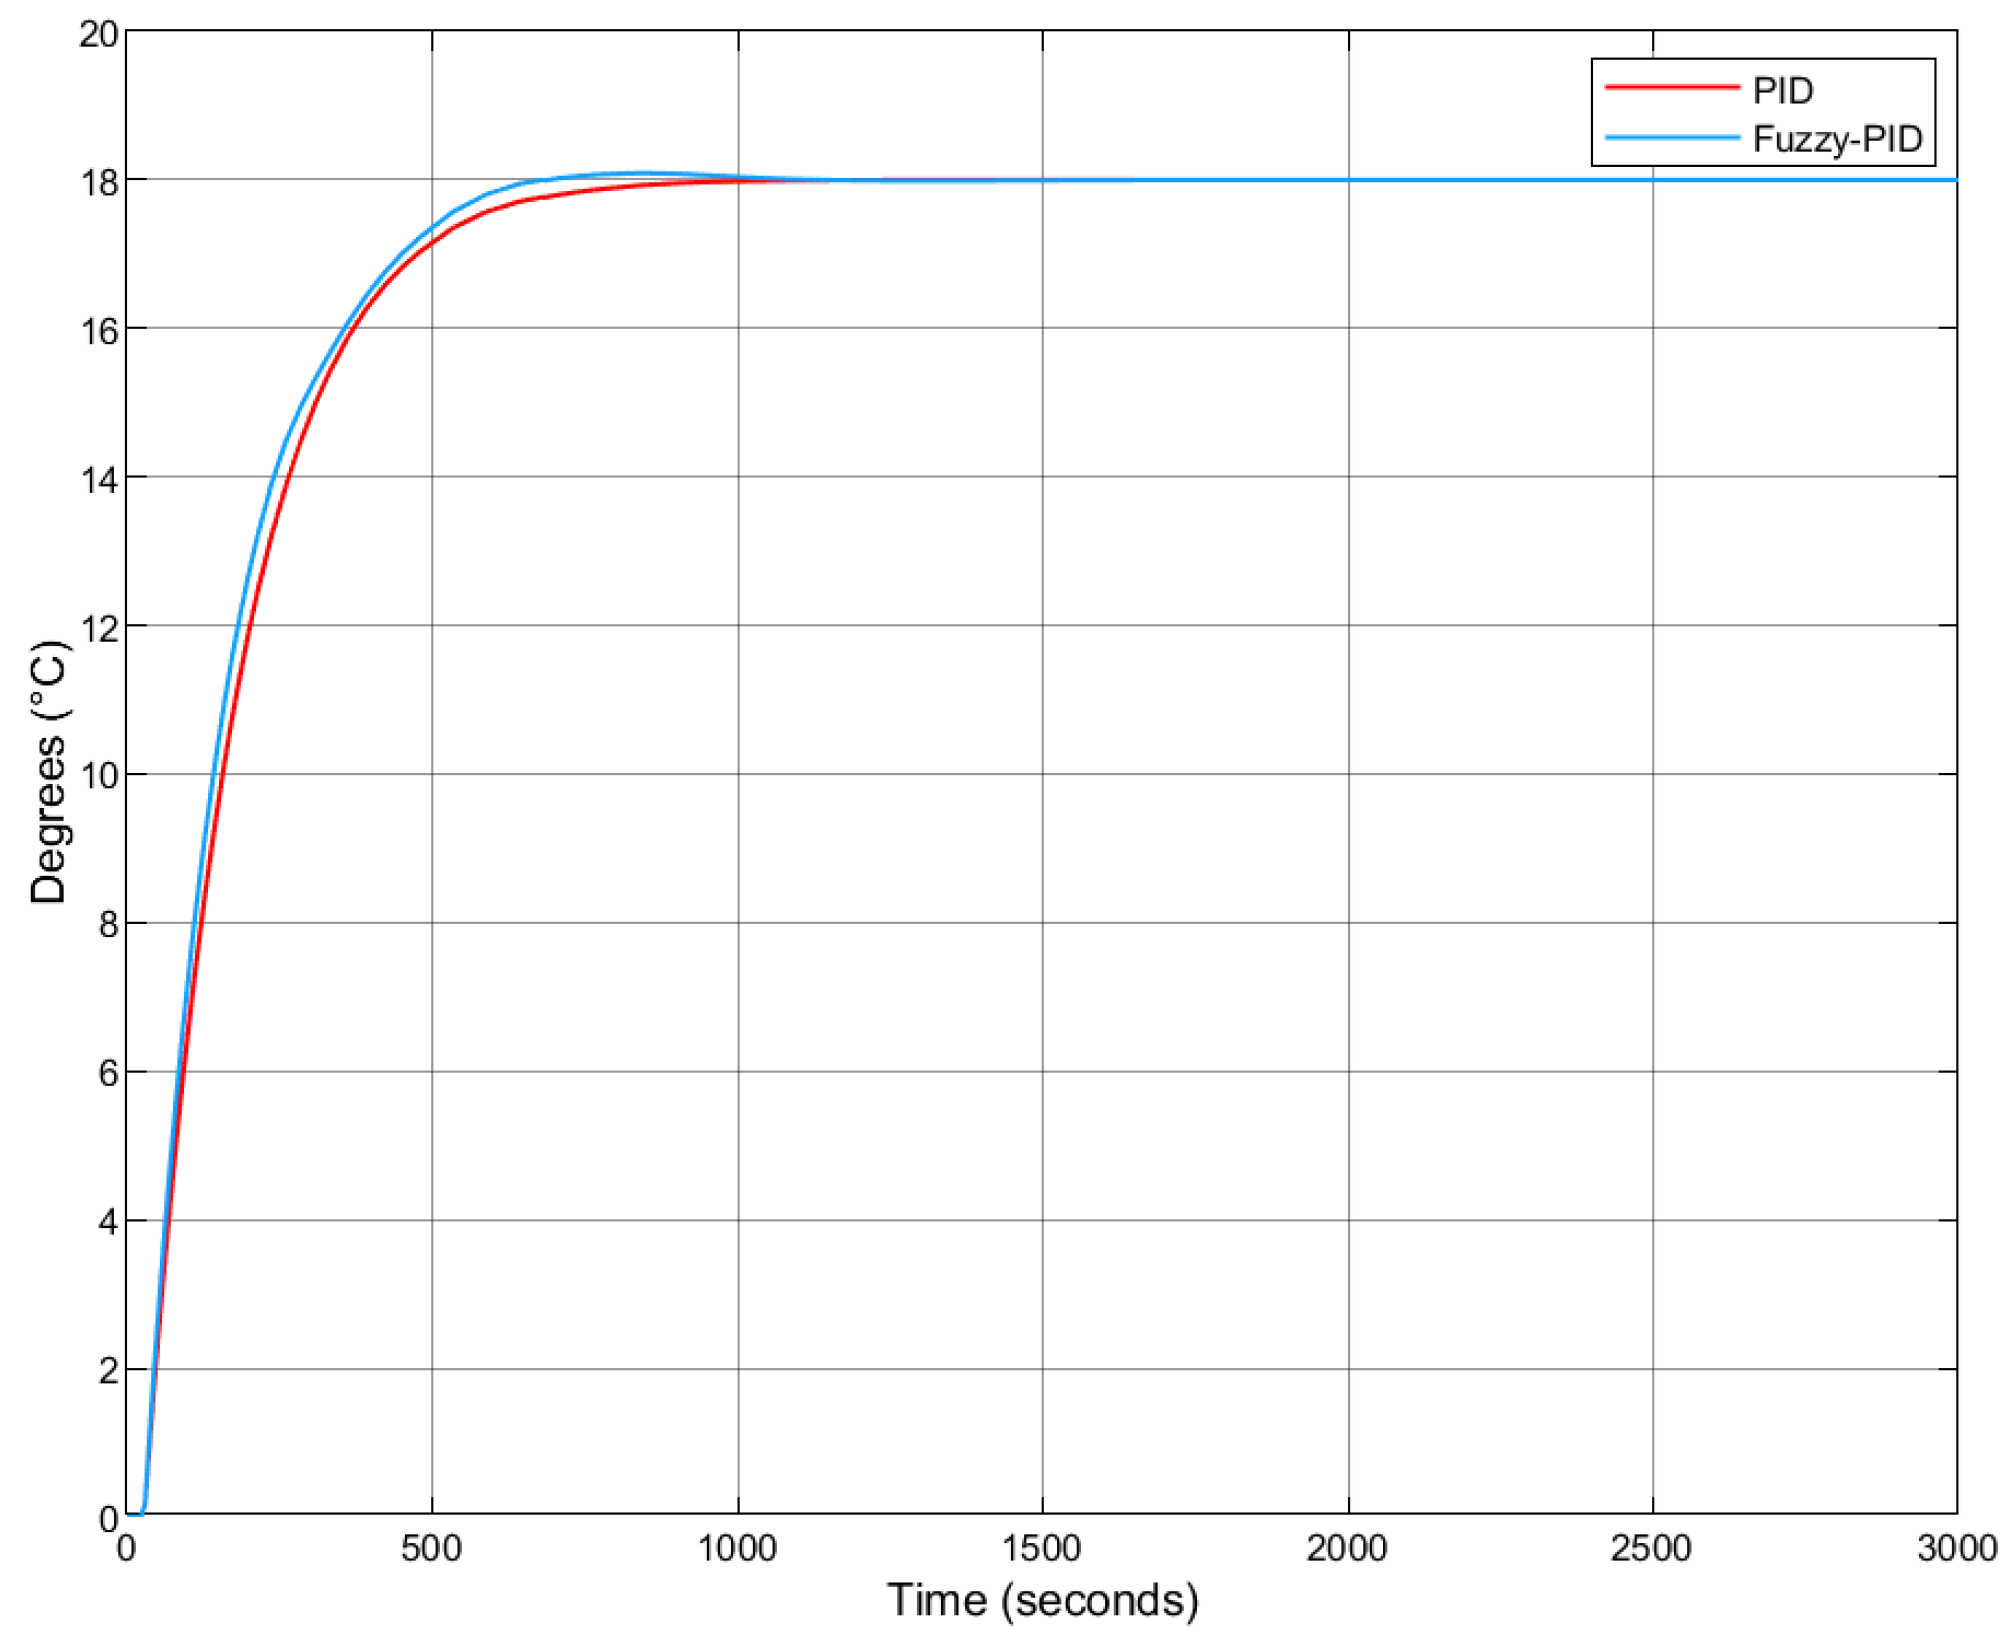
Figure 15.
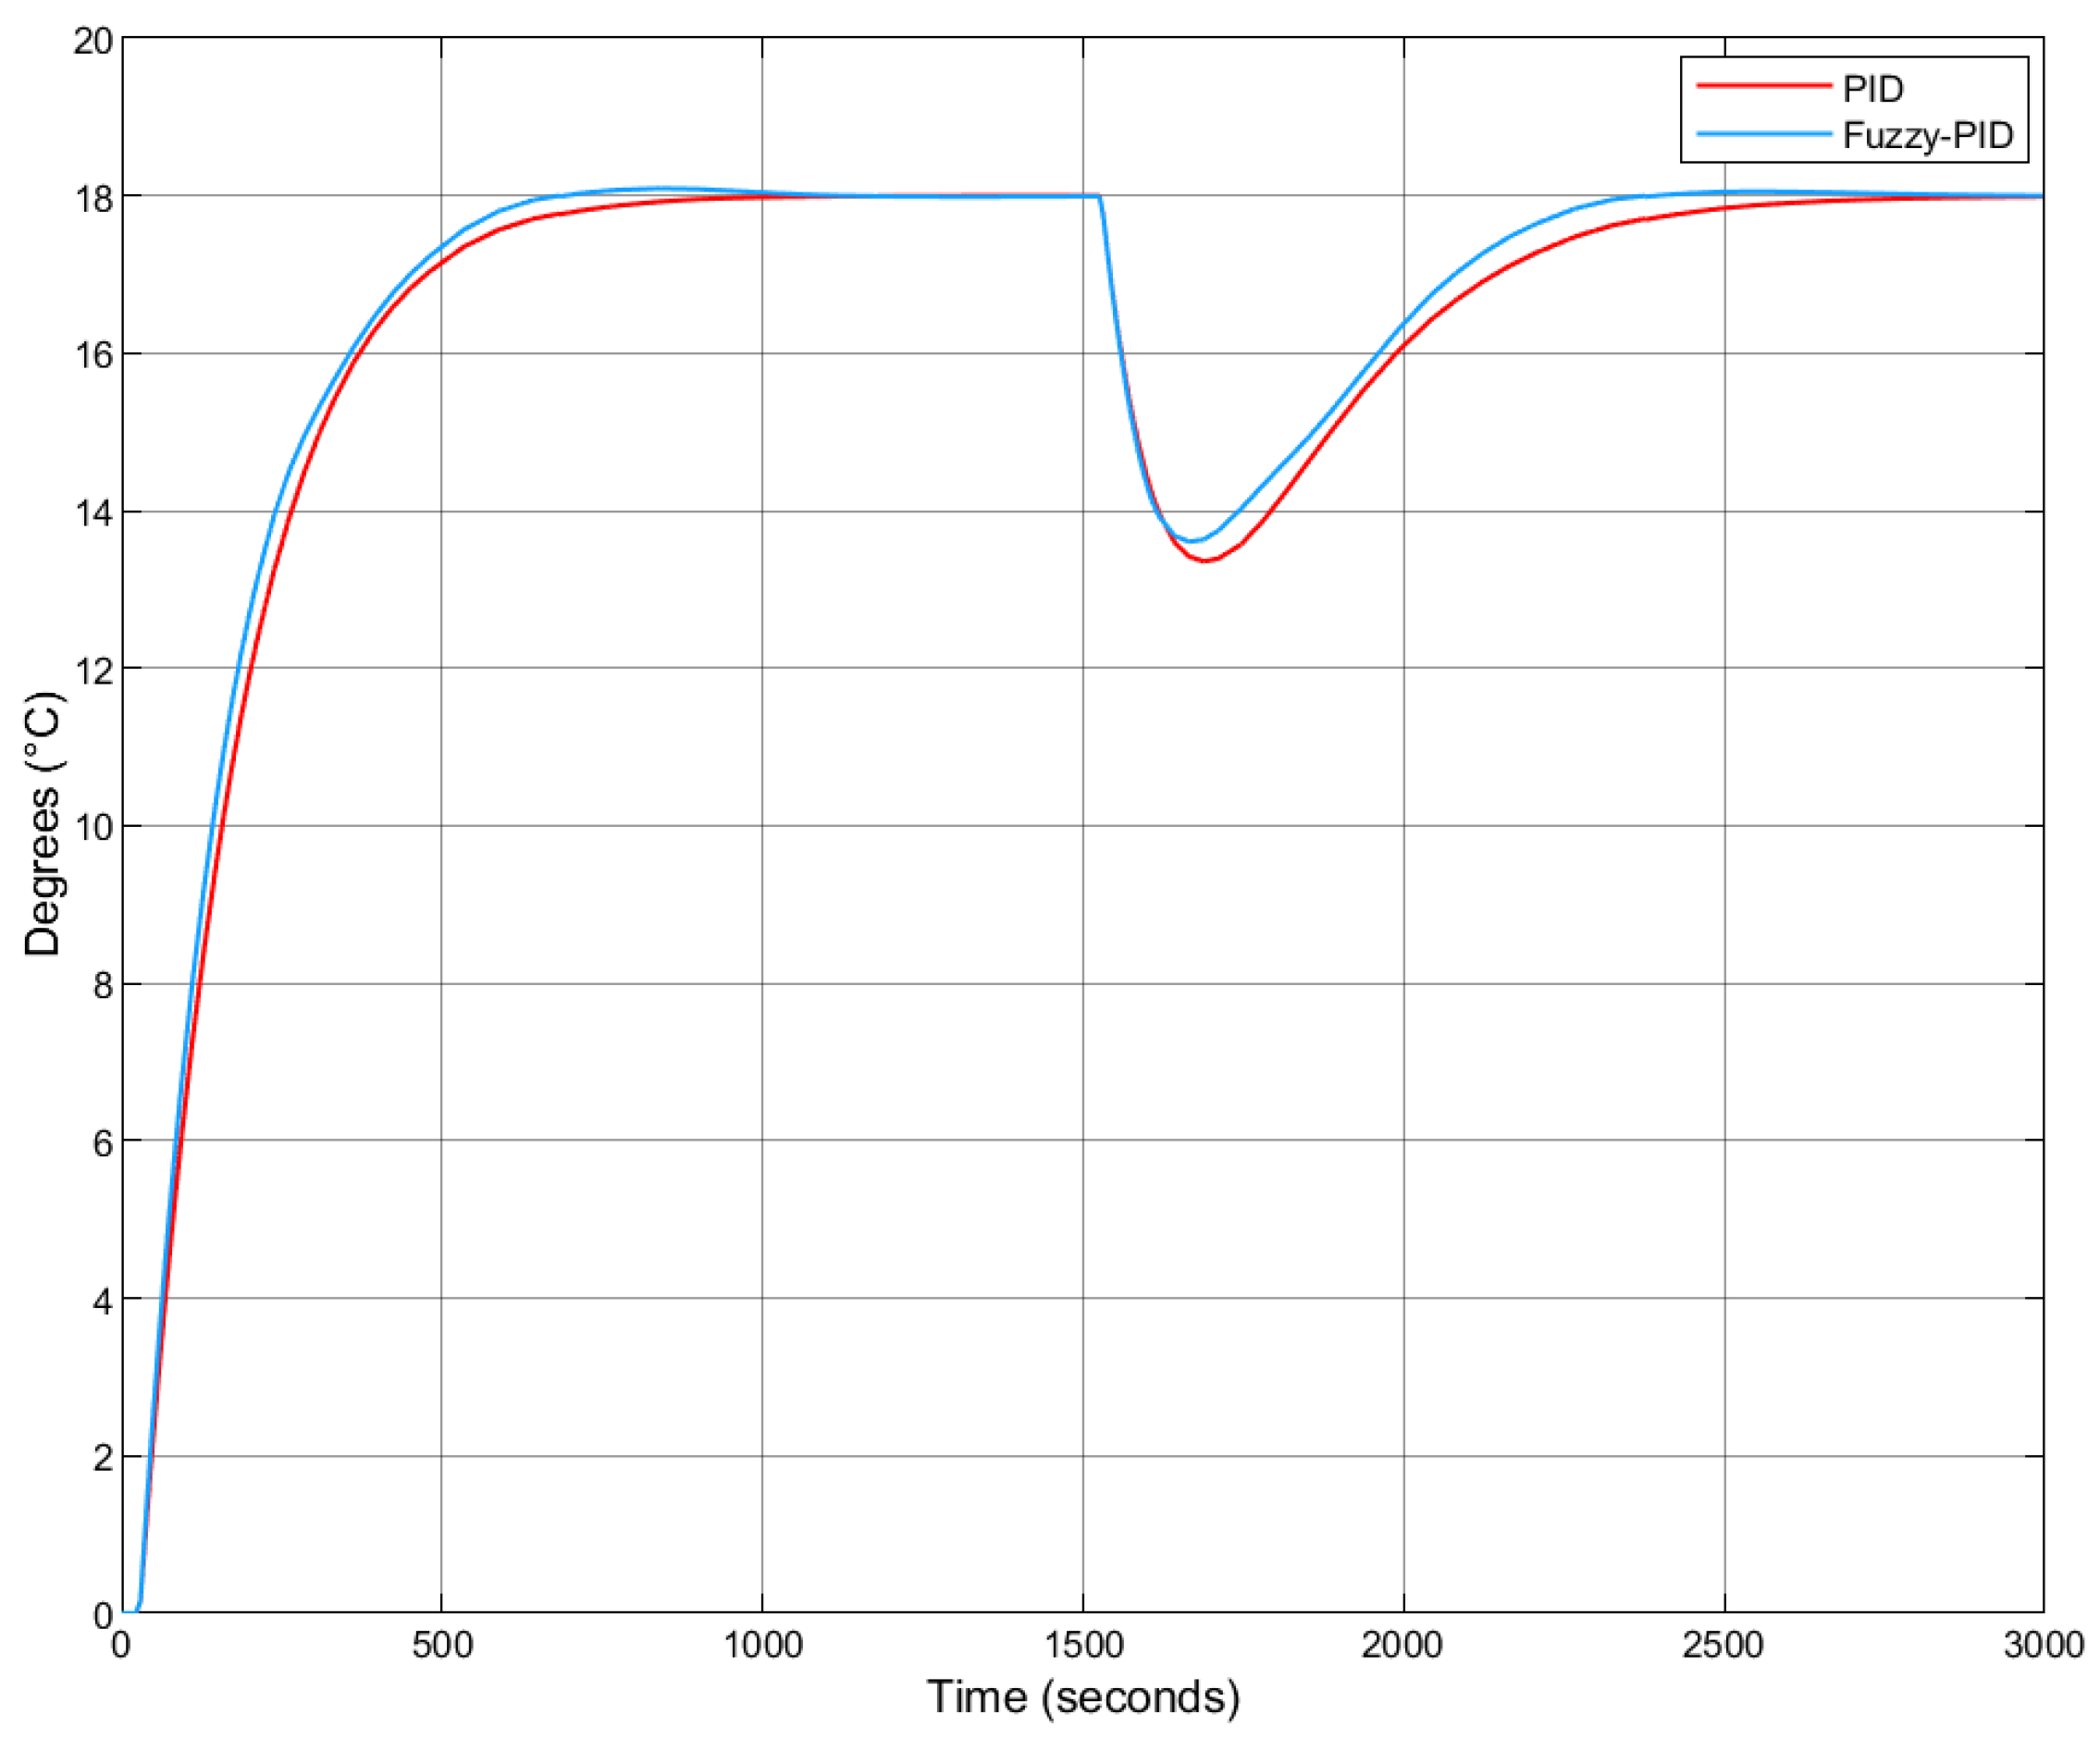
Step response comparison: Fuzzy-PID vs. PID.
Figure 15.
Step response comparison: Fuzzy-PID vs. PID.
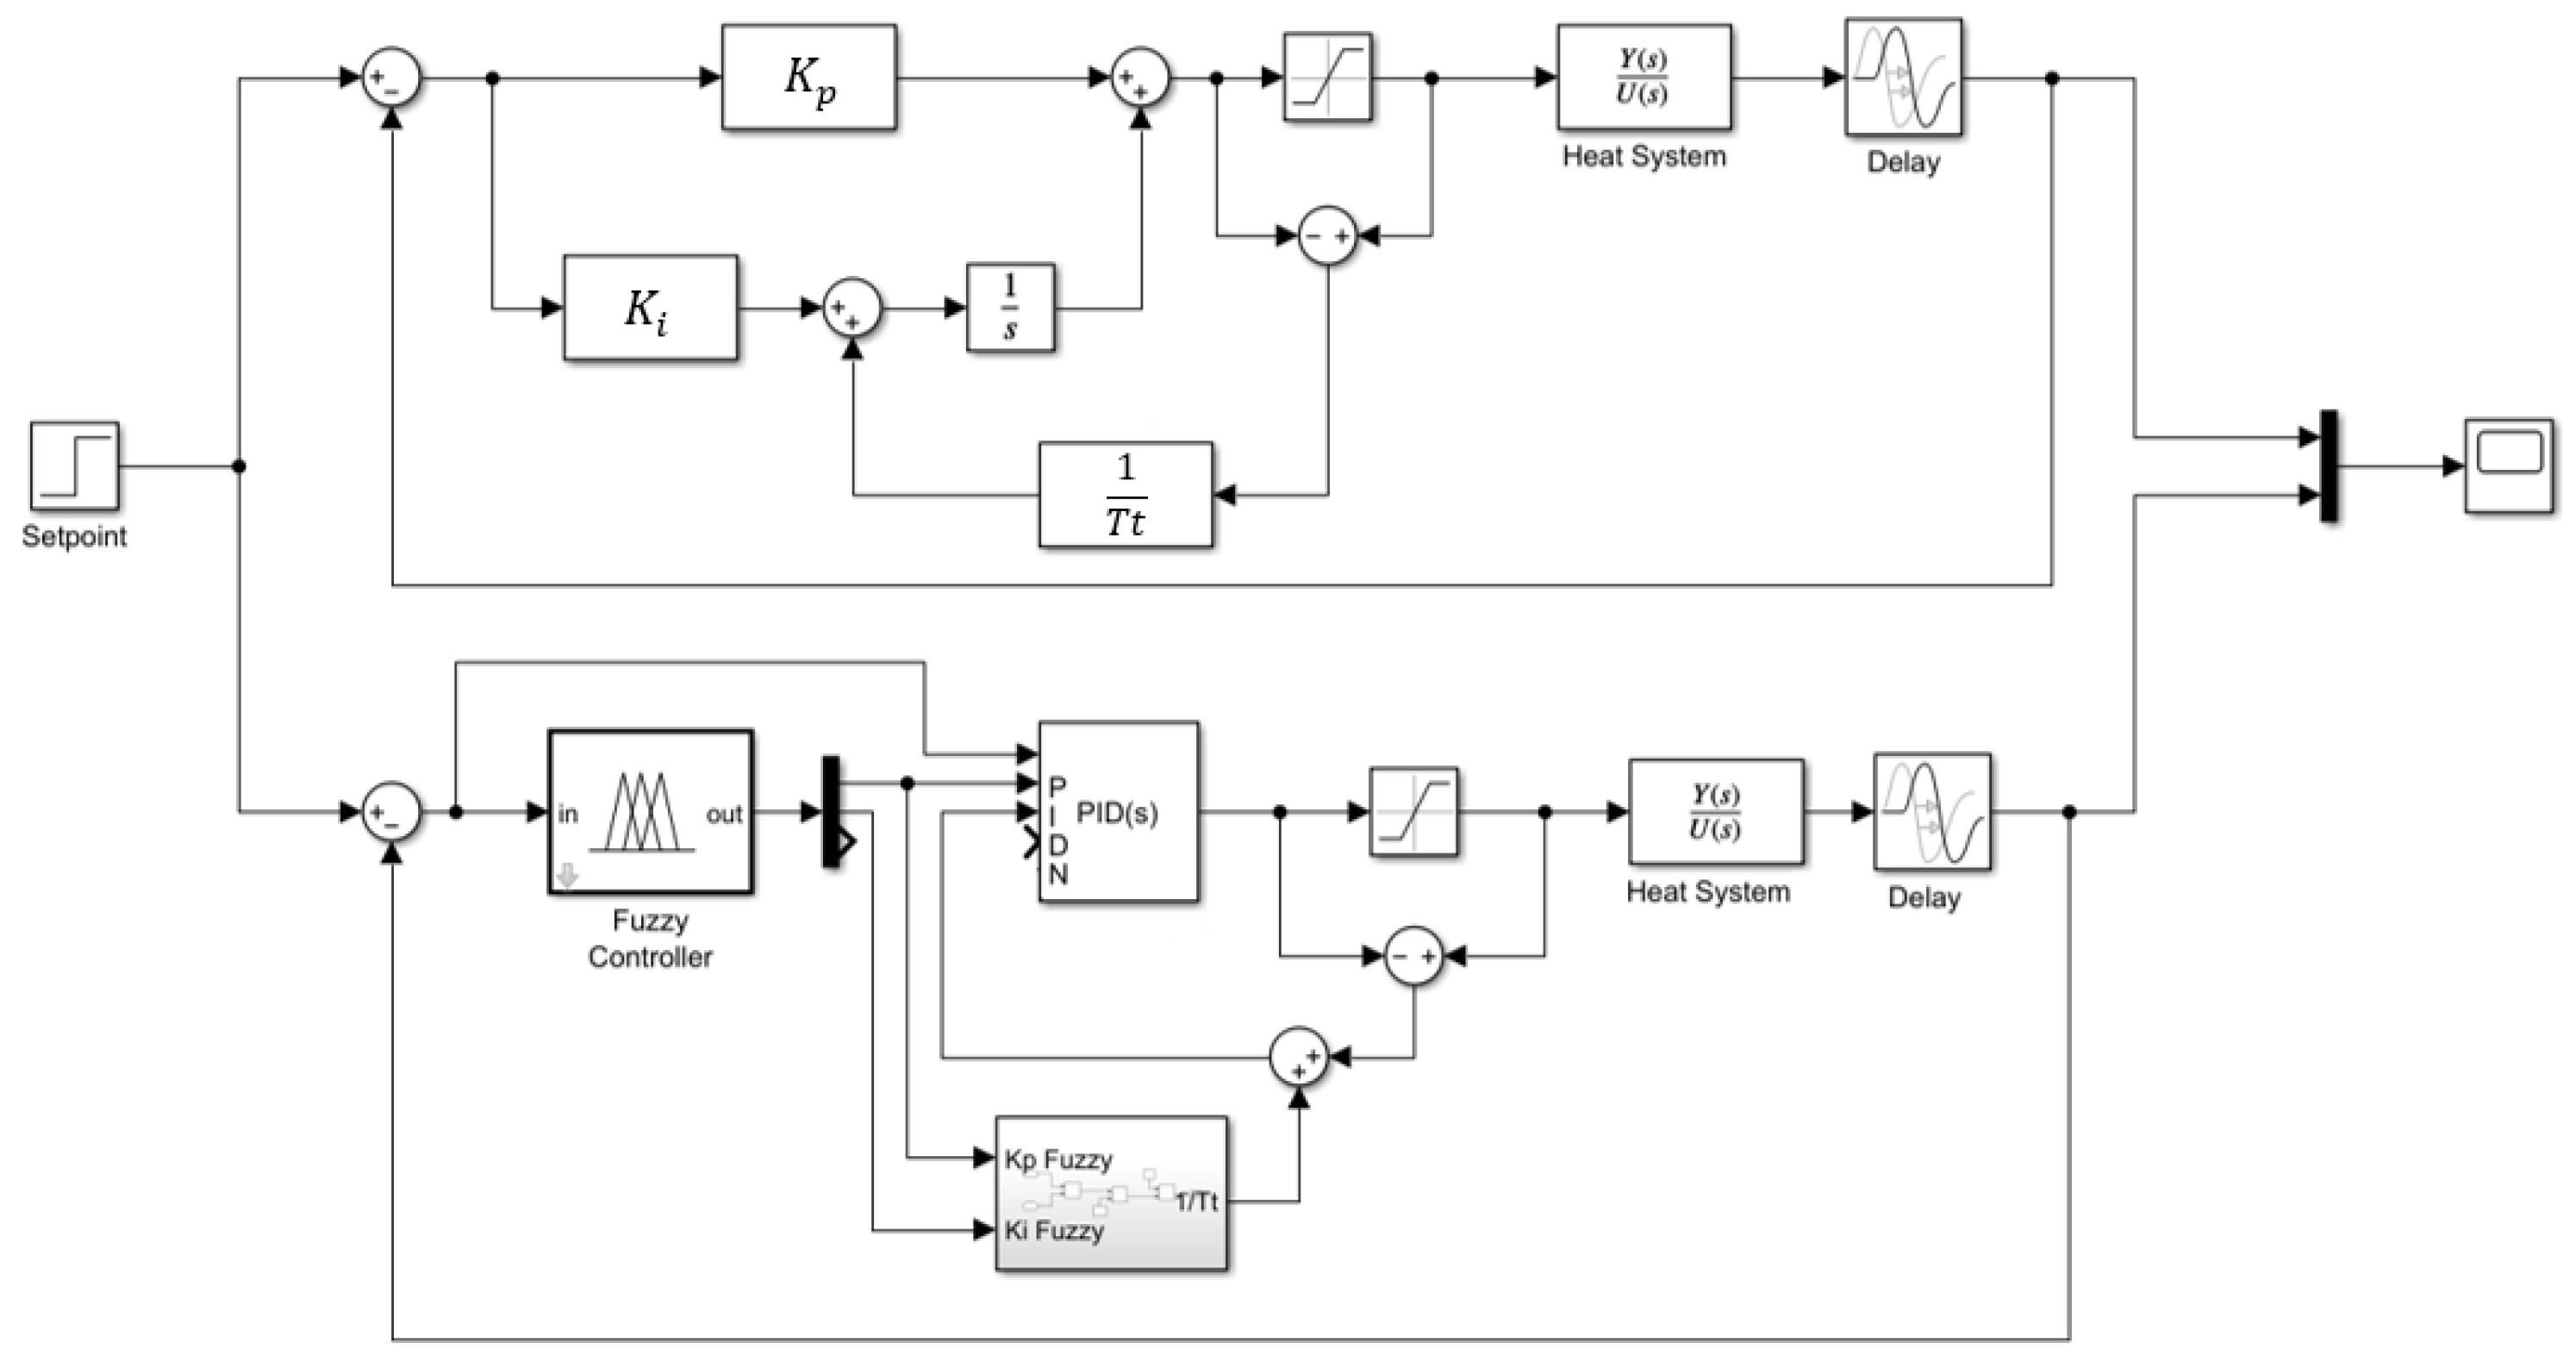
Figure 16.
Block diagram: Fuzzy-PI vs. PI with Anti-Windup implementation.
Figure 16.
Block diagram: Fuzzy-PI vs. PI with Anti-Windup implementation.
Figure 17.
Step response comparison: Fuzzy-PI vs. PI with Anti-Windup for different values—(a) , (b) , (c) .
Figure 17.
Step response comparison: Fuzzy-PI vs. PI with Anti-Windup for different values—(a) , (b) , (c) .
Figure 18.
Block diagram: Fuzzy-PI vs. PI with Smith Predictor.
Figure 18.
Block diagram: Fuzzy-PI vs. PI with Smith Predictor.
Figure 19.
Step response comparison: Fuzzy-PI vs. PI with Smith Predictor.
Figure 19.
Step response comparison: Fuzzy-PI vs. PI with Smith Predictor.
Figure 20.
Block diagram: Fuzzy-PID vs. PID with Smith Predictor.
Figure 20.
Block diagram: Fuzzy-PID vs. PID with Smith Predictor.
Figure 21.
Step response comparison: Fuzzy-PID vs. PID with Smith Predictor.
Figure 21.
Step response comparison: Fuzzy-PID vs. PID with Smith Predictor.
Figure 22.
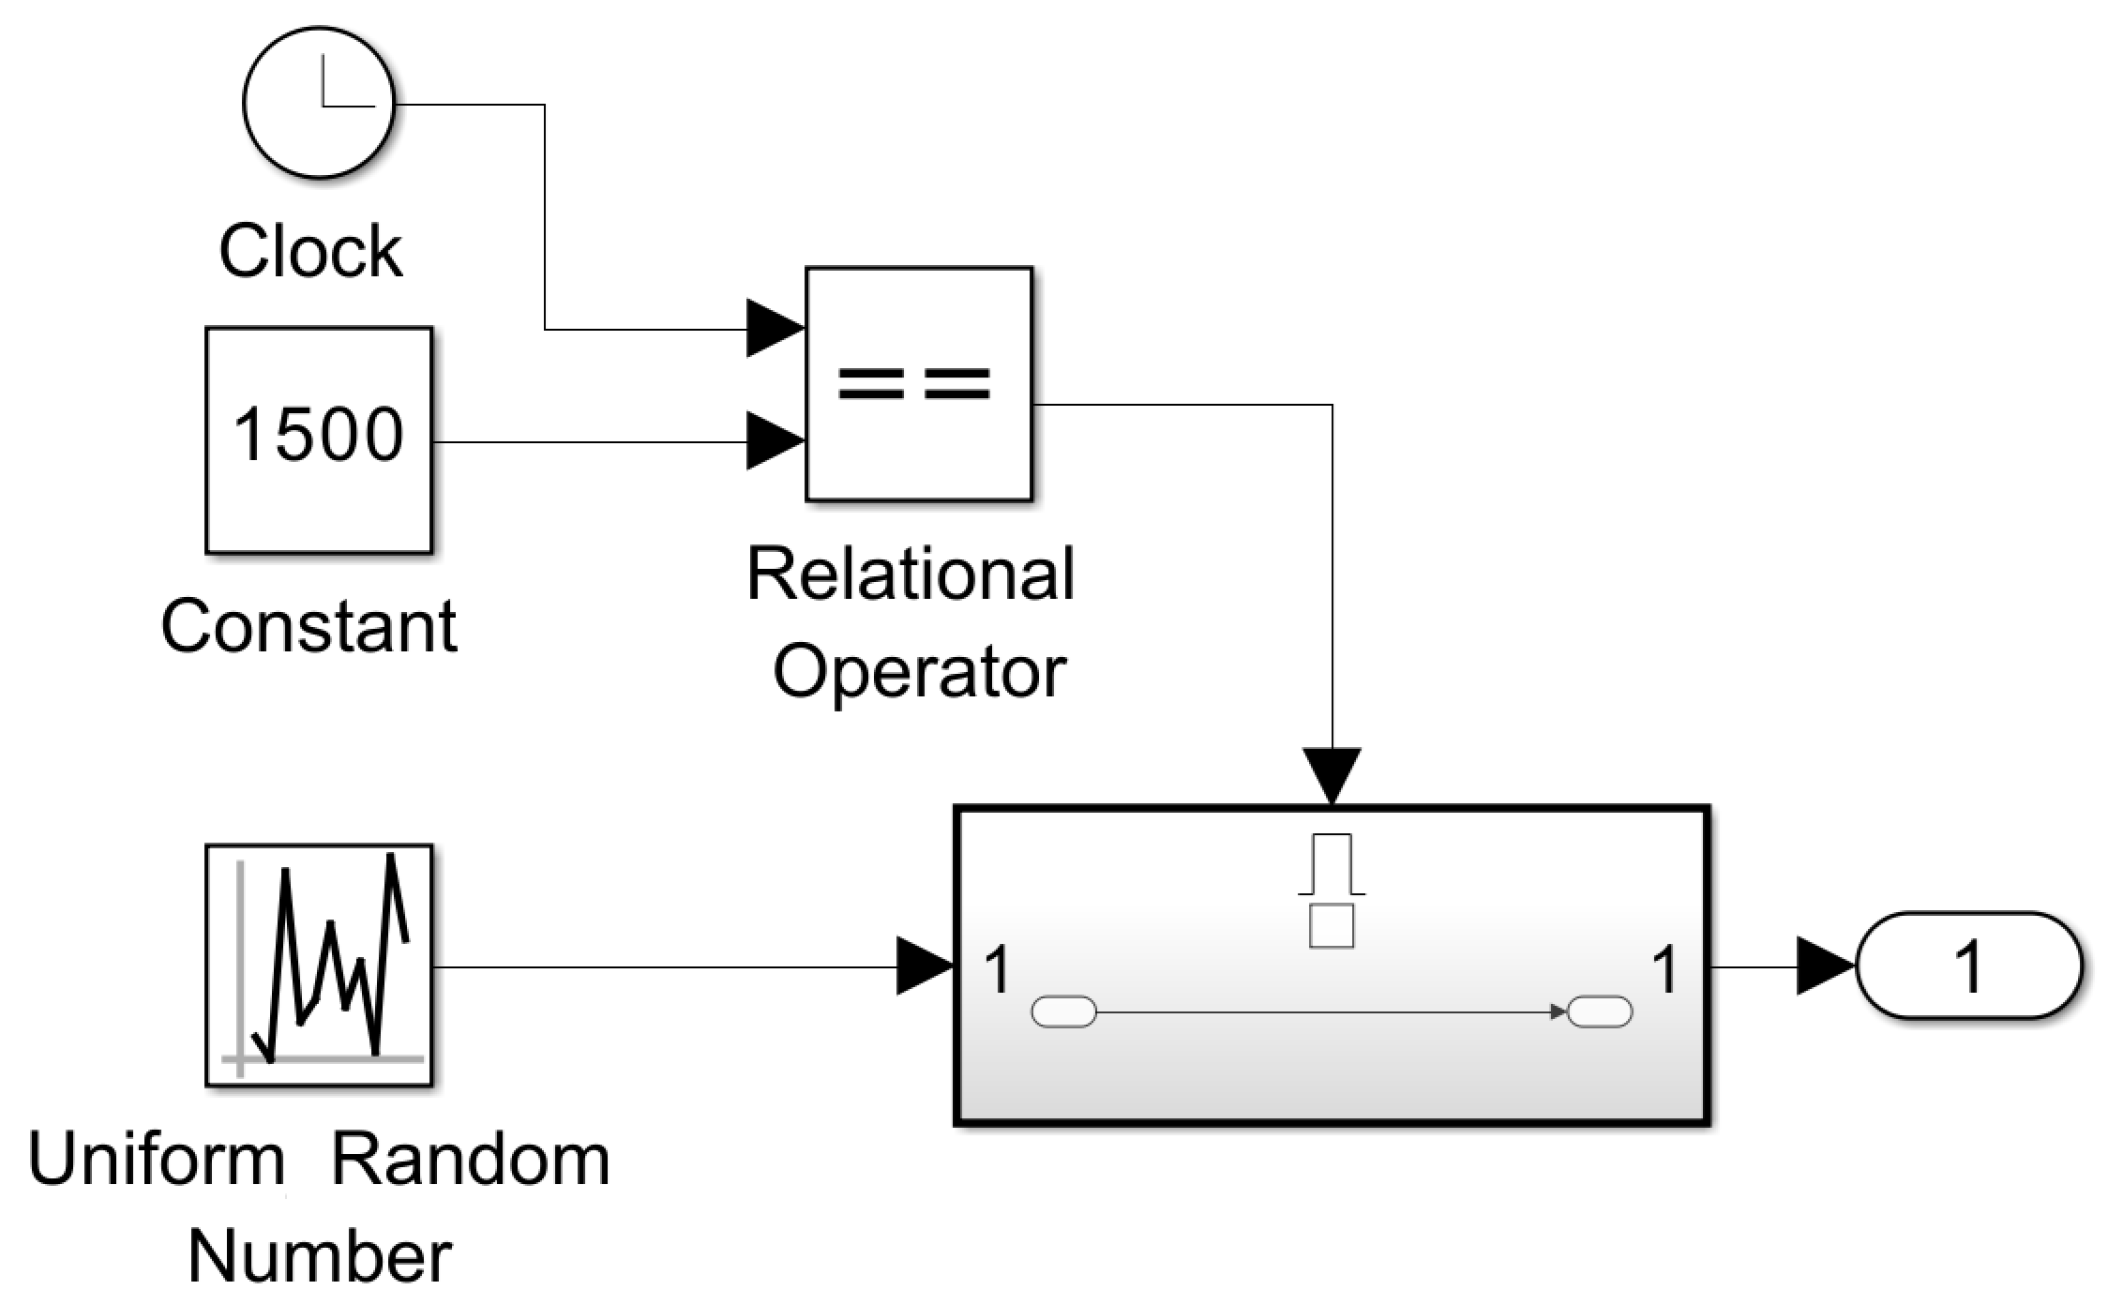
Noise model components.
Figure 22.
Noise model components.
Figure 23.
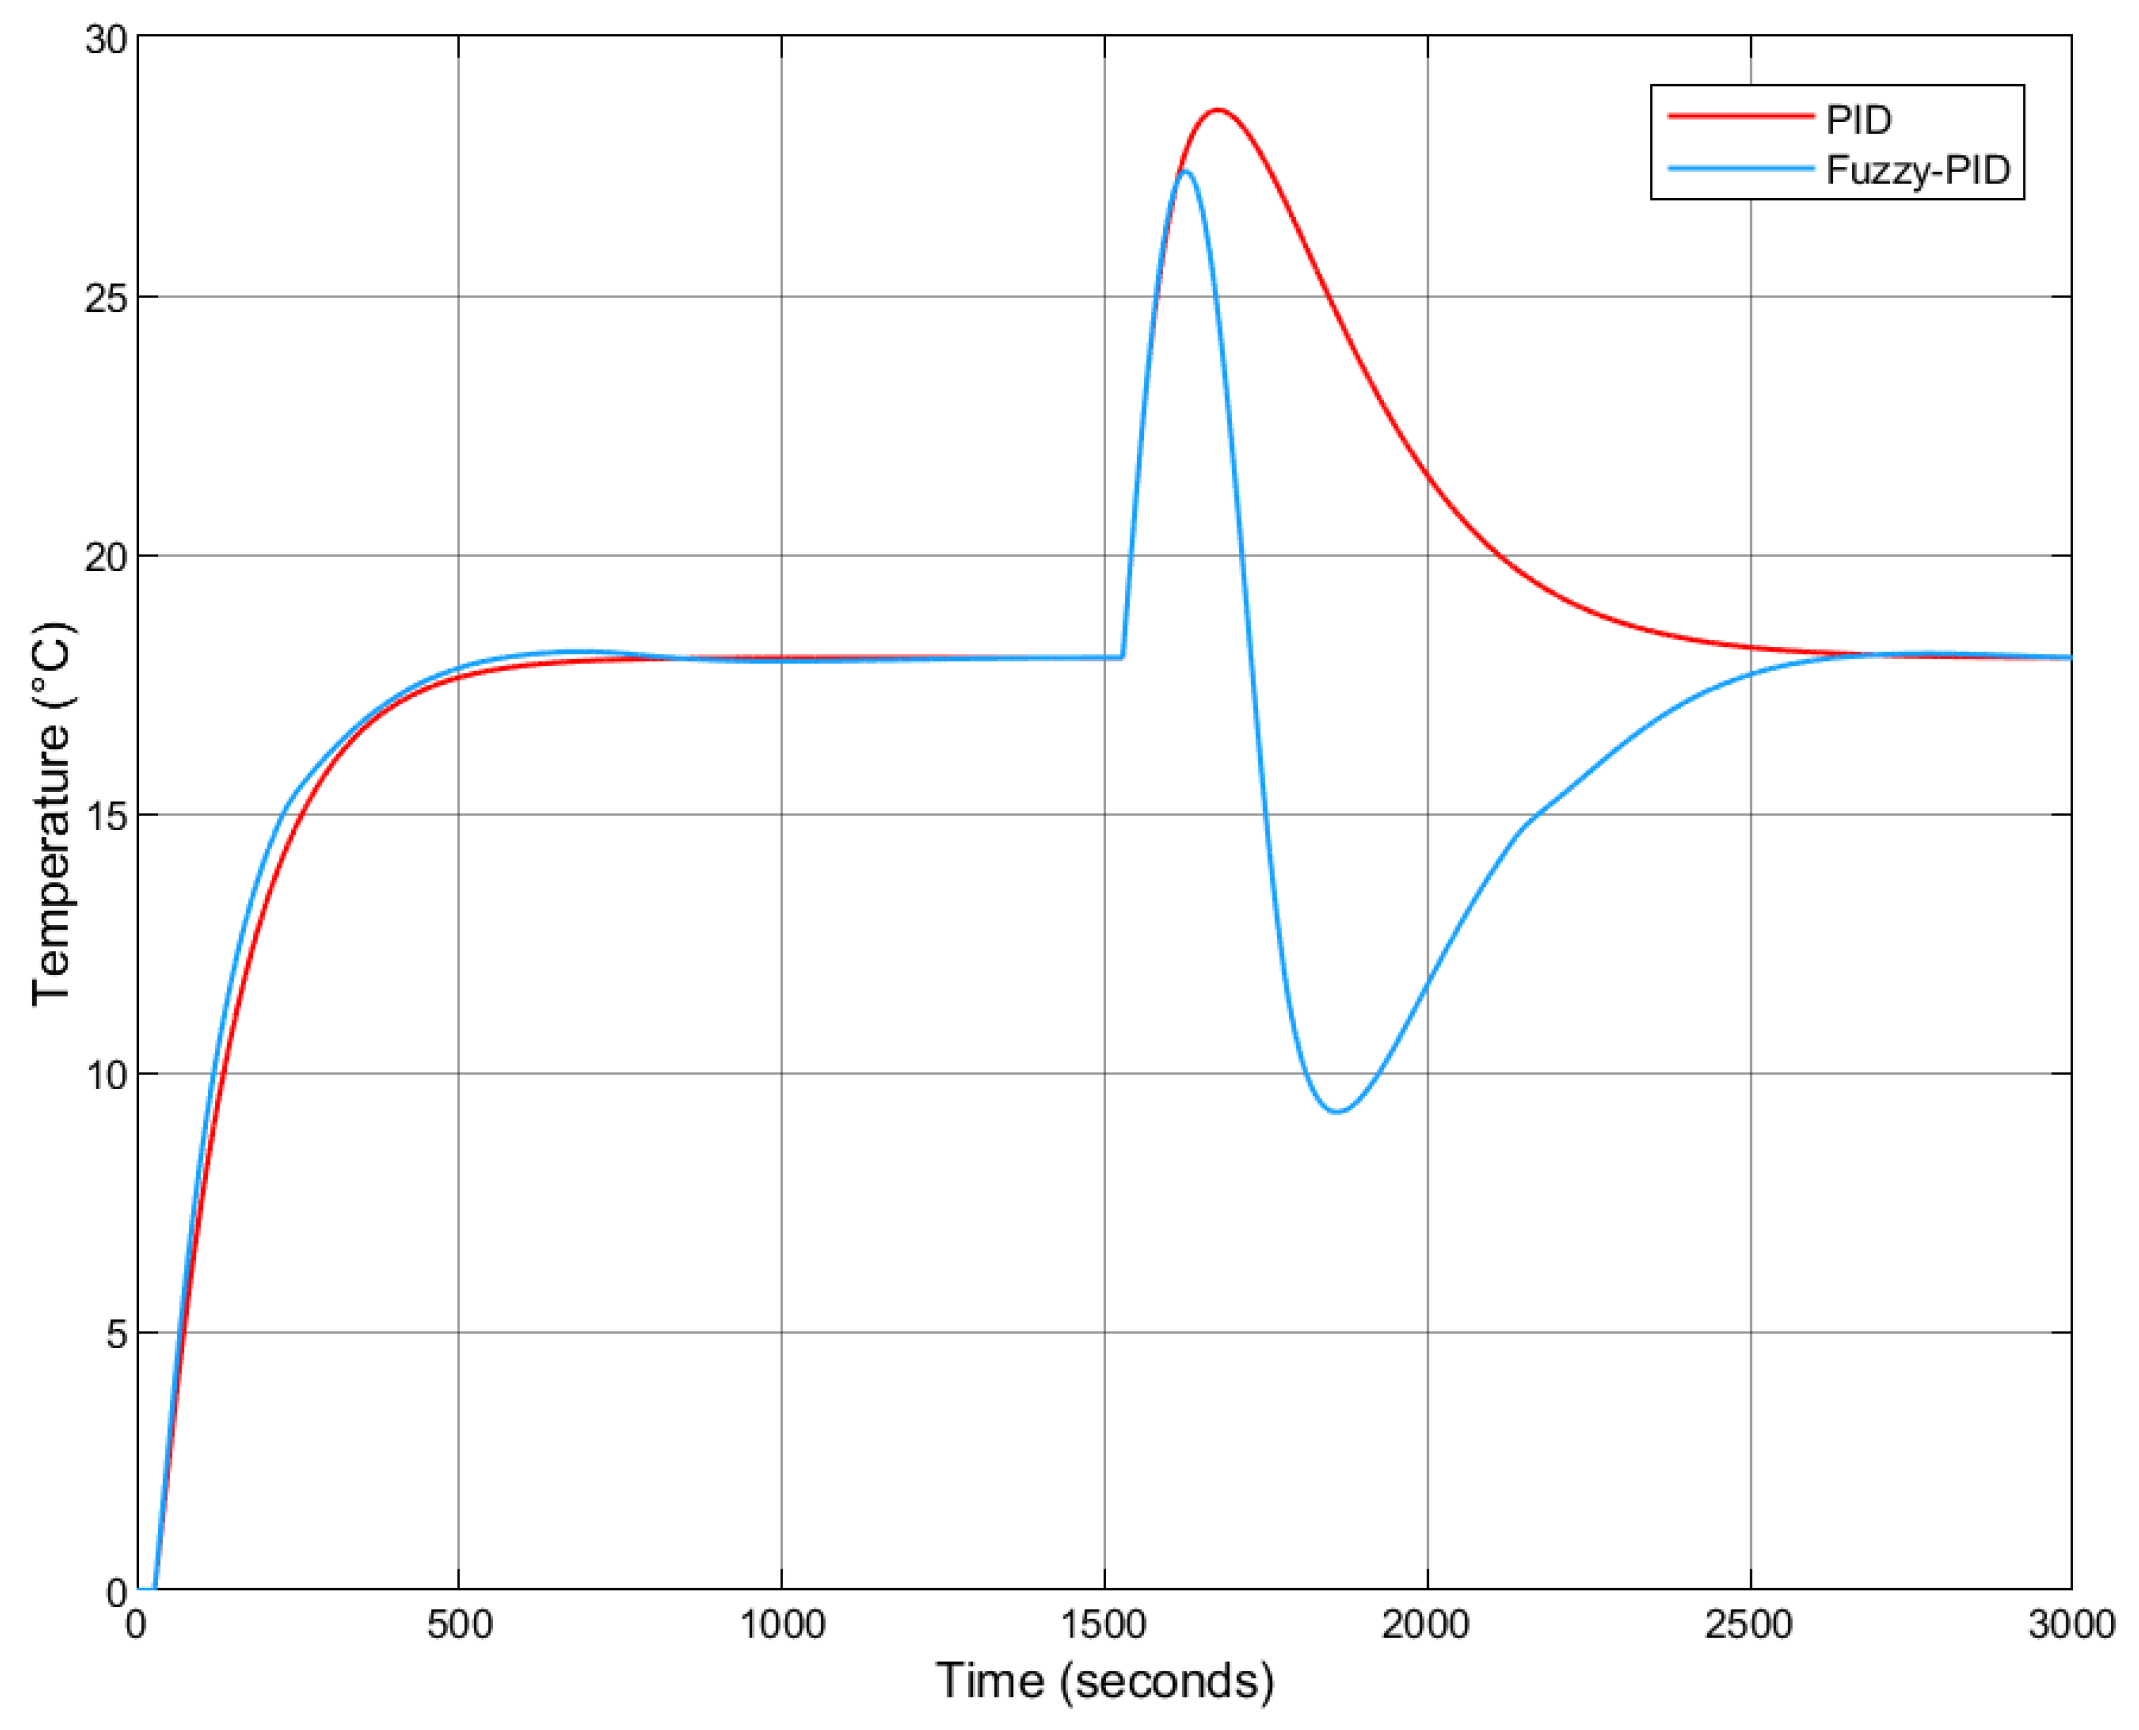
Fuzzy-PID vs. PID step response under warmer external temperatures (no Smith Predictor).
Figure 23.
Fuzzy-PID vs. PID step response under warmer external temperatures (no Smith Predictor).
Figure 24.
Fuzzy-PID vs. PID step response under colder external temperatures (no Smith Predictor).
Figure 24.
Fuzzy-PID vs. PID step response under colder external temperatures (no Smith Predictor).
Figure 25.
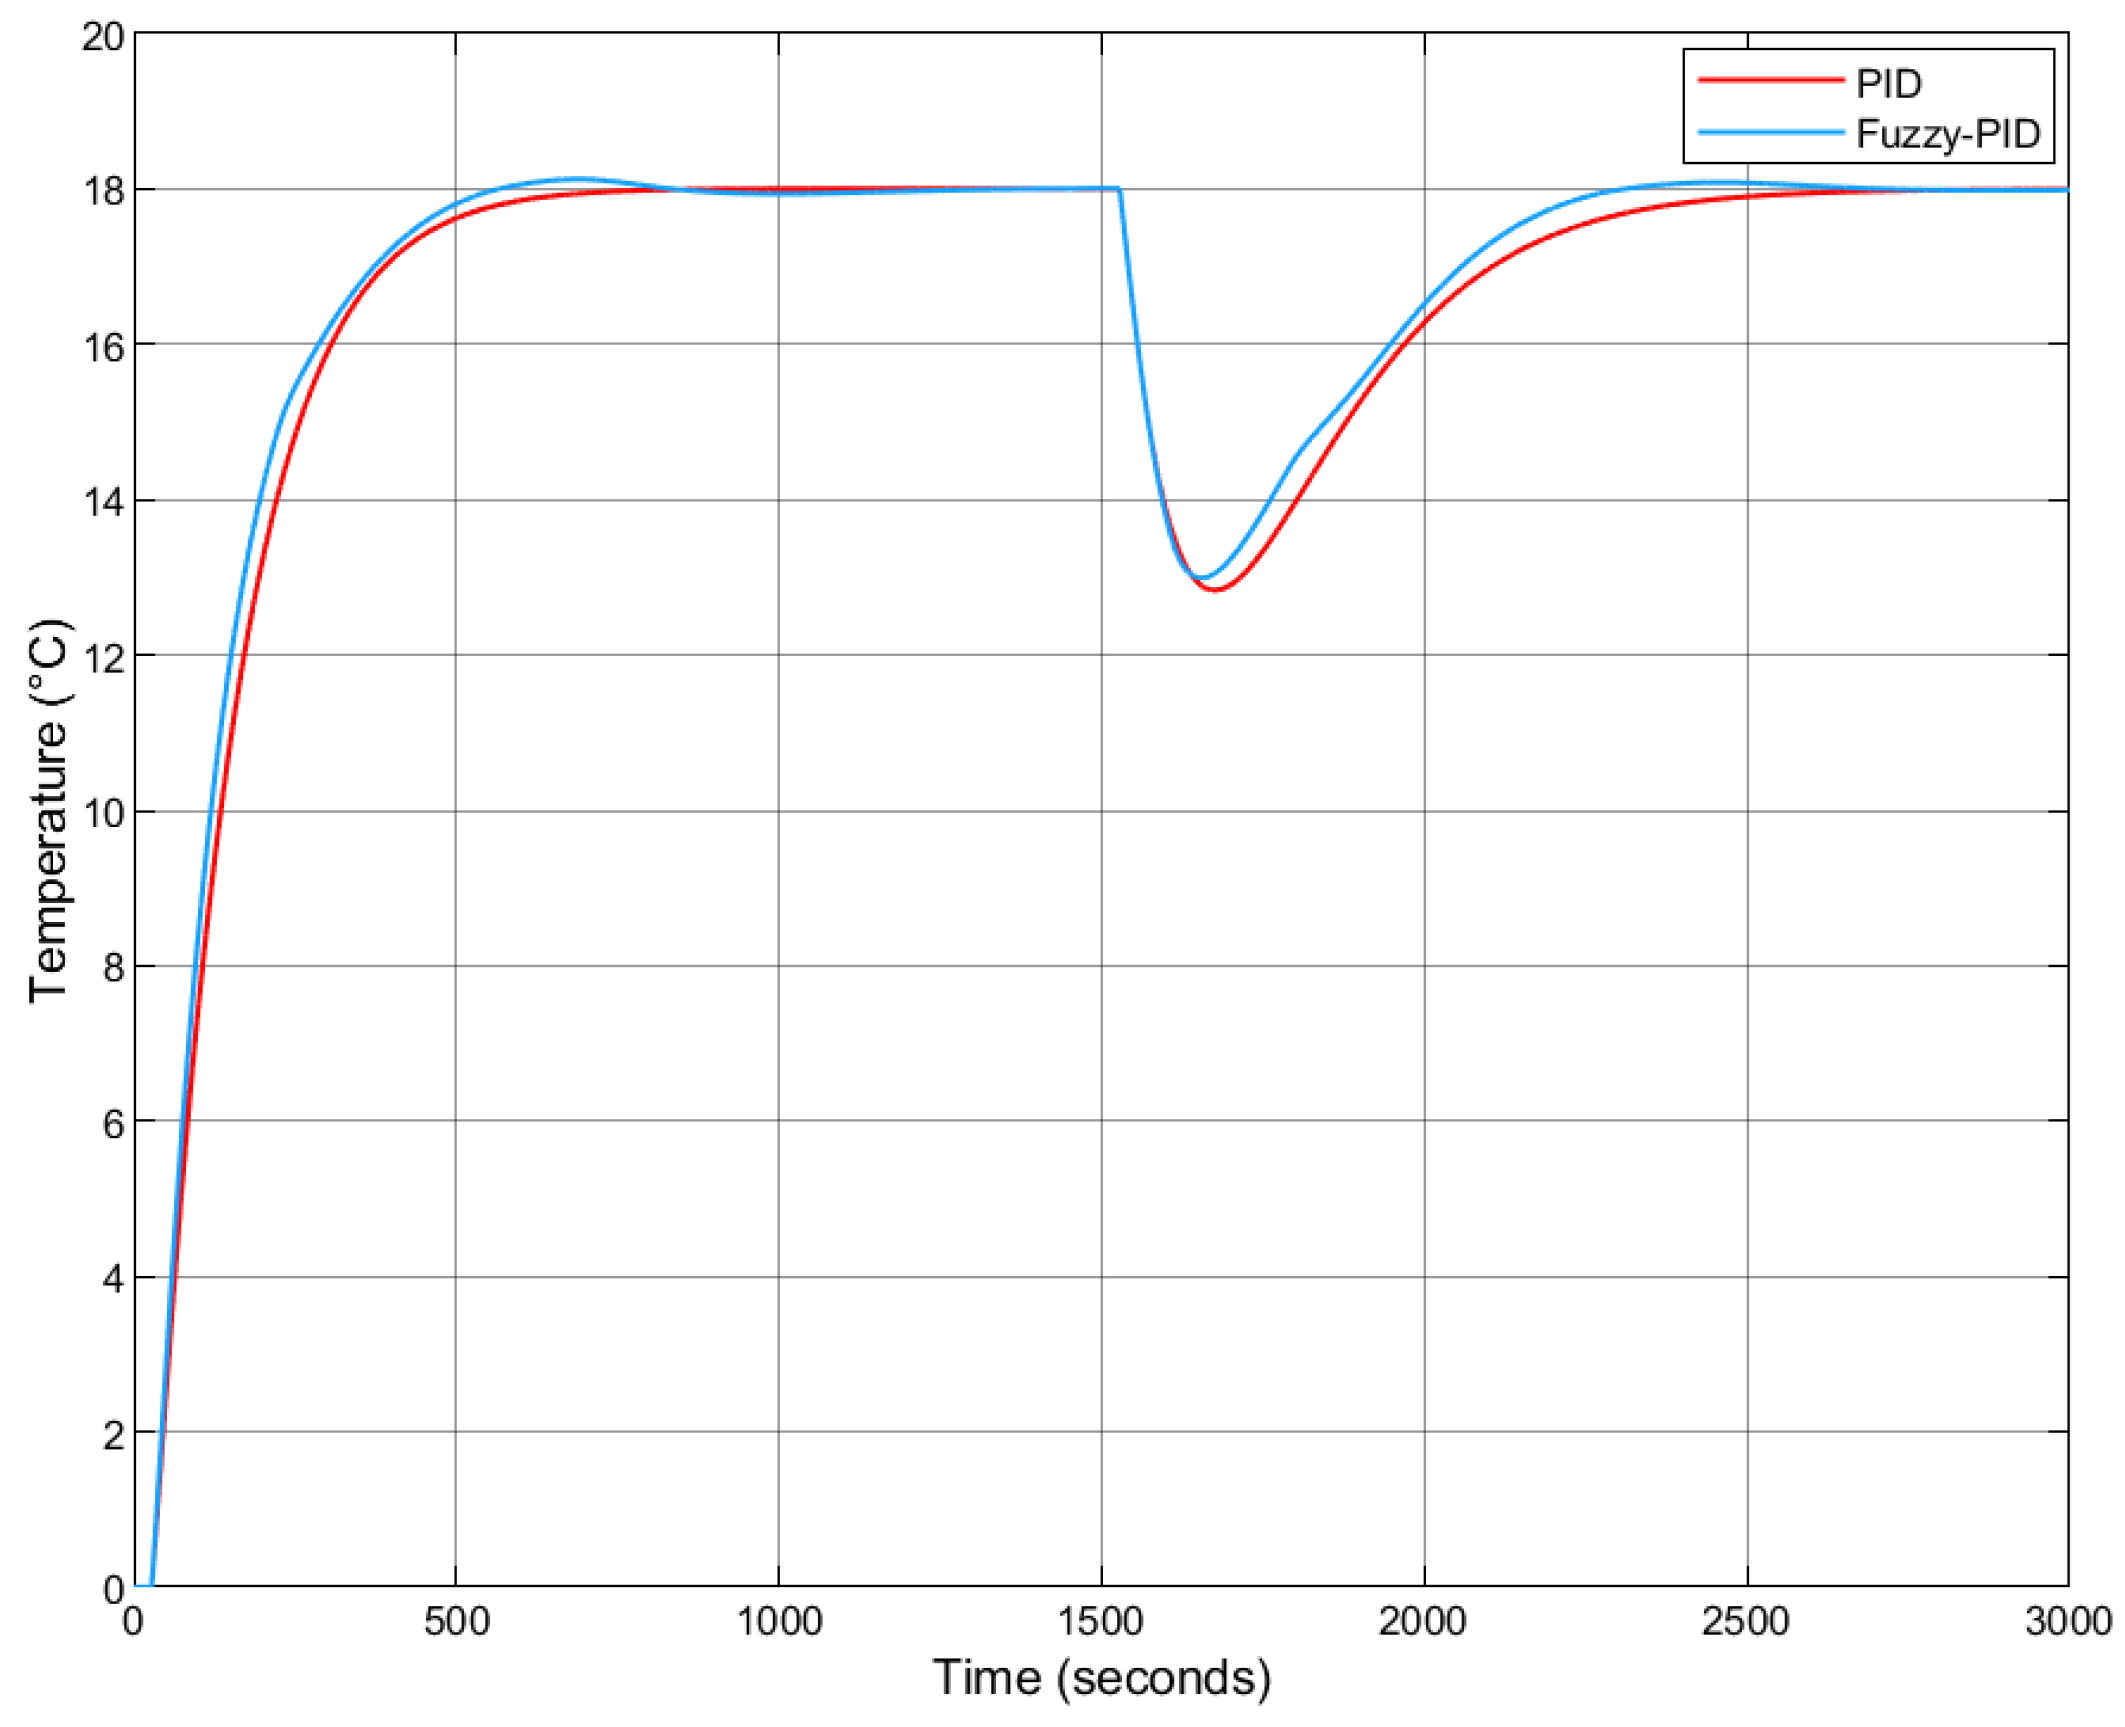
Fuzzy-PID vs. PID step response under warmer external temperatures (with Smith Predictor).
Figure 25.
Fuzzy-PID vs. PID step response under warmer external temperatures (with Smith Predictor).
Figure 26.
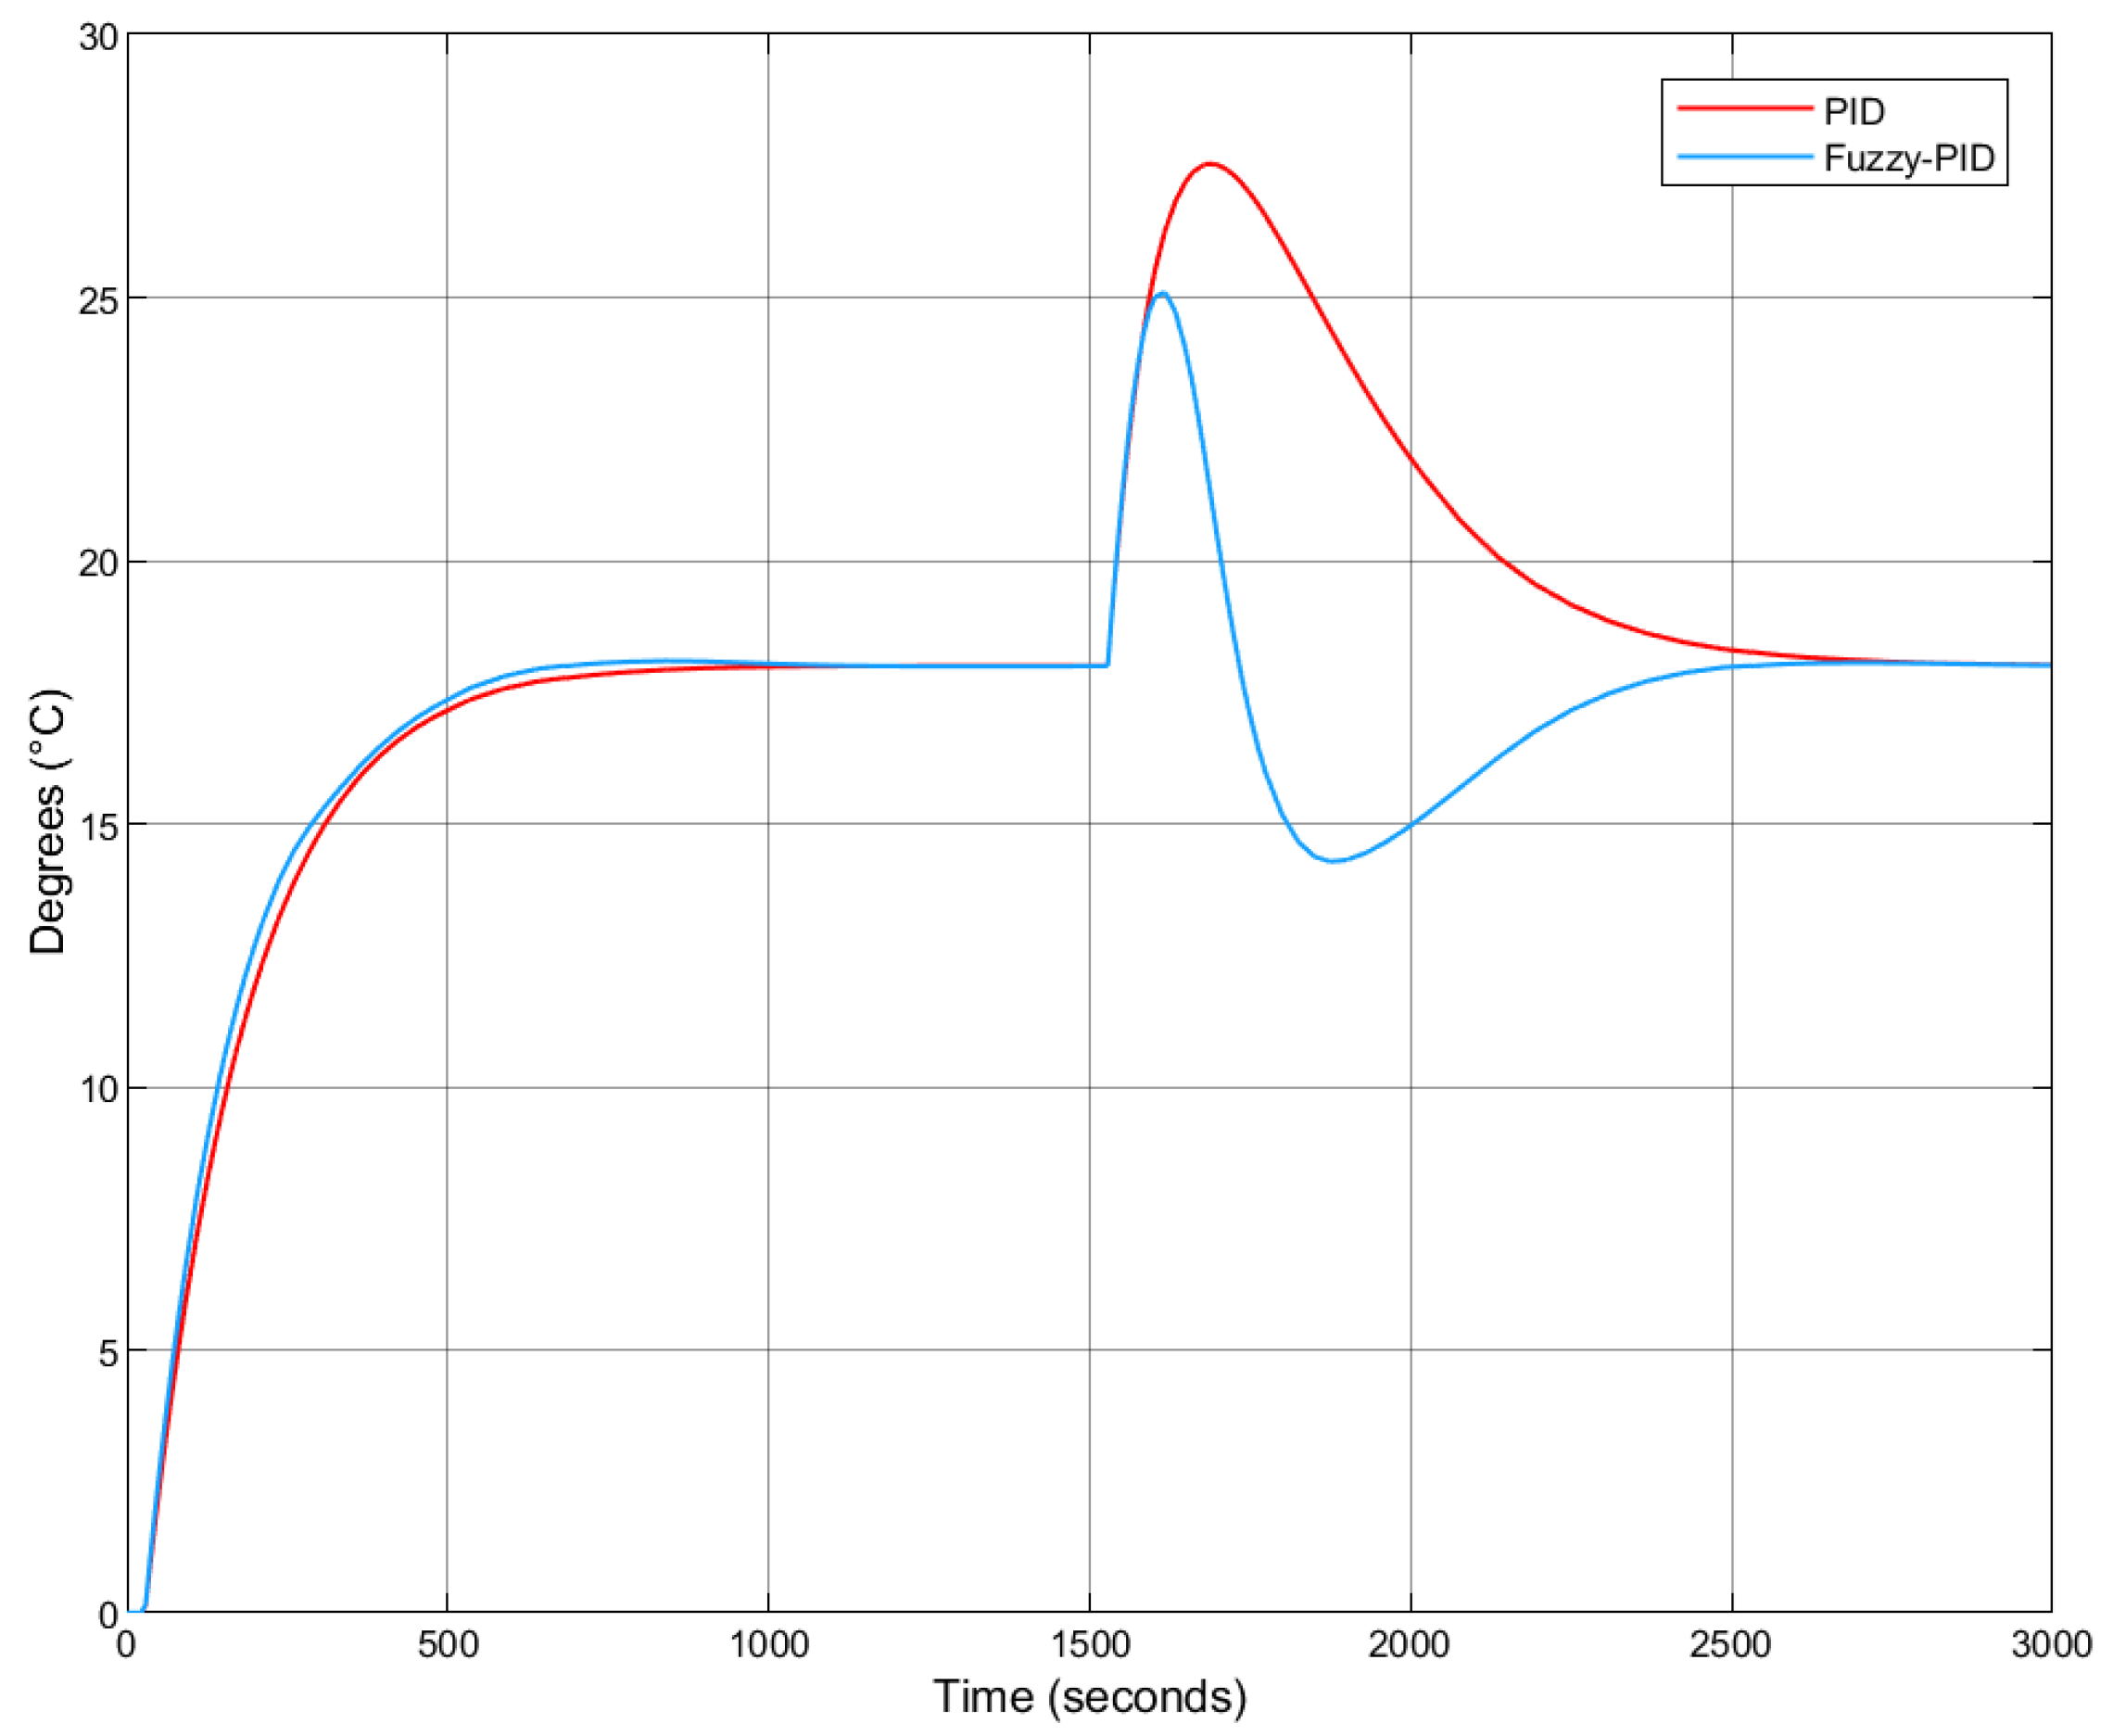
Fuzzy-PID vs. PID step response under colder external temperatures (with Smith Predictor).
Figure 26.
Fuzzy-PID vs. PID step response under colder external temperatures (with Smith Predictor).
Table 1.
Error input values.
Table 1.
Error input values.
| Name | Type | Parameters |
|---|
| NegativeLarge | Trapezoidal | [−10 −10 −6 −2] |
| NegativeSmall | Triangular | [−4 −2 0] |
| Zero | Triangular | [−0.1 0 0.1] |
| PositiveSmall | Triangular | [0 1.5 4] |
| PositiveLarge | Trapezoidal | [3 7 35 35] |
Table 2.
: Fuzzy-P output values.
Table 2.
: Fuzzy-P output values.
| Name | Type | Parameters |
|---|
| Low | Trapezoidal | [0.5 0.5 0.8 1.2] |
| Medium | Triangular | [1 1.5 2] |
| High | Trapezoidal | [1.8 2.2 2.5 2.5] |
Table 3.
: Fuzzy-PD output values.
Table 3.
: Fuzzy-PD output values.
| Name | Type | Parameters |
|---|
| Low | Trapezoidal | [0.1 0.1 0.25 0.45] |
| Medium | Triangular | [0.35 0.5 0.7] |
| High | Trapezoidal | [0.6 0.85 1 1.5] |
Table 4.
: Fuzzy-PI output values.
Table 4.
: Fuzzy-PI output values.
| Name | Type | Parameters |
|---|
| Low | Triangular | [0.001 0.01 0.03] |
| Medium | Triangular | [0.025 0.05 0.075] |
| High | Triangular | [0.06 0.085 0.1] |
Table 5.
Time metrics comparison between Fuzzy-PI and PI controllers.
Table 5.
Time metrics comparison between Fuzzy-PI and PI controllers.
| Controller | Rise Time () [s] | Settling Time () [s] | Overshoot (%) | Steady-State Error () |
|---|
| Fuzzy-PI | 263.6628 | 465.6549 | 0.7363 | 0 |
| PI | 281.7529 | 506.7102 | 0.0094 | 0 |
Table 6.
Performance metric comparison between Fuzzy-PI and PI controllers.
Table 6.
Performance metric comparison between Fuzzy-PI and PI controllers.
| Type | ISE | IAE | ITSE | ITAE |
|---|
| Fuzzy-PI | | | | |
| PI | | | | |
Table 7.
Time metrics comparison between Fuzzy-PID and PID controllers.
Table 7.
Time metrics comparison between Fuzzy-PID and PID controllers.
| Controller | Rise Time () [s] | Settling Time () [s] | Overshoot (%) | Steady-State Error () |
|---|
| Fuzzy-PID | 259.3701 | 462.6557 | 0.6933 | 0 |
| PID | 274.5492 | 504.8539 | 0.0099 | 0 |
Table 8.
Performance metric comparison between Fuzzy-PID and PID controllers.
Table 8.
Performance metric comparison between Fuzzy-PID and PID controllers.
| Type | ISE | IAE | ITSE | ITAE |
|---|
| Fuzzy-PID | | | | |
| PID | | | | |
Table 9.
Time metrics comparison between Fuzzy-PI and PI controllers with Smith Predictor implementation.
Table 9.
Time metrics comparison between Fuzzy-PI and PI controllers with Smith Predictor implementation.
| Controller | Rise Time () [s] | Settling Time () [s] | Overshoot (%) | Steady-State Error () |
|---|
| Fuzzy-PI | 338.8536 | 540.2515 | 0.5379 | 0 |
| PI | 345.5608 | 613.4476 | | 0 |
Table 10.
Performance metrics comparison between Fuzzy-PI and PI controllers with and without Smith Predictor.
Table 10.
Performance metrics comparison between Fuzzy-PI and PI controllers with and without Smith Predictor.
| Performance Metrics | With Smith Predictor | Without Smith Predictor |
|---|
| Fuzzy-PI | PI | Fuzzy-PI | PI |
|---|
| ISE | | | | |
| IAE | | | | |
| ITSE | | | | |
| ITAE | | | | |
Table 11.
Time metrics comparison between Fuzzy-PID and PID controllers with Smith Predictor implementation.
Table 11.
Time metrics comparison between Fuzzy-PID and PID controllers with Smith Predictor implementation.
| Controller | Rise Time () [s] | Settling Time () [s] | Overshoot (%) | Steady-State Error () |
|---|
| Fuzzy-PID | 329.2864 | 549.9743 | 0.5102 | 0 |
| PID | 341.9797 | 616.1027 | 0.0027 | 0 |
Table 12.
Performance metrics comparison between Fuzzy-PID and PID controllers with and without Smith Predictor.
Table 12.
Performance metrics comparison between Fuzzy-PID and PID controllers with and without Smith Predictor.
| Performance Metrics | With Smith Predictor | Without Smith Predictor |
|---|
| Fuzzy-PID | PID | Fuzzy-PID | PID |
|---|
| ISE | | | | |
| IAE | | | | |
| ITSE | | | | |
| ITAE | | | | |
Table 13.
Performance metric comparison between Fuzzy-PID and PID controllers with noise.
Table 13.
Performance metric comparison between Fuzzy-PID and PID controllers with noise.
| Type | ISE | IAE | ITSE | ITAE |
|---|
| Fuzzy-PID | | | | |
| PID | | | | |
Table 14.
Performance metric comparison between Fuzzy-PID and PID controllers with noise and Smith Predictor implementation.
Table 14.
Performance metric comparison between Fuzzy-PID and PID controllers with noise and Smith Predictor implementation.
| Type | ISE | IAE | ITSE | ITAE |
|---|
| Fuzzy-PID | | | | |
| PID | | | | |
