Abstract
This study presents a comparative evaluation of post-process sensor integration in additively manufactured (AM) metal and the in-situ process for polymer structures for structural health monitoring (SHM), with an emphasis on embedded sensors. Geometrically identical specimens were fabricated using copper via metal fused filament fabrication (FFF) and PLA via polymer FFF, with piezoelectric transducers (PZTs) inserted into internal cavities to assess the influence of material and placement on sensing fidelity. Mechanical testing under compressive and point loads generated signals that were transformed into time–frequency spectrograms using a Short-Time Fourier Transform (STFT) framework. An engineered RGB representation was developed, combining global amplitude scaling with an amplitude-envelope encoding to enhance contrast and highlight subtle wave features. These spectrograms served as inputs to convolutional neural networks (CNNs) for classification of load conditions and detection of damage-related features. Results showed reliable recognition in both copper and PLA specimens, with CNN classification accuracies exceeding 95%. Embedded PZTs were especially effective in PLA, where signal damping and environmental sensitivity often hinder surface-mounted sensors. This work demonstrates the advantages of embedded sensing in AM structures, particularly when paired with spectrogram-based feature engineering and CNN modeling, advancing real-time SHM for aerospace, energy, and defense applications.
1. Introduction
Sensor embedding through additive manufacturing (AM) has revolutionized the development of advanced structural health monitoring (SHM) systems. Sensors were either integrated directly during the fabrication process, or components can be designed with optimized cavities that allow for the precise placement of sensing elements exactly where data acquisition is most critical. This integrated approach improves monitoring accuracy and offers long-term protection from environmental factors such as moisture, thermal fluctuations, and mechanical stress. AM is especially advantageous for polymer structures, offering the design flexibility to embed sensors within tailored enclosures and internal channels. Its broader benefits, lightweight geometry, material efficiency, and rapid prototyping make it ideal for aerospace, automotive, biomedical, and civil infrastructure applications.
In AM polymer parts, embedded sensors often include strain gauges, piezoresistive sensors, capacitive sensors, and fiber optic sensors such as fiber Bragg gratings [1,2,3,4,5]. Successful integration into thermoplastic and thermoset matrices has been demonstrated in applications ranging from aerospace wing panels [6], wind turbine blades [7], and prosthetic limbs [8] to soft robotics [9] and automotive crash structures [10]. These sensors not only facilitate damage detection and lifetime prediction but also enable adaptive self-healing behaviors [11,12,13], enhancing the resilience and intelligence of the component [14].
For metallic parts, embedding techniques like powder bed fusion and directed energy deposition have enabled the integration of thermocouples, ultrasonic transducers, eddy current sensors, and MEMS accelerometers within titanium, aluminum, and steel-based systems [15,16,17,18,19]. This integration has proven valuable in real-time monitoring of jet engine turbine blades [20], structural bridge elements [21], space-based infrastructure [22], nuclear reactor components [23], and high-performance brake systems [24]. Metal-embedded sensors offer thermal endurance and robustness under cyclic and extreme conditions, supporting mission-critical diagnostics in demanding operational environments [25,26,27].
Signal processing is key to interpreting the data acquired from these embedded sensors. For signals exhibiting steady-state behavior, frequency-domain analysis using the Fourier Transform (FT) or its efficient implementation via Fast Fourier Transform (FFT) is widely employed [28,29]. However, when signal characteristics change over time—such as in transient vibration or biomedical signals—time–frequency methods such as Short-Time Fast Fourier Transform (STFFT) and Wavelet Transform (WT) provide a superior analytical resolution [30,31]. These techniques allow for the localized inspection of non-stationary features across both time and frequency axes. Convolutional neural networks (CNNs) have become highly effective for classifying complex signals captured from SHM systems. CNNs automatically learn hierarchical features and patterns, offering scalability and robustness across diverse modalities. They have demonstrated an outstanding performance in classifying ECG arrhythmia [32], acoustic scenes [33,34], mechanical vibrations [35], EEG signals [36], and heart sound anomalies [37], cementing their role in intelligent diagnostics across SHM and biomedical domains.
Most SHM studies have focused on large, thin aluminum or composite plates, such as those found in airplane fuselages. These geometries make it easier to compare experimental results with wave theory, perform simulations, and even visualize wave propagation experimentally. In recent years, additive manufacturing has gained increasing importance in aerospace and nuclear engineering applications. However, additively manufactured parts differ significantly from the thin plates used in early SHM studies: they are generally thicker, smaller in size, have complex geometries, and are often produced with infill structures [38,39]. These parts are typically made of either metals or polymers, whose wave propagation behaviors differ markedly, and their material properties are further altered compared to conventionally manufactured counterparts. In this study, we sought to develop an excitation, monitoring, signal processing, and classification approach that can be applied to both metals and polymers with minimal adjustment, even in relatively complex geometries used in engineering applications. Furthermore, instead of attaching sensors to the surface, we embedded them within the part to provide protection and reduce manufacturing costs for polymers. This choice, however, made effective excitation and response sensing more challenging. In the following sections, the relatively complex and thick part geometries; their additive manufacturing; experimental setup; data collection, processing, and classification; and the performance of the proposed approach are presented.
2. Theoretical Background
2.1. Structural Health Monitoring Fundamentals
SHM can be broadly defined as the process of implementing a damage-identification strategy for engineering structures [40], with objectives centered on enhancing safety, improving reliability, and extending service life while simultaneously reducing maintenance costs [41]. By enabling condition-based maintenance, SHM shifts the paradigm away from costly scheduled inspections toward real-time monitoring that prevents catastrophic failures and minimizes downtime [42], a benefit that is especially critical in aerospace, civil infrastructures, energy, and defense applications where failure carries severe consequences [43]. The SHM process is typically described in four progressive stages: detecting the existence of damage, determining its location, identifying its type, and assessing its severity [44], with more advanced frameworks extending to the prognosis of the remaining useful life to guide life cycle management. While these methods are well established for conventional systems [45], unique challenges arise in additively manufactured structures as they are heterogeneous and anisotropic in nature, internal porosity, and residual stresses [46], all of which complicate wave propagation and make feature extraction less straightforward. Further variability in manufacturing orientation, layer bonding, and microstructural defects can alter sensor responses, diminishing the reliability of traditional damage metrics [47]. Embedding sensors during AM presents a promising solution to these challenges but introduces its own complexities, including cavity optimization, thermal compatibility, and maintaining structural integrity during the print process [48]. In this study, these concepts are examined through comparative experiments on copper and PLA specimens with embedded piezoelectric transducers, where the interaction of geometry, material system, and sensor placement was evaluated using spectrogram-based signal processing and CNN classification to demonstrate how tailored SHM strategies can be realized in practice; the workflow of this study can be seen in Figure 1.
Figure 1.
Workflow for embedded sensor-based SHM in AM specimen.
2.2. Additive Manufacturing for Sensor Integration
Additive manufacturing (AM) offers unprecedented design freedom, enabling the fabrication of complex geometries, internal cavities, and seamless integration of protective sensor enclosures, advantages largely unattainable with conventional fabrication methods [49]. By integrating sensors directly during printing, AM allows for the precise placement of sensing elements at critical regions of interest while protecting them from environmental degradation such as moisture, thermal cycling, and mechanical wear [50]. This integrated approach improves long-term durability and enhances monitoring accuracy, making AM-embedded sensors attractive for next-generation SHM systems [51].
The methods of embedding sensors differ significantly between polymers and metals. In polymer-based AM (e.g., fused filament fabrication), the relatively low processing temperatures allow for the easy creation of cavities and enclosures to house sensitive sensors such as PZTs, strain gauges, or fiber Bragg gratings [49,52], as can be seen in Figure 2. In metallic AM, however, direct in situ embedding during the print is often limited by the extremely high processing temperatures of powder bed fusion or directed energy deposition, which can degrade or destroy delicate sensor elements [53,54]. To address this challenge, cavities can be printed into the part and sensors inserted after the printing and sintering cycle, ensuring both structural integrity and sensor survival [55]. While this approach is technically “post-process embedding,” it still takes full advantage of AM’s ability to design and integrate precise internal features. Importantly, once in place, metal-embedded sensors offer superior resilience under cyclic loading, high stresses, and extreme environments, making them well suited for aerospace and energy systems.
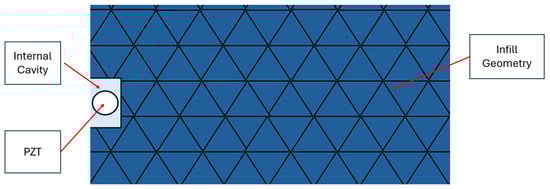
Figure 2.
A schematic cutaway of an AM part showing the internal cavities where sensors are embedded during the build.
Previous applications of AM-based sensor integration demonstrate the breadth of this approach. In aerospace, embedded thermocouples and ultrasonic sensors have been integrated into turbine blades and wing panels for real-time thermal and strain monitoring [56]. In civil infrastructure, AM-enabled sensing concepts have been proposed for bridge components and structural panels to provide continuous tracking of load histories and early-stage damage [57]. Beyond these, automotive and biomedical fields are increasingly adopting AM-embedded sensors for crash structures, prosthetics, and soft robotics, demonstrating the cross-sector potential of this approach [58].
In the present study, these strategies were applied to fabricate PLA and copper specimens with embedded PZTs. The polymer specimens illustrate the accessibility and flexibility of directly embedding sensors into thermoplastic matrices, while the copper specimens highlight how post-process placement into AM-designed cavities can enable the integration in metallic systems that must undergo sintering prior to testing. Together, these experiments demonstrate how AM-enabled sensor integration—whether achieved in situ during fabrication or via post-process insertion—provides a foundation for advanced SHM methods that combine signal processing and machine learning to classify load conditions and identify damage states.
2.3. Piezoelectric Transducers (PZTs)
Within the field of SHM, a wide variety of transducers have been utilized, yet piezoelectric transducers (PZTs) remain the most widely adopted due to their unique dual capability of functioning as both actuators and sensors [59,60]. This versatility arises from the piezoelectric effect, whereby an electric charge is generated under applied mechanical stress and, conversely, mechanical strain occurs when a voltage is applied [61,62]. Traditionally, PZTs have been mounted onto structural surfaces to capture wave propagation and vibration responses [63], as can be seen in Figure 3; however, such surface-mounted approaches often expose the sensors to environmental degradation and limit their proximity to internal stress regions.
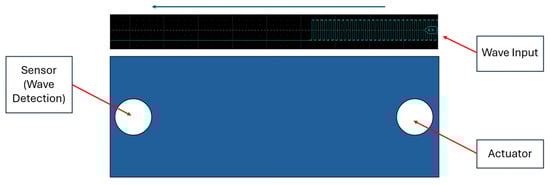
Figure 3.
Sensor configuration of PZT-based SHM system.
In this research, PZTs were embedded directly into additively manufactured polymer and copper specimens, taking advantage of AM’s design freedom to create protective internal cavities for precise placement. This embedded strategy offers multiple benefits: long-term protection from thermal and mechanical damage, enhanced sensitivity by positioning sensors closer to critical regions, and improved durability under cyclic loading [64]. A typical PZT-based SHM system consists of a sensor network, diagnostic hardware for excitation and data acquisition, and signal-processing software [65]. In the present study, excitation signals were introduced through embedded PZTs, with corresponding responses recorded and transformed into spectrograms. These spectrograms were then input into convolutional neural networks (CNNs) for automated feature extraction, training, and classification.
The success of such an SHM system depends strongly on the type, location, and number of embedded sensors, as these factors directly influence sensitivity, classification accuracy, and diagnostic reliability [66,67,68]. By embedding PZTs into both PLA and copper specimens, this work demonstrates the adaptability of embedded-sensor SHM strategies across material systems, providing a foundation for robust monitoring methods that integrate advanced signal processing and machine learning.
2.4. Wave Propagation and Damage Detection Techniques
The foundation of vibration-based SHM lies in the physics of stress and strain wave propagation in solids. When an external excitation is applied to a structure, mechanical waves travel through the material, interacting with boundaries, interfaces, and potential defects [69,70]. These interactions alter wave amplitude, velocity, and frequency content, providing the basis for detecting the presence, location, and severity of damage. Even subtle changes in stiffness or mass distribution can shift wave characteristics, making propagation analysis an effective diagnostic tool [71]; these types of changes can be seen in Figure 4 as well.
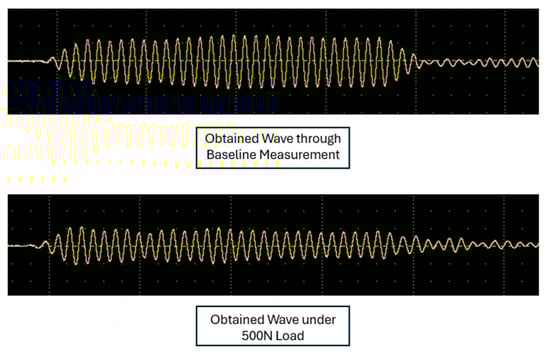
Figure 4.
Time-domain signals acquired from embedded PZT transducers under different loading conditions. The baseline measurement (top) shows the undisturbed wave response, while the response under a 500 N applied load (bottom) exhibits altered amplitude and frequency characteristics, indicating the sensitivity of the embedded sensing system to external loading.
A well-established wave-based technique in SHM is the use of guided waves, such as Lamb waves, which propagate efficiently over long distances in thin-walled structures while maintaining sensitivity to local defects like cracks, delaminations, or voids [72,73]. Their multimodal and dispersive nature allows both local and global assessment, though interpretation can be challenging in complex geometries.
The geometry of the structure plays a critical role in wave propagation. Flat plates support relatively simple Lamb wave modes, making them favorable for controlled experiments and modeling [74]. Curved or hollow structures, such as cylinders, introduce effects such as dispersion and mode conversion, which complicate the signal but also enrich the feature space available for damage detection [75]. In this study, both obround plate and hollow cylinder specimens were tested, providing distinct perspectives: plates emphasized the clarity of guided modes, while hollow cylinders introduced geometry-dependent complexity that challenged classification.
Material composition also has an important influence on the propagation speed, attenuation, and the scattering behavior of the waves. Metals like copper are stiff and exhibit low damping, producing sharp, distinct signals with high signal-to-noise ratios that enable reliable classification [76]. Polymers such as PLA, by contrast, are more compliant and dissipative, leading to greater attenuation and blurred spectral features under load [77]. These differences were evident in the experimental results, where copper specimens consistently yielded near-perfect classification, while PLA specimens demonstrated more variability, particularly at higher loads. Such outcomes underscore how intrinsic material properties shape the separability of signals, with each specimen and material needing separate configurations with each test setup, as can be seen in Table 1, and the performance of SHM techniques [78].

Table 1.
Signal configuration and function-generator settings used to excite each specimen. All tests employ pulse-burst excitation; the table lists the burst frequency (kHz), drive amplitude (Vpp), duty cycle (%), excitation type (“N_Cycle” = a gated tone burst of N cycles), the number of cycles per burst, and the burst repetition period (ms).
By integrating these insights into the experimental design, this study highlights how wave propagation theory—when considered alongside structural geometry and material properties—provides the foundation for signal processing and machine learning methods applied later in the paper.
2.5. Signal-Processing Techniques
Signal processing plays a central role in transforming raw sensor outputs into meaningful features for SHM. The selection of appropriate transforms depends on the type of signal being analyzed. For signals that exhibit steady-state or periodic behavior, the Fourier Transform (FT) and its computationally efficient implementation, the Fast Fourier Transform (FFT), are commonly employed [79]. These frequency-domain methods decompose signals into their constituent spectral components, enabling the identification of dominant frequencies, harmonics, and global energy distributions. However, their main limitation is that they provide no information about how the frequency content evolves over time, making them less suitable for non-stationary or transient signals.
To overcome this limitation, time–frequency analysis methods such as the Short-Time Fast Fourier Transform (STFFT) and the Continuous Wavelet Transform (CWT) have been developed [80,81]. Both techniques allow for the localized inspection of signals in both the time and frequency domains, making them highly effective for detecting transient changes induced by damage, loading, or environmental variation. STFFT achieves this by applying the Fourier transform to windowed segments of the signal. Formally, the STFFT of a signal X is defined as
where w(τ−t) is a sliding window function centered at time t. The squared magnitude of the STFFT provides the spectrogram,
which represents the time-varying energy distribution of the signal in the frequency domain [82].
The outputs of these time–frequency techniques are typically visualized as spectrograms (STFFT) or scalograms (CWT), which represent signal energy as a function of both time and frequency. These two-dimensional representations not only facilitate the physical interpretation of wave propagation phenomena but also serve as highly discriminative feature inputs for machine learning models. By converting raw waveforms into images, advanced classifiers such as convolutional neural networks (CNNs) can automatically extract hierarchical features and learn subtle patterns that may not be evident from traditional hand-crafted descriptors [83].
In this study, STFFT-derived spectrograms were used as the primary input feature for machine learning classification. Figure 5 illustrates representative spectrograms obtained from embedded PZT sensors under two conditions: a baseline case with no applied load and a 500 N compressive load. The observed shift in frequency–time energy distribution demonstrates how external loading alters wave propagation characteristics. These discriminative changes, captured by the STFFT, formed the foundation of the feature space used to train CNNs for automated load classification. Thus, STFFT provided both a physical basis for understanding wave behavior in additively manufactured (AM) structures and a practical bridge to the machine learning framework implemented in this research.
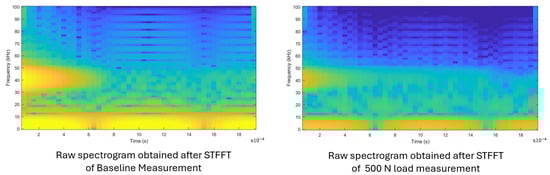
Figure 5.
Short-Time Fast Fourier Transform (STFFT) spectrograms of signals acquired from embedded PZT sensors under two conditions: (left) baseline measurement with no applied load and (right) response under a 500 N compressive load. The shift in frequency–time energy distribution demonstrates how applied loading influences wave propagation characteristics, providing discriminative features for SHM classification.
2.6. Convolutional Neural Networks (CNNs) for SHM
Convolutional neural networks (CNNs) are a class of deep learning models that have proven highly effective at automatically learning and extracting hierarchical features from large and complex datasets. Unlike traditional machine learning methods that rely on hand-crafted feature extraction, CNNs employ multiple processing layers that allow the network to learn representations directly from raw data, discovering patterns and structures that are not easily accessible through conventional approaches. For example, in the context of SHM, a traditional machine learning pipeline would require extracting hand-crafted features such as peak frequency from the FFT, signal energy, or wavelet coefficients from the raw PZT response signals before training a classifier; in contrast, the 2D CNN employed in this study was able to operate directly on spectrogram representations of the signals, automatically learning the most relevant features for distinguishing load conditions. In their one-dimensional form (1D CNNs), CNNs are well suited for sequential data such as time-series signals, making them applicable for analyzing raw sensor outputs in SHM [84,85,86]. A typical 1D CNN consists of an input layer, convolutional and pooling layers for feature extraction, and fully connected layers for classification or regression. Nonlinear activation functions embedded within each layer are essential to extend the model’s learning capacity beyond just linear relationships [87].
In contrast, 2D CNNs, the visual representation seen in Figure 6, are designed for image recognition tasks, where the input data is represented as a 2D array [88,89]. By applying convolutional filters and pooling operations in two spatial dimensions, 2D CNNs progressively extract these higher-order features from images, ranging from edges, corners, and contours to textures and abstract patterns [90,91,92,93]. This automatic feature extraction is especially powerful for SHM when sensor signals are transformed into time–frequency representations such as spectrograms or scalograms, which can be interpreted as images. In this study, signals collected from embedded PZTs in polymer and metallic additively manufactured specimens were converted into spectrogram images, as can be seen in Figure 5 and Figure 7, used to train 2D CNNs. This approach enables the network to capture subtle frequency–time interactions linked to applied load conditions, specimen geometry, and material type. By leveraging spectrogram-based 2D CNNs, the experimental framework demonstrated a robust classification of load states and provided clear evidence of the advantages of embedded sensing in AM structures.
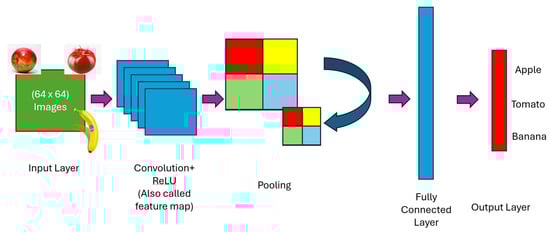
Figure 6.
Typical representation of the 2D CNN architecture.

Figure 7.
Engineered spectrogram images (at reduced resolution for CNN) of the obround plate specimen at varying load conditions (Baseline, 200 N, and 500 N). Unlike raw STFFT spectrograms used for diagnostic interpretation, these images were processed into RGB representations to encode amplitude and envelope information, serving as structured inputs for the convolutional neural network (CNN) to classify loading conditions.
Deep Learning Model
To classify the spectrograms generated from the SuRE experiments, a deep learning approach based on transfer learning with ResNet-18 was employed. ResNet-18 is a convolutional neural network composed of 18 learnable layers organized into successive residual blocks. Each residual block contains two convolutional layers connected through a skip (shortcut) connection, which helps preserve gradient flow and alleviates vanishing gradient problems during training. The network (as shown in Table 2 as well) begins with an initial 7 × 7 convolutional layer and max-pooling stage, followed by four groups of residual blocks with increasing filter depth (64, 128, 256, and 512 channels). After the final residual block, a global average pooling layer reduces the spatial dimension, and the output is passed to a fully connected classification layer. This architecture has been widely adopted for small- to medium-scale datasets because it provides an effective balance of depth, feature extraction capacity, and computational efficiency. Compared with deeper ResNet-50, EfficientNets, or transformer-based architectures, ResNet-18 is less prone to overfitting with limited training data, while still benefitting from ImageNet pretraining for transfer learning.
Table 2.
ResNet-18 Structure, the backbone of the CNN.
The spectrogram images used as input were fixed at a 224 × 224 × 3 resolution to match the network’s input size. Data preprocessing retained the RGB encoding of the engineered spectrograms, ensuring that amplitude, envelope, and contrast information were preserved across channels. To enhance generalization, light data augmentation was applied during training, including small translations (±8 px), scaling (0.98–1.02), and rotations (±2°), while avoiding reflections to preserve the physics of wave propagation.
Training was performed using the Adam optimizer with an initial learning rate of 3 × 10⁻⁴, a piecewise learning rate decay (factor 0.5 every 30 epochs), and an L2 regularization term of 5 × 10⁻⁴. The batch size was set to 32, and the network was trained for up to 160 epochs with early stopping based on validation performance. Gradient clipping with an L2-norm threshold of 1 was employed to stabilize training. To evaluate the effect of dataset partitioning, three strategies were considered: the 50/50 train–test split, a conventional 70/15/15 train/validation/test division, and k-fold cross validation. The 50/50 split was initially adapted to maximize the size and diversity of the test set, providing a robust benchmark for generalization performance by assessing the model on a substantially larger hold-out set. This ensured that reported results were not biased by an undersized or unrepresentative test sample, albeit at the cost of reducing the amount of training data. Under this condition, the model achieved a strong performance, proving its ability to generalize even when trained on fewer examples. When re-trained using a 70/15/15 split, the test accuracy further improved, demonstrating consistency with more standard evaluation practices. Finally, cross-validation confirmed the stability of the method by achieving perfect recognition across folds. A summary of classification accuracies obtained under each partitioning strategy is displayed in Table 3, showing that while the 50/50 split provided a more conservative benchmark, the overall findings remained robust across all evaluation schemes.
Table 3.
Overall findings of classification accuracies.
Across all experiments, with 5200 test cases completed between the six specimens, the CNN achieved classification accuracies ranging from 91.04% to 100%, depending on material type and load condition. Copper specimens consistently yielded perfect recognition, while PLA specimens showed slightly reduced accuracy under higher loads due to increased damping and reduced signal separability. These results confirm that STFFT-derived spectrograms combined with ResNet-18 transfer learning provide a robust and scalable framework for classifying load conditions in additively manufactured structures.
2.7. SuRE Method
The Surface Response to Excitation (SuRE) method is an active and cost-effective SHM technique that has demonstrated effectiveness in detecting a wide range of damage and anomalies across different structures [94,95]. SuRE is conceptually related to the Electromechanical Impedance (EMI) method, but it eliminates the need for specialized impedance analyzers, simplifying the data collection process and reducing cost. Another advantage is its adaptability, as SuRE can be implemented using a wide variety of exciters and sensors provided they possess an adequate frequency response and sensitivity for the target application.
In practice, the SuRE method excites a host structure through a bonded or embedded piezoelectric transducer, while additional PZTs positioned on or within the specimen monitor the dynamic surface response. When the structure is in a healthy, undamaged condition, the received signal closely resembles the original excitation. However, the presence of damage, cracks, or external loading introduces nonlinearities and wave distortions, resulting in measurable variations between transmitted and received responses [96,97]. This sensitivity to small changes makes SuRE particularly effective in identifying anomalies before visible or permanent damage occurs.
Shown in Figure 8 is the general workflow of the Surface Response to Excitation (SuRE) method. An excitation signal is applied to the structure under test via an embedded PZT actuator, and the dynamic response is captured by one or more PZT sensors. The measured response is then compared and analyzed, in this case through spectrogram representations processed via Short-Time Fast Fourier Transform (STFFT) and subsequently classified using convolutional neural networks (CNNs).

Figure 8.
Simplified visual workflow of the SuRE method.
A key limitation of SuRE, as with other ultrasonic-based approaches, is that minimal sensor configurations may not provide precise defect localization. However, when used with an array of PZTs, the method can classify and localize adverse structural conditions, including loads that are not directly adjacent to the transducer. This capability provides a significant advantage over some competing technologies, such as fiber optics, which often require a dense spatial coverage to achieve similar results.
In this research, the SuRE method was applied to additively manufactured (AM) PLA and copper specimens with embedded PZTs. The embedded configuration leveraged the design freedom of AM, enabling the precise placement of transducers within the specimens to improve sensitivity to wave propagation changes. The PZTs were used both as actuators and sensors to excite and capture ultrasonic surface waves under various loading scenarios, including baseline (no load) and compressive loads up to 500 N. The signals collected through this process were transformed into spectrograms using the Short-Time Fast Fourier Transform (STFFT), which captured the load-dependent variations in frequency–time energy distribution. These spectrograms served as the input features for convolutional neural networks (CNNs), enabling automated classification of load magnitudes and conditions.
The results of this study demonstrated classification accuracies ranging from 91.04% to 100%, depending on specimen material and load condition. The copper specimens generally yielded perfect recognition across all cases, while the PLA specimens exhibited slightly lower performance under certain loading conditions due to increased damping and reduced signal separability. Overall, the successful application of SuRE in this study highlights its potential as a powerful SHM technique for complex AM structures. By embedding PZTs directly within PLA and copper specimens, the method not only retained sensitivity to loading conditions but also emphasized how material composition and geometry influence wave propagation. These findings reinforce the role of SuRE, when paired with signal processing and deep learning, as a scalable approach for monitoring AM structures in aerospace, civil, and energy systems.
3. Experimental Setup
The experimental setup for evaluating the AM specimens is shown in Figure 9. A compression test stand (Mark-10 Test Stand) was employed to apply controlled point loads to the specimens while maintaining repeatability in positioning and force application. Figure 3, Figure 10 and Figure 11 present the dimensions and exact positions of each specimen and PZT shown in Figure 12, Figure 13, Figure 14, Figure 15, Figure 16, Figure 17, Figure 18, Figure 19 and Figure 20. The locations of the PZTs were chosen to maximize the distance between the actuator and sensor, while avoiding placement at the edges. Since the parts were much smaller than the plates typically used in the SHM studies by other researchers, selecting the PZT locations in our application was more straightforward relative to others. Each specimen contained embedded PZTs that acted as sensors and actuators. Excitation signals were generated using a function/waveform generator (RigolDG102Z) to send mechanical waves into the structure through one PZT. The response signals were captured from the opposing PZT and recorded with a digital oscilloscope (Tektronix 2 Series Mixed Signal Oscilloscope). This configuration allowed simultaneous excitation and sensing of wave propagation (signals used for specimen were recorded, as shown in Table 1) under different applied loads ranging from no load, 0 N, to 500 N, enabling high-fidelity acquisition of dynamic response signals. The integration of the compression stand, signal generator, and oscilloscope ensured that each test was performed under consistent boundary and loading conditions, facilitating a direct comparison between PLA and copper specimens. A total of 5200 tests were conducted across six specimens.
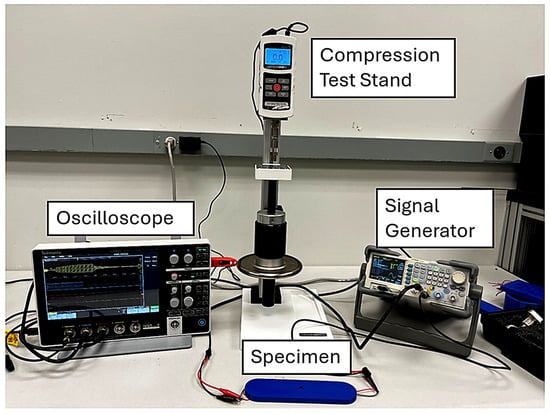
Figure 9.
Experimental setup for all test specimens, the signal settings are indicated in Table 1.
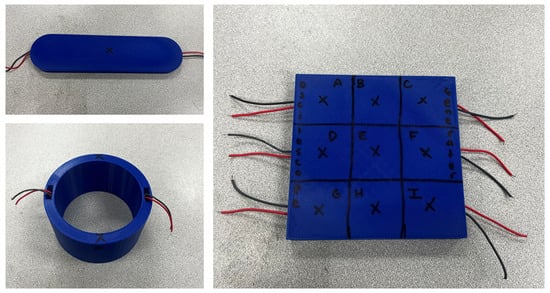
Figure 10.
Photograph of plastic 3D printed test specimens used in this study, including the plate (right), obround plate (top left), and hollow cylinder (bottom left), each with embedded piezoelectric transducers (PZTs) for SHM.

Figure 11.
Photograph of copper 3D-printed test specimens used in this study, including the plate (top left), obround plate (bottom left), and hollow cylinder (right), each with embedded piezoelectric transducers (PZTs) for SHM.
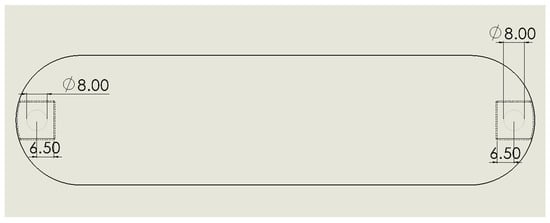
Figure 12.
Technical drawing of sensor placement in 3D-printed obround plate with embedded PZT for stress wave detection under central point loading (mm).

Figure 13.
Technical drawing of 3D-printed obround plate with embedded piezoelectric transducer (PZT) for SHM under compressive and point loads (mm).

Figure 14.
Instrumentation and loading diagram for obround plate specimen. The PZT on the left edge acts as a sensor connected to the oscilloscope, and the PZT on the right act as an actuator driven by the signal generator. Signals are recorded for the load location under this configuration.
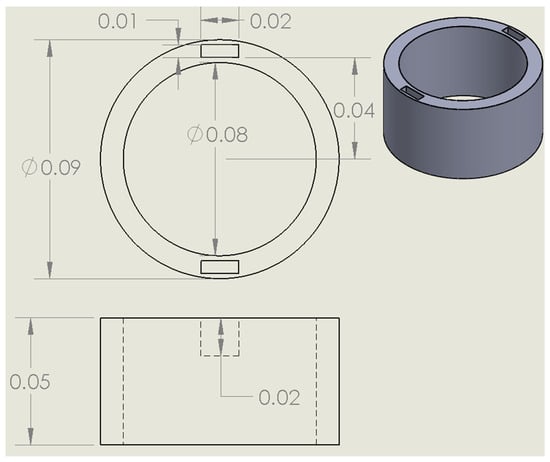
Figure 15.
Technical drawing of 3D-printed hollow PLA cylinder with axially embedded PZT, designed for evaluating sensor response under compressive and bending loads (mm).

Figure 16.
Technical drawing of sensor placement in 3D-printed hollow cylinder with axially embedded PZT for monitoring under compressive and bending loads (mm).
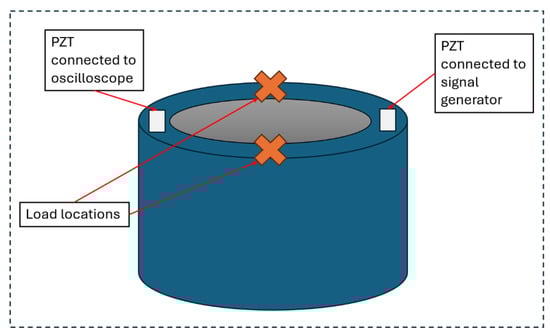
Figure 17.
Instrumentation and loading diagram for hollow cylinder specimen. The PZT on the left edge acts as a sensor connected to the oscilloscope, and the PZT on the right act as an actuator driven by the signal generator. Signals are recorded for each load location under this configuration. The north side is side A, and the south side is side B.
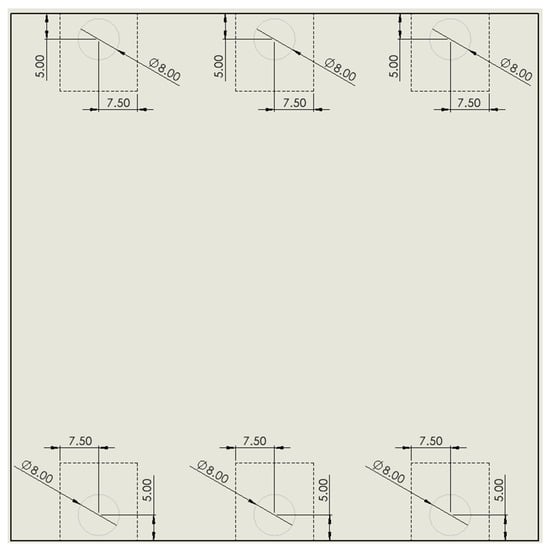
Figure 18.
Technical drawing of sensor placement in 3D-printed plate with embedded piezoelectric transducer (PZT) for SHM under compressive and point loads (mm).
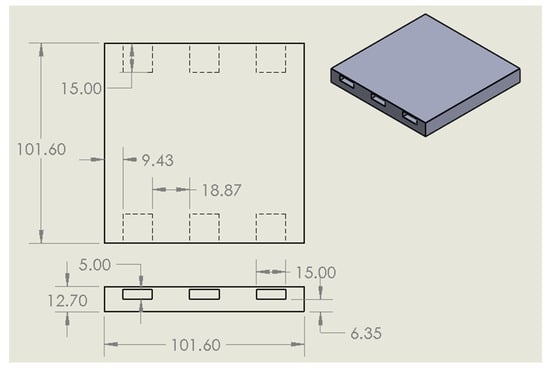
Figure 19.
Technical drawing of 3D-printed PLA square with internal cavity for post-process PZT insertion, used for load and damage detection (mm).
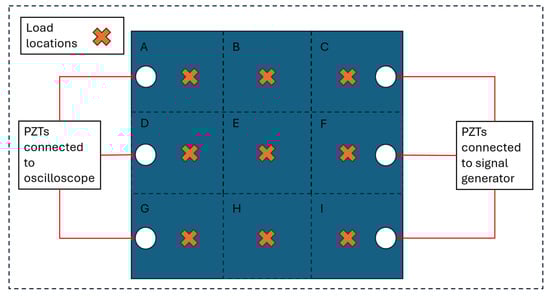
Figure 20.
Instrumentation and loading diagram for the plate specimen. The PZTs on the left edge (D, G, A) act as sensors connected to the oscilloscope, and the PZTs on the right edge (C, F, I) act as actuators driven by the signal generator. The interior grid is divided into nine labeled regions (A–I) to indicate possible load application points, with orange crosses marking the actual load locations. Signals are recorded for each load location under this configuration.
4. Results and Discussion
A total of 5200 experiments were performed for six parts, and 50% of the experimental data was used for training. The other half was used for testing. In this section, the performance of the proposed STFFT + CNN combination will be outlined.
For the obround plate-shaped specimen, the classification framework achieved perfect discrimination across all tested load conditions for both the PLA and copper versions. As summarized in Table 4 and displayed in Figure 21, the per-class test accuracy was 100% at baseline and for every applied load case from 100 N to 500 N, yielding an overall accuracy of 100%. This consistency demonstrates that the embedded PZT-based sensing approach captured distinct and repeatable signal features associated with each loading condition, independent of the material system. The geometry of the obround plate, combined with the sensor placement and signal pathway as shown in Figure 14, likely contributed to clear load-dependent wave signatures with minimal overlap between classes. These results highlight the robustness of the method, suggesting that even when transitioning from polymer to metal-based systems, the sensor network and classification pipeline can maintain full accuracy in identifying both unloaded and loaded states.
Table 4.
Per-class test accuracy for the obround plate specimen both the PLA and copper versions.
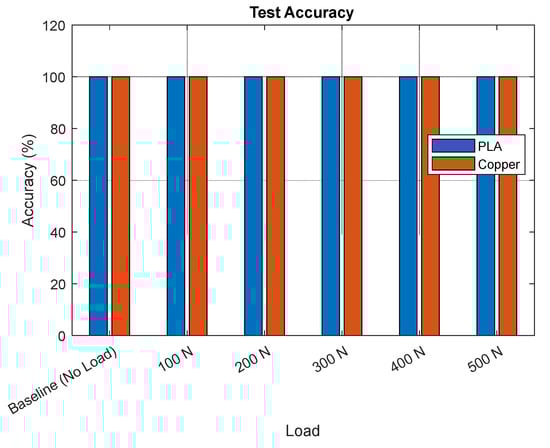
Figure 21.
Bar graphs featuring the overall accuracies between PLA and copper versions of the obround plate.
For the hollow cylinder specimen, the classification framework performed strongly across both material systems. As summarized in Table 5 and Figure 22, the copper specimen achieved perfect recognition, maintaining 100% accuracy for all baseline and side-specific load cases from 100 N to 500 N. The PLA specimen also demonstrated an impressive performance, with an overall accuracy of 94.09%, consistently identifying the vast majority of load conditions. Even at the more challenging baseline and higher load levels, the PLA version maintained accuracies between 85 and 95%, which is notable given the material’s higher compliance and damping compared to copper. Importantly, both materials showed reliable recognition across side-specific load cases, confirming that the sensing configuration was effective at capturing distinct signal responses in a cylindrical geometry. These findings illustrate the versatility of the approach: the copper specimen highlights the potential for achieving perfect accuracy in rigid metallic structures, while the PLA specimen demonstrates that a high classification performance is achievable even in more compliant polymer systems. Together, the results affirm that the sensing and classification methodology adapts effectively to both material types and provides a robust monitoring capability under varied loading conditions.
Table 5.
Per-class test accuracy for the hollow cylinder specimen both the PLA and copper versions.
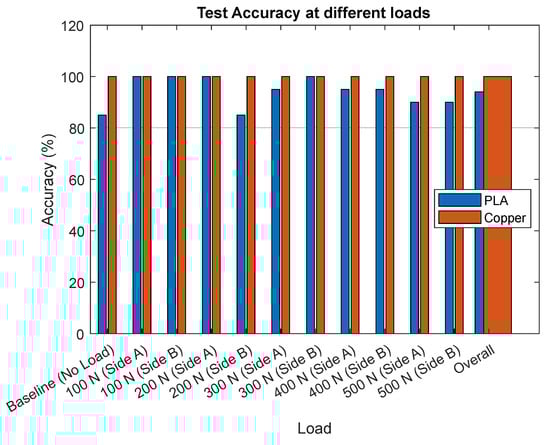
Figure 22.
Bar graph featuring the overall accuracy between PLA and copper versions of the hollow cylinder specimen.
The square plate specimen demonstrated that the sensing and classification framework is capable of reliably distinguishing load conditions across a relatively complex geometry for both the PLA and copper versions. As shown in Table 6 and Figure 23, the copper specimen achieved excellent performance, with an overall accuracy of 97.81%, while the PLA specimen maintained a strong accuracy of 91.04% despite the added challenges associated with its greater compliance and damping. Importantly, both materials achieved perfect classification for many load locations, including all baseline zones for PLA (A–C and G–I) and nearly all load zones for copper, underscoring the robustness of the approach. Even in the PLA specimen, where a few zones such as 200 N and 300 N exhibited modest reductions in accuracy, the system still consistently identified the correct class in the majority of cases, reflecting reliable recognition across diverse load states. The ability of the PLA specimen to sustain performance above 90% overall demonstrates that effective SHM is achievable even in more flexible polymer structures, while the copper specimen highlights the outstanding potential for near-perfect accuracy in metallic systems. Together, these results validate the adaptability of the method to both materials and confirm that accurate localization is possible across a distributed grid of load locations.
Table 6.
Per-class test accuracy for the square plate specimen both the PLA and copper versions.

Figure 23.
Classification accuracy of PLA and copper specimens across load levels (100–500 N) for each sensing zone (A–I). Each subplot shows side-by-side comparisons of average accuracy between PLA (orange) and copper (blue) specimens at the corresponding zone.
Surface wave propagation in polymers and metals exhibits distinct differences due to their contrasting mechanical properties. Metals, characterized by high stiffness and density, typically support faster surface wave velocities. Rayleigh velocities range between 2000 m/s and 3200 m/s, while polymers, being more compliant and less dense, show significantly lower velocities between 800 m/s and 1400 [98]. Attenuation behavior also diverges sharply: polymers exhibit much higher ultrasonic attenuation due to their viscoelastic nature, which leads to greater energy dissipation during wave propagation. This attenuation in polymers is strongly frequency-dependent, often increasing with frequency due to mechanisms like molecular relaxation and scattering [99]. In contrast, metals generally show lower attenuation, with mechanisms such as dislocation damping and Rayleigh scattering contributing modestly to energy loss. In this study, an excitation signal was selected that can work with polymers and metals. The performance of the method demonstrated that it can effectively work with materials with distinctly different characteristics.
Many SHM methods have been developed for large, thin, flat metal and composite plates, such as those found in airplane fuselages or slightly more complex wind turbine propellers. In this study, we focus on developing a method suitable for small parts with complex geometries, in contrast to the large and thin plates with low attenuation typically studied. The proposed approach in this paper can be extended to larger metal components with similar geometries. However, the higher attenuation observed in larger polymer parts presents greater challenges as the size increases. For components with complex geometries, the placement of PZTs and the design of excitation and sensing strategies must be carefully considered to ensure effective monitoring.
5. Conclusions
The performance of SHM methods was investigated in this study on additively manufactured small parts with embedded sensors subjected to various loads. Three-part geometries were considered: a plate, an obround plate, and a hollow cylinder. The parts were fabricated using polymer (PLA) and metal (copper) materials. Loads were applied at six levels, ranging from 0 to 500 N. A total of 5200 tests were conducted across six specimens. Half of the data was used for training, and the remaining half was reserved for testing. The characteristics of the acquired data were enhanced using the 2D STFFT, and convolutional neural networks (CNNs) were employed to classify the resulting spectrograms.
This work demonstrated that both in-situ process and post-process, embedded PZT integration in AM structures enables highly reliable SHM across both polymer and metal systems. By generating engineered spectrogram representations and utilizing CNNs, load states and damage-related conditions were classified with accuracies exceeding 90% in all specimens, with copper consistently reaching near-perfect recognition and PLA achieving a robust performance despite its greater compliance and innate damping. The obround plate and hollow cylinder specimens highlighted the ability of the sensing framework to achieve full separation of load conditions, while the more complex square plate specimen underscored both the adaptability of the method and the influence of geometry on signal separability. At each tested load level and application point, distinct patterns were observed in the sensor signals in both the time and time–frequency domains. The proposed method is highly effective under the conditions tested and in their immediate vicinity. However, the performance of the proposed method may be compromised when forces near the midpoints of the test loads are applied or when the forces are directed to the locations far from the tested loading points in the paper.
Many machines operate under a limited number of previously optimized operating conditions, where the components are subjected to well-defined forces. Using the proposed method, up to five different load levels can be identified with high accuracy. When a machine component begins to fail under a given operating condition, changes occur in the strain distribution, surface integrity, and surface wave propagation patterns of the part. As a result, the method begins to estimate loads that deviate significantly from the expected values for that condition. Such deviations provide an indication of defect initiation and can also reflect the severity of the damage in the monitored part. Furthermore, by collecting data when the component is in a defect-free state and as it progresses through various stages of degradation, the method can be trained to detect the onset of failure and estimate its severity with greater reliability.
Together, these findings confirm that embedded sensing paired with spectrogram-based deep learning provides a versatile and effective pathway towards real-time diagnostics in AM parts. This approach holds extreme promise and potential for aerospace, energy, and defense applications where material diversity, reliability, and in situ monitoring are critical to safety and performance.
Author Contributions
M.L.L. was responsible for management of the project, setting up data collection, data-analysis, and writing the paper. G.E.M. was responsible for data collection. M.G. was responsible for literature review, writing the introduction section, and the organization of references. I.T. was responsible for the management of the project as well alongside funding. S.T. was responsible for management of communications and writing reports to the sponsor. All authors have read and agreed to the published version of the manuscript.
Funding
This research was funded by U.S. Department of Energy, Office of Research and Economic Development, NNSA Minority Serving Institution Partnership Program under Award Number NA0004113, and the APC was funded as well.
Data Availability Statement
The datasets presented in this article are not readily available because the research is funded by the federal government and subject to data-sharing restrictions. The data cannot be released without prior authorization from multiple parties and the allocation of secure university server space. Requests to access the datasets should be directed to the corresponding author for coordination with the government and institutional partners.
Acknowledgments
This material is based upon work supported by the U.S. Department of Energy, Office of Research and Economic Development, NNSA Minority Serving Institution Partnership Program under Award Number NA0004113.
Conflicts of Interest
The authors declare [no conflict of interest.
References
- Yan, A.; Yuan, X.; Li, Z.; Yang, J.; Ren, K.; Dong, S. 3D-printed flexible, multilayered ceramic-polymer composite grid with integrated structural-self-sensing function. Sens. Actuators A Phys. 2021, 332, 113187. [Google Scholar] [CrossRef]
- Munasinghe, N.; Woods, M.; Miles, L.; Paul, G. 3D Printed Strain Sensor for Structural Health Monitoring. In Proceedings of the 2019 IEEE International Conference Cybernetics and Intelligent Systems (CIS) & Robotics, Automation and Mechatronics (RAM), Bangkok, Thailand, 18–20 November 2019. [Google Scholar]
- Ahmed, S.; Bodaghi, M.; Nauman, S.; Khan, Z.M. Additive Manufacturing of Flexible Strain Sensors Based on Smart Composites for Structural Health Monitoring with High Accuracy and Fidelity. Adv. Eng. Mater. 2023, 25, 2300763. [Google Scholar] [CrossRef]
- Peng, J.; Zhou, X.; Jia, S.; Jin, Y.; Xu, S.; Chen, J. High precision strain monitoring for lithium ion batteries based on fiber Bragg grating sensors. J. Power Sources 2019, 433, 226692. [Google Scholar] [CrossRef]
- Balaji, R.; Sasikumar, M. Structural Health Monitoring (SHM) System for Polymer Composites: A Review. Indian J. Sci. Technol. 2016, 9, 85832. [Google Scholar] [CrossRef]
- Zhang, Y.; Anderson, N.; Bland, S.; Nutt, S.; Jursich, G. All-printed strain sensors: Building blocks of the aircraft structural health monitoring system. Sens. Actuators A Phys. 2017, 253, 165–172. [Google Scholar]
- Selleri, G.; Gino, M.E.; Brugo, T.M.; D’ANniballe, R.; Tabucol, J.; Focarete, M.L.; Carloni, R.; Fabiani, D.; Zucchelli, A. Self-sensing composite material based on piezoelectric nanofibers. Mater. Des. 2022, 219, 110787. [Google Scholar] [CrossRef]
- Sause, M.G.R.; Jasiuniene, E. Structural Health Monitoring Damage Detection Systems for Aerospace; Springer: Berlin/Heidelberg, Germany, 2021. [Google Scholar]
- Pasquale, G.P.E. Thermal monitoring of braking systems using metal AM calipers with integrated sensors. In ECCOMAS Proceedia; ECCOMAS: Barcelona, Spain, 2023. [Google Scholar]
- Hyer, H.C.; Sweeney, D.C.; Petrie, C.M. Functional fiber-optic sensors embedded in stainless steel components using ultrasonic additive manufacturing for distributed temperature and strain measurements. Addit. Manuf. 2022, 52, 102681. [Google Scholar] [CrossRef]
- Monu, M.C.; Chekotu, J.C.; Brabazon, D. Eddy current testing and monitoring in metal additive manufacturing: A review. J. Manuf. Process. 2025, 134, 558–588. [Google Scholar] [CrossRef]
- Turk, T.; E Dominguez, C.; Sutton, A.T.; Bernardin, J.D.; Park, J.; Leu, M.C. In situ embedding of resistance temperature detectors with the use of laser-foil-printing additive manufacturing. Smart Mater. Struct. 2024, 34, 15033. [Google Scholar] [CrossRef]
- Shi, Y.; Li, Y.; Zhang, J.; Zhao, R.; Wang, Y.; Cao, H.; Liu, J. Design and Experiment of a Hybrid-Integrated Ultrahigh-g Accelerometer with Variable-Section Beam. IEEE Trans. Instrum. Meas. 2023, 72, 2003811. [Google Scholar] [CrossRef]
- Sakalys, R.; O’Hara, C.; Kariminejad, M.; Weinert, A.; Kadivar, M.; Zluhan, B.; McAfee, M.; McGranaghan, G.; Tormey, D.; Raghavendra, R. Embedding a surface acoustic wave sensor and venting into a metal additively manufactured injection mould tool for targeted temperature monitoring. Int. J. Adv. Manuf. Technol. 2024, 130, 5627–5640. [Google Scholar] [CrossRef]
- Chen, L.; Bi, G.; Yao, X.; Tan, C.; Su, J.; Ph Huat Ng, N.; Chew, Y.; Liu, K.; Moon, S.K. Multisensor fusion-based digital twin for localized quality prediction in robotic laser-directed energy deposition. Robot. Comput.-Integr. Manuf. 2023, 84, 102581. [Google Scholar] [CrossRef]
- Stajano, F.; Hoult, N.; Wassell, I.; Bennett, P.; Middleton, C.; Soga, K. Smart Bridges, Smart Tunnels: Transforming Wireless Sensor Networks from Research Prototypes into Robust Engineering Infrastructure. Ad Hoc Netw. 2010, 8, 872–888. [Google Scholar] [CrossRef]
- Romer, K.; Mattern, F. The design space of wireless sensor networks. IEEE Wirel. Commun. 2004, 11, 54–61. [Google Scholar] [CrossRef]
- Gumiel, J.A.; Mabe, J.; Burguera, F.; Jimenez, J.; Barruetabena, J. Next-Generation Pedal: Integration of Sensors in a Braking Pedal for a Full Brake-by Wire System. Sensors 2023, 23, 6345. [Google Scholar] [CrossRef]
- Bappy, O.; Jiang, Q.; Atampugre, S.; Zhang, Y. Aerosol Jet Printing of High-Temperature Bimodal Sensors for Simultaneous Strain and Temperature Sensing Using Gold and Indium Tin Oxide Nanoparticle Inks. ACS Appl. Nano Mater. 2024, 7, 9453–9459. [Google Scholar] [CrossRef]
- Ding, S.; Yang, C.; Zhang, S. Acoustic-signal-based damage detection of wind turbine blades—A review. Sensors 2023, 23, 4987. [Google Scholar] [CrossRef]
- Wang, H.; Li, Y.; Liu, Z. Fatigue performance and monitoring of diaphragm cutout details in steel bridges. In Proceedings of the 9th International Conference on Bridge Maintenance, Safety and Management, Melbourne, Australia, 9–13 July 2018; pp. 1–10. [Google Scholar]
- Paek, W.; Balasubramanian, S.; Stupples, D. Composites additive manufacturing for space applications: A review. Materials 2022, 15, 4709. [Google Scholar] [CrossRef]
- Dutta, C.; Kumar, J.; Das, T.K.; Sagar, S.P. Recent advancements in the development of sensors for the structural health monitoring (SHM) at high temperature environment: A review. IEEE Sens. J. 2021, 21, 15904–15915. [Google Scholar] [CrossRef]
- Martinotto, L.; Merlo, F.; Donzelli, D. Method for Manufacturing a Braking Element with Integrated Sensor, in Particular a Brake Pad, Brake Pad with Integrated Sensor, Vehicle Braking System and Associated. Method. Patent 9415757, 16 August 2016. [Google Scholar]
- Hehr, A.; Norfolk, M.; Wenning, J.; Sheridan, J.; Leser, P.; Leser, P.; Newman, J.A. Integrating fiber optic strain sensors into metal using ultrasonic additive manufacturing. JOM 2018, 70, 315–320. [Google Scholar] [CrossRef]
- Brown, T.G. Harsh military environments and microelectromechanical (MEMS) devices. In Proceedings of the Sensors, 2003 IEEE, Toronto, ON, Canada, 22–24 October 2003; Volume 2, pp. 753–760. [Google Scholar]
- Yang, T.; Mazumder, S.; Jin, Y.; Squires, B.; Sofield, M.; Pantawane, M.V.; Dahotre, N.B.; Neogi, A. A review of diagnostics methodologies for metal additive manufacturing processes and products. Materials 2021, 14, 4929. [Google Scholar] [CrossRef]
- Stone, J.V. The Fourier Transform: A Tutorial Introduction; Sebtel Press: Sheffield, UK, 2009. [Google Scholar]
- Bracewell, R.N. The Fourier Transform and Its Applications, 3rd ed.; McGraw-Hill: New York, NY, USA, 1999. [Google Scholar]
- Debnath, L.; Shah, F.A. Wavelet Transforms and Their Applications, 2nd ed.; Springer: Cham, Switzerland, 2015. [Google Scholar]
- Akujuobi, C.M. Wavelets and Wavelet Transform Systems and Their Applications; CRC Press: Boca Raton, FL, USA, 2022. [Google Scholar]
- Cheng, J.; Zou, Q.; Zhao, Y. ECG Signal Classification Based on Deep CNN and BiLSTM. BMC Med. Inform. Decis. Mak. 2021, 21, 1–12. [Google Scholar] [CrossRef]
- Lee, Y.; Lim, S.; Kwak, I.Y. CNN-Based Acoustic Scene Classification System. Electronics 2021, 10, 371. [Google Scholar] [CrossRef]
- Byfield, R.; Shabaka, A.; Vargas, M.M.; Tansel, I. Inspection of Additively Manufactured Structures Using Combined Nondestructive Testing (NDT) and Structural Health Monitoring (SHM). J. Vib. Eng. Technol. 2025, 13, 362. [Google Scholar] [CrossRef]
- Chen, H.Y.; Lee, C.H. Deep Learning Approach for Vibration Signals Applications. Sensors 2021, 21, 3929. [Google Scholar] [CrossRef]
- Rajwal, S.; Aggarwal, S. Convolutional Neural Network-Based EEG Signal Analysis: A Systematic Review. Arch. Comput. Methods Eng. 2023, 30, 3585–3615. [Google Scholar] [CrossRef]
- Chen, Y.; Wei, S.; Zhang, Y. Classification of Heart Sounds Based on the Combination of the Modified Frequency Wavelet Transform and Convolutional Neural Network. Med. Biol. Eng. Comput. 2020, 58, 2039–2047. [Google Scholar] [CrossRef]
- Modir, A.; Tansel, I. Analysis of Force Sensing Accuracy by Using SHM Methods on Conventionally Manufactured and Additively Manufactured Small Polymer Parts. Polymers 2022, 14, 1–12. [Google Scholar] [CrossRef]
- Modir, A.; Tansel, I.N. Implementation of the surface thickness on additively manufactured parts for estimation of the loading location. Smart Mater. Struct. 2021, 30, 25032. [Google Scholar] [CrossRef]
- Worden, K.; Dulieu-Barton, J.M. An overview of intelligent fault detection in systems and structures. Struct. Health Monit. 2004, 3, 85–98. [Google Scholar] [CrossRef]
- Worden, K.; Farrar, C.R. An introduction to structural health monitoring. Philos. Trans. R. Soc. A 2007, 365, 303–315. [Google Scholar] [CrossRef]
- Farrar, C.R.; Doebling, S.W.; Nix, D.A. Vibration-based structural damage identification. Philos. Trans. R. Soc. A 2001, 359, 131–149. [Google Scholar] [CrossRef]
- Doebling, S.W.; Farrar, C.R.; Prime, M.B. A summary review of vibration-based damage identification methods. Shock Vib. Dig. 1998, 30, 91–105. [Google Scholar] [CrossRef]
- Brownjohn, J.M.W. Structural health monitoring of civil infrastructure. Philos. Tranacctions R. Soc. A 2007, 365, 589–622. [Google Scholar] [CrossRef]
- Fassois, S.D.; Sakellariou, J.S. Time-series methods for fault detection and identification in vibrating structures. Philos. Trans. R. Soc. A 2007, 365, 411–448. [Google Scholar] [CrossRef]
- Staszewski, W.J.; Robertson, A.N. Time-frequency and time-scale analyses for structural health monitoring. Philos. Trans. R. Soc. A 2007, 365, 449–477. [Google Scholar] [CrossRef]
- Sohn, H. Effects of environmental and operational variability on structural health monitoring. Philos. Trans. R. Soc. A 2007, 365, 539–560. [Google Scholar] [CrossRef]
- Farrar, C.R.; Duffey, T.A.; Doebling, S.W.; Nix, D.A. A statistical pattern recognition paradigm for vibration-based structural health monitoring. Struct. Health Monit. 1999, 2000, 764–773. [Google Scholar]
- Mathew, J.; Hauser, C.; Stoll, P.; Kenel, C.; Polyzos, D.; Havermann, D.; MacPherson, W.N.; Hand, D.P.; Leinenbach, C.; Spierings, A.; et al. Integrating Fiber Fabry-Perot Cavity Sensor Into 3-D Printed Metal Components for Extreme High-Temperature Monitoring Applications. IEEE Sens. J. 2017, 17, 4107–4114. [Google Scholar] [CrossRef]
- Stoll, P.; Gasparin, E.; Spierings, A.; Wegener, K. Embedding Eddy Current Sensors into LPBF Components for Structural Health Monitoring. Prog. Addit. Manuf. 2021, 6, 445–453. [Google Scholar] [CrossRef]
- Lehmhus, D.; Aumund-Kopp, C.; Petzoldt, F.; Godlinski, D.; Haberkorn, A.; Zollmer, V.; Busse, M. Sensor and Electronics Integration in Additive Manufacturing. In Material-Integrated Intelligent Systems: Technology and Applications; Wiley-VCH: Weinheim, Germany, 2017; pp. 217–256. [Google Scholar]
- Zhao, B.; Dong, W.; Hinds, K.; Li, J.; Alnbari, R.; Henry, R. Ultrasonic Additive Manufacturing of Fiber Bragg Grating Sensors with Thermal and Chemical Protection for Hostile Environments. IEEE Sens. J. 2024, 24, 2853–2862. [Google Scholar] [CrossRef]
- Kosir, T.; Slavic, J. Manufacturing of Single-Process 3D-Printed Piezoelectric Sensors with Electromagnetic Protection Using Thermoplastic Material Extrusion. Addit. Manuf. 2023, 73, 103699. [Google Scholar]
- Kosir, T.; Slavic, J. Modeling of Single-Process 3D-Printed Piezoelectric Sensors with Resistive Electrodes: The Low-Pass Filtering Effect. Polymers 2022, 15, 158. [Google Scholar] [CrossRef]
- Hassan, S.; Zaman, S.; Dantzler, J.Z.R.; Leyva, D.H.; Mahmud, S.; Ramirez, J.M.; Gomez, S.G.; Lin, Y. 3D Printed Integrated Sensors: From Fabrication to Applications—A Review. Nanomaterials 2023, 13, 3148. [Google Scholar] [CrossRef]
- Stoll, P.; Mathew, J.; Spierings, A.; Bauer, T.; Maier, R.R.J.; Wegener, K. Embedding Fibre Optical Sensors into SLM Parts. In Proceedings of the 27th Annual International Solid Freeform Fabrication Symposium—An Additive Manufacturing Conference, Austin, TX, USA, 8–10 August 2016. [Google Scholar]
- Jiang, P.; Liu, X.; Chen, X.; He, S.; Wang, Y.; Chen, X.; Zhang, X.; Zhou, G. Recent Advances in 3D Printed Sensors: Materials, Design, and Manufacturing. Adv. Mater. Technol. 2023, 8, 2200492. [Google Scholar]
- Maier, R.R.J.; Havermann, D.; MacPherson, W.N.; Hand, D.P. Embedding Metallic Jacketed Fused Silica Fibres into Stainless Steel Using Additive Layer Manufacturing Technology. In Proceedings of the Fifth European Workshop on Optical Fibre Sensors (EWOFS 2013), Krakow, Poland, 19–22 May 2013. [Google Scholar]
- Janas, V.F.; Safari, A. Overview of Fine-Scale Piezoelectric Ceramic/Polymer Composites for Acoustic Transducers. J. Am. Ceram. Soc. 1995, 78, 2945–2955. [Google Scholar] [CrossRef]
- Wersing, W. Composite Piezoelectrics for Ultrasonic Transducers. In Proceedings of the IEEE International Symposium on Applications of Ferroelectrics (ISAF), Bethlehem, PA, USA, 8–11 June 1986. [Google Scholar]
- Krimholtz, M.; Leedom, D.A.; Matthaei, G.L. New equivalent circuits for elementary piezoelectric transducers. Electron. Lett. 1970, 6, 398–399. [Google Scholar] [CrossRef]
- Bloomfield, P.E.; Lo, W.J.; Lewin, P.A. Experimental study of the acoustical properties of polymers utilized to construct PVDF ultrasonic transducers and the acousto-electric properties of PVDF and P(VDF/TrFE) films. IEEE Trans. Ultrason. Ferroelectr. Freq. Control. 2000, 47, 1397–1405. [Google Scholar]
- Zhou, Q.; Lau, S.; Wu, D.; Shung, K.K. Piezoelectric films for high-frequency ultrasonic transducers in biomedical applications. Prog. Mater. Sci. 2011, 56, 139–174. [Google Scholar]
- Sinclair, A.N.; Chertov, A.M. Radiation endurance of piezoelectric ultrasonic transducers—A review. Ultrasonics 2015, 57, 1–10. [Google Scholar]
- Shung, K.K.; Cannata, J.M.; Zhou, Q. Piezoelectric materials for high-frequency medical imaging applications: A review. J. Electroceramics 2007, 19, 141–147. [Google Scholar] [CrossRef]
- Lethiecq, M.; Levassort, F.; Certon, D.; Tran-Huu-Hue, L. Piezoelectric Transducer Design for Medical Diagnosis and NDE. In Piezoelectric and Acoustic Materials for Transducer Applications; Springer: Boston, MA, USA, 2008; pp. 191–215. [Google Scholar]
- Lee, W.; Roh, Y. Ultrasonic transducers for medical diagnostic imaging. Biomed. Eng. Lett. 2017, 7, 91–97. [Google Scholar] [CrossRef]
- Foster, F.; Harasiewicz, K.; Sherar, M.D. A history of medical and biological imaging with polyvinylidene fluoride (PVDF) transducers. IEEE Trans. Ultrason. Ferroelectr. Freq. Control. 2000, 47, 1363–1371. [Google Scholar] [CrossRef]
- Su, Z.; Ye, L.; Lu, Y. Guided Lamb waves for identification of damage in composite structures: A review. J. Sound Vib. 2006, 295, 753–780. [Google Scholar] [CrossRef]
- Cawley, P. Guided waves in long-range nondestructive testing and structural health monitoring: A review. Ultrasonics 2024, 142, 106834. [Google Scholar]
- Rose, J.L. A baseline and vision of ultrasonic guided wave inspection potential. J. Press. Vessel Technol. 2002, 124, 273–282. [Google Scholar] [CrossRef]
- Zhao, X.; Royer, R.L.; Owens, S.E.; Rose, J.L. Ultrasonic Lamb wave tomography in structural health monitoring. Smart Mater. Struct. 2011, 20, 105002. [Google Scholar] [CrossRef]
- Su, Z.; Ye, L. Fundamentals and Analysis of Lamb Waves. In Identification of Damage Using Lamb Waves; Springer: London, UK, 2009; pp. 15–58. [Google Scholar]
- Stepinski, T.; Martowicz, A.; Manka, M. Interdigital transducers in structural health monitoring based on Lamb waves—A state of the art. NDT E Int. 2016, 78, 199–213. [Google Scholar]
- Alleyne, D.N.; Cawley, P. The excitation of Lamb waves in pipes using dry-coupled piezoelectric transducers. J. Nondestruct. Eval. 1996, 15, 11–20. [Google Scholar] [CrossRef]
- Croxford, A.J.; Wilcox, P.D.; Drinkwater, B.W.; Konstantinidis, G. Strategies for guided-wave structural health monitoring. Proc. R. Soc. A 2007, 463, 2961–2981. [Google Scholar] [CrossRef]
- Wilcox, P.D.; Konstantinidis, G.; Croxford, A.J.; Drinkwater, B.W. Strategies for guided wave structural health monitoring. In Review of Progress in Quantitative Nondestructive Evaluation; American Institute of Physics: New York, NY, USA, 2006. [Google Scholar]
- Raghavan, A.; Cesnik, C.E.S. Review of guided-wave structural health monitoring. Shock Vib. Dig. 2007, 39, 91–114. [Google Scholar] [CrossRef]
- Wang, B.-C. Digital Signal Processing Techniques and Applications in Radar Image Processing; Wiley: Hoboken, NJ, USA, 2008. [Google Scholar]
- Debnath, L. Time-frequency analysis. In Wavelets and Signal Processing; Birkhäuser: Boston, MA, USA, 2003; p. 435. [Google Scholar]
- Zhong, J.; Huang, Y. Time-Frequency Representation Based on an Adaptive Short-Time Fourier Transform. IEEE Trans. Signal Process. 2010, 58, 5118–5128. [Google Scholar] [CrossRef]
- Durak, L.; Arikan, O. Short-time Fourier transform: Two fundamental properties and an optimal implementation. IEE Trans. Signal Process. 2003, 51, 1231–1242. [Google Scholar] [CrossRef]
- Ye, X.W.; Jin, T.; Yun, C.B. A review on deep learning-based structural health monitoring of civil infrastructures. Smart Struct. Syst. 2019, 24, 267–286. [Google Scholar]
- Qin, L.; Liu, H.; Han, D. Damage identification for composite structures using Lamb-wave signals and one-dimensional CNNs. Compos. Struct. 2020, 246, 112454. [Google Scholar]
- Abdeljaber, O.; Avci, O.; Kiranyaz, S.; Gabbouj, M.; Inman, D.J. Real-time vibration-based structural damage detection using one-dimensional convolutional neural networks. J. Sound Vib. 2017, 388, 154–170. [Google Scholar] [CrossRef]
- Dorafshan, S.; Maguire, M.; Hoffer, N. Bridge crack detection using deep learning: Data collection and network design. Constr. Build. Mater. 2018, 186, 580–590. [Google Scholar]
- Gopalakrishnan, K.; Khaitan, S.K.; Choudhary, A.; Agrawal, A. Deep convolutional neural networks with transfer learning for crack detection in built infrastructure. Eng. Comput. 2018, 34, 113–122. [Google Scholar]
- Li, S.; Zhao, X.; Zhou, G.; Ou, J. Vision-based fatigue crack detection of steel bridges using transfer learning and CNNs. J. Bridge Eng. 2021, 26, 04021009. [Google Scholar]
- Bao, Y.; Tang, Z.; Li, H.; Zhang, Y. Computer vision and deep learning-based data anomaly detection for structural health monitoring. Struct. Health Monit. 2019, 18, 401–421. [Google Scholar]
- Cha, Y.J.; Choi, W.; Büyüköztürk, O. Deep learning-based crack damage detection using convolutional neural networks. Comput.-Aided Civ. Infrastruct. Eng. 2017, 32, 361–378. [Google Scholar] [CrossRef]
- Xu, Y.; Turkan, Y. Vision-based crack detection using deep learning and convolutional neural networks. Autom. Constr. 2019, 91, 196–206. [Google Scholar]
- Dung, C.V.; Anh, L.D. Autonomous concrete crack detection using deep fully convolutional neural network. Autom. Constr. 2019, 99, 52–58. [Google Scholar] [CrossRef]
- Zhang, L.; Yang, F.; Zhang, Y.D.; Zhu, Y.J. Road crack detection using deep convolutional neural network. Image Vis. Comput. 2016, 57, 103–113. [Google Scholar]
- Fekrmandi, H.; Rojas, J.; Tansel, I.N.; Yapici, A.; Uragun, B. Investigation of the computational efficiency and validity of the surface response to excitation method. Measurement 2015, 62, 33–40. [Google Scholar] [CrossRef]
- Baghalian, A.; Tashakori, S.; Senyurek, V.Y.; McDaniel, D.; Fekrmandi, H.; Tansel, I.N. Non-contact quantification of longitudinal and circumferential defects in pipes using the surface response to excitation (SuRE) method. Int. J. Progn. Health Manag. 2017, 8, 1–8. [Google Scholar] [CrossRef]
- Tashakori, S.; Baghalian, A.; Unal, M.; Senyurek, V.Y.; Fekrmandi, H.; McDaniel, D.; Tansel, I.N. Load Monitoring Using Surface Response to Excitation Method, in Mechanics of Composite and Multi-functional Materials. In Volume 7: Proceedings of the 2016 SEM Annual Conference & Exposition on Experimental and Applied Mechanics; Springer International Publishing: Cham, Switzerland, 2017; pp. 209–214. [Google Scholar]
- Tansel, I.N.; Grisso, B.L.; Singh, G.; Korla, S.; Salvino, L.W. Health monitoring of aluminum weldings with the surface response to excitation (SuRE) approach. In Structural Health Monitoring 2011: Condition Based Maintenance and Intelligent Structures (8th IWSHM); DEStech Publications, Inc.: Stanford, CA, USA, 2011. [Google Scholar]
- Ono, K. A Comprehensive Report on Ultrasonic Attenuation of Engineering Materials, Including Metals, Ceramics, Polymers, Fiber-Reinforced Composites, Wood, and Rocks. Appl. Sci. 2020, 10, 2230. [Google Scholar] [CrossRef]
- Pylaev, A.E.; Kostikova, E.A.; Yurkov, A.L.; Kalugin, D.I.; Malakho, A.P.; Avdeev, V.V.; Lepin, V.N.; Oktyabr’skaya, L.V.; Minchuk, S.V. Velocity and attenuation of acoustic waves in polymers and polymer composites. Polym. Sci. Ser. D 2018, 11, 272–276. [Google Scholar] [CrossRef]
Disclaimer/Publisher’s Note: The statements, opinions and data contained in all publications are solely those of the individual author(s) and contributor(s) and not of MDPI and/or the editor(s). MDPI and/or the editor(s) disclaim responsibility for any injury to people or property resulting from any ideas, methods, instructions or products referred to in the content. |
© 2025 by the authors. Licensee MDPI, Basel, Switzerland. This article is an open access article distributed under the terms and conditions of the Creative Commons Attribution (CC BY) license (https://creativecommons.org/licenses/by/4.0/).