Abstract
The development of smart cities will require the construction of smart buildings. Smart buildings will demand the incorporation of elements for efficient monitoring and control of electrical consumption. The development of efficient AI algorithms is needed to generate more accurate electricity consumption predictions; therefore; anomaly detection in electricity consumption predictions has become an important research topic. This work focuses on the study of the detection of anomalies in domestic electrical consumption in Mexico. A predictive machine learning model of future electricity consumption was generated to evaluate various anomaly-detection techniques. Their effectiveness in identifying outliers was determined, and their performance was documented. A 30-day forecast of electrical consumption and an anomaly-detection model have been developed using isolation forest. Isolation forest successfully captured up to 75% of the anomalies. Finally, the Shapley values have been used to generate an explanation of the results of a model capable of detecting anomalous data for the Mexican context.
1. Introduction
The construction of smart cities will require smart buildings [1]. Smart buildings will demand the incorporation of elements for efficient monitoring and control of electricity consumption [2]. In developed countries, this may already be a reality; however, in developing countries, there is still a long way to go to achieve this goal [3]. In Latin America, the incorporation of the Internet of Things (IoT) in buildings and homes could be a challenge [4]. In Mexico, the majority of buildings are aging structures that lack the required infrastructure for the use of IoT or artificial intelligence (AI) technologies [5].
In [6], a platform for monitoring and controlling domestic electricity consumption using the IoT and AI is proposed for the Mexican context. This platform analyses combined data to provide temporal information about energy consumption. Another example of IoT-enabled smart sensors in buildings is presented in [7], where the authors study temporal and spatial user behaviors in an office. To continue progressing in this direction, the development of efficient AI algorithms is needed to generate more accurate electricity consumption predictions.
Electricity consumption is a key indicator of the economic and social development of a region or country. Monitoring and predicting electricity consumption are essential to ensure the security of the electricity supply, energy usage planning, cost reduction, and efficient management of energy resources [8,9]. However, the accuracy of electricity consumption predictions is affected by many factors, such as weather, the economy, and consumer behavior, among others [10].
In this context, anomaly detection in electricity consumption predictions has become an important research topic [11]. Anomaly detection can help identify outliers in predictions and improve their accuracy. Furthermore, anomaly detection can also be useful for identifying unexpected events, such as power grid failures or changes in consumer behavior [12]. However, there are some important challenges in the anomaly detection of energy consumption from buildings remaining [10], such as (i) the lack of precise definitions of anomalous energy consumption, (ii) the lack of annotated datasets, (iii) the consensus of the metrics to evaluate existing solutions, (iv) interpretable AI models, and (v) privacy-preservation issues.
On the other hand, there is an effort by various researchers worldwide to implement models and algorithms to a greater extent that produce results interpretable by the end-user, whether or not they have a technical background. This trend, known as “explainable AI” (XAI), leans towards methodologies known as “white-box” models, where the procedure for determining a result is known and interpretable. This type of methodology contrasts with those called “black-box” models, where the procedures for reaching the results are not known.
1.1. Electric Consumption in Mexico
The use and availability of electric energy are important characteristics that developed areas of the world must possess. According to data from the National Institute of Statistics and Geography (INEGI) [13], 99% of inhabited homes in Mexico have electric power. Based on data collected from the 2022–2026 business plan published by the Federal Electricity Commission (CFE), this organization produces 54% of the electric power annually in Mexico. To this figure, it is necessary to add 30.1% of electric power generated by independent private producers, known by their acronym PIE. This activity consists of generating electric power and selling it exclusively to the CFE. In this way, the CFE covers more than 80% of the Mexican market. Likewise, there are up to 71 different participants in the wholesale electricity market, where Iberdrola of Mexico and Enel Green Power Mexico stand out as the second- and third-largest generators and distributors of electricity after the CFE.
Rates
The CFE manages different rates for domestic electric power consumption. There are two types of rates: normal consumption rates and high consumption rates (DAC). Normal consumption rates are determined by the geographic region in which the home is located, assuming that the geographic region has a direct relationship with the recorded temperature. In reality, the factor that determines which type of normal rate a home has is the minimum average temperature recorded during the summer season. A region is considered to have reached the minimum average temperature in summer when these values reach the corresponding limit for three or more years. At the same time, it is considered that, during a year, the indicated limit is reached when the monthly average temperature is recorded for two or more consecutive months, according to reports prepared by the Secretariat of Environment and Natural Resources.
It is important to know the region and rate scheme to which one belongs because each has an annual consumption limit for which, if exceeded, the Federal Electricity Commission establishes the rate scheme known as DAC. This rate scheme applies when the average monthly consumption higher than the established limit for the region is recorded. The average monthly consumption corresponds to the average consumption over the last twelve months. Table 1 summarizes the different rates available for domestic consumption, as well as their respective average monthly limits for the DAC rate.

Table 1.
CFE rate scheme for domestic consumption. Source: CFE.
There is a single DAC rate regardless of the rate where the household is located. There is an additional division in the DAC rate to determine the amount that will be charged for consumption. This division is geographical, and the regions are Central, Northwest, North, Northeast, South, and Peninsular. The DAC rate is somewhat of a penalty for the consumer for excessive or improper use of electric energy. This is due to the considerable jump in charges per kilowatt-hour consumed. Considering a rate 1 and a DAC rate for the northeast region, the increase in charge per kWh consumed is 61%.
By analyzing the rating scheme used by the CFE, the context and relevance of the importance of monitoring and preventing electric consumption in a household is established, as a series of consumption increases can lead to a rate change that represents an increase in fixed expenses for consumers.
In this work, an approach for anomaly detection in electricity consumption predictions is proposed, utilizing data collected within a residential household from a city located in the northeast of Mexico, using smart sensors.
The objective of this work is to establish a framework to determine whether an electricity consumption prediction is anomalous or not, to develop a model capable of predicting future electricity consumption based on available historical patterns and data, and to identify anomalous values within this prediction. The proposed prediction model will utilize historical consumption data and other atmospheric variables to generate a 30-day forecast of electricity consumption. Once the forecast has been obtained, various anomalies will be introduced into the time series of the electricity consumption forecast to create a basis for measuring the performance of different metrics in various anomaly detection techniques.
1.2. Structure of the Manuscript
This paper is organized as follows. Section 2 presents the relevant literature review. Section 3 describes the materials and methods used in this research, while the experimental setup is presented in Section 4. The experimental results are presented in Section 5 and discussed in Section 6. Finally, the most relevant findings and potential future research are presented in Section 7.
2. Literature Review
No algorithm or technique is efficient in all possible cases or domains of a given problem. This is known as the “no free lunch theorem” [14]. Therefore, there are multiple algorithms and techniques for anomaly detection studied and applied in different domains, contexts, and situations. For the analysis, energy consumption is represented as a time series. Therefore, due to their nature of sequential features and temporal dependencies, the current trend is towards the development and implementation of convolutional neural networks [15] and transformers [16] to forecast and detect anomalies in time series. In [15,16], the authors make similar observations to the authors of [17], where they agree on the significant amount of data required to implement these techniques, as well as their demonstrated capability to extract temporal dependencies from a time series. Moreover, the authors of [18,19] highlight, as an important challenge, the lack of labeled datasets for evaluating anomaly-detection tasks. Labeling whether an observation is anomalous or not poses a challenge, thus explaining the scarcity of such datasets. Existing datasets for this purpose may have labeled anomalies, but these anomalies often differ widely from the norm and do not pose a broad challenge for different detection models [20].
This is where the methodology used by different authors to voluntarily modify data for anomaly generation within their study framework becomes relevant. It is interesting to analyze the motivations, justifications, and steps taken to alter the data presented in each study. The main motivation found is precisely the lack of certainty about which points can be classified as anomalous [21].
Table 2 presents a summarized literature review with some of the most related works compared against our approach (in bold at the end of the table). An analysis was made to identify the most important characteristics of the dataset used in previous studies, such as the source of the data, their geographical location, the elapsed time of the data, if weather data are included, and a brief description of the building where the data come from. The table also classifies the previous works based on the problem they tackled in every proposal. The problem can be prediction (forecast), outlier detection, or both. The table then explains the methods and metrics used. Finally, the table specifies if an XAI analysis was conducted.

Table 2.
Comparison of literature review. Source: own elaboration.
Currently, almost in any research field, there exists a clear tendency to use deep learning. Considering the techniques presented in Table 2, it can be observed that there are a vast number of techniques employed to predict or detect outliers in energy consumption from buildings. Table 2 also shows that some of the datasets are specific to geographical areas where the authors had access to the data and others come from public repositories. The majority of the datasets include variables related to climate conditions. All studies consider a period of analysis for at most 2 years. Another aspect to consider in this literature review is the use of outlier detection. There are only two studies that use outlier detection in their forecast procedure, which showed that improved results were obtained [22,23]. Additionally, we find that there is no consensus on which metrics should be considered to compare the results obtained by the different techniques, in consumption forecast and outlier detection. Finally, none of the previous works presented in Table 2 had performed an XAI analysis, although some authors had established it as a new challenge in this context and others [34].
In summary, the contribution of this work focuses on the analysis of data relevant to a northeastern region of Mexico, using a context-based anomaly definition. That is, establishing which observations will be considered anomalous and which normal. A hybrid analysis based on prediction and outlier detection problems is proposed, and statistical and machine learning techniques are compared for both tasks to highlight the contrast between them. Finally, an implementation of interpretability or explanation of the obtained results by an unsupervised learning methodology is proposed.
3. Materials and Methods
3.1. Methodology
The approach followed in this work is displayed in Figure 1, where a public dataset containing energy consumption data was prepared and explored to understand its behavior as a time series. Then, various regression models to predict energy consumption were trained and evaluated. The best regression model was selected to provide accurate energy consumption predictions and generate artificial anomalies to train and evaluate three different anomaly-detection models as well. Once the best anomaly-detection model was obtained, a scenario to detect unknown anomalies and explain them was studied.
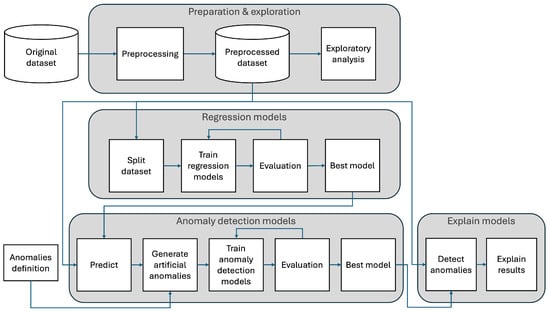
Figure 1.
Methodology. Source: own elaboration.
3.2. Performance Metrics
It is necessary to carry out evaluations of the values obtained by the regressors to predict values with the minimum error. The performance metrics considered are the following [35]:
- Mean Absolute Error (MAE): This is the average of the absolute differences between the forecast value and the actual value.
- Mean-Squared Error (MSE): This is the average of the squared differences between the forecast value and the actual value.
- Mean Absolute Percentage Error (MAPE): This is the absolute average of the differences between the forecast value and the actual value in percentage terms.
The next metrics were used to evaluate the performance of the anomaly-detection models [36]:
- Accuracy is the metric that measures the proportion of correct predictions considering the total predictions made by a model. That is to say, of all the predictions made, enumerate the correct ones.
- Precision is the proportion of correct positive predictions considering the total positive or true predictions made by the model. That is to say, of all the positive predictions made by the model, enumerate the correct ones.
- Recall, or sensitivity, is the metric that measures the proportion of positive instances that a model can identify considering the total number of positive instances present in the dataset, in other words the measurement of how many of the total correct answers have been identified.
- The F1-score is a measure that combines precision and recall into a single value, calculated as the harmonic mean of both metrics.
3.3. Regression Techniques
Random Forest (RF)
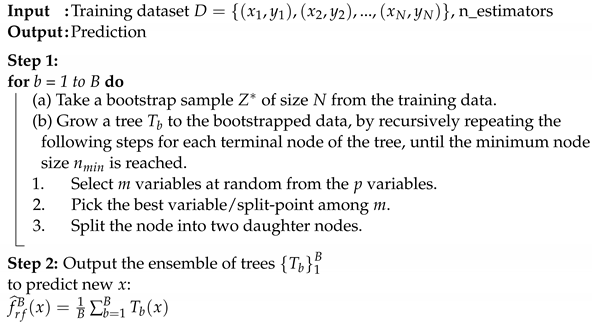
The random forest technique [37] was employed for regression and forecasting in this research. RF is a supervised machine learning algorithm that builds a large collection of de-correlated trees, , and then averages them. RF is a modification of the bagging method, where the main idea is to average many noisy, but approximately unbiased models. For the regression task, let be a training dataset and be the prediction for an input x. The bagging procedure averages this prediction over a collection of bootstrap samples, thereby reducing its variance. For each bootstrap sample , , the regression model is fit, obtaining the prediction . Finally, the bagging estimate is defined by
In this sense, decision trees are ideal for bagging because they are intrinsically noisy and can benefit from averaging. The idea in random forests is to improve the variance reduction of bagging by reducing the correlation between the trees, without increasing the variance too much. In other words, this approach eliminates the tendency of decision trees to overfit their training data [23]. Essentially, this method generates multiple independent decision trees, each representing a decision-making pathway in tree-like graphical form in a randomized manner during training to form a forest. Each decision tree contributes to the final prediction. In regression, the result is the average prediction of the outcomes from each tree in the forest [38]. The RF approach is depicted in Algorithm 1.
| Algorithm 1: Random forest for regression. |
 |
3.4. Anomaly Detection Techniques
3.4.1. Median Absolute Deviation (MAD)
This is a statistical technique that uses the median (in contrast to many others, which use the average) generally in situations where the data are unbalanced or are known to contain outliers because it is less sensitive to extreme values [39].
The first step is to calculate the median of the data. Once the median has been obtained, as a second step, for each observation in the data, the absolute deviation is calculated, which is given by the difference between each observation and the median calculated in step 1. Finally, the MAD value is obtained by obtaining the median of the absolute deviations from step 2.
The calculation of the MAD is given by Equation (2):
To use the MAD in the anomaly-detection task, it is necessary to set a limit or threshold. This limit is a multiple of the calculated MAD. To determine whether an observation is an anomaly, the absolute deviation of the observation is compared with the limit; if it exceeds it, it will be considered an anomalous observation. The above is shown in Equation (3):
3.4.2. Isolation Forest (IF)
From the date of its publication until today, this algorithm has had relevance in different areas. The authors announced it as a new approach based on the concept of isolating anomalies using binary trees [40]. The main idea of this algorithm is that anomalous points will be isolated into shorter paths in the binary trees within the ensemble or forest of isolation trees. This technique is efficient for large datasets, as well as medium or small datasets. This algorithm does not make any assumptions about the distribution of the data, is effective in high-dimensional spaces, and provides an anomaly score that can be analyzed in depth to achieve a more detailed interpretation of the analysis.
This technique analyzes each observation within the data and measures how quickly it can be isolated or separated from the other observations. Observations that are significantly different are more likely to be quickly isolated. Within the algorithm, different random trees are created where the data are divided into smaller groups each time. When there is an anomalous observation, it tends to have a shorter path within the random trees, or in other words, fewer steps are necessary to separate that anomalous observation from the others. By analyzing all random trees, the algorithm identifies all observations that consistently have the shortest paths. These observations will probably be anomalous compared to the rest.
Some advantages over other methods are as follows:
- Isolation forest allows the building of partial models, i.e., some large parts of the trees do not need to be constructed.
- IF does not use distance or density measures to detect anomalies, which eliminates the significant computational cost involved in calculating distances in other density- or distance-based methods.
- Isolation forest has a linear time complexity with a low constant and a low memory requirement.
The algorithm calculates an anomaly score by repeating this process; the anomaly is standardized between zero and one and is given by Equation (4):
where
is the harmonic number equal to + 0.5772 (Euler constant).
To use the technique in the context of anomaly detection, a limit value must be determined, where if the score is lower than said value, the point in question will be considered anomalous, as shown in Equation (5).
3.4.3. Local Outlier Factor (LOF)
Introduced at the beginning of the 21st Century, this anomaly-detection technique measures the difference of an observation based on its neighbors [41]. The central idea is that, to identify anomalous observations, we examine how isolated they are compared to their nearby neighborhood. The calculation of the LOF is given by Equation (6).
where
The technique makes use of Local Reachability Density (LRD), which is given by Equation (7), and it is a measure used to evaluate the abnormality of a specific point considering its neighbors.
where
The relative range density is defined as the maximum of the k-distance of the neighbor point and the distance between two points. In simpler words, it is the distance needed to travel from a specific point to its neighbor point [42].
3.4.4. Backtesting
The cross-validation process carried out in time series is known as backtesting, where the main and fundamental characteristic is that the temporal order of the data in the time series is maintained, instead of the classic scope of cross-validation, where random distributions of observations are made in the data.
The temporal order of the data in the time series is maintained by introducing an incremental scope from the past to the future. In this approach, data are enabled for model training or testing as it progresses through the time series. This process is performed using a selected feed or window parameter, which determines the amount of data considered in each iteration of the model.
Within these practices, there is the combination of sliding windows and retraining. That is, the backtesting process consists of advancing towards the future n number of steps determined by the value of the sliding window, training the model with the available data in each of the advances and evaluating it with the corresponding section of the test data, within the panorama selected for this instance of backtesting, as shown in Figure 2. The process is repeated the determined number of times or until the available data are exhausted. In each evaluation of the model, the different metrics of interest are collected to draw conclusions once the process is completed.
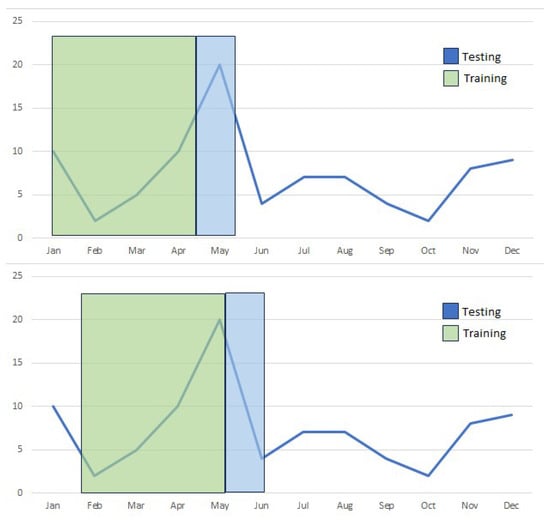
Figure 2.
The window size causes the time series to be traversed by training and evaluating the model over time. Source: own elaboration.
3.5. Explainable Artificial Intelligence (XAI)
In recent years, there has been an intense discussion in the scientific community about what explainable artificial intelligence is, what it encompasses, what studies there should be, or what it should be [43]. Explainable artificial intelligence or explainable AI (XAI) seeks to ensure that developments and models of artificial intelligence, machine learning, or statistics are interpretable to human beings. That is, the developments can be transparent about how it works so that humans can understand and interpret the results provided by the model or development in question. Explainable artificial intelligence solves the challenge of explaining how and why artificial intelligence models make certain decisions, especially in the case of possible predictions or recommendations of significant impact on the people and organizations involved.
Within the context of this work, when using time series data, it is essential to understand how the characteristics of the data are used and how they affect the prediction or the task at hand. Data science and artificial intelligence models, algorithms, and methods can capture complex patterns in time series data. However, its “black-box” nature makes it difficult to explain these decisions.
3.6. Data
The data used in this work correspond to a residential household dataset [33]. The data consist of readings collected every minute within a date range from 5 November 2022 to 12 August 2023, in a residential household in a city in northeastern Mexico. The dataset is a time series containing 402,359 observations and 19 variables, and 17 of the numerical variables were considered. Table 3 shows a brief sample of the original dataset.

Table 3.
Original data sample of 17 numerical variables taken from [33]. Source: own elaboration.
3.7. Data Preparation
The data were transformed by grouping them into daily intervals, as they were originally in minutes. This was performed to condense the database and enable training and forecasting by day, instead of by minute. Similarly, data corresponding to incomplete days collected in the dataset at the beginning and end of it were discarded.
Seventeen numerical variables from the original dataset were selected based on their relevance to the problem at hand. These variables were chosen because they are the most relevant to the research objective. The variables for electric consumption, current, and voltage are essential for understanding the current situation of the electrical grid, while the variables for temperature, pressure, and humidity help contextualize the environment and surroundings where the readings are being taken. A reduced number of variables simplifies the model and can facilitate the interpretation of the results. The selected variables are listed below:
- active_power: This is the amount of electric consumption measured in watts per minute in the sensor reading over the specified time period.
- current: This is the amount of current measured in amperes in the sensor reading over the specified time period.
- voltage: This is the amount of voltage measured in volts in the sensor reading over the specified time period.
- temp: This is the temperature measured in degrees Celsius in the sensor reading over the specified time period.
- pressure: This is the amount of atmospheric pressure measured in hectopascals in the sensor reading over the specified time period.
- humidity: This is the amount of absolute air humidity in the sensor reading over the specified time period.
For the grouping or aggregation of the data, that is from minutes to days and based on the nature of the variables, sum or average operations were performed, as shown in Table 4.

Table 4.
Operations performed for data grouping. Source: own elaboration.
The variable named active_power records the value of electric consumption in units of watts per minute. The daily consumption is computed by adding all the minute data registered during each day. The data were transformed into kilowatt-per-hour units, the unit used to measure electric consumption in Mexico. Thus, the variable formerly known as active_power after this transformation has been designated as kWh.
The result was a dataset of 279 observations and six variables, where each observation corresponds to the value recorded over one day, covering a period from 6 November 2022 to 11 August 2023. Table 5 shows an example of the data after the transformations described in this section.

Table 5.
Transformed data sample. Source: own elaboration.
4. Experimental Setup
4.1. Regression Prediction Models
Through the analysis of the partial autocorrelation plot (see Figure 3), the number of lags to use during the training and testing of the regression models was determined [44].
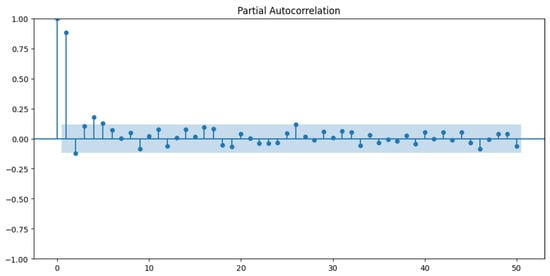
Figure 3.
Partial autocorrelation plot of the electricity consumption variable kWh in a domestic electricity consumption time series. Source: own elaboration.
The Python library, Skforecast [45], was used to forecast the dependent multiple time series. It is important to specify which regressor will be used to forecast the time series and define the regressor hyperparameters. The library can use any regressor included in the sklearn library [46].
The regressors tested were Ridge [47], Lasso [48], random forest regressor [49], XGBoost Regressor [50], and AdaBoost Regressor [51]. An optimization of the main hyperparameter, displayed in Table 6, was conducted to improve the results of each regressor.

Table 6.
Summary of the hyperparameters for the predictive regressors. Source: own elaboration.
By combining the scopes of grid search [52] and backtesting [53], the predictive models were analyzed using nested cross-validation [54]. This approach not only seeks the best combination of hyperparameters for one or several regressors, but also evaluates the model’s performance across different epochs or periods in the time series.
4.2. Anomaly Definition
Defining an anomaly interval or an atypical region is an important aspect of any work related to outlier detection. The definition of this interval will determine which observations will be considered anomalous. Based on information collected and consulted from various sources [55,56], it has been determined that the anomaly interval consists of increases or decreases in electricity consumption in three different categories. Overall, anomalies in households can be caused by different factors, such as failures of appliances and sensors, bugs in the electrical system, blackouts, holidays, vacations, etc. These three categories refer to the different scenarios that can occur in real life when monitoring electricity consumption. The categories can be found in Table 7, and they consist of the following cases:

Table 7.
Three categories used to generate anomalies. Source: own elaboration.
- Increasing consumption (A): Anomalies include consumption predictions that are 15% above the consumption recorded on the same day, for example when more people are visiting the household because of a celebration or party.
- Decreasing consumption (B): Anomalies include consumption that decreases up to 85% below the original value, for instance people who are not at home and on a vacation.
- Anomalies generated by electrical noise (C): Another type of anomaly is included, which is generated by introducing a signal of electrical noise, in this case white noise. Examples include problems with an appliance or shortcuts.
Each of the categories included in Table 7 simulates real-life anomalies in the context of household electricity consumption. Category A refers to increases (factor f upwards) in electricity consumption caused by the inhabitants staying home longer due to the absence of school or work responsibilities, as well as potential visits. These events occur on holidays or weekends and, therefore, are very frequent. Category B focuses on the assumption that, during winter and summer seasons, electricity consumption remains consistently high and similar; the anomaly involves generating decreases (factor f downwards) in electricity consumption. This also symbolizes an absence or a noticeable lack of activity within the household, for instance during vacations. This category occurs with lower frequency than the events in category A. Category C simulates a white or Gaussian noise signal, representing a type of electrical noise that these kinds of electrical signals commonly encounter [57].
Regarding white noise, it is important to mention the adaptations made. The values of the white noise signal were subjected to the absolute value to avoid negative electricity consumption when modifying the forecast value. Additionally, the signal values were limited to a minimum and maximum of 0.78 and 1.18, respectively. These values are slightly lower and higher than the limits of categories A and B. By limiting these values, we ensure obtaining modified consumptions that remain within the possible electricity consumption range for domestic use.
4.3. Anomaly Detection Models
Once the best-performing prediction model has been obtained from the procedures explained in Section 4.1; we proposed to alter the forecast produced by this model to generate anomalies within our dataset and, thus, labeled each observation as anomalous or normal. The period corresponding to the forecast used for alteration and anomaly generation is from 13 July 2023 to 11 August 2023, which represents the last 30 days of the dataset. The following criteria were used to alter the observations within the electricity consumption forecast time series:
- The forecast was made for 30 days.
- Three different categories of anomalies (see Table 7) were established.
- Twenty percent of the observations (i.e., six days) were randomly altered (based on the frequency of Table 7, three days for category A, two days for category B, and one day for category C).
- Each randomly selected date was multiplied by a factor f based on the values shown in Table 7.
- The randomly selected dates do not repeat. There are always six different dates.
The outlier detection methods tested in this work were: Median Absolute Deviation (MAD), isolation forest (IF), and the Local Outlier Factor (LOF). These methods were compared using accuracy, precision, recall, and the F1-score as metrics. A methodology has been designed to subject each anomaly detection method to a robust evaluation process according to the following criteria:
- The data corresponding to random dates were modified following the previously mentioned criteria to generate an anomaly.
- The method was trained using the altered data (anomaly inclusion process) from the forecast generated by the prediction model.
- The metrics of accuracy, precision, recall, and the F1-score were calculated by evaluating the method with the modified anomalous forecast.
- The process was iterated 30 times, and the metrics of interest were collected in each iteration.
- An average of the metrics of interest was calculated as the final result.
- Once the 30 iterations were completed, the process began again with a different criterion or hyperparameter, depending on the method.
- After completing the 30 iterations for each criterion or hyperparameter to be evaluated, the final result was the average obtained over the 30 iterations for each criterion or hyperparameter.
Each method contains different criteria or hyperparameters, which can be fine-tuned according to the needs of the problem or application (see Table 8). All hyperparameters tuned in this work were chosen based on their relevance and impact on the performance of each respective technique. For instance, the hyperparameter in the isolation forest method defines the number of estimators used, and by increasing its value, the model’s ability to identify outliers increases as well [58]. Therefore, the evaluation methodology includes the process of selecting different values to achieve a grid search similar to the approach used during the selection of the regressor for generating the electricity consumption forecast. Additionally, cross-validation was performed by evaluating the chosen value at different points in the time series during each iteration.

Table 8.
Summary of the hyperparameters for the anomaly detection methods. Source: own elaboration.
5. Results
5.1. Exploratory Analysis
The exploratory data analysis began with a visualization of the time series data. Figure 4 shows the behavior of variable kWh over time with its patterns, peaks, valleys, and trends.
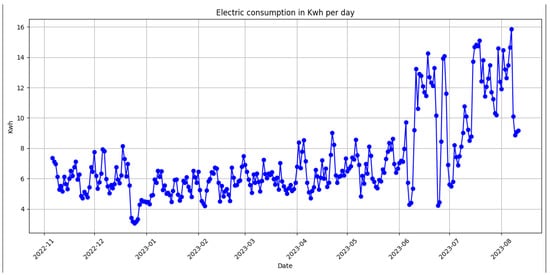
Figure 4.
Electricity consumption in kWh per day. Source: own elaboration.
5.1.1. Stationarity Test
Similarly, the Augmented Dickey–Fuller test (ADF) [59] allows us to determine whether a time series is stationary or not. A stationary time series has the characteristic that its statistical properties remain constant over time. In the stationarity analysis using the ADF test, with an alpha value of 95% as the confidence interval, the results are shown in Table 9.

Table 9.
Results of the ADF test. Source: own elaboration.
With the results obtained, it can be observed that the variable of interest, kWh, is non-stationary, indicating that the statistical properties of the data, such as the variance and mean, change over time. This result is expected due to the nature of electricity consumption data, where consumption trends or patterns are present given the same or similar consumers. It is also important to note that the observed increase or decrease can occur during certain seasons of the year. While there are techniques to transform data to achieve stationarity, they will not be applied, considering this characteristic to be important within the data. The results from the stationarity test guided us to delineate the methodologies and algorithms to be used in the development of the regressor models and outlier techniques.
5.1.2. Correlation Matrix
The correlation between the variables of our preprocessed dataset is calculated with Kendall’s correlation, which is a reliable and robust non-parametric statistic [60]. The value of the correlation is between +1 and −1, where +1 and −1 indicate a high correlation, positive or negative, respectively. Zero means no correlation between the variables compared.
Figure 5 displays the Kendall correlation matrix obtained for the dataset. The analysis of the results of the correlation matrix revealed that only the variable current has a strong linear relationship with the target prediction variable, which corresponds to the variable kWh.
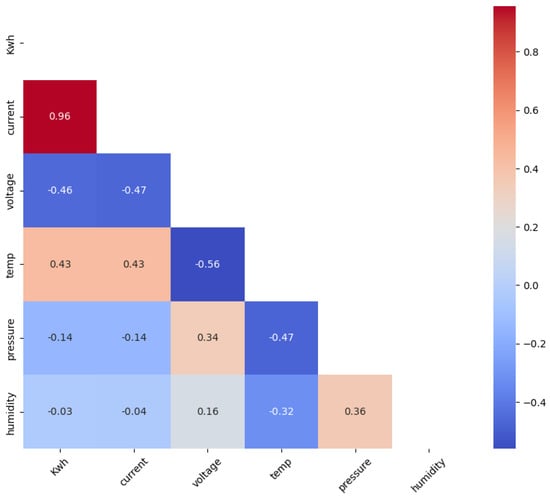
Figure 5.
Kendall’s correlation heatmap. Source: own elaboration.
5.1.3. Time Series Decomposition
Time series decomposition analysis allows for the identification of seasonal patterns, trends, variability, and cycles present in the data. This information greatly aids in a deep understanding of the data to be used. The decomposition of the time series of the variable kWh into its components of trend, seasonality, cycle, and randomness is shown in Figure 6. In the resulting plots, a clear seasonal effect and recurrent patterns can be observed in the time series corresponding to the variable kWh. Similarly, there is an upward trend, likely due to increased electricity consumption in the summer season, which has implications for the residual component as values begin to deviate from zero during periods of increased consumption, indicating a change in behavior or patterns.
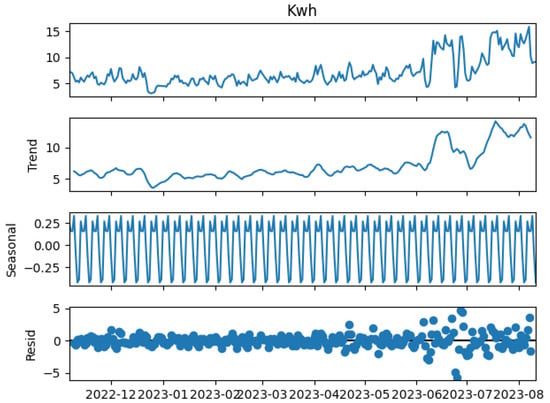
Figure 6.
Time series decomposition of the variable kWh. Source: own elaboration.
5.2. Comparison of Regression Models
Table 10 presents the top five results for the electricity consumption variable according to the mean absolute percentage error (MAPE) metric.

Table 10.
Top 5 best predictive model results. Source: own elaboration.
The five positions with the best performance are occupied by the regressor random forest regressor; in position number six in performance according to the MAPE metric is the regressor of AdaBoost with a value of 0.184275693. The five random forest positions have in common the number of lags used, but they differ in the hyperparameter of n_estimators. While locations one and five do not differ much in their MAPE metric, due to the smaller number of estimators used by location five, a shorter execution time would be expected, representing a choice as to whether performance, execution time, or resource usage needs to be prioritized (e.g., minimal improvement).
To visualize the performance of the best regressor evaluated, the 30-day forecast was made in the date period from 13 July 2023 to 11 August 2023. The forecast in this period of thirty dates is the one that will be used for its alteration and subsequent detection of anomalies. Figure 7 shows the graph corresponding to the forecast and the actual consumption data.
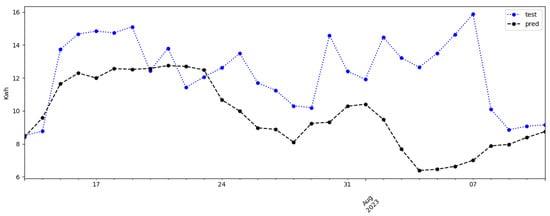
Figure 7.
Comparison of real data and predicting data with best-performing regressor. Source: own elaboration.
Although a completely different regressor and hyperparameters can be chosen to provide better results in metrics for this particular date period, the combination used of regressor, lags, and hyperparameters is the one that achieved a better high metric value when evaluated on all the data. Table 11 displays the metrics associated with the prediction shown in Figure 7.

Table 11.
Best metrics for random forest regressor. Source: own elaboration.
5.3. Comparison of Anomaly Detection Models
The first results are presented using the MAD statistical technique. This technique requires a limit to determine if an observation is anomalous. To address the decision of which limit to use for this case study, within each iterative process of the thirty total iterations, a different limit value was used. That is, instead of performing thirty iterations with one limit value x and reporting those results, the thirty iterations were performed for different limit values x.
To analyze the results (Figure 8a), the F1-score metric is examined. The metric shown in these results corresponds to the average of the metric over the 30 iterations using the corresponding threshold value. The best result was obtained using a cutoff value of 1.1. Similar to the analysis of the predictor model, analyzing the F1-score metric, which is the harmonic between precision and recall, only provides some insight. In addition to this metric, the accuracy, precision, and recall have been calculated as shown in Figure 8b.
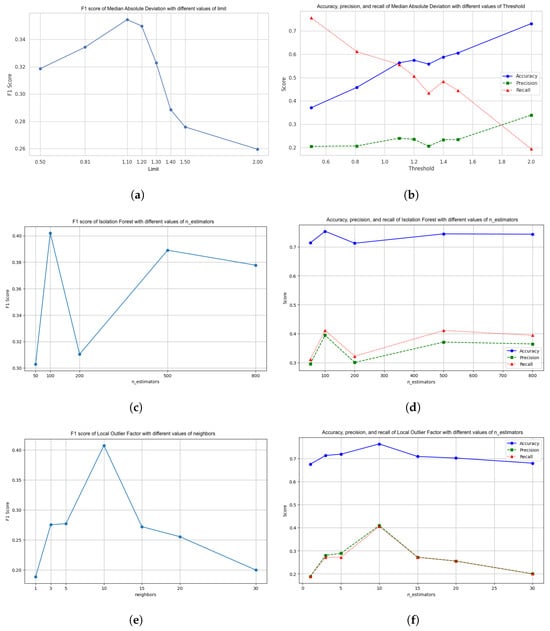
Figure 8.
Behavior of F1-score, accuracy, precision, and recall for anomaly-detection models: MAD, IF, and LOF. Source: own elaboration.
This is where the analysis of the different metrics becomes relevant. While the F1-score metric provides some understanding of the performance of a certain technique, it is necessary to know the other metrics to gain a complete understanding of the behavior of the technique. For the MAD technique, an increasing trend is observed in the accuracy, but a decreasing trend in the recall, while the precision remains practically stable, slightly above 20%.
The results obtained in the isolation forest technique are shown in Figure 8c. The best result has been obtained by training the model with 100 n_estimators. Unlike the previous technique, the performance of the technique varies in a range of 30% to 40% in the F1-score metric across the different values of n_estimators.
Results for additional metrics are found in Figure 8d. Unlike the MAD technique, it can be seen how the accuracy remains relatively high throughout the evaluations, exceeding 70%, and where the precision and recall metrics remain at ranges between 30% and 40%, obtaining the best combination of results in the use of one hundred estimators in the training period.
In the LOF, the neighbor values or neighbors were selected to be used in the grid search and to find an ideal value that would result in higher performance. Figure 8e shows the results obtained from the F1-scores across the different neighbor values used during training. Using a range from 1 to 60 neighbors, the result is an increasing performance until reaching the number of ten neighbors. Once this number is increased, the F1-score metric decreases until it reaches a value of 20% when using 30 neighbors. The maximum score obtained by using ten neighbors is slightly greater than 40%.
To better understand the full picture of the performance of this technique, Figure 8f shows the results of metrics in addition to the F1-score. The results obtained are similar to those analyzed in the isolation forest technique, where a relatively high value of the accuracy is obtained constantly slightly below or exceeding 70%, with lower precision and recall values, but still higher than those obtained in the previous technique, in a range of 20% to 40%. The best combination of results has been obtained by using ten estimators.
5.4. Metrics Analysis
In a deeper analysis of the metrics obtained previously, you can focus on a particular metric to achieve a certain objective. There is a common example where it is explained that, in the medical and health field, a false positive (precision), although it would cause an avalanche of emotions, does not have as serious repercussions as a false negative (recall). Following this analogy, in this work, the recall metric is of greater importance, that is the measurement of the number of anomalies that have been detected.
By focusing on a particular metric, this causes a change in development as well. It is possible to determine the boundary that will be used by the technique for anomaly detection employing the isolation forest technique. The number of iterations was increased to 100 to collect all the scores that the technique assigns to the generated anomalies, and the distribution over all the iterations is shown in Figure 9.
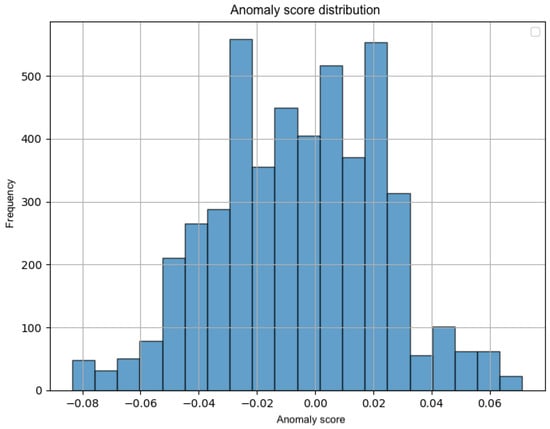
Figure 9.
Score distribution assigned by isolation forest to the generated anomalies. Source: own elaboration.
With this information, an adequate limit that captures the majority of the anomalies generated can be determined. Using a cutoff of 0.015, the results for all 30 iterations can be analyzed in Figure 10. It can be seen how the value of the recall can reach a value of up to almost 80%, while the accuracy and precision remain in a range of 40% and 20%, respectively. In this way, focus can be given and action can be taken in development to achieve certain results depending on the objective or need of the task. Within the context of this work, the recall metric is prioritized to detect as many anomalies as possible.
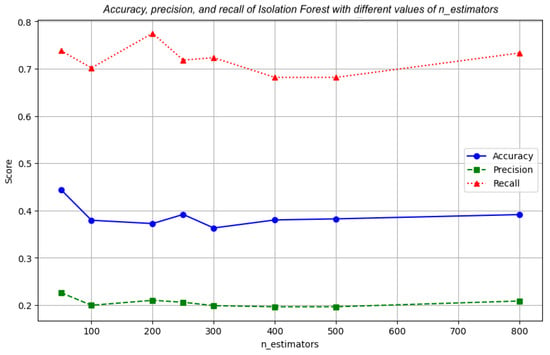
Figure 10.
Final metrics to prioritize recall. Source: own elaboration.
5.5. Explain Models
We used the Shapley Additive exPlanations (SHAP) technique [61] to analyze which variables are playing an important role in determining the decisions of the isolation forest technique. The isolation forest has been chosen because it obtained the highest results in terms of the F1-score, which is why it would be expected to be used for the detection of anomalous data in production outside of a study area.
The main objective of the results shown below is to visualize the challenge in determining anomalous data by lacking certainty as to which instances in the time series are anomalous, as well as to provide some understanding or explanation of why an instance is detected as anomalous.
Figure 11 shows the real data for the 30-day period that has been handled previously. In this part, we are no longer working with the forecast generated by a model, but with the real data captured in the dataset (i.e., unaltered data). Instances in red color were identified as anomalous by the isolation forest technique. Visually, a judgment can be made about whether a certain point in the time series differs significantly from the rest and would, therefore, be an anomaly. However, this approach is unreliable since there is no certainty as to which of these 30-day points of electrical consumption are actually anomalies. The detection of these anomalous data by the technique remains uncertain without any way of being able to discern them.
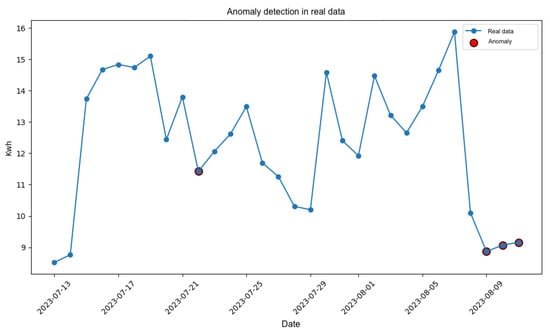
Figure 11.
Detection of anomalies with real data. Source: own elaboration.
By using a technique like SHAP, you can gain insight into the understanding of what the isolation forest model has considered for classifying anomalous data. By being able to analyze which variables have a greater or lesser weight in determining atypical data, the analysis can be deepened within the context of electricity consumption to determine if any observation is, in fact, anomalous.
Overall, the variables that contribute the most and the least to the model to determine whether an observation is atypical are shown in Figure 12. In this case, the user or group of interested users could delve deeper and carry out an analysis of the atmospheric conditions of humidity and temperature that occurred during the 30 days that this period of electrical consumption covers, as well as the voltage and current readings, as these are the variables with the most impact on the execution of the model.
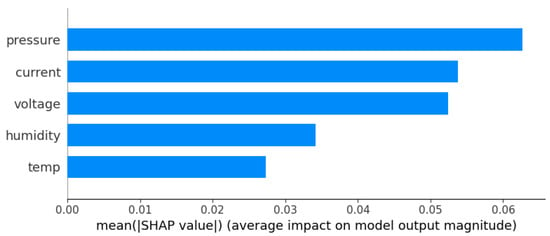
Figure 12.
SHAP values for the isolation forest model. Source: own elaboration.
As a proof of concept, we analyzed an individual instance identified by the model (IF) as anomalous; the values of each of the variables can be examined as seen in Figure 13. In a similar way, but in a more specialized case, the analysis can be carried out on a particular instance detected as atypical. The current variable is the one that has had the most weight in obtaining this result. A high current reading may mean a short circuit within the electrical installation or an electrical device used during the day under observation.
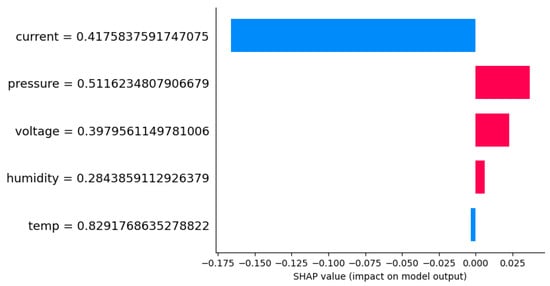
Figure 13.
Individual contribution of variables for a specific instance. Source: own elaboration.
6. Discussion
For cities, the generation of an electricity consumption prediction model is relevant. In this work, we model energy consumption data using a time series format and generate a prediction of future electricity consumption. The partial autocorrelation graph has been validated based on the results in the different metrics, especially the MAPE.
The optimal number of estimators used by the regressors is close to 100 estimators. In this, it is possible to avoid the use of too few estimators that could cause overfitting of the model, and at the same time, the excessive use of them that would result in a high bias and would not achieve good training of the data. The omission to graphically present the results of the regressors Lasso and Ridge is derived from the fact that these regressors failed to adequately fit the data. These regressors assume and expect a linear relationship between the variables. This relationship is absent or very weak in the data used. Both regressors produced a forecast similar to a horizontal line, where, if the analysis is not deepened, it can be incorrectly chosen as an acceptable result, since they produced relatively low metrics compared to the other regressors.
It is of interest to mention that some other regressors were subjected to experimentation such as the LightGMB or Catboost regressor. However, these results were omitted because they show the inability of the regressors to be trained satisfactorily to generate a forecast. This fact matches with previous research [62] which mentioned the abundant amount of data necessary for these two methods and their correct training. Within the context of this work, and many others where the case studies have a limited amount of data, an open challenge remains because the relations between time and space in time series are dynamic, therefore the analysis performed is valid only for a short-term period.
Remembering that the main objective of this work is the study and detection of anomalies within domestic electricity consumption data, the previous results become relevant by providing us with the forecast that will be used in the detection of anomalies. However, despite the importance of generating a forecast that is as close to the test data as possible (see Figure 7), the available resources have not been fully allocated to achieve this goal and minimize the error. The results obtained in the generation of the electric energy consumption forecast can be improved, but they represent a good basis to continue with the methodology.
The methodology for altering the forecast tries to emulate in the best possible way different scenarios that can occur on a day-to-day basis in domestic electricity consumption. The main interest of this work is the increases and decreases in electrical consumption that have been determined as anomalous. Within this methodology, it is always ensured that a certain percentage of different dates are chosen randomly for data modification, as this allows for fair comparisons. Omitting them can cause the same date to be chosen twice and produce misleading results in the iteration. Likewise, the certainty of generating alteration factors that remain within the expected real context of electrical consumption is implemented. This means that the modified forecast always remains within the range of a home’s actual electrical consumption, without presenting extremely large, small or even negative values.
The analysis of the results obtained in the prediction and anomaly detection process share a special characteristic: depending on the main objective being worked on, there is a metric that best describes that objective. A broad set of metrics has been transparently presented to provide a complete picture to achieve a deep understanding of the results. Additionally, after SHAP analysis over one instance identified by the outlier prediction model as abnormal, enables a deeper understanding of why variables’ values make that instance abnormal.
7. Conclusions
An electricity consumption prediction model has been developed using exogenous and endogenous variables during training with a mean absolute percentage error amount of less than 18% using a random forest regressor. The quality of the model has been ensured by performing cross-validation through the backtesting procedure respecting the time-dependent nature of the time series. At the same time, the appropriate hyperparameter has been chosen for training, seeking to maximize performance metrics.
Using the results of this regression model, a 30-day forecast of electrical consumption, an anomaly-detection model has been developed using isolation forest, where, based on the corresponding analysis of the choice of appropriate limit, it has been possible to capture up to 75% of the artificially generated anomalies over 30 different iterations with randomly selected abnormal days. It has been decided to focus on the identification of the greatest possible number of anomalies as an objective metric because these anomalies can indicate critical problems such as failures in equipment or facilities that require immediate attention and care. The existence of false negatives, that is anomalies that have not been detected, can have serious consequences that can harm domestic inhabitants or the electrical network in general. Also, this approach allows a proactive and preventive attitude in the face of possible failures or occurrences not foreseen in the present.
The main contribution of this research is the use of Shapley values to explain the results of a model capable of detecting anomalous data, in this case isolation forest. The motivation is to try to “close the circle” and visualize the situation where anomaly detection is carried out without the certainty of which ones exist within the timeline. Lacking this certainty, being able to generate knowledge of which variables lead the model to generate said result is valuable information to eventually determine the veracity of the results. Another contribution is the transformation, use, and analysis of domestic electricity consumption data in Mexico, for the development of regression and anomaly-detection models. Additionally, this work contributes to establishing a methodology for the generation of anomalies within this context and the use of an explainable AI technique to generate an understanding of the results of the anomaly-detection model.
This hybrid approach is a new proposal to identify outliers considering the prediction of energy consumption and to understand the cause of them by using XAI. All these can guide the design of other applications to understand users or environmental abnormal behaviors for other purposes. For instance, the medical or healthcare abnormal behavior (increase or decrease) of energy consumption can be correlated with the fall of an elderly person living alone. We considered relevant the definition of anomaly proposed in this work, and this can help future researchers establish a basis for the Mexican context to work on.
As future work, the expansion of the dataset becomes a desirable activity to be able to experiment with different techniques that can benefit from the increased amount of data. At the same time, the creation or adaptation of the dataset by labeling real anomalous events to obtain certainty about the atypical events that occurred in the data can be achieved. The exploration of the extended isolation forest technique for anomaly detection is an interesting point to consider as it is an evolution of isolation forest, as well as experimentation when using some assembly methods and combining two techniques to study their results.
Author Contributions
Conceptualization, V.S.-M., J.A.N.-A. and E.R.-y.-R.; methodology, J.-A.S.-V.; software, J.-A.S.-V.; validation, J.-A.S.-V., V.S.-M. and J.A.N.-A.; formal analysis, J.-A.S.-V., V.S.-M. and J.A.N.-A.; investigation, J.-A.S.-V., V.S.-M. and J.A.N.-A.; resources, V.S.-M., J.A.N.-A. and E.R.-y.-R.; data curation, J.-A.S.-V.; writing—original draft preparation, V.S.-M., J.A.N.-A. and E.R.-y.-R.; writing—review and editing, V.S.-M., J.A.N.-A. and E.R.-y.-R.; visualization, J.-A.S.-V.; supervision, V.S.-M. and J.A.N.-A.; project administration, V.S.-M.; funding acquisition, V.S.-M., J.A.N.-A. and E.R.-y.-R. All authors have read and agreed to the published version of the manuscript.
Funding
The APC was partially funded by Centro de Investigación en Matemáticas Aplicadas, Universidad Autónoma de Coahuila and Tecnológico Nacional de México, Instituto Tecnológico de Saltillo.
Data Availability Statement
The original data presented in the study are openly available in Mendeley Data at https://doi.org/10.17632/tvhygj8rgg.1.
Conflicts of Interest
The authors declare no conflicts of interest.
References
- Farzaneh, H.; Malehmirchegini, L.; Bejan, A.; Afolabi, T.; Mulumba, A.; Daka, P.P. Artificial intelligence evolution in smart buildings for energy efficiency. Appl. Sci. 2021, 11, 763. [Google Scholar] [CrossRef]
- Moreno-Bernal, P.; Cervantes-Salazar, C.A.; Nesmachnow, S.; Hurtado-Ramírez, J.M.; Hernández-Aguilar, J.A. Open-Source Big Data Platform for Real-Time Geolocation in Smart Cities. In Ibero-American Congress of Smart Cities; Springer: Cham, Switzerland, 2021; pp. 207–222. [Google Scholar] [CrossRef]
- Alvarez-Sosa, D.; Abbas, A. Smart cities concept and innovative strategies in mexico: A bibliometric analysis using vosviewer. In Proceedings of the 2021 IEEE International Conference on Engineering, Technology and Innovation (ICE/ITMC), Cardiff, UK, 21–23 June 2021; IEEE: Piscataway, NJ, USA, 2021; pp. 1–5. [Google Scholar] [CrossRef]
- Llagueiro, P.; Porteiro, R.; Nesmachnow, S. Characterization of Household Electricity Consumption in Uruguay. In Ibero-American Congress of Smart Cities; Springer: Cham, Switzerland, 2023; pp. 33–47. [Google Scholar] [CrossRef]
- Tanko, B.L.; Essah, E.A.; Elijah, O.; Zakka, W.P.; Klufallah, M. Bibliometric analysis, scientometrics and metasynthesis of Internet of Things (IoT) in smart buildings. Built Environ. Proj. Asset Manag. 2023, 13, 646–665. [Google Scholar] [CrossRef]
- Aguirre Fraire, B. Predicción a Corto Plazo de Consumo Eléctrico Doméstico Empleando Modelos de Aprendizaje Automático. Master’s Thesis, Centro de Investigación en Matemáticas Aplicadas/Universidad Autónoma de Coahuila, Saltillo, Mexico, 2023. [Google Scholar]
- Kent, M.; Huynh, N.K.; Schiavon, S.; Selkowitz, S. Using support vector machine to detect desk illuminance sensor blockage for closed-loop daylight harvesting. Energy Build. 2022, 274, 112443. [Google Scholar] [CrossRef]
- Das, H.P.; Lin, Y.W.; Agwan, U.; Spangher, L.; Devonport, A.; Yang, Y.; Drgoňa, J.; Chong, A.; Schiavon, S.; Spanos, C.J. Machine learning for smart and energy-efficient buildings. Environ. Data Sci. 2024, 3, e1. [Google Scholar] [CrossRef]
- Samara, M.A.; Bennis, I.; Abouaissa, A.; Lorenz, P. A survey of outlier detection techniques in IoT: Review and classification. J. Sens. Actuator Netw. 2022, 11, 4. [Google Scholar] [CrossRef]
- Himeur, Y.; Ghanem, K.; Alsalemi, A.; Bensaali, F.; Amira, A. Artificial intelligence based anomaly detection of energy consumption in buildings: A review, current trends and new perspectives. Appl. Energy 2021, 287, 116601. [Google Scholar] [CrossRef]
- Blázquez-García, A.; Conde, A.; Mori, U.; Lozano, J.A. A Review on Outlier/Anomaly Detection in Time Series Data. ACM Comput. Surv. 2021, 54. [Google Scholar] [CrossRef]
- Cui, W.; Wang, H. A new anomaly detection system for school electricity consumption data. Information 2017, 8, 151. [Google Scholar] [CrossRef]
- INEGI. Energía Eléctrica. 2018. Available online: https://cuentame.inegi.org.mx/territorio/ambiente/electrica.aspx (accessed on 12 April 2023).
- Gómez, D.; Rojas, A. An Empirical Overview of the No Free Lunch Theorem and Its Effect on Real-World Machine Learning Classification. Neural Comput. 2015, 28, 1–13. [Google Scholar] [CrossRef]
- Canizo, M.; Triguero, I.; Conde, A.; Onieva, E. Multi-head CNN–RNN for multi-time series anomaly detection: An industrial case study. Neurocomputing 2019, 363, 246–260. [Google Scholar] [CrossRef]
- Shin, A.H.; Kim, S.T.; Park, G.M. Time Series Anomaly Detection using Transformer-based GAN with Two-Step Masking. IEEE Access 2023, 11, 74035–74047. [Google Scholar] [CrossRef]
- Kardi, M.; Alskaif, T.; Tekinerdogan, B.; Catalão, J.P.S. Anomaly Detection in Electricity Consumption Data using Deep Learning. In Proceedings of the 2021 IEEE International Conference on Environment and Electrical Engineering and 2021 IEEE Industrial and Commercial Power Systems Europe (EEEIC/I&CPS Europe), Bari, Italy, 7–10 September 2021; pp. 1–6. [Google Scholar] [CrossRef]
- Freeman, C.; Merriman, J.; Beaver, I.; Mueen, A. Experimental Comparison and Survey of Twelve Time Series Anomaly Detection Algorithms. J. Artif. Int. Res. 2022, 72, 849–899. [Google Scholar] [CrossRef]
- Chandola, V.; Banerjee, A.; Kumar, V. Anomaly Detection: A Survey. ACM Comput. Surv. 2009, 41, 1–58. [Google Scholar] [CrossRef]
- Han, S.; Hu, X.; Huang, H.; Jiang, M.; Zhao, Y. Adbench: Anomaly detection benchmark. Adv. Neural Inf. Process. Syst. 2022, 35, 32142–32159. [Google Scholar] [CrossRef]
- Zhang, J.; Zhang, H.; Ding, S.; Zhang, X. Power consumption predicting and anomaly detection based on transformer and K-means. Front. Energy Res. 2021, 9, 779587. [Google Scholar] [CrossRef]
- Lei, L.; Wu, B.; Fang, X.; Chen, L.; Wu, H.; Liu, W. A dynamic anomaly detection method of building energy consumption based on data mining technology. Energy 2023, 263, 125575. [Google Scholar] [CrossRef]
- Martin Nascimento, G.F.; Wurtz, F.; Kuo-Peng, P.; Delinchant, B.; Jhoe Batistela, N. Outlier Detection in Buildings’ Power Consumption Data Using Forecast Error. Energies 2021, 14, 8325. [Google Scholar] [CrossRef]
- Nascimento, G.M. GreEn-ER–Electricity consumption data of a tertiary building. Mendeley Data 2020. [Google Scholar] [CrossRef]
- Zhou, X.; Yang, T.; Liang, L.; Zi, X.; Yan, J.; Pan, D. Anomaly detection method of daily energy consumption patterns for central air conditioning systems. J. Build. Eng. 2021, 38, 102179. [Google Scholar] [CrossRef]
- Jurj, D.I.; Czumbil, L.; Bârgăuan, B.; Ceclan, A.; Polycarpou, A.; Micu, D.D. Custom outlier detection for electrical energy consumption data applied in case of demand response in block of buildings. Sensors 2021, 21, 2946. [Google Scholar] [CrossRef]
- Gaur, M.; Makonin, S.; Bajić, I.V.; Majumdar, A. Performance evaluation of techniques for identifying abnormal energy consumption in buildings. IEEE Access 2019, 7, 62721–62733. [Google Scholar] [CrossRef]
- Parson, O.; Fisher, G.; Hersey, A.; Batra, N.; Kelly, J.; Singh, A.; Knottenbelt, W.; Rogers, A. Dataport and NILMTK: A building dataset designed for non-intrusive load monitoring. In Proceedings of the 2015 IEEE Global Conference on Signal and Information Processing (GlobalSIP), Orlando, FL, USA, 14–16 December 2015; IEEE: Piscataway, NJ, USA, 2015; pp. 210–214. [Google Scholar]
- Makonin, S. HUE: The hourly usage of energy dataset for buildings in British Columbia. Data Brief 2019, 23, 103744. [Google Scholar] [CrossRef] [PubMed]
- García, J.; Zamora, E.; Sossa, H. Supervised and Unsupervised Neural Networks: Experimental Study for Anomaly Detection in Electrical Consumption. In Advances in Soft Computing; Batyrshin, I., Martínez-Villaseñor, M.d.L., Ponce Espinosa, H.E., Eds.; Springer: Cham, Switzerland, 2018; pp. 98–109. [Google Scholar] [CrossRef]
- Hebrail, G.; Berard, A. Individual Household Electric Power Consumption. UCI Machine Learning Repository 2012. [Google Scholar] [CrossRef]
- Guevara Villegas, A.S. Detección de Patrones Anómalos de Consumos de Energía Eléctrica Residencial Utilizando Técnicas no Supervisadas. Master’s Thesis, Universidad Tecnológica de Pereira, Pereira, Colombia, 2016. [Google Scholar]
- Aguirre-Fraire, B.; Beltrán, J.; Soto, V. Household energy consumption enriched with weather data in northeast of Mexico. Mendeley Data 2024. [Google Scholar] [CrossRef]
- Das, H.P.; Konstantakopoulos, I.C.; Manasawala, A.B.; Veeravalli, T.; Liu, H.; Spanos, C.J. A novel graphical lasso based approach towards segmentation analysis in energy game-theoretic frameworks. In Proceedings of the 2019 18th IEEE International Conference pn Machine Learning and Applications (ICMLA), Boca Raton, FL, USA, 16–19 December 2019; IEEE: Piscataway, NJ, USA; 2019, pp. 1702–1709. [Google Scholar] [CrossRef]
- Botchkarev, A. Performance Metrics (Error Measures) in Machine Learning Regression, Forecasting and Prognostics: Properties and Typology. arXiv 2018, arXiv:1809.03006. [Google Scholar] [CrossRef]
- Percha, B. Modern clinical text mining: A guide and review. Annu. Rev. Biomed. Data Sci. 2021, 4, 165–187. [Google Scholar] [CrossRef] [PubMed]
- Ho, T.K. Random decision forests. In Proceedings of the Proceedings of 3rd International Conference on Document Analysis and Recognition, Montreal, QC, Canada, 14–16 August 1995; IEEE: Piscataway, NJ, USA, 1995; Volume 1, pp. 278–282. [Google Scholar] [CrossRef]
- Breiman, L. Classification and Regression Trees; Routledge: Abingdon, UK, 2017. [Google Scholar]
- Hoaglin, D.; Mosteller, F.; Tukey, J. Understanding Robust and Exploratory Data Analysis; Wiley Series in Probability and Statistics: Probability and Statistics Section Series; Wiley: Hoboken, NJ, USA, 1983. [Google Scholar]
- Liu, F.T.; Ting, K.M.; Zhou, Z.H. Isolation Forest. In Proceedings of the 2008 Eighth IEEE International Conference on Data Mining, Pisa, Italy, 15–19 December 2008; pp. 413–422. [Google Scholar] [CrossRef]
- Breunig, M.M.; Kriegel, H.P.; Ng, R.T.; Sander, J. LOF: Identifying Density-Based Local Outliers. In Proceedings of the SIGMOD ’00: Proceedings of the 2000 ACM SIGMOD International Conference on Management of Data, Dallas, TX, USA, 15–18 May 2000; pp. 93–104. [Google Scholar] [CrossRef]
- Belyadi, H.; Haghighat, A. Unsupervised machine learning: Clustering algorithms. Machine Learning Guide for Oil and Gas Using Python; Gulf Professional Publishing: Oxford, UK, 2021; pp. 125–168. [Google Scholar]
- Dwivedi, R.; Dave, D.; Naik, H.; Singhal, S.; Omer, R.; Patel, P.; Qian, B.; Wen, Z.; Shah, T.; Morgan, G.; et al. Explainable AI (XAI): Core ideas, techniques, and solutions. ACM Comput. Surv. 2023, 55, 1–33. [Google Scholar] [CrossRef]
- Mahalakshmi, G.; Sridevi, S.; Rajaram, S. A survey on forecasting of time series data. In Proceedings of the 2016 International Conference on Computing Technologies and Intelligent Data Engineering (ICCTIDE’16), Kovilpatti, India, 7–9 January 2016; IEEE: Piscataway, NJ, USA, 2016; pp. 1–8. [Google Scholar] [CrossRef]
- Amat Rodrigo, J.; Escobar Ortiz, J. skforecast. DataCite Commons. 2023. Available online: https://commons.datacite.org/doi.org/10.5281/zenodo.10145529 (accessed on 4 June 2024).
- Buitinck, L.; Louppe, G.; Blondel, M.; Pedregosa, F.; Mueller, A.; Grisel, O.; Niculae, V.; Prettenhofer, P.; Gramfort, A.; Grobler, J.; et al. API design for machine learning software: Experiences from the scikit-learn project. In Proceedings of the ECML PKDD Workshop: Languages for Data Mining and Machine Learning, Prague, Czech Republic, 23–27 September 2013; pp. 108–122. [Google Scholar] [CrossRef]
- McDonald, G.C. Ridge regression. Wiley Interdiscip. Rev. Comput. Stat. 2009, 1, 93–100. [Google Scholar] [CrossRef]
- Tibshirani, R. Regression shrinkage and selection via the lasso. J. R. Stat. Soc. Ser. Stat. Methodol. 1996, 58, 267–288. [Google Scholar] [CrossRef]
- Segal, M.R. Machine Learning Benchmarks and Random Forest Regression; University of California, San Francisco: San Francisco, CA, USA, 2004. [Google Scholar]
- Chen, T.; Guestrin, C. Xgboost: A scalable tree boosting system. In Proceedings of the Proceedings of the 22nd ACM SIGKDD International Conference on Knowledge Discovery and Data Mining, San Francisco, CA, USA, 13–17 August 2016; pp. 785–794. [Google Scholar] [CrossRef]
- Solomatine, D.P.; Shrestha, D.L. AdaBoost. RT: A boosting algorithm for regression problems. In Proceedings of the 2004 IEEE International Joint Conference on Neural Networks (IEEE Cat. No. 04CH37541), Budapest, Hungary, 25–29 July 2004; IEEE: Piscataway, NJ, USA, 2004; Volume 2, pp. 1163–1168. [Google Scholar] [CrossRef]
- Lerman, P. Fitting segmented regression models by grid search. J. R. Stat. Soc. Ser. C Appl. Stat. 1980, 29, 77–84. [Google Scholar] [CrossRef]
- Bailey, D.H.; Ger, S.; de Prado, M.L.; Sim, A. Statistical overfitting and backtest performance. In Risk-Based and Factor Investing; Elsevier: Amsterdam, The Netherlands, 2015; pp. 449–461. [Google Scholar] [CrossRef]
- Berrar, D. Cross-validation. In Encyclopedia of Bioinformatics and Computational Biology; Elsevier: Amsterdam, The Netherlands, 2019; pp. 542–545. [Google Scholar] [CrossRef]
- Himeur, Y.; Alsalemi, A.; Bensaali, F.; Amira, A. Smart power consumption abnormality detection in buildings using micromoments and improved K-nearest neighbors. Int. J. Intell. Syst. 2021, 36, 2865–2894. [Google Scholar] [CrossRef]
- Zhang, J.; Wu, D.; Boulet, B. Time Series Anomaly Detection for Smart Grids: A Survey. In Proceedings of the 2021 IEEE Electrical Power and Energy Conference (EPEC), Toronto, ON, Canada, 22–31 October 2021; pp. 125–130. [Google Scholar] [CrossRef]
- Almazrouee, A.I.; Almeshal, A.M.; Almutairi, A.S.; Alenezi, M.R.; Alhajeri, S.N. Long-Term Forecasting of Electrical Loads in Kuwait Using Prophet and Holt–Winters Models. Appl. Sci. 2020, 10, 5627. [Google Scholar] [CrossRef]
- Soenen, J.; Van Wolputte, E.; Perini, L.; Vercruyssen, V.; Meert, W.; Davis, J.; Blockeel, H. The effect of hyperparameter tuning on the comparative evaluation of unsupervised anomaly detection methods. In Proceedings of the KDD, Virtual, 15 August 2021; Volume 21, pp. 1–9. [Google Scholar]
- Mushtaq, R. Augmented Dickey Fuller Test, SSRN. 2011. Available online: https://papers.ssrn.com/sol3/papers.cfm?abstract_id=1911068. (accessed on 4 June 2024).
- Abdi, H. The Kendall rank correlation coefficient. Encycl. Meas. Stat. 2007, 2, 508–510. [Google Scholar]
- Ekanayake, I.; Meddage, D.; Rathnayake, U. A novel approach to explain the black-box nature of machine learning in compressive strength predictions of concrete using Shapley additive explanations (SHAP). Case Stud. Constr. Mater. 2022, 16, e01059. [Google Scholar] [CrossRef]
- Lai, K.H.; Zha, D.; Xu, J.; Zhao, Y.; Wang, G.; Hu, X. Revisiting time series outlier detection: Definitions and benchmarks. In Proceedings of the Thirty-Fifth Conference on Neural Information Processing Systems Datasets and Benchmarks Track (Round 1), Virtual, 6–14 December 2021. [Google Scholar]
Disclaimer/Publisher’s Note: The statements, opinions and data contained in all publications are solely those of the individual author(s) and contributor(s) and not of MDPI and/or the editor(s). MDPI and/or the editor(s) disclaim responsibility for any injury to people or property resulting from any ideas, methods, instructions or products referred to in the content. |
© 2024 by the authors. Licensee MDPI, Basel, Switzerland. This article is an open access article distributed under the terms and conditions of the Creative Commons Attribution (CC BY) license (https://creativecommons.org/licenses/by/4.0/).