1. Introduction
Back pain and musculoskeletal disorders (MSDs) bear well-understood social significance because they influence people’s productivity and quality of life [
1,
2]. In numerous studies, it has been reported that back pain and the emergence of MSDs often occur among individuals who spend prolonged time working with computer screens, keyboards, and mice. The primary reason for MSDs, chronic back or neck pain, and other chronic pain conditions is improper sitting positions for prolonged hours. The improper sitting positions are most often due to the non-ergonomic environment set by the old-fashioned paradigm, which forces computer users to adapt to ad hoc computer tables/desks at home or in the office [
3,
4]. Even well-informed computer users and professional software developers who are working in an ergonomic environment (including office chairs, desks, keyboards, mice, etc.) tend to complain of body pain, most often due to the prolonged hours in front of the computer and the inevitable deviations from the proper sitting posture caused by the accumulation of fatigue or relaxing of muscles due to intense focusing on work tasks [
4,
5].
In recent years, plenty of research efforts have focused on research and innovation activities that aim to provide technological support for the prevention of back and neck pain or the development of MSDs. These studies have demonstrated that despite some well-understood shortcomings, technological tools can play an important role in the process of unhealthy habit alteration, including MSD prevention through smartphone-based applications [
6,
7], multisensory smart-chair systems [
8,
9], or other specialized technology [
10]. Specifically, a smart-chair system using six pressure sensors and six infrared reflective distance sensors was reported to identify sitting postures in real time [
8]. Posture identification accuracy of up to 92% was reported for the
k-nearest neighbors (
k-NN) classifier. Another recent study on sitting posture recognition successfully captured and distinguished ten common sitting postures based on arrays of 12 to 25 pressure sensors placed on cushioned chairs in different configurations [
9]. The applicability of various classification methods was evaluated, including
k-NN, support vector machine (SVM), decision tree (DT), random forest (RF), and logistic regression (LR). Recognition accuracy of up to 99.18% was reported for the SVM-based classifier with 25 sensors. These and many other studies that rely on pressure and ultrasonic or reflective distance estimation sensors have shown excellent results and will hopefully be embedded in office equipment. However, as they all depend on the availability of smart-chair equipment, which is not yet readily available in low-cost office environments, their contribution to MSD prevention is limited.
A recent study reported on the development of a sitting posture monitoring system using low-cost electromyography (EMG) sensors in the context of energy-efficient Bluetooth communication [
11]. The improper sitting posture monitoring was addressed through both binary classification (distinguishing between good and bad postures) and multi-class classification (identifying good posture and deviations tilted to the front, right, and left). The performance of various machine learning methods, including SVM,
k-NN, DT, RF, and multi-layer perceptron neural network (MLP NN), was evaluated on a real-world dataset. The highest classification accuracy (91%) was reported with a
k-NN-based detector achieving real-time performance.
A comprehensive review [
12] covered over 130 publications that made use of machine learning algorithms for preventing or detecting MSD. The analysis identified artificial neural network (ANN), DT, and SVM as the most frequently used classification methods. These studies report on the development of methods and resources using one or several types of sensors, primarily focusing on specific technologies or applications. The software source code was released for only 13 of these studies, and for 22 their data were made publicly available in support of reproducible research. These were typically small datasets that were used in support of the development and evaluation of a specific technological tool, or to validate a newly proposed method under specific conditions.
As digital cameras and motion sensors became ubiquitous and are commonly used in mobile phones and office environments, various MSD detection methods have been developed based on commercially available devices [
13,
14,
15,
16,
17,
18,
19,
20,
21,
22,
23,
24,
25,
26,
27]. Along with this, various resources have been created, including datasets made with cameras [
13,
14,
15,
16,
17,
18,
19], wearable motion capture sensors [
20,
21,
22,
23], Kinect devices [
17,
24,
25,
26,
27], and many others.
The advancement of automated technology, which is based on machine learning methods, heavily depends on the availability of resources (such as large datasets of video recordings, images, distance, pressure, or other sensor readings) needed for the training and fine-tuning of models. Furthermore, the development of models for specific conditions of interest depends on the availability of annotated datasets. This requires that some portions of the available data must be annotated by highly qualified professionals with extensive domain knowledge about the specific condition of interest, which is a tedious and costly process. Thus, resource sharing is quite important for fostering research and technology development in the area of MSD prevention, which remains a problem with significant social importance.
Our primary motivation for developing the reported multimodal multisensory dataset in support of MSD prevention, MMD-MSD, was to provide a resource that would enable research of a wider scope and a multifaceted study of neck pain and back pain issues frequently developed by computer users. Specifically, the particular design of MMD-MSD opens new opportunities for research and technology development activities focused on modeling the body stance (sitting posture and movements), physiological state (stress level, attention, emotional arousal and valence), and performance (success rate on the Stroop test) of people working with a computer. Thus, MMD-MSD was conceived as a multimodal multisensory dataset that offers the unique opportunity to simultaneously study the physiological and psychological aspects of human–computer interaction in the most general setup for computer users. In addition to the long-term effects of pain and MSDs, we intended to investigate whether proper sitting posture would have any short-term effects on performance. This includes proper and typical standing and sitting positions (with and without a sitting pillow), the performance (success rate) on simple tasks requiring close attention (for instance, the Stroop test), and sitting behaviors while working with a computer within a typical office setup.
The rest of this article is organized as follows: In the
Section 2, we outline the dataset collection setup, protocol, data types, and tagging, along with the dataset structure. In the
Section 3, we report baseline detection results that demonstrate two use cases of the MMD-MSD dataset. Finally, we conclude this article with a summary and conclusions.
Appendix A outlines the MMD-MSD data organization and file formats.
2. Materials and Methods
MMD-MSD was designed and collected for the needs of the ErgoResearch project (the ErgoResearch project, entitled “Ergonomic research on work-related health problems by innovative computer models with a focus on the prevention of Musculoskeletal Disorders”, was funded by the Bulgarian National Science Fund under contract KP-06-N37/1 (December 2019–March 2024)), which, among other goals, aims at the creation of resources (datasets, software, models) in support of research and technology development (RTD) that helps prevent MSDs. The data collection was based on photogrammetry, as this provides a nonintrusive way to assess the human body’s posture in various scenarios, and a wearable wristband for the acquisition of peripheral physiological signals.
The focus of the MMD-MSD data collection process aimed at implementing an experimental setup and scenarios that allow for assessing the performance of a person while working in a typical office scenario. This involves a person sitting on an office chair next to an office desk equipped with a desktop computer configuration with standard interface devices, such as a monitor, keyboard, and mouse. The dataset comprises scenarios involving people sitting in a spontaneous posture—the one that a sitting person takes naturally while concentrating on computer-bound tasks—in contrast to the scenario when the body’s position is manually adjusted by a medical doctor, who specializes in the field of MSD rehabilitation, to sitting in the recommended ergonomic, health-friendly posture. Moreover, each participant was instructed on how to keep a proper ergonomic posture while working with the specific desktop computer configuration. For capturing the person-specific body structure, the dataset also registered spontaneous and corrected standing positions, which were adjusted with the help of a physiotherapist in en-face and profile perspectives.
To elicit spontaneous sitting positions, we engaged the volunteers in various computer-based tasks, starting with filling in a questionnaire, completing the Stroop test, and discussing their experiences during the data collection process. Here, we made use of the Stroop test as a low-complexity mental task, which does not induce a high cognitive load but requires concentration and attention. In the Stroop tests, we started with a low-complexity stimulus and subsequently alternated episodes with lower and higher difficulty to motivate the volunteers to pay more attention.
Each participant completed the Stroop test twice: when the person was sitting on an office chair without and with an air-cushioned stability disk placed on the chair. The air-cushioned disk requires the person to maintain balance, which is feasible only when sitting in a proper working posture. Thus, here, we consider the scenario when people were using the air-cushioned disk to enforce proper sitting posture. When the stability disk was not used, we recorded each volunteer’s performance on the Stroop test when sitting in spontaneous and manually corrected body positions.
Finally, we ought to mention that for the 100 recruited volunteers involved in the database creation, who were mostly students and university staff, we deemed that the observed differences in individual performance were primarily due to differences in their concentration and attention during the Stroop tests and should not be interpreted as linked to their person-specific cognitive capacity.
In the following subsections, we outline the data collection setup, protocol, types of data and their tagging, and the dataset organization and file formats.
2.1. Data Collection Setup
The MMD-MSD data collection setup consisted of a typical non-adjustable office desk with a chair, a desktop computer configuration with standard computer peripherals, and a wall grid. The office desk height was 73 cm, the chair height was 42 cm, and the 24′ monitor’s bottom edge was set to 13 cm from the desk. During a major part of the data collection process, we considered a sitting person in a spontaneous working posture while using a 24′ monitor, a typical 89-button keyboard, and a right-handed 3-button computer mouse. An air-cushioned stability disk (the THERABAND Stability Disc) was used for forcing an active sitting position. Two cameras (Go Plus F800 1080P HD 30fps) were used to register images and overhead video recordings during the data collection campaign. An Empatica E4 wristband was used for the acquisition of peripheral physiological signals, such as BVP (blood volume pulse), electrodermal activity (EDA), and skin temperature (ST), as well as three-axis accelerometer data. These physiological signals have different dynamics and were registered with different sampling rates (
Table 1).
A purposely created software tool implemented the stimulus generation and kept logs of the success rates during the color-to-text matching Stroop test [
28]. Our Stroop test consisted of 20 questions divided equally into two groups—with low and with higher complexity. In the first group of questions, the font color matched the written word, and in the second group, the color differed from the color specified by the written word. Each participant chose the correct answer from among three possible answers. In a participant-specific log file, the responses and reaction times for each stimulus were recorded.
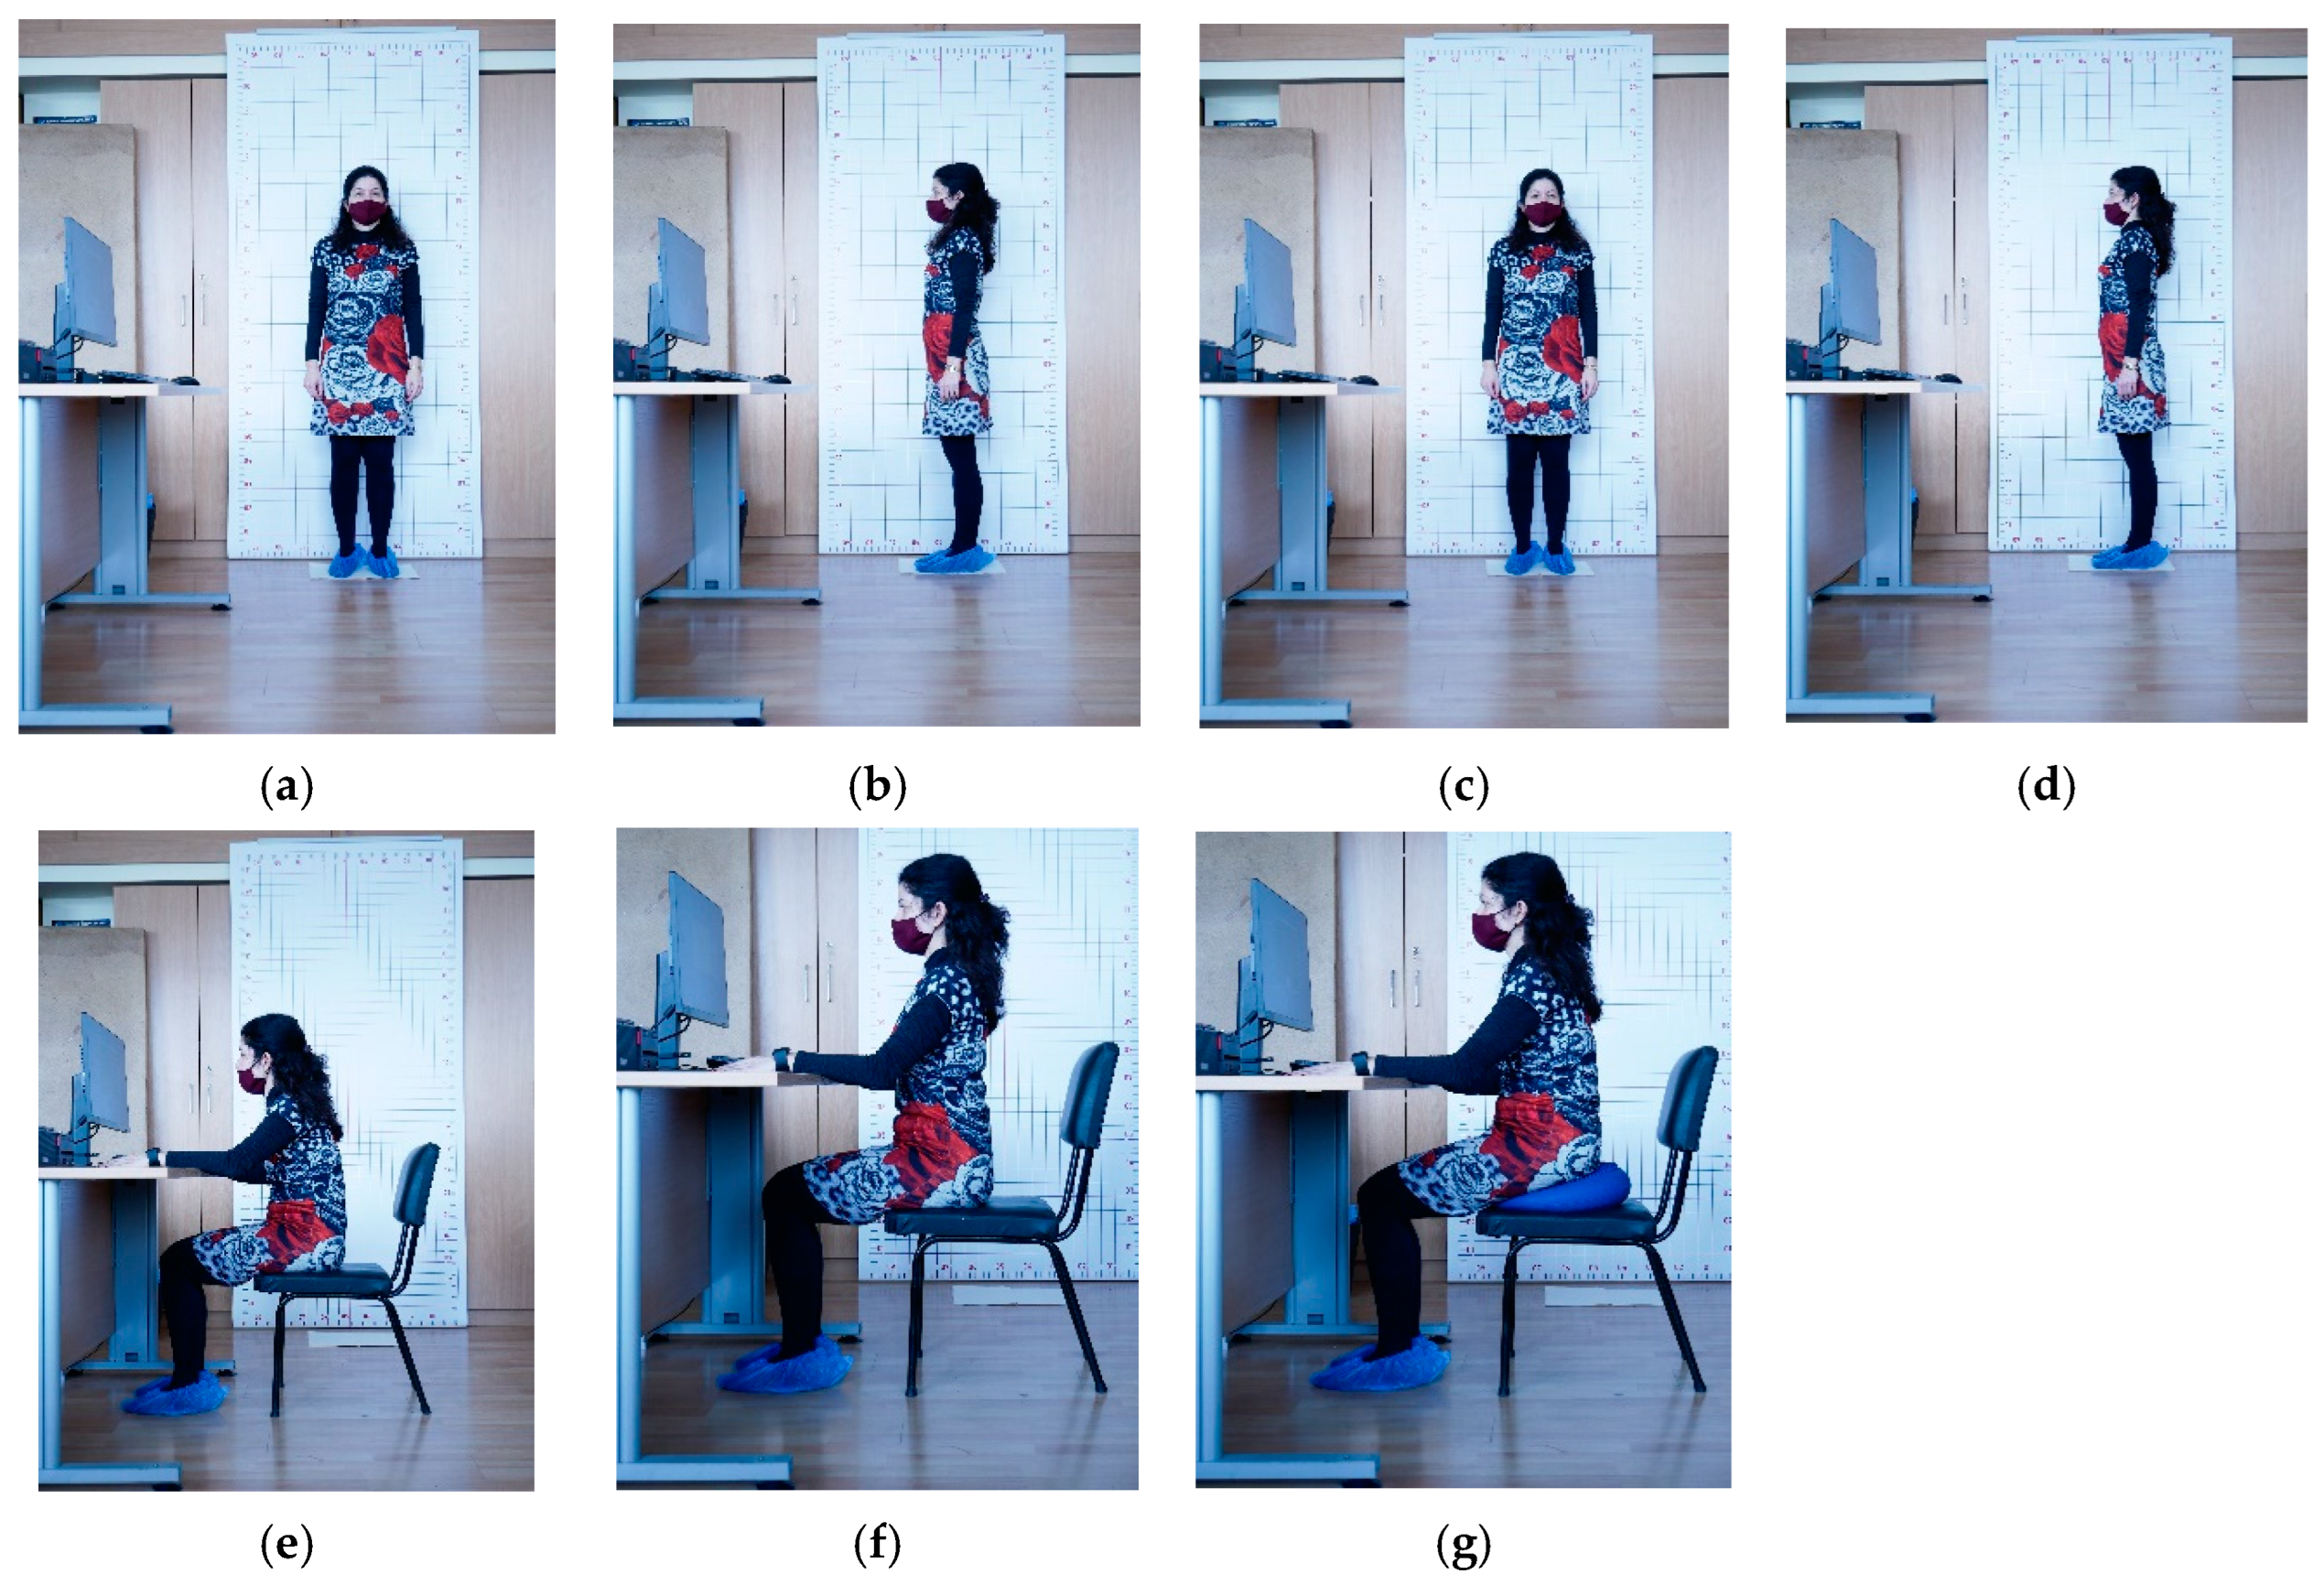
In
Figure 1, we show the arrangement of the equipment during the creation of MMD-MSD, along with typical body postures registered during the subsequent steps of the data collection process.
A software environment was purposely developed for the recording of physiological signals and the temporal synchronization of all recording channels. The timestamp synchronization was implemented through the generation of specific markers that served as reference points for the beginning and end of every episode during the data collection process. The team that implemented the dataset collection and annotation consisted of the following experts:
A data collection supervisor, who welcomed and instructed the volunteers and guided them throughout the data collection process;
An assistant with expertise in ergonomics, who designed and administrated the consensus forms and questionnaires;
A technical assistant, who ensured that the equipment was operational, assisted the participants with the equipment’s use, and also served as a photographer;
A medical doctor with a specialty in physiotherapy, who assisted in correcting the standing and sitting postures of the participants during the data collection campaign;
A senior medical doctor with habilitation in MSD prevention, who implemented the data annotation process.
2.2. Dataset Collection Protocol
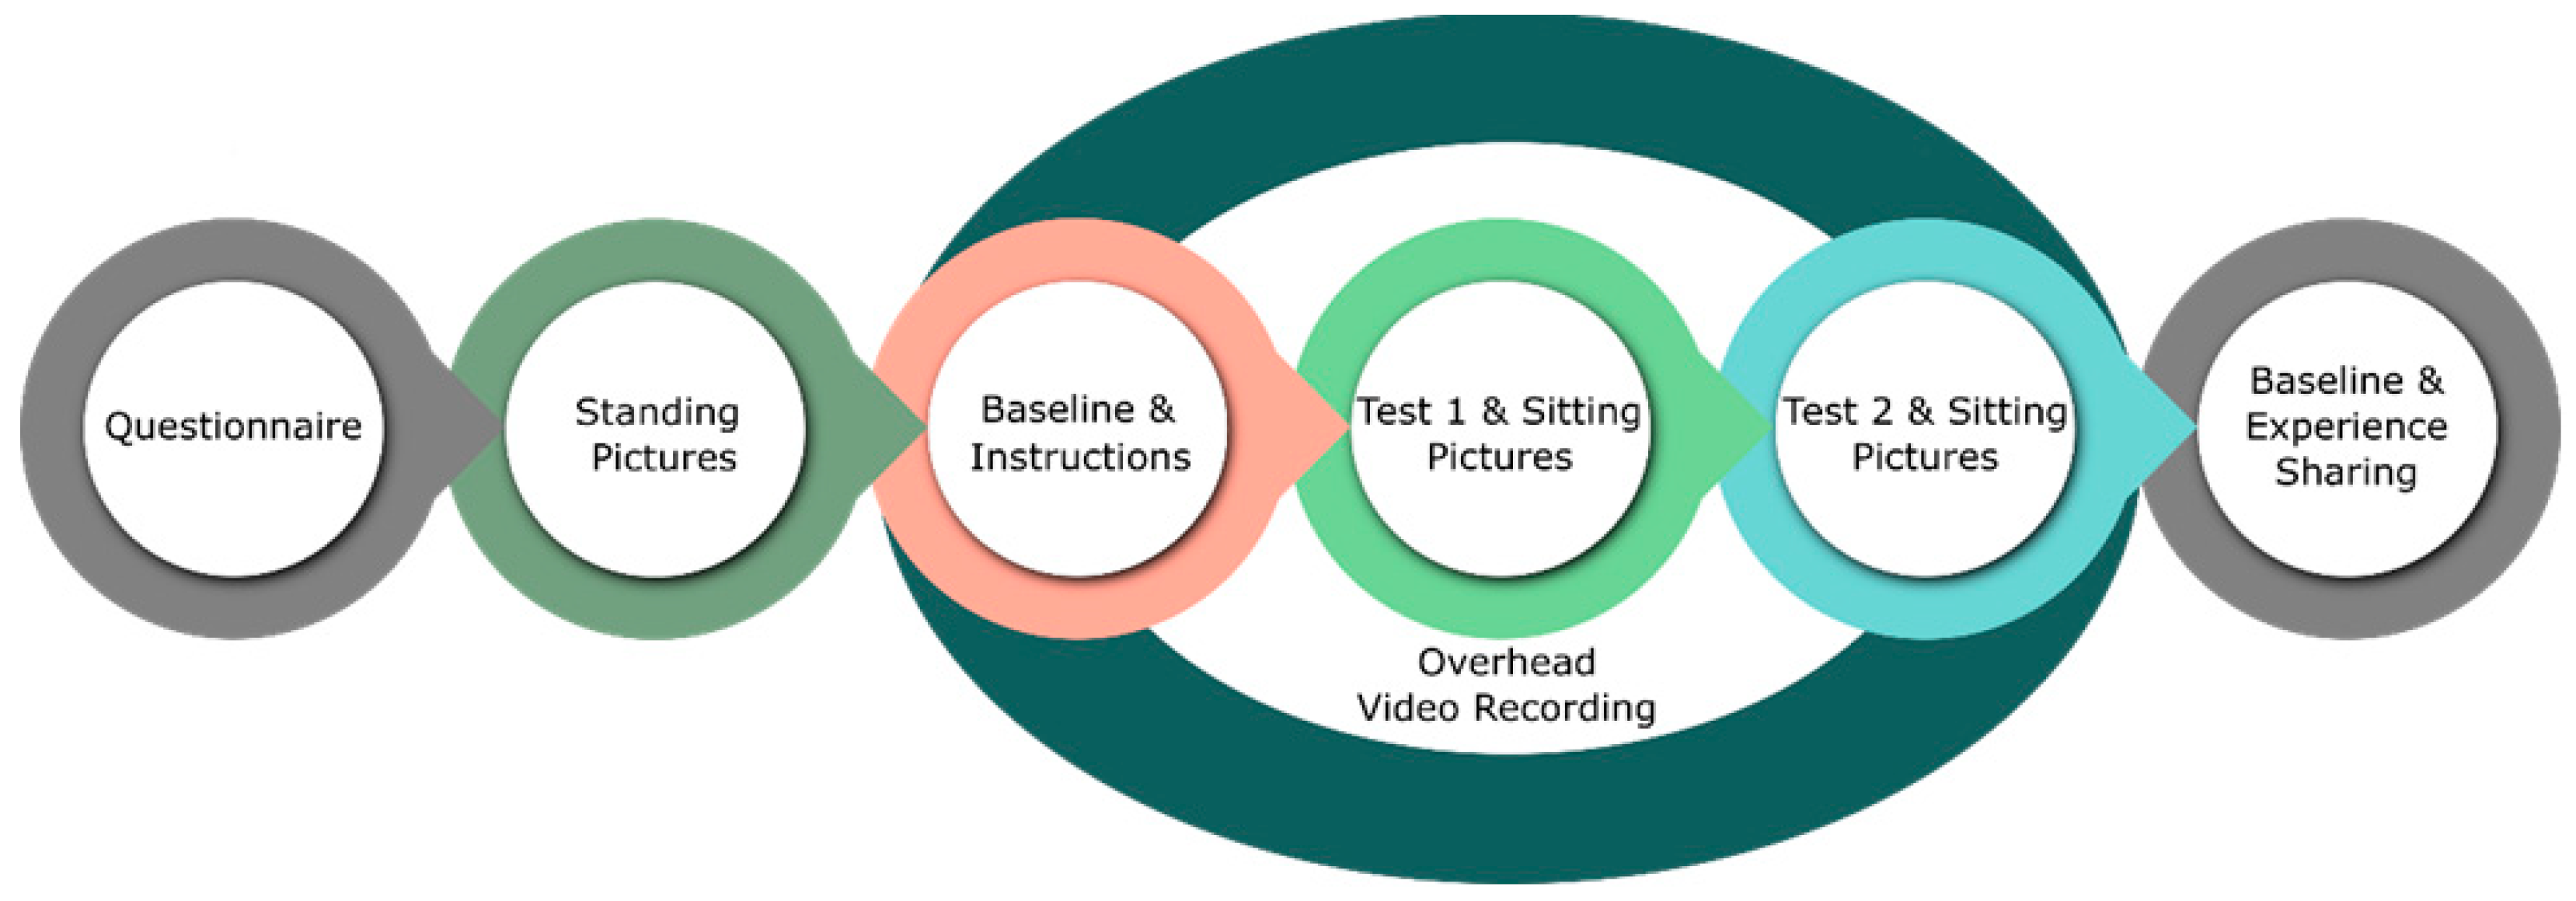
The MMD-MSD dataset was recorded in a single 45 min session per participant, with short breaks between the data collection episodes. The data collection protocol aimed at the acquisition of motion data, pictures, videos, and physiological signals. We used a common data acquisition workflow (cf.
Figure 2) implemented for each of the 100 volunteers who were recruited as participants in the data collection campaign. None of the volunteers reported previous experience with an ergonomics-oriented data collection campaign, and nobody had previous exposure to the Stroop test.
Each participant was admitted individually to the premises of the laboratory, accompanied only by the team specified above, who were directly involved in implementing the data collection process. Access to the laboratory by other people was restricted to lower the degree of discomfort and distraction during the data acquisition.
Timestamp synchronization between all recording channels was implemented through a universal marker event, which was generated by the software tool at the beginning and the end of each data collection step. As shown in
Figure 2, the data collection started with a briefing about the data collection process, filling in a consent declaration, and the entry questionnaire. The questionnaire collected general demographic information about the volunteers, their activity/sport/sleep habits, and self-reported pain issues, which were later used as self-assessment tags.
After the entry questionnaire, each participant was invited to stand next to the wall with grid wallpaper, and photographs were taken in spontaneous and corrected standing positions. Pictures were taken of each person standing
en face (front-on view) and profile (left side view) (cf.
Figure 1), including spontaneous and corrected posture. The spontaneous standing posture for each participant corresponds to the uncorrected comfortable position that the participant took naturally, while the corrected ones refer to the positions after the professional physiotherapist manually adjusted the body posture of each person according to the established MSD prevention recommendations.
Next, the participant was asked to sit on an office chair next to the office desk with a computer configuration and perform several tasks using the computer. The technical assistant helped each participant to put on the Empatica E4 wristband. The recording sessions began with a baseline recording, and each participant was instructed on how to perform the Stroop test. This corresponds to the start of the core part of the data collection, beginning with the initial baseline recording of physiological signals and finishing with the end of the second Stroop test. These data collection steps were registered from an overhead perspective using a video camera. The video recordings captured each participant’s positions and sitting behavior during the implementation of the assigned computer-bound tasks.
All participants in the experiment were asked to complete the Stroop test twice—sitting on a chair in their usual comfortable work posture, and sitting on a stability disk placed on the chair. When performing Stroop Test #1, each participant was sitting in an office chair in their usual working position with a computer. While working on Stroop Test #1, a picture of their spontaneous sitting posture was taken from the perspective of the left profile. At some point, the medical doctor corrected the sitting posture of the participant to correspond to the ergonomic body position, and then another picture was taken. The latter corresponds to the condition referred to as “corrected sitting posture”.
When performing Stroop Test #2, the participant was sitting on the stability disk placed on the chair, which forces active sitting and helps to maintain the ergonomic body posture. While working on Stroop Test #2, another picture of the participant was taken from the perspective of the left profile.
After Stroop Test#2, we proceeded with the recording of the second baseline recording of the physiological signals. At this stage, each participant shared experiences and observations during the experiment and answered questions about whether they felt any desk-sitting-related pain in general.
2.3. Tagging of Signals and Pictures
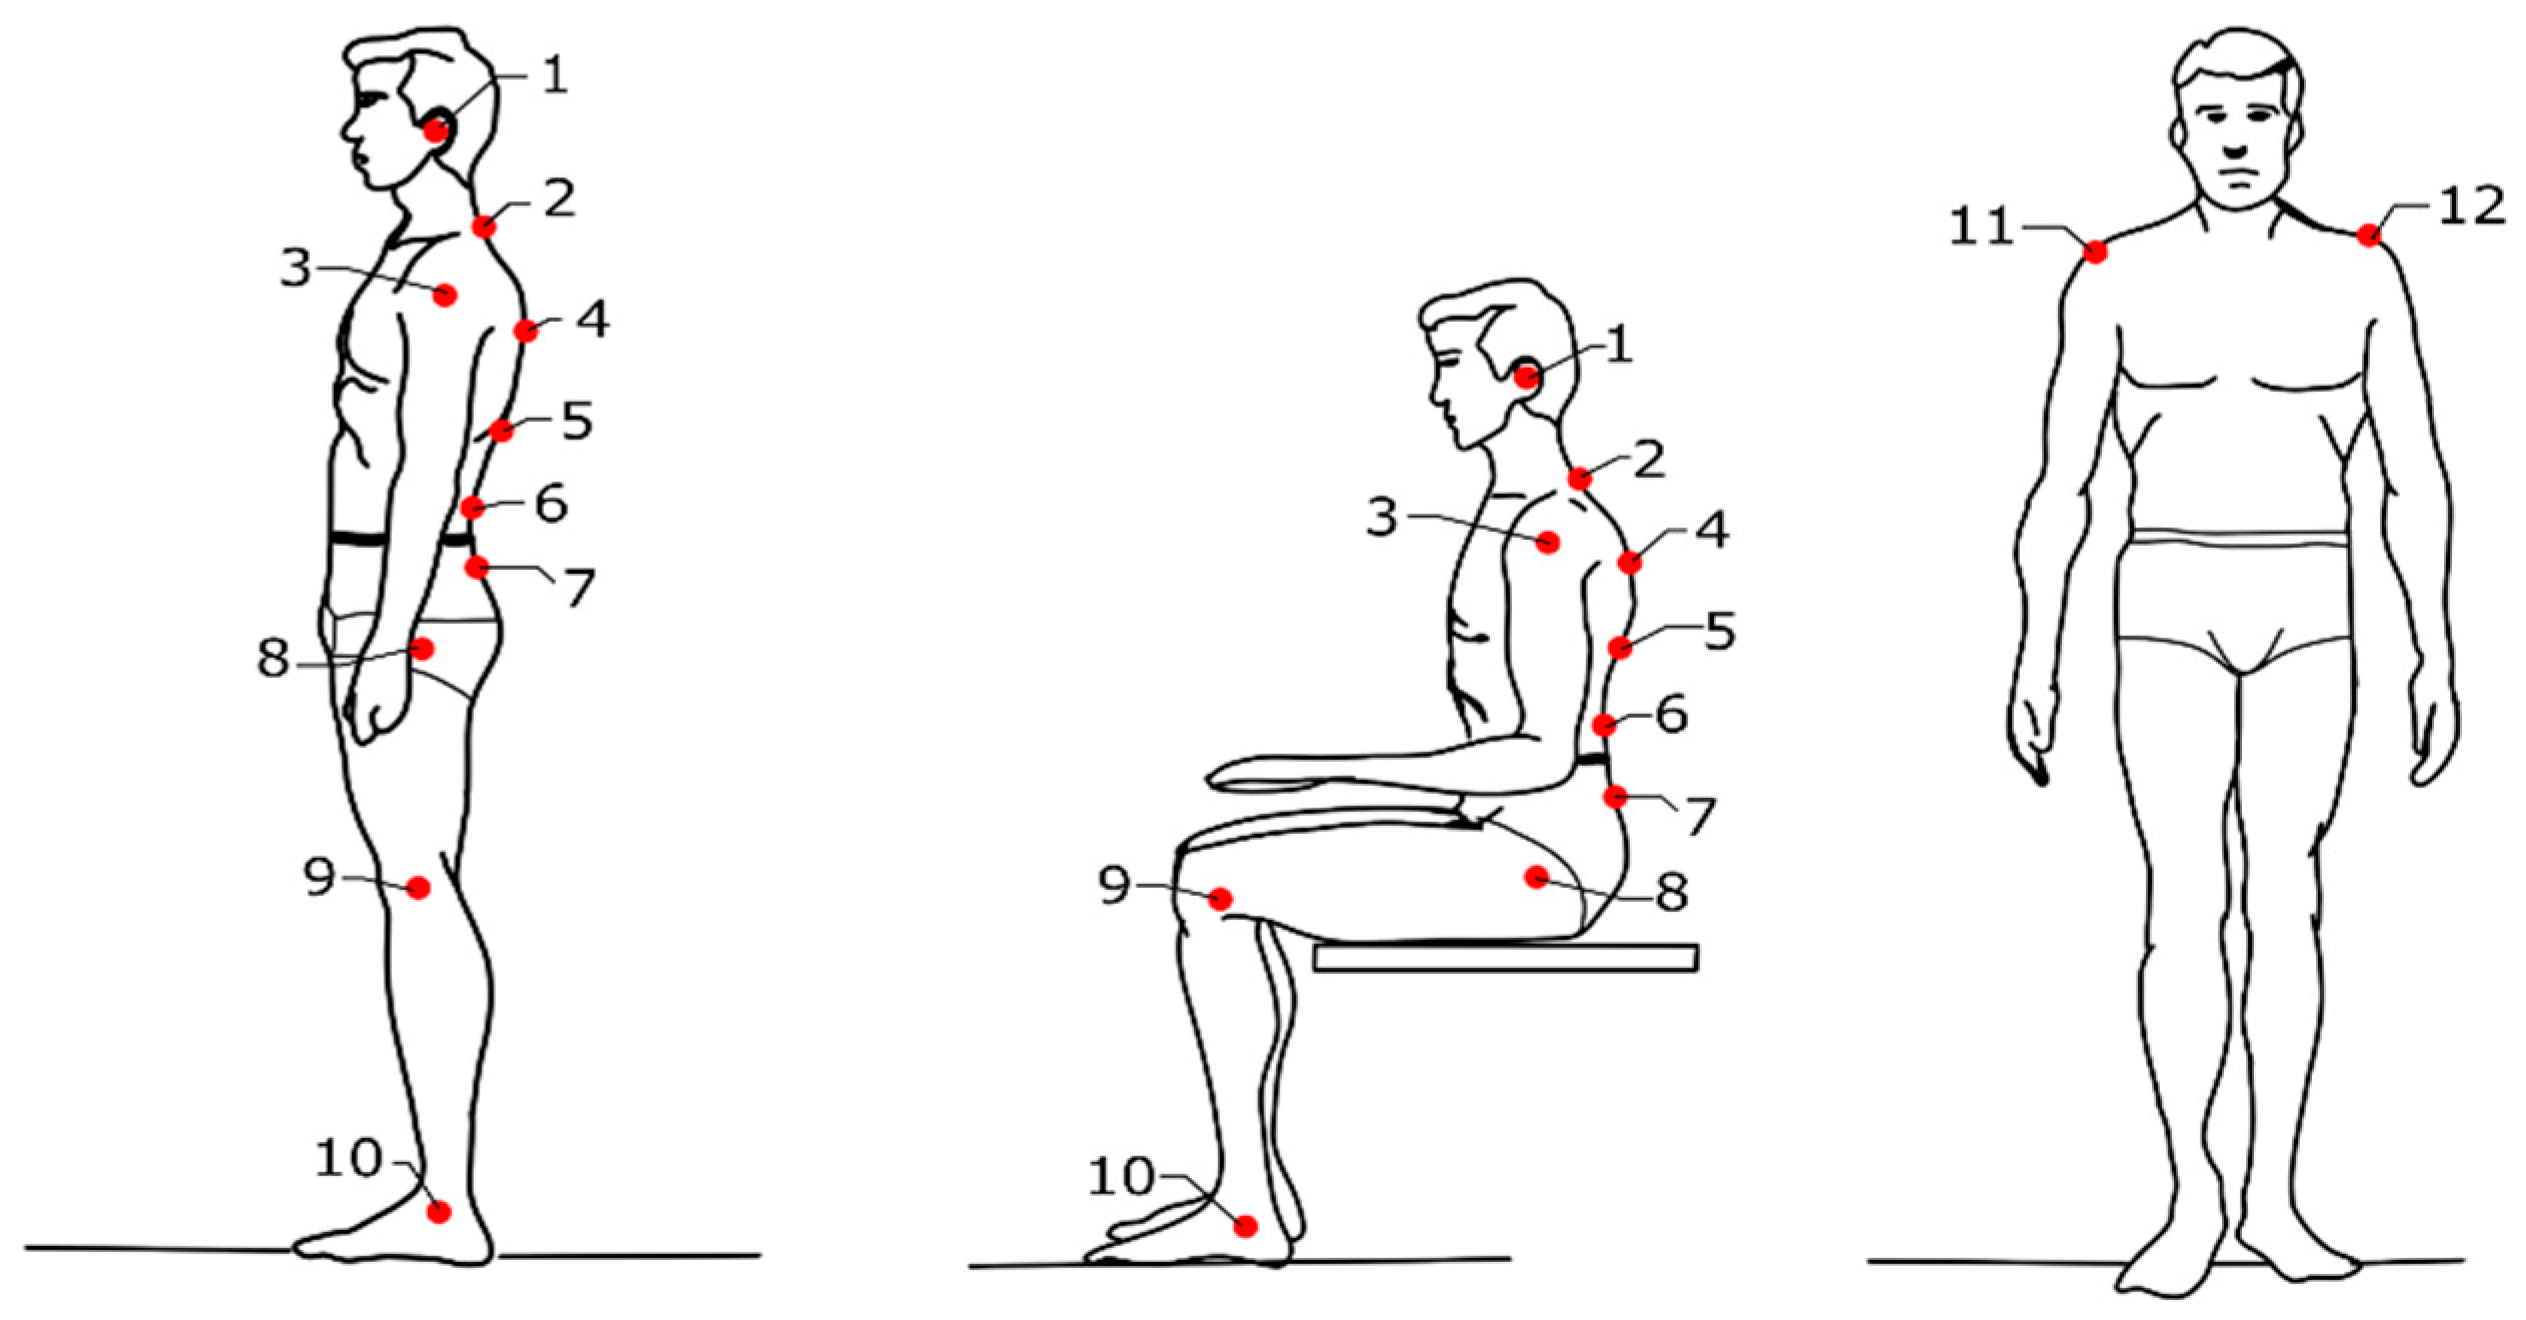
The pictures of each of the 100 participants, standing and sitting in various positions, were post-processed and tagged by two medical doctors who specialize in physiotherapy and have practiced this profession for more than 10 years. They manually placed body markers on the pictures at precisely specified locations on the human body, such as the head, neck, shoulder, thorax, and lower back (cf.
Figure 3).
As shown in
Figure 3, two markers were used for the
en face position, and ten markers were used for the profile positions. The precise marker positions in standing and sitting body postures are specified in
Table 2.
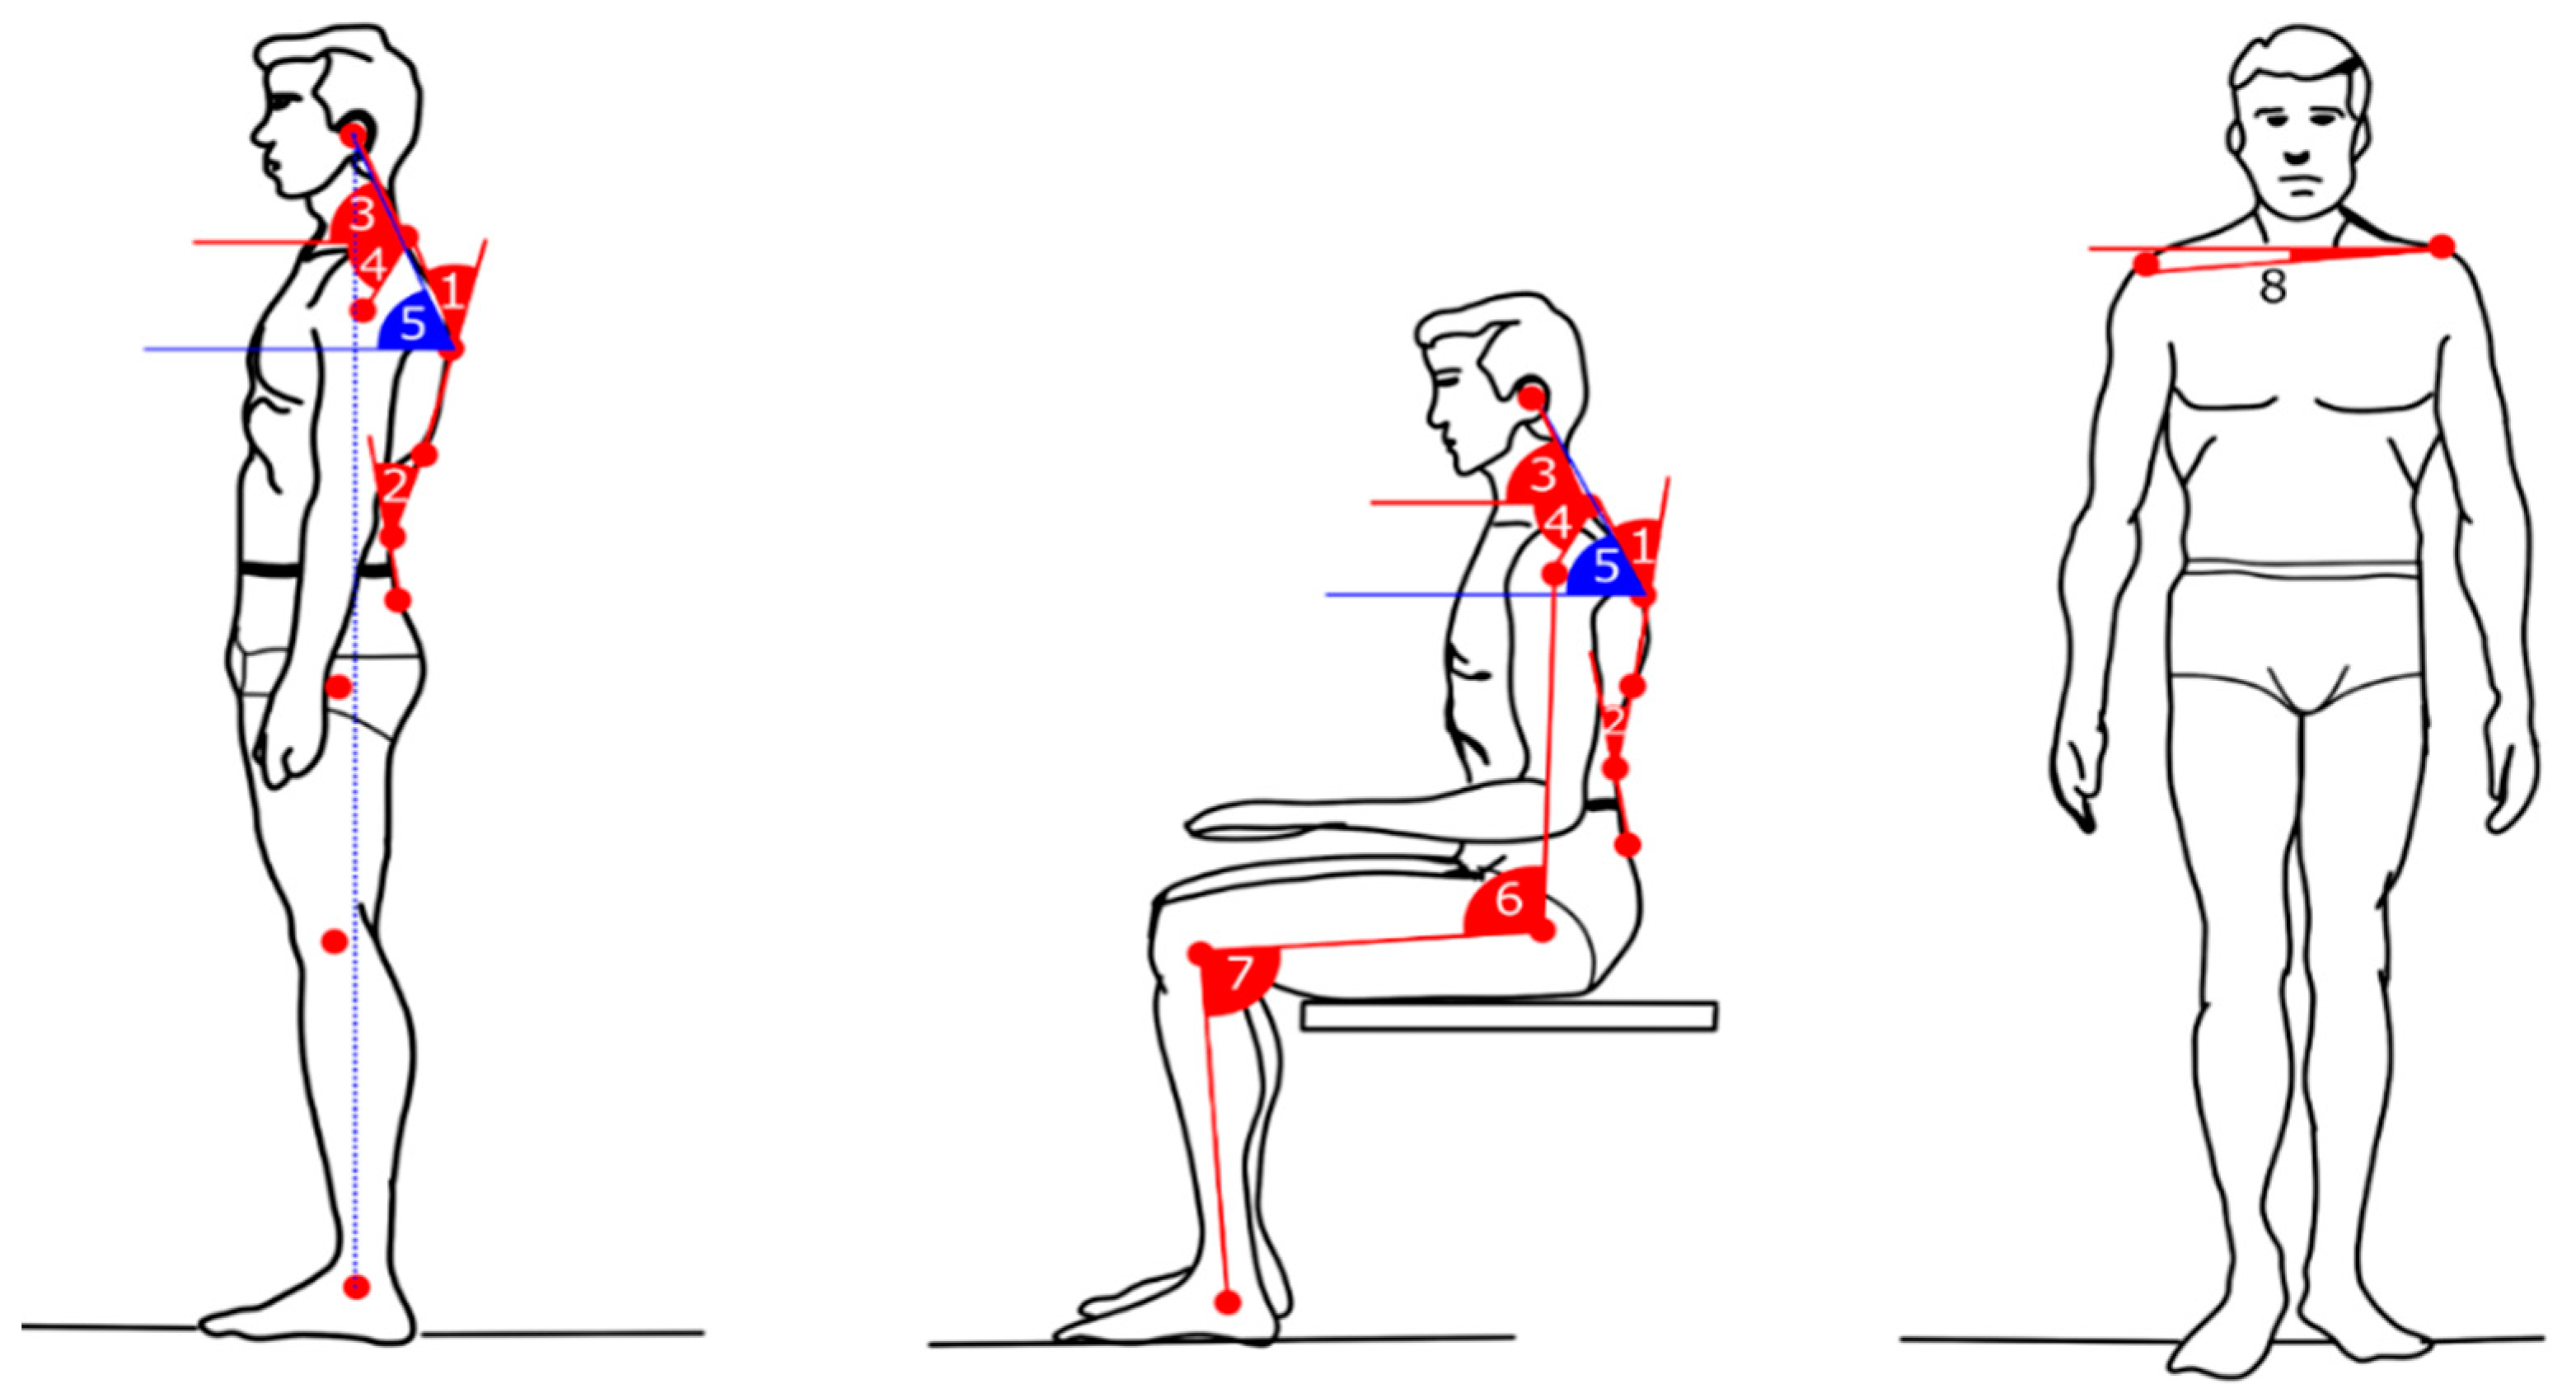
Based on the manually positioned body markers, we calculated various postural angles. These angles are useful for the postural assessment of the head, neck, shoulder, thorax, and lower back (cf.
Figure 4), as well as in the analysis of the reasons for self-reported pain if reported in the entry questionnaire.
In
Table 3, we summarize the postural angles of interest and their reference values. These measurements provide crucial insights into postural alignment and serve as benchmarks for evaluating ergonomic practices.
2.4. Dataset Organization
The MMD-MSD dataset is organized into six main folders, which contain the raw data (physiological signals, pictures, videos), annotated data (pictures with markers, timestamps for the physiological recordings), and data descriptors (angles and features). The folder names correspond to the type of information they contain:
Physiological_Signals_raw—with 100 subfolders, one folder per participant;
Pictures_raw—pictures in .jpg SOOC (straight-out-of-camera);
Pictures_with_markers—either 10 or 2 posture-specific markers, manually placed;
Video—overhead-recorded videos;
Angles—computed based on manually adjusted markers;
Features—computed from the physiological signals PPG, EDA, and ST.
The root folder also contains three files:
StrooptestPerformance.csv—Stroop tests’ data, including participant ID, question number, task complexity (L = low, H = high), participant’s response, correct answer, and reaction time (test 1; test 2);
Dataset Description.docx—technical documentation of MMD-MSD.
Details about the file names and formats are available in
Appendix A.
2.5. Participants’ Demographic Information
The MMD-MSD dataset was collected with the help of 100 volunteer participants, consisting of 64 males and 36 females. The demographic information of these participants is summarized in
Table 4. Most of the male participants were students and teaching assistants, and a few were technical staff. The mean parameters of the males were age 24.71 ± 7.17 years, weight 82.32 ± 17.06 kg, and height 177.5 ± 8.3 cm. Approximately half of the female participants were students, and the others were teaching or administrative staff at the Technical University of Varna. The mean parameters of the female participants were age 34.53 ± 14.03 years, weight 63.06 ± 12.9 kg, and height 169.0 ± 11.02 cm. As seen in the pictures, the non-adjustable office desk was not comfortable for the tallest and heaviest participants. The same holds for the shortest females.
2.6. Questionnaire Self-Reported Data
A summary of the self-reported information provided by the participants concerning their weekly frequency of sports activity and hours of computer use on a per-day basis is presented in
Table 5 and
Table 6, respectively. Two-thirds of the participants reported that they were engaged in some sports activities, and only one-third reported that they get involved in sports activities at most once per week or not at all. However, there were some differences in the sports activity of men (73.4% active) and women (55.6% active). As shown in
Table 4, the distribution of hours spent working with computers was nearly uniform among the four selected categories for both male and female participants. The percentages concerning hours of computer use were nearly identical for men and women.
2.7. Machine Learning Methods
Six well-known machine learning methods, which have previously been used in MSD studies [
12], were trained to discriminate (a) proper vs. improper (protracheal) head position and (b) task-specific cognitive activity vs. active listening/answering in a person-independent scenario. As both tasks required binary classification that aims to discriminate between two categories, we made use of five commonly used discriminative classifiers:
Generalized linear model for classification [
29];
Support vector machine (SVM) [
31];
Feed-forward neural network [
33].
We also used the naïve Bayes [
34] classifier, which is a simple generative method known to build good models even when trained with a small dataset. A comparative evaluation of the classification accuracy on the abovementioned two tasks was performed using the RapidMiner Studio (RapidMiner Studio (© 2024 RapidMiner, Inc (Troy, Michigan, USA). All Rights Reserved) is a software environment providing a rich variety of machine learning and data mining methods; documentation available at
https://docs.rapidminer.com/latest/studio/index.html, 5 April 2024) (version 10.2) implementations of these classifiers [
35]. Ten-fold cross-validation [
36] was used in all experiments to reduce dependence on a specific data split, avoid overfitting during model training, and obtain a robust estimation of the classification accuracy. Specifically, data belonging to each class were randomly split into ten subsets. During each fold, a different group of nine of these subsets was used for training the classifier, and the remaining one was used for evaluation of the classification accuracy. After ten train–test folds, the averaged classification accuracy was computed.
3. Results
We illustrate the complexity of the MMD-MSD dataset and show different research aspects related to working on computer-bound tasks through the two baseline scenarios mentioned in
Section 2.7. These are related to bad posture detection (
Section 3.1) and performance evaluation on a computer-bound task (
Section 3.2). In both cases, we consider person-independent modeling, i.e., the detectors were trained on a subset of data from some users and then tested on a subset of others.
The first scenario evaluates the fundamental concept of automated detection of proper versus improper body postures, utilizing postural angles derived from the MMD-MSD picture set. The proper vs. improper posture models were developed using two categories of tags: those established by medical experts, and those reflecting volunteers’ self-reported levels of discomfort or pain in specific body regions based on the answers to questions 25 and 26 in the introductory questionnaire.
The second scenario evaluates the feasibility of automated detection of cognitive load induced by the Stroop tests against the baseline condition. The cognitive load induced by the Stroop test corresponds to low mental challenge but requires a relatively high level of attention. The baseline condition uses the data recorded during the initial baseline and the second baseline steps. Thus, the baseline condition represents the cognitive effort required during active answering, human-to-human communication to discuss one’s own experiences, or filling in a declaration and a questionnaire.
3.1. Detection of Improper Body Posture
The craniovertebral angle (CVA) serves as a widely recognized measure for evaluating forward head posture (FHP). FHP is characterized by a CVA measurement below the threshold of 48–50°. It is noteworthy that the degree of FHP severity escalates with a reduction in CVA. Hence, there exists an inverse relationship between FHP and CVA magnitude, indicating that FHP tends to increase as CVA diminishes. In our study, 84% of participants exhibited a CVA of less than 50° while engaged in computer work [
37]. This posture imposes a strain on the neck muscles and skeletal structure, potentially leading to muscular imbalances attributable to uneven distribution of muscle load. This is why we considered it important and attempted to detect this condition based on the MMD-MSD dataset.
Below, we consider the task of improper head position detection (protracheal head posture) in a person-independent scenario, which is further reduced to a two-class classification problem—proper vs. improper head positions. Particularly, we sought the automated detection of improper head position based on postural angles #3 and #4 derived from the MMD-MSD pictures, while the volunteers were in their spontaneous sitting posture. For that purpose, we experimented with two scenarios:
In
Table 7, we show the average classification accuracy obtained for the two different sets of tags. The best average classification accuracy of 80% (
Experiment 2) was obtained with random forest. The observed lower detection accuracy for the self-reported tags (
Experiment 1) can be explained by the fact that most of the participants were young people, with most of them actively involved in sports. Their bodies were fit, which partially compensates for the improper body position and does not immediately result in neck pain. The tags established by the medical doctors (
Experiment 2) correspond to an improper neck posture that increases the risk of pain in the specific area, even if this pain is not felt chronically or reported yet.
For the other classifiers, namely, naïve Bayes and decision tree C4.5, we observed much lower detection accuracy in both scenarios. We deemed that the lower classification accuracy of the naïve Bayes classifier was primarily due to the high correlation and the significant redundancy of information carried by angles #3 and #4, which violated the feature independence assumption implicit in the naïve Bayes classifier. The lower accuracy observed for the C4.5 decision tree can be explained by the loss of information forced by choosing either angle #3 or angle #4 as the top-level node. None of these angles is decisive, and this limits the opportunity for making proper decisions at a lower node if an error is made at an upper node.
3.2. Detection of Cognitive Activity
We considered a person-independent scenario for the detection of cognitive activity. Specifically, using the physiological signals available in the MMD-MSD dataset, we aimed at the discrimination of task-specific mental workload. For that purpose, we used the elicited task-specific cognitive activity (Stroop Test #1 and Stroop Test #2) vs. the baseline active listening/answering while the volunteer (a) was instructed and filled in the entry questionnaires and (b) talked about their experiences during the Stroop tests with and without the stability disk.
In this scenario, the two-class classification was based on feature vectors computed from the peripheral physiological signals (photoplethysmography (PPG) and galvanic skin response (GSR)), following the methodology outlined in the reference [
38]. When compared to [
38], we did not use the (i) mean absolute value of the peaks, (ii) skewness, or (iii) kurtosis of the peak’s distribution, because these were found to be loosely correlated with the cognitive load detection task. However, an additional feature was added -- the ratio between the short- and long-term variability of PPG (i.e., the SD1-to-SD2 ratio). Therefore, we considered feature vectors consisting of 37 attributes, as outlined in
Table 8.
Following the procedure outlined in
Section 2.7, we used ten-fold cross-validation in all experiments for cognitive load detection based on peripheral physiological data. Experimenting with the six classification methods, we noticed that the feature selection process of RapidMiner Studio tended to reject four of the features outlined in
Table 8, due to their low correlation with the task labels. These were the (i) min NN interval, (ii) mean resistance, (iii) percentile 2.5, and (iv) percentile 10. Therefore, we excluded these, and all results reported here are for a feature vector consisting of the remaining 33 features. In addition to the raw feature vector, we also considered a z-normalized feature vector, where each attribute was adjusted to zero mean and unit standard deviation.
In
Table 9, we report comparative results in terms of average classification accuracy for the 100 participants in the MMD-MSD dataset. We compared the averaged classification accuracy for the generalized linear model with LBFGS solver; naïve Bayes with Laplacian correction; decision tree C4.5 with leaf size one, accuracy optimization criterion, and max depth 15; support vector machine (SVM) with RBF kernel, with the regularization parameter C equal to 10 and gamma equal to 0.005; random forest with 20 trees and max depth 7; and a feed-forward neural network classifier with four layers (33-50-50-2), where the first three layers consist of neurons with ReLU activation functions, and the two output neurons have softmax activation functions. The performance of each classifier was optimized via a grid search of the adjustable parameters, based only on the training data.
As shown in
Table 9, we observed low classification accuracy for all classifiers. The z-normalization did not contribute to the improvement of the classification accuracy. The relatively low recognition accuracy obtained for all classifiers can be explained by the high person-specific variability in the physiological parameters of the 100 participants. In
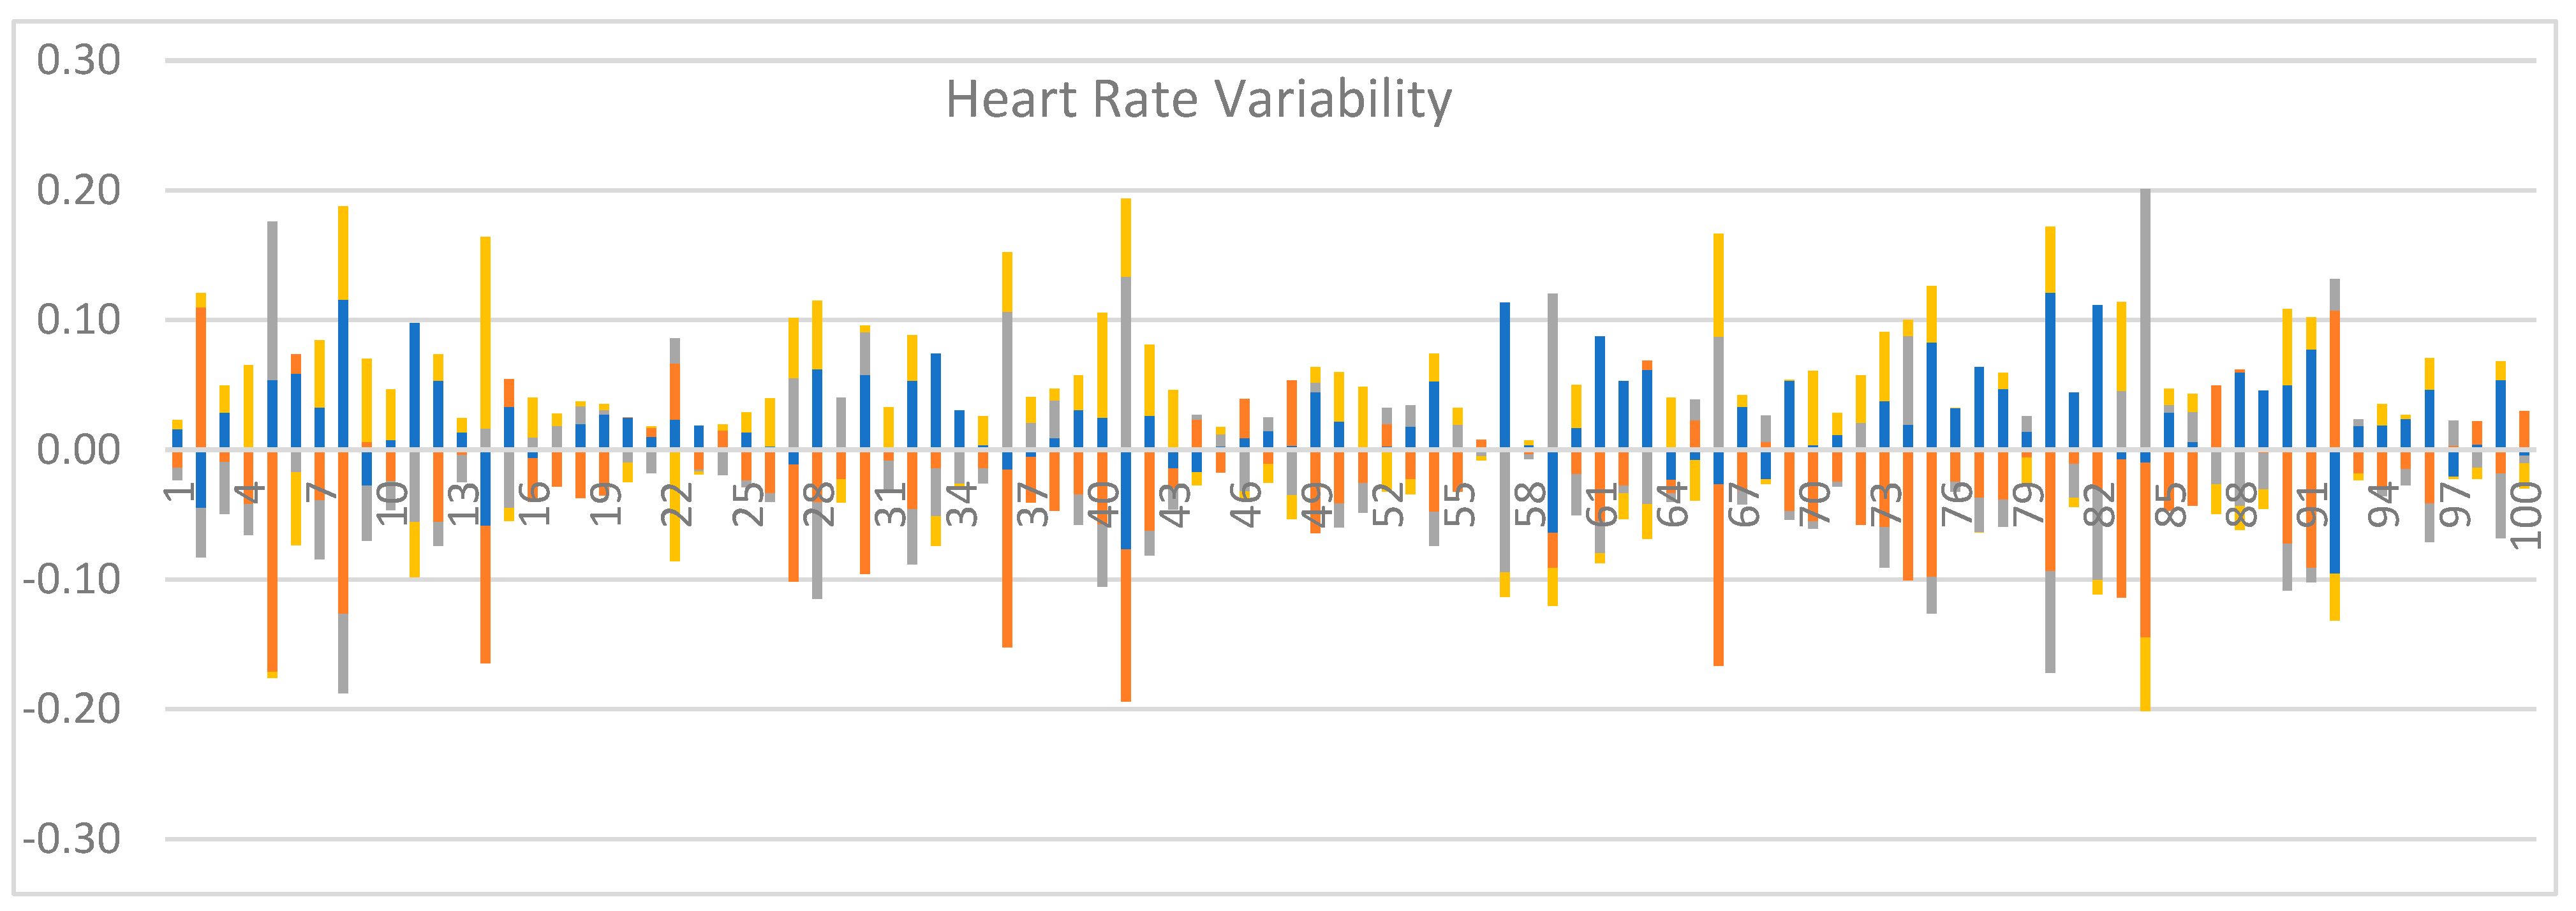
Figure 5, we show the mean values of one attribute (HRV) in the four recording scenarios (Baseline #1, Stroop Test #1, Stroop Test #2, Baseline #2), which make it difficult to model all data with a unified approach, perhaps calling for the use of much more complex modeling methods and/or more discriminative feature vectors.
4. Conclusions
The MMD-MSD dataset is a unique resource in support of research and technology development activities oriented towards MSD prevention. It creates opportunities for a thorough evaluation of different factors contributing to pain and performance reduction. For each participant in the dataset, there are self-assessment data obtained via questionnaire and discussions, direct measurements (including pictures and postural angle calculations), observational assessments (via video recordings during work activities), motion data (three-axis accelerometers), and registrations of peripheral physiological signals (EDA, PPG, skin temperature) captured during assignments involving mental activity (Stroop test).
Some important highlights include the following:
The MMD-MSD dataset provides a unique combination of sensor recordings in support of multidisciplinary RTD in support of MSD prevention. Here, we reported experimental results on the detection of (i) improper neck posture and (ii) task-specific cognitive activity, which illustrate two distinct use cases.
MMD-MSD stands out as a publicly available resource comprising the recordings of 100 volunteers. It is among the largest publicly available datasets that are currently available in support of automated postural angle detection research, ergonomic assessment of sitting body postures in an office environment, and cognitive load detection. The dataset’s size permits person-independent modeling of bad postures, but also further research on person-specific model adaptations.
Based on the success rates on the Stroop test, we can confirm that active sitting on an air-cushioned stability disk improves both the sitting posture and performance when compared to sitting on a desk chair. This is in excellent agreement with previous studies investigating stability disks’ effectiveness.
For completeness, we need to point out the lack of postural annotations for the video recordings as a major limitation for the wider use of MMD-MSD. Thus, researchers interested in making use of the video recordings will need to invest additional effort in their annotation, either automatically or semi-automatically. In this regard, one would have to use unsupervised training to create a person-specific model of sitting postures and then try to discover and automatically track the ten marker positions (cf.
Table 2 and
Figure 3), and then, based on these, to estimate the posture angles shown in
Table 3 and
Figure 4. These angles would need to be manually inspected for at least a portion of the video before they could be considered as annotations of the videos. Finally, one would need to measure the accuracy of video-based models based on the gold-standard (ground-truth) angles specified by the medical experts for the person-specific picture set (cf.
Figure 1). We are aware of the significant effort required for video annotation, so we decided to share the MMD-MSD dataset as soon as possible and seek support from the research community.
Considering the broader perspective, it is well understood today that, over time, sustained poor posture can lead to discomfort or pain in various areas of the spine. Many professional computer users are aware that maintaining improper posture for prolonged periods imposes additional stress and strain on the muscles, joints, and connective tissues of the back, neck, shoulders, and lumbar spine. Symptoms such as impaired blood circulation, digestive issues, compromised lung function, temporomandibular disorders, and headaches are not rare among office workers. In addition to discomfort, prolonged bad sitting posture and inadequate workplace ergonomics can cause structural damage to the spine over time, potentially resulting in recurring episodes of neck or back pain. All forms of bad posture are detrimental and increase health risks if not corrected promptly. Certain combinations of incorrect postures, such as prolonged head posture coupled with increased thoracic kyphosis and lumbar lordosis, can exacerbate spinal load and pain symptoms compared to isolated incorrect postures affecting only one section of the spine, such as increased thoracic kyphosis alone. All of these factors have motivated recent studies on real-time bad posture detection, which have made use of smart belts equipped with inertial sensors [
39] and real-time monitoring systems providing biofeedback [
40] that could help many computer users overcome their habits of sitting in bad postures.
We deem that the MMD-MSD dataset, alone or in combination with other datasets, could be a useful resource during the development of office monitoring tools capable of real-time detection of bad sitting postures. Furthermore, such real-time systems could be of significant importance for addressing a wider scope of MSD-related risks that threaten health and workforce efficiency in developed countries [
41]. Considering the current trends for the aging of the world population and the corresponding increase in retirement age in many countries, the consequences of MSDs will probably have an even bigger impact on the quality of life and efficiency of the workforce worldwide [
42].


