Article

Research on Efficient Feature Generation and Spatial Aggregation for Remote Sensing Semantic Segmentation

1
College of Information and Management Science, Henan Agricultural University, Zhengzhou 450046, China
2
College of Agronomy, Henan Agricultural University, Zhengzhou 450046, China
*
Author to whom correspondence should be addressed.
Algorithms 2024, 17(4), 151; https://doi.org/10.3390/a17040151
Submission received: 5 March 2024 / Revised: 28 March 2024 / Accepted: 29 March 2024 / Published: 4 April 2024
(This article belongs to the Special Issue Algorithms in Data Classification (2nd Edition))

Abstract

:
Semantic segmentation algorithms leveraging deep convolutional neural networks often encounter challenges due to their extensive parameters, high computational complexity, and slow execution. To address these issues, we introduce a semantic segmentation network model emphasizing the rapid generation of redundant features and multi-level spatial aggregation. This model applies cost-efficient linear transformations instead of standard convolution operations during feature map generation, effectively managing memory usage and reducing computational complexity. To enhance the feature maps’ representation ability post-linear transformation, a specifically designed dual-attention mechanism is implemented, enhancing the model’s capacity for semantic understanding of both local and global image information. Moreover, the model integrates sparse self-attention with multi-scale contextual strategies, effectively combining features across different scales and spatial extents. This approach optimizes computational efficiency and retains crucial information, enabling precise and quick image segmentation. To assess the model’s segmentation performance, we conducted experiments in Changge City, Henan Province, using datasets such as LoveDA, PASCAL VOC, LandCoverNet, and DroneDeploy. These experiments demonstrated the model’s outstanding performance on public remote sensing datasets, significantly reducing the parameter count and computational complexity while maintaining high accuracy in segmentation tasks. This advancement offers substantial technical benefits for applications in agriculture and forestry, including land cover classification and crop health monitoring, thereby underscoring the model’s potential to support these critical sectors effectively.

Graphical Abstract

1. Introduction

Semantic segmentation of RS images is a pivotal technology for the intelligent interpretation of RS data. It facilitates the automatic detection and recognition of valuable targets within the extensive datasets of visible light RS images, marking it a significant area of research in the realm of RS image processing. This technology finds broad applications in various agricultural domains, including monitoring agricultural practices, assessing agricultural disasters, managing irrigation systems, and improving planting techniques [1]. The burgeoning interest in segmentation methods based on convolutional neural networks (CNNs) in recent years can be attributed to the swift advancements in graphics processors’ capabilities and the rapid proliferation of high-resolution RS images.
Since the groundbreaking introduction of Fully Convolutional Networks (FCNs) [2], there has been an extensive body of work focused on segmentation tasks leveraging deep convolutional neural networks. The original FCN methodology encountered two primary limitations: firstly, it reduced the resolution of features, leading to a loss of detailed spatial information; secondly, it had a limited effective receptive field, failing to capture long-range dependencies. Most studies have predominantly utilized multi-scale contexts formed by pixels that are spatially adjacent or sampled. For instance, the Pyramid Pooling Module (PPM) in PSPNet [3] segregates all pixels into several regions, selecting all pixels within the same region for context. In the architecture of DeepLabv3 [4], the Atrous Spatial Pyramid Pooling (ASPP) module uses convolutional kernels of various sizes for image processing. This approach enables the capture of both minute details and the overall structure within images. In the Transformer [5] model, self-attention and multi-head attention mechanisms aid the model in focusing on crucial areas of RS images, allowing it to concurrently pay attention to several significant sections of the image and comprehend their interrelations. Therefore, the pixels chosen by the PPM context, ASPP context, and the context from the self-attention and multi-head attention mechanisms often constitute a mix of object pixels, relevant background pixels, and irrelevant background pixels. Nonetheless, such models typically exhibit high computational complexity and slow inference times, rendering them challenging for deployment on various embedded platforms.
Currently, research in RS segmentation has evolved from focusing on accuracy improvements to optimizing for speed. MobileNetV2 [6] deconstructs standard convolutions into group convolutions and pointwise convolutions. It groups different feature maps of the input layer, then applies different convolution kernels to each group, thereby reducing the computational load of the convolutions. Based on this, depthwise separable convolution modules and inverted residual modules were developed, achieving significant compression of the network parameters. Moreover, the parameters of MobileNetV3 [7] were obtained through Network Architecture Search (NAS), and the Squeeze-and-Excitation (SE) channel attention mechanism was introduced [8], effectively enhancing network performance further. However, the grouping operation in MobileNet, due to the lack of connections between different groups, results in very limited learned features and can easily lead to the loss of semantic information. Therefore, researchers proposed ShuffleNet [9]. Its core design principle is to shuffle different channels to address the issue of homogeneity brought by group convolution, using multiple convolutional layers to construct a more robust structure. PeleeNet [10], inspired by MobileNetV1 [11], is a lightweight network architecture that utilizes Two-Way Dense Layers to enhance the flow of features both forward and backward, capturing a broader array of effective features. However, when these lightweight structures are applied to RS image segmentation, they often overlook the redundant features in RS images, significantly reducing the precision of feature capture. Moreover, relying solely on the semantic information of individual pixels is often insufficient for accurately determining their category, leading to a noticeable decline in the model’s segmentation performance. Specifically, we have the following: (1) The backbone of existing lightweight network architectures, due to the use of grouped convolutions, which divide the feature map into multiple groups, causes an insufficient exchange of feature information between each group. This overlooks some useful redundant features, leading to a weakened ability to represent features. (2) Existing lightweight networks often employ larger strides or larger pooling windows to reduce the dimensions of the feature map, resulting in the loss of spatial feature information. Due to the use of smaller receptive fields, the network struggles to integrate enough neighboring pixels to enhance the classification ability of individual pixels, thereby causing inefficiency in the network’s convolutional structure.
Through the analysis above, it is evident that previous designs of lightweight convolutional structures struggle to balance maintaining lightness with enhancing segmentation accuracy. Therefore, in this paper, we introduce RRMSA-Net, consisting of the Rapid Redundant Feature-Generation (RRG) and multi-level spatial aggregation (MSAS) modules. Specifically, we first prioritize spatial feature optimization as the network backbone, replacing standard convolution operations with a module that generates feature maps while reducing computational burden. Secondly, to enhance the feature representation capability of feature maps after linear transformations, we designed a set of dual-attention mechanisms. By weighting the attention of these feature maps in both the spatial and channel dimensions, we establish contextual dependencies across different dimensions on local features, improving the feature-extraction capability. Lastly, to fully utilize neighboring pixels for accurate category discrimination, we designed a multi-scale context-aggregation module aimed at enhancing the model’s understanding of context through effective aggregation of neighboring spatial features, thereby achieving improvements in RS segmentation accuracy. Our contributions are as follows:
(1)
We conducted a systematic analysis of the contribution of redundant features to segmentation and the impact of spatial contextual information on segmentation performance.
(2)
To address the issue of the loss of redundant features, we introduced the “Rapid Redundant Feature-Generation” module. This module achieves higher segmentation accuracy with significantly fewer computational resources than conventional backbone architectures, and notably enhances inference speed.
(3)
To tackle the problem of missing semantic information in individual pixels, we propose the “multi-level spatial feature aggregation” module. This module effectively aggregates neighboring spatial features to enhance the model’s understanding of context, thereby improving segmentation accuracy.

2. Materials and Methods

Unlike previous studies, this paper conducts an in-depth and systematic analysis of the inconsistency between classification and regression features in the field of remote sensing image processing. To address these challenges, we introduce the Wide-Area Feature Segmentation Network, RRMSA-Net. In Figure 1, This network architecture combines two major modules: “Rapid Redundant Feature Generation (RRG)” and “multi-level spatial aggregation (MSAS)”. The RRG module extracts foundational information from a set of intrinsic feature maps through cost-effective linear transformations, reducing model complexity while enriching feature representation. The MSAS module integrates hierarchical adaptive attention and multi-scale contextual techniques, employing tiered associative mapping to amalgamate features of various scales. This optimizes computational efficiency and preserves essential information, enabling efficient and precise remote sensing image segmentation.

2.1. Data Introduction

In this study, we selected the GF-6 [12] satellite for its representative GF-6 PMS data, which is highly suitable for detailed land cover classification due to its superior spatial and spectral resolution. To enhance data quality and ensure the accuracy of our analysis, we applied the following preprocessing steps to the original remote sensing data: radiometric correction, atmospheric correction, orthorectification, and image fusion. The processed remote sensing images were preserved with four spectral bands: Band 1 (Red), Band 2 (Blue), Band 3 (Green), and Band 4 (Red Edge). We chose imagery from four critical phenological stages of winter wheat: 1 November 2020; 2 December 2020; 4 February 2021; and 6 April 2021.
ACGF Dataset: The ACGF dataset. Developed by processing GF-6 PMS data, we have constructed the ACGF dataset for the classification of 129 land cover features. This dataset comprises 8386 images showcasing various land cover types in remote sensing imagery. The classification categories were determined based on the prominent land cover types evident in remote sensing imagery: (1) Winter Wheat, the primary agricultural crop; (2) Urban Buildings, encompassing various urban constructions and infrastructure; (3) Water Bodies, including rivers, lakes, etc.; (4) Uncultivated Farmland, denoting areas not effectively developed or utilized; (5) Roads, covering transportation networks; (6) Other Crops, including agricultural crops other than winter wheat, noting the increased segmentation challenge due to the fragmentation of winter wheat fields and the complexity of the surrounding areas. The selection of these categories reflects the diversity of our study and underscores the necessity for accurate land cover classification.
The LoveDA [13] dataset consists of 0.3 m high-resolution images from Google Earth of three different cities, including land cover types such as buildings, roads, green spaces, bare land, water bodies, cultivated land, and others.
The LandCoverNet [14] dataset is primarily made up of 10 m resolution images from Sentinel-2, covering a wide range of geographic and ecological environments globally. It includes land cover types such as buildings, forest land, grassland, bare land, shrubland, water bodies, cultivated land, snow/ice, and submerged vegetation.
The DroneDeploy [15] dataset comprises 10cm high-resolution aerial images captured by drones, including land cover types such as buildings, debris, vegetation, water bodies, buildings, ground, and vehicles.
The PASCAL Visual Object Classes (VOC) [16] dataset is a significant dataset in the field of computer vision research, utilized by the Pattern Analysis, Statistical Modeling, and Computational Learning (PASCAL) network in the Visual Object Classes Challenge. This dataset comprises a large number of images captured from various angles, covering a wide range of object categories including people, animals, vehicles, and furniture. The diverse backgrounds of these images increase the difficulty of recognition and segmentation tasks. Each image is provided with detailed annotation information, including object bounding boxes (for object detection tasks) and pixel-level object contours (for image segmentation tasks). The PASCAL VOC has had a profound impact on the advancement of the computer vision field, particularly in object recognition and image segmentation technologies.

2.2. Evaluation Metrics

In semantic segmentation, different positions and targets may appear in each RS image, necessitating a comprehensive evaluation of the model’s performance at each location and for each target. Specifically, we used the Mean Intersection over Union (MIoU), F1-Score, and loss function as evaluation metrics to assess, in a comprehensive and objective manner, the performance of our improved lightweight structure’s DeepLabv3+ model in the task of RS image semantic segmentation.
The Mean Intersection over Union (MIoU) [17] is a key performance metric for segmentation. For multi-class tasks, the calculation of the intersection over union (IoU) for each category is treated as a binary classification task: belonging to that category or not. Subsequently, the average across multiple categories is taken, and the calculation method based on the confusion matrix is shown as in the equation below. The formula for the MIoU is as follows:
M I o U = 1 n i = 1 n a i i j = 1 n a i j + j = 1 n a j i a i i .
By considering the segmentation accuracy for each category, a detailed assessment of individual targets can be provided, emphasizing the model’s performance at the pixel level. In RS images, different positions and targets may appear in each image, and introducing the MIoU helps to evaluate the overall accuracy of the model, not just focusing on the performance for a single target.
F1-Score [18]: By comprehensively considering precision and Recall, it is suitable for situations with class imbalance and takes into account both misclassification and omission. The F1-Score is calculated as the harmonic mean of precision and Recall. Precision and Recall are defined as follows:
P r e c i s i o n = T P + F P T P
R e c a l l = T P + F N T P
F 1 = P r e c i s i o n + R e c a l l 2 · P r e c i s i o n · R e c a l l .
In the formula: True Positive TP refers to the number of samples predicted as positive, i.e., the number of positives correctly detected by the model; False Positive FP indicates the number of samples predicted as positive, which are actually negatives mistakenly predicted as positives by the model; False Negative FN) represents the number of samples predicted as negative, which are actually positives incorrectly predicted as negatives by the model. In the context of the segmentation of RS images, due to the fact that RS images typically contain multiple categories of targets with an uneven distribution, relying solely on precision or recall may lead to performance bias. The F1-Score, by balancing these two metrics, effectively addresses the issue of class imbalance, ensuring the model’s comprehensive and accurate recognition of all categories, thereby enhancing the accuracy and reliability of the overall segmentation effect.

2.3. Module One: Rapid Redundant Feature Generation (RRG)

In most frameworks for the segmentation of remote sensing images, leveraging existing convolutional architectures as feature extractors leads to the creation of numerous redundant feature channels. Diminishing these channels could result in the loss of crucial information, such as edges and textures, negatively impacting segmentation accuracy. On the other hand, retaining these redundant features escalates computational complexity, which could hinder the model’s efficient deployment on embedded or edge computing platforms. To overcome these challenges, this paper introduces a module for Rapid Redundant Feature Channel Generation, executed through RRG. This module is designed to swiftly generate feature maps, aiming to preserve accuracy with minimal loss while significantly increasing the generation speed of feature maps, thereby effectively minimizing computational complexity.

2.3.1. Efficient Spatial Feature Optimization Module (ESFO)

The output feature maps from convolutional layers often contain a significant amount of redundancy, with some feature maps being similar to each other. The generation of feature maps usually involves numerous convolution operations, leading to high computational complexity and an increase in memory usage and FLOPs. Therefore, it is unnecessary to generate these redundant feature maps through a multitude of convolution operations individually. In Figure 1, The ESFO strategy considers the output feature maps as “derived feature maps” obtained through the linear transformation of intrinsic feature maps, with the formula as follows:
y i j = Φ i , j ( y 0 i ) , i = 1 , , m , j = 1 , , s .
In this context, y 0 i is the i-th intrinsic feature map within Y 0 , and Φ i , j is the linear operation used to generate the j-th derived feature map y i j . These derived feature maps are then concatenated with the intrinsic feature maps to form a complete convolution layer, as follows:
Y = c o n c a t e n a t e ( Y 0 , Y i j ) .
In the formula, Y represents the final output feature map, Y 0 denotes the original intrinsic feature maps, and Y i j signifies the derived feature maps, generated by applying the linear transformation Φ i , j to Y 0 . The concatenate operation, by merging the derived feature maps with the intrinsic feature maps, effectively expands the dimension of the feature representation without significantly increasing the computational burden. This concatenation strategy ensures that the network, while reducing the number of parameters and computational costs, can still capture and retain the richness and diversity of the input data. The application of linear transformations allows each derived feature map to be processed independently and in parallel, thereby enhancing the overall computational efficiency.

2.3.2. Bilateral Dual-Attention Mechanism Module (BDAM)

To enhance the quality of redundant feature maps generated during the linear transformation process, a Bilateral Dual-Attention Mechanism (BDAM), which combines spatial and channel attention for feature enhancement, has been designed.
In Figure 2, The spatial attention mechanism begins with a given local feature A, with dimensions R C × H × W , being input into a convolution layer. This step generates two new feature maps B and C, each maintaining the same dimensions as A ( R C × H × W ) . Next, these feature maps are transformed into the form R C × N , where N is the total number of pixels, that is N = H × W . Subsequently, a spatial attention map S, with dimensions R N × N , is computed by performing matrix multiplication of the transpose of C and B, followed by the application of a softmax layer. The formula for this is as follows:
s j i = e x p ( B i · C j ) i = 1 N e x p ( B i · C j ) .
In the formula, s j i measures the influence of the i-th position on the j-th position. In this way, we can assess the interactions between different positions within the feature map. The higher the similarity of the positional features, the stronger their associativity. The original feature A is then input again into a convolution layer to generate a new feature map D, with dimensions R C × H × W . This map is subsequently reshaped into R C × N . Next, we compute the matrix multiplication between D and the transpose of S and reshape the result back into the form of R C × H × W . In the final step, we multiply this result by a scaling parameter α and add it elementwise to the original feature A to obtain the final output E, which also has dimensions R C × H × W . This process can be represented by the following formula:
E j = α i = 1 N ( s j i D i ) + A j
In the formula, α is initially set to 0 and is gradually adjusted to provide different weights. From this formulation, we can see that the final feature E at each position is a weighted sum of all position features and the original features. This mechanism enables the model to understand the image from a global contextual perspective and selectively integrate these contextual pieces of information based on the spatial attention map.
Secondly, in Figure 3, the channel attention mechanism, each channel map of high-level features can be viewed as a response to a specific category. The different semantic responses are interrelated. By leveraging the interdependencies between channel maps, we can emphasize mutually dependent feature maps, thereby improving the feature expression capability for specific semantics. Consequently, we have constructed a channel attention module to explicitly model the interdependencies between channels.
Unlike the spatial attention module, we calculate the channel attention map X R C × C directly from the original features A R C × H × W . Specifically, we reshape A into R C × N , then perform matrix multiplication between A and its transpose. Finally, we apply a softmax layer to obtain the channel attention map X R C × C :
x j i = e x p ( A i · A j ) i = 1 C e x p ( A i · A j ) .
In this context, x j i measures the influence of the i-th channel on the j-th channel. Moreover, we perform matrix multiplication between the transpose of X and A and reshape the result into R C × H × W . Then, we multiply by a scaling parameter β and perform an elementwise summation with A to obtain the final output E R C × H × W :
E j = β i = 1 C ( x j i A i ) + A j .
In this context, β is learned gradually, initially set to zero. This mechanism ensures that the final feature of each channel is a weighted sum of the features of all channels and the original features, effectively capturing the long-distance semantic associations between feature maps. This method not only improves the distinguishability of features, but also enhances the model’s ability to process complex semantic information.
In summary, the BDAM attention mechanism module we designed analyzes local details of the image, enhancing the model’s understanding of and response to various parts of the image, improving the model’s ability to recognize different semantic categories, and strengthening the semantic expression of the overall features. The combination of these two modules not only improves the quality of the feature maps, but also enhances the model’s semantic understanding of both local and global information in images, thereby significantly enhancing the accuracy and efficiency of RS semantic segmentation.

2.4. Module Two: Multi-Level Spatial Aggregation Strategy (MSAS)

In remote sensing image segmentation, relying solely on the semantics of a single pixel is often insufficient to accurately determine the category information of that pixel. It is necessary to fully utilize the neighboring pixels for joint determination. Therefore, a multi-level spatial feature aggregation module has been proposed.
In Figure 4, Each branch divides the input into different pyramid scales, and the object context pooling is shared within each branch, then we concatenate the four output feature maps with a new feature map that is generated by increasing the channels of the input feature map by 4 × ( 512 2048 ) .
Initially, this method compresses the channel dimension of the feature maps output by the backbone network through 3 × 3 convolutions. The specific formula is as follows:
F r e d u c e d = C o n v 3 × 3 ( F )
In the formula, F represents the input feature map, F r e d u c e d represents the feature map after dimension reduction through a 3 × 3 convolution, and C o n v 3 × 3 represents the 3 × 3 convolution operation. This approach not only reduces the model’s computational complexity and memory consumption, but also retains key information in the feature map to avoid excessive information loss.
Secondly, to accurately capture contextual information across different spatial ranges, we first divide the dimension-reduced feature map into regions of multiple scales. This enables the model to capture feature information from local details to global structures, which is helpful for understanding and segmenting targets of various sizes and shapes. Then, within each region, we analyze information related to local features, such as color, shape, and texture in that area. On this basis, we use a self-attention mechanism to consider the relationships between pixels within each region, rather than the global relationships of the entire image. This approach processes spatial features at different scales and applies object-based max pooling to enhance the model’s understanding of the interrelationships between different objects within various regions. The formula for this is as follows:
F s p l i t k k = S p l i t ( F r e d u c e d k )
F o c p k = O C P ( F s p l i t k ) .
In the formula, F s p l i t k represents the result of spatially partitioning the dimension-reduced feature map according to the scale k × K ; s p l i t represents the spatial partitioning operation, which divides the dimension-reduced feature map into spatial units of scale K, with the size of each region determined by k, such as 1, 2, 3, or 6, resulting in the feature map being divided into multiple regions of corresponding scales. O C P selects the maximum feature value within each region through max pooling, highlighting the salient features of the target. It applies spatial attention weights to calculate the relationships between features in different regions, further strengthening the connections between features, enabling the model to more accurately capture and recognize important features; F o c p k represents the feature map processed through object-based context pooling (OCP).
Finally, features from different spatial ranges are aggregated using a feature concatenation method. The formula for this is as follows:
F f i n a l = C o n c a t ( F o c p 1 , F o c p 2 , F o c p 3 , F o c p 6 )
In the formula, F f i n a l represents the final comprehensive feature map and C o n c a t denotes the feature map concatenation operation. This multi-level feature processing operation enables the model to better distinguish and recognize various targets, especially in scenes with rich textures and complex backgrounds.
In summary, in RS image segmentation, the multi-scale context aggregation module we designed, by integrating compact 3 × 3 convolutions, sparse self-attention mechanisms, and object-based context pooling, effectively integrates features of different scales and spatial ranges. This approach optimizes computational efficiency and retains key information. This method significantly enhances the model’s ability to segment RS data with rich textures and complex backgrounds.

2.5. Loss Function

The cross-entropy loss function in RS semantic segmentation is a commonly used loss function for multi-class classification problems. In the task of the semantic segmentation of RS images, the goal is to classify each pixel in the image into different categories (for example, different types of land cover). The cross-entropy loss function is very effective in these types of problems because it measures the difference between the predicted probability distribution and the true label distribution. The formula for this is as follows:
L = i = 1 N c = 1 C y i c l o g ( y ^ i c )
In the formula: N represents the total number of pixels in the image; C is the total number of categories; y i c is a binary indicator, where a value of 0 indicates that the pixel does not belong to the target category (for example, ‘winter wheat’), and a value of 1 indicates that the pixel belongs to the target category; y ^ i c is the probability predicted by the model that pixel i belongs to category c.
The objective of the cross-entropy loss function is to minimize the difference between the predicted probability distribution and the actual label distribution. During the training process, by adjusting the model parameters to reduce this loss value, the accuracy of the model in segmenting RS images is improved. This function is particularly suitable for handling situations where there is an imbalance in class categories.

3. Results and Discussion

In this section, comprehensive experimental evaluations were conducted using our custom-developed RS dataset, ACGF, alongside the LoveDA, LandCoverNet, and PASCAL-VOC datasets. Furthermore, the proposed methodology of this paper was juxtaposed against a spectrum of contemporary RS semantic segmentation models. This comparative analysis was undertaken to substantiate the efficacy of the RRMSA-Net framework.

3.1. Experimental Details

Parameter settings: We utilized RRG as the backbone network of RRMSA-Net, applying weights from the Pytorch pre-trained VOC model. MSAS was used for multi-scale detection. Additionally, when the momentum was set to 0.9, the proposed RRMSA-Net was optimized using the Adam optimizer. The initial learning rate was set to 0.005, with a decay rate of 0.1 after 1000 iterations. All experiments were conducted on a server equipped with an Nvidia 3070 (Nvidia Corporation, Santa Clara, CA, USA), based on the Pytorch framework. ResNet was adopted as the baseline. The introduction of any module may complicate the computation.

3.2. Ablation Study

(1)
Evaluation on different components:
We conducted related ablation experiments on the ACGF dataset to validate the performance of the different modules proposed. Table 1 lists the results obtained on ACGF. The baseline model only achieved an average accuracy (MIoU) of 82.9%, due to the original backbone network’s inability to effectively capture the redundant features and edge texture characteristics of winter wheat in the dataset. After using RRG, the performance of the segmenter improved by 2.5%, indicating that RRG can retain redundant feature maps while reducing memory usage, thus optimizing the overall model performance without sacrificing accuracy. With the addition of MSAS, it enables high-quality feature extraction based on the corresponding target semantic information.
In Table 1, a check mark (🗸) indicates the usage of our designed module, while a cross mark (×) indicates otherwise. Our MSAS module has established a robust feature representation capability, leading to a 0.8% performance improvement in our RRMSA-Net. The addition of RRG resulted in a 1.5% increase in model accuracy, demonstrating that proper lightweight model design and multi-level spatial feature aggregation can further enhance segmentation precision. Similar experimental results were obtained on the VOC dataset.
Compared to networks with a single module, those with a combination of different modules achieved better performance. The integration of RRG and MSAS brought about optimization in model computational efficiency and improvement in feature quality, thereby achieving superior segmentation accuracy and classification results. Furthermore, the experiments also showed that there were no conflicts between the proposed modules. When employing the proposed approach, the model demonstrated an optimal performance of 91.3% MIoU.
(2)
Evaluating the effectiveness of the Rapid Redundant Feature-Generation (RRG) module:
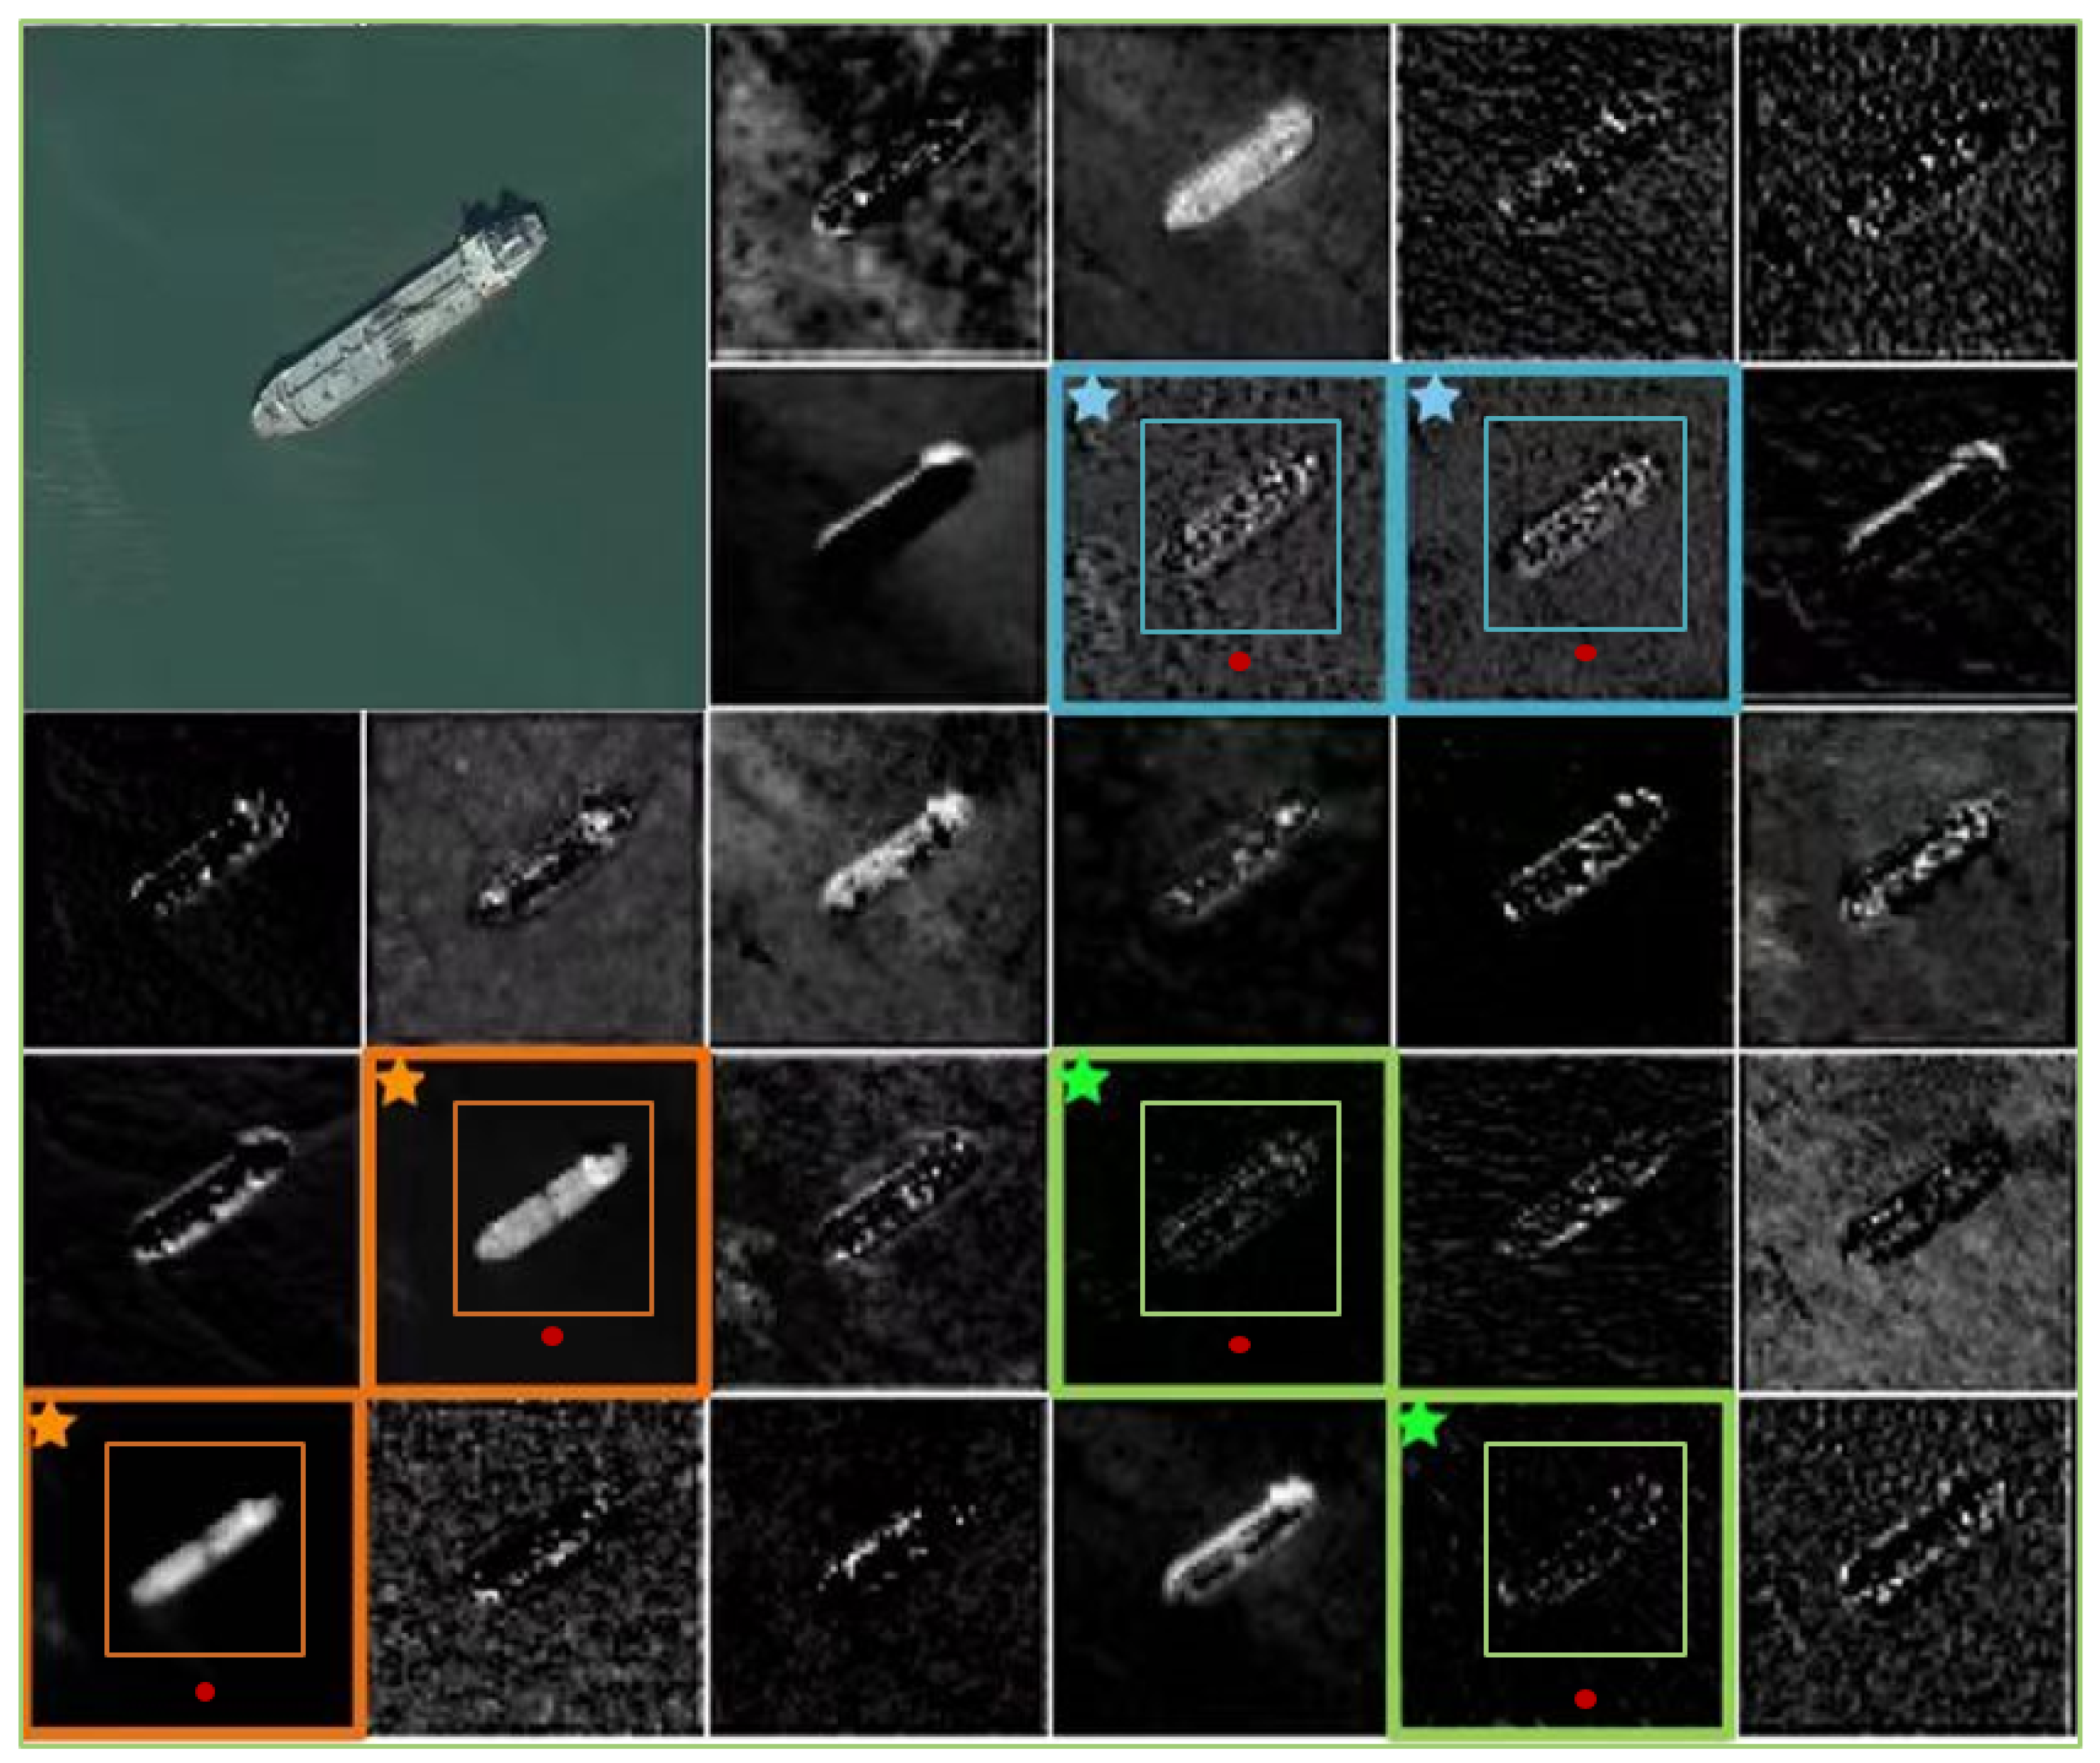
From Table 2, we observe the following results for RRG ( × 10 3 ) at different depths, d = 1, d = 3, d = 5, and d = 7, with corresponding values in Figure 5 red, yellow, and green categories as 4.0, 3.4, 3.3, 3.2; 25.0, 24.5, 24.2, 23.7; and 12.0, 11.1, 11.0, 10.9, respectively. All the Mean-Squared Error (MSE) values are very small, indicating strong correlations between feature maps in deep neural networks, and that these redundant feature maps can be generated from a few intrinsic feature maps. Based on this correlation, excess feature maps can be efficiently derived from core feature maps. Although convolution operations were primarily used in our experiments, other low-cost linear operations could also be considered for constructing this module. However, convolution, as an efficient operation, is already well-supported by hardware devices and can implement a variety of common linear operations such as smoothing, blurring, and motion processing. Theoretically, we could adjust the size of each filter in the linear operations, but such irregular modules might reduce the computational efficiency of processing units (like CPUs and GPUs). Therefore, in our RRMSA-Net, using the RRG module is the optimal choice for achieving the best performance.
(3)
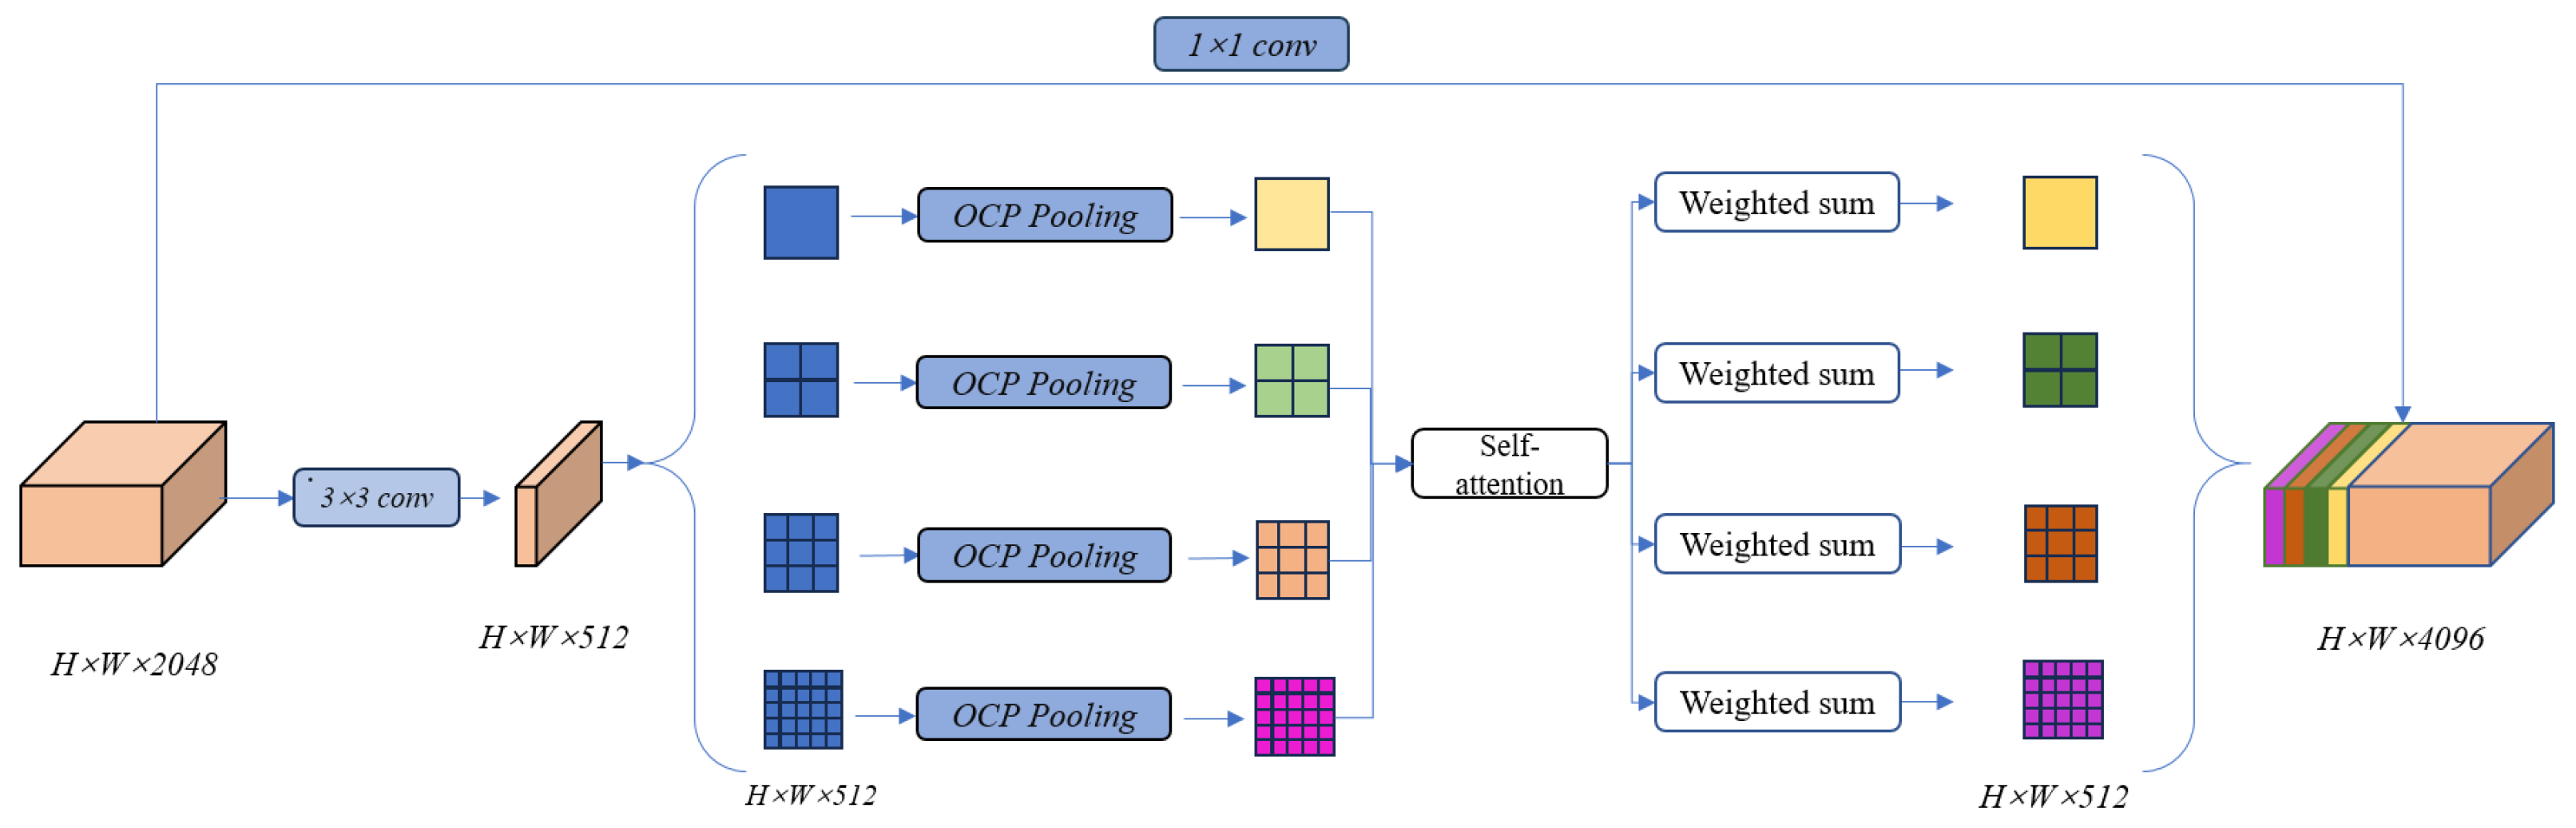
Evaluating the effectiveness of the multi-level spatial aggregation strategy (MSAS):
We selected MSAS as the baseline and summarize all the relevant results in Table 3. We observed that ASP-MSAS consistently improved performance in both the spatial attention (SA) and Inter-scale Attention (ISA) schemes, while MSAS showed a slight performance increase compared to the baseline object context (OC) mechanism. In Formula (3), we found that our method consistently outperformed the baseline under different group settings, and achieved the best results when the number of groups was set to eight. Therefore, in all experiments, we defaulted the number of groups to eight, enabling the model to achieve optimal performance.

3.3. Comparative Experiment

In our latest research, we integrated the Rapid Redundant Feature-Generation module and the multi-level spatial aggregation strategy into the existing architecture of DeepLabv3+, with the aim of creating a more compact and efficient model. Comprehensive experiments were conducted on the LoveDA, LandCoverNet, and PASCAL-VOC datasets.
According to the data presented in Table 4, our RRMSA-Net model achieved approximately twice the computational acceleration and model compression while maintaining the accuracy of the original DeepLabv3+ model architecture. Compared with the latest advanced methods including Thinet [19], NISP [20], Versatile filters [21], and Sparse Structure Selection (SSS) [22], our method exhibited significantly superior performance under a two-× acceleration condition. When we further increased the hyperparameter s to four, the RRMSA-Net model experienced only a 0.3% minor drop in accuracy, while gaining about a four-× increase in computational speed, demonstrating even higher performance efficiency. This study not only validates the effectiveness of RRMSA-Net in constructing efficient deep neural networks, but also proves its ability to maintain outstanding performance in processing large-scale image-recognition tasks, even under resource-constrained conditions.
To validate the RRMSA-Net model’s capabilities in domain adaptation and handling complex backgrounds, we conducted comparative experiments on the LoveDA dataset against the PSPNet, SeNet, and HRNet models, all of which utilize the lightweight MobileNetV2 as their backbone network. The results, presented in Table 5, indicate segmentation accuracy with the PSPNet model recording the lowest Mean Intersection over Union (MIoU) value, followed by SeNet and HRNet [23]. This outcome suggests a shortfall in the feature-extraction capabilities of PSPNet, SeNet, and HRNet, particularly in distinguishing between urban and rural scene features within the LoveDA dataset. Rural scenes are predominantly composed of a few man-made features, like buildings and roads, alongside a vast number of natural objects, such as woodlands. Urban scenes, conversely, feature a blend of buildings and roads, with fewer natural elements. This variance in sample distribution and scale diversity poses challenges for the compared models in accurately classifying land objects.
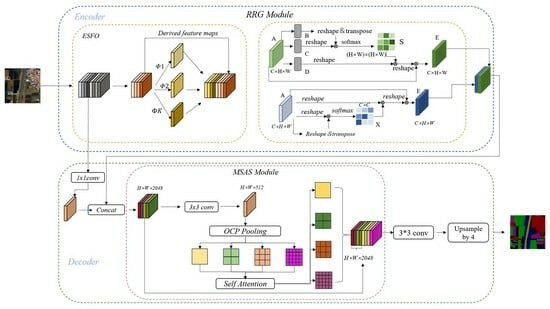
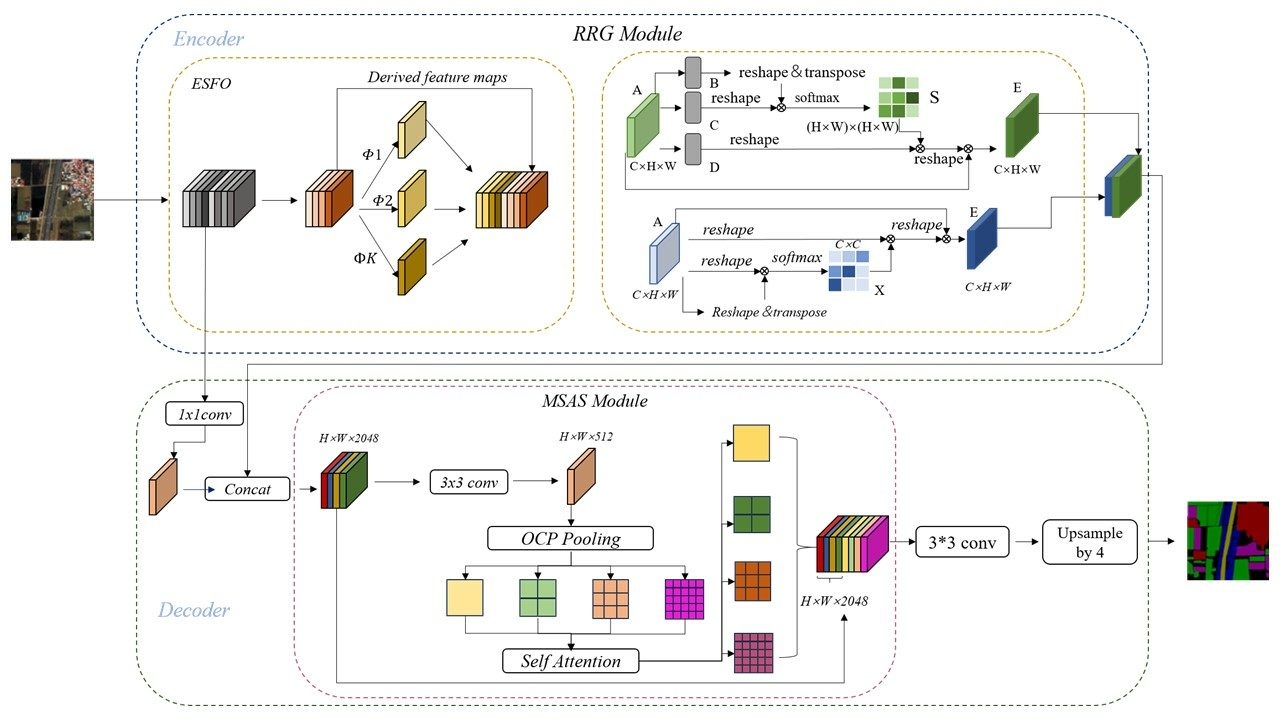
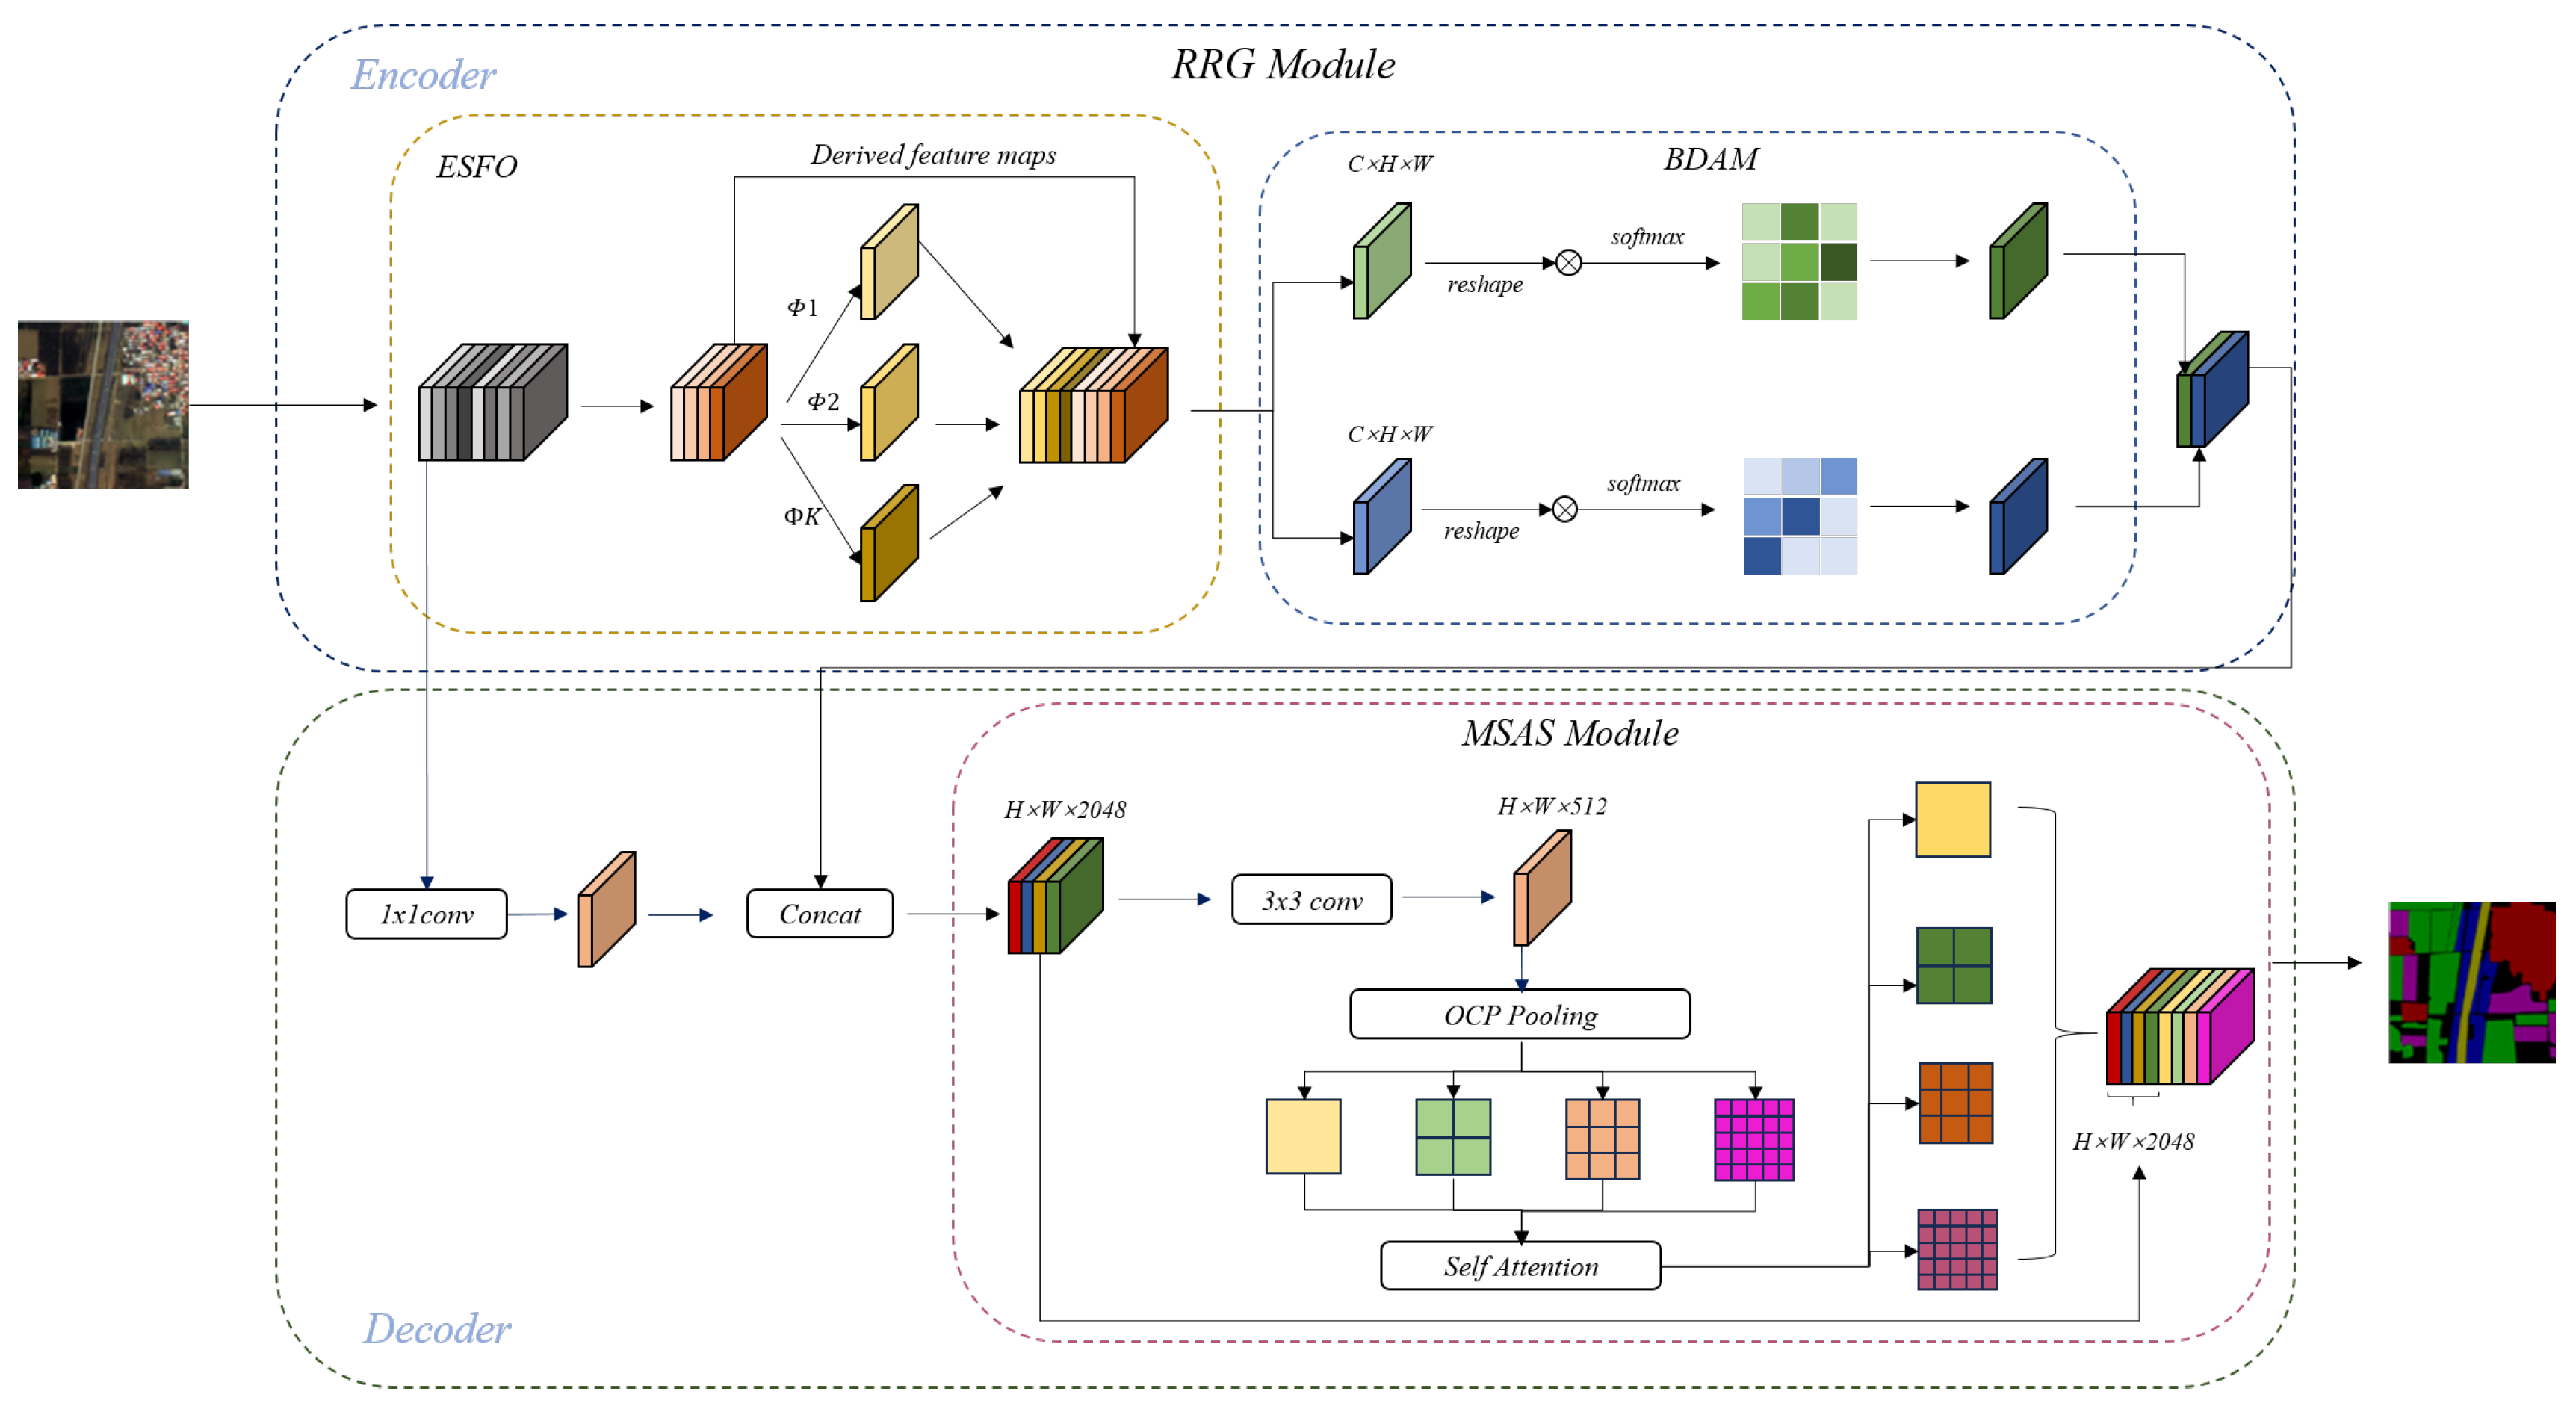
RRMSA-Net enhances feature representation through the RRG module, utilizing the Expand Spatial Feature Overlay (ESFO) strategy and the Boundary Definition and Management (BDAM) mechanism to highlight critical features. Concurrently, the Multi-Scale Aggregation Scheme (MSAS) module improves the model’s grasp on contextual semantics by aggregating neighboring pixels. This comprehensive approach propelled the RRMSA-Net’s MIoU value to 91.3%. These findings underscore RRMSA-Net’s superior performance in processing remote sensing images with pronounced urban–rural contrasts, showcasing its strengths in multi-scale target recognition and domain adaptation.
In Table 6, to verify the generalization ability of the RRMSA-Net model in macro land cover classification tasks, we performed a comparative experiment using the LandCoverNet dataset with the RefineNet [24], SGR [25], and ACNet [26] models. All the compared models utilize ResNet-101 as the backbone network, and the experimental results are presented in Table 6. In terms of segmentation accuracy, RefineNet exhibited the lowest MIoU value, while SGR and ACNet showed marginal improvements compared to RefineNet. The analysis revealed that the macro-geographical nature of the LandCoverNet dataset poses a challenge, indicating limitations in the generalization performance of the compared models across varying geographical environments. Additionally, the dataset employed 10 m resolution remote sensing images, which cannot offer precise pixel information akin to other high-resolution remote sensing images. This might have posed difficulties for the comparison models in identifying and extracting fine details from the images, thereby affecting segmentation accuracy. In comparison to the other three models, RRMSA-Net achieved a superior MIoU value of 45.21%. This is due to the enhanced understanding of the underlying semantic information of target features in remote sensing imagery provided by the RRG and MSAS modules. The results underscore the versatility of the RRMSA-NET model in handling diverse geographical regions and land types.
In Table 7, to assess the capability of the RRMSA-Net model in processing unmanned aerial vehicle (UAV) imagery tasks, we conducted comparative experiments using the DroneDeploy dataset against models such as Attention+SSL [27], CE2P [28], and CNIF [29], all of which incorporate the RRG module as their backbone network. The results are presented in Table 3. In terms of segmentation accuracy, the model with Attention + SSL applied to PSPNet recorded the lowest Mean Intersection over Union (MIoU) value, followed by CE2P and CNIF. This outcome can be attributed to the susceptibility of UAV imagery to lighting conditions; shadows can obscure ground features, complicating the identification of areas concealed by shadows for the comparative models. Additionally, Attention + SSL, CE2P, and CNIF did not effectively retain sufficient detail when extracting higher level abstract features, failing to achieve a balance between global context and local detail information, which resulted in lower segmentation accuracy. In contrast, RRMSA-Net achieved the best performance with an MIoU value of 57.39%, thanks to the MSAS module’s employment of a sparse self-attention mechanism, which enhanced the model’s focus on target features, thereby improving segmentation accuracy. These findings underscore the RRMSA-Net model’s utility and robustness in handling UAV aerial imagery.
To validate the generalization ability of the RRMSA-Net model in macroscopic land cover classification tasks, comparative experiments were conducted based on the PASCAL VOC dataset against models such as U-Net [30], the FCN, and SegNet [31], all of which utilize RRG as their backbone network. The experimental results are shown in Table 8. In terms of segmentation accuracy, the MIoU value of the FCN was the lowest, with U-Net and SegNet showing certain improvements over the FCN. The analysis suggests that this is due to the PASCAL VOC dataset including images under various illumination conditions, scales, and occlusions. The comparative models struggle to correctly identify areas obscured by shadows, as they lose detail information during the convolution and pooling processes. Furthermore, the presence of objects at different scales in the images makes it challenging for the models to segment all scale pairs accurately, thereby affecting the segmentation precision of the models. In contrast, the MIoU of RRMSA-Net reached the highest value of 86.35%, attributed to the RRG module and MSAS module enhancing the model’s understanding of the underlying semantic information of terrestrial objects in remote sensing images. This result demonstrates the RRMSA-NET model’s applicability in processing different geographical areas and land types.
The experimental results fully demonstrate the effectiveness of our proposed RRMSA-Net in enhancing the performance of deep neural networks, especially in handling complex semantic segmentation tasks, effectively improving the accuracy and efficiency of the model.
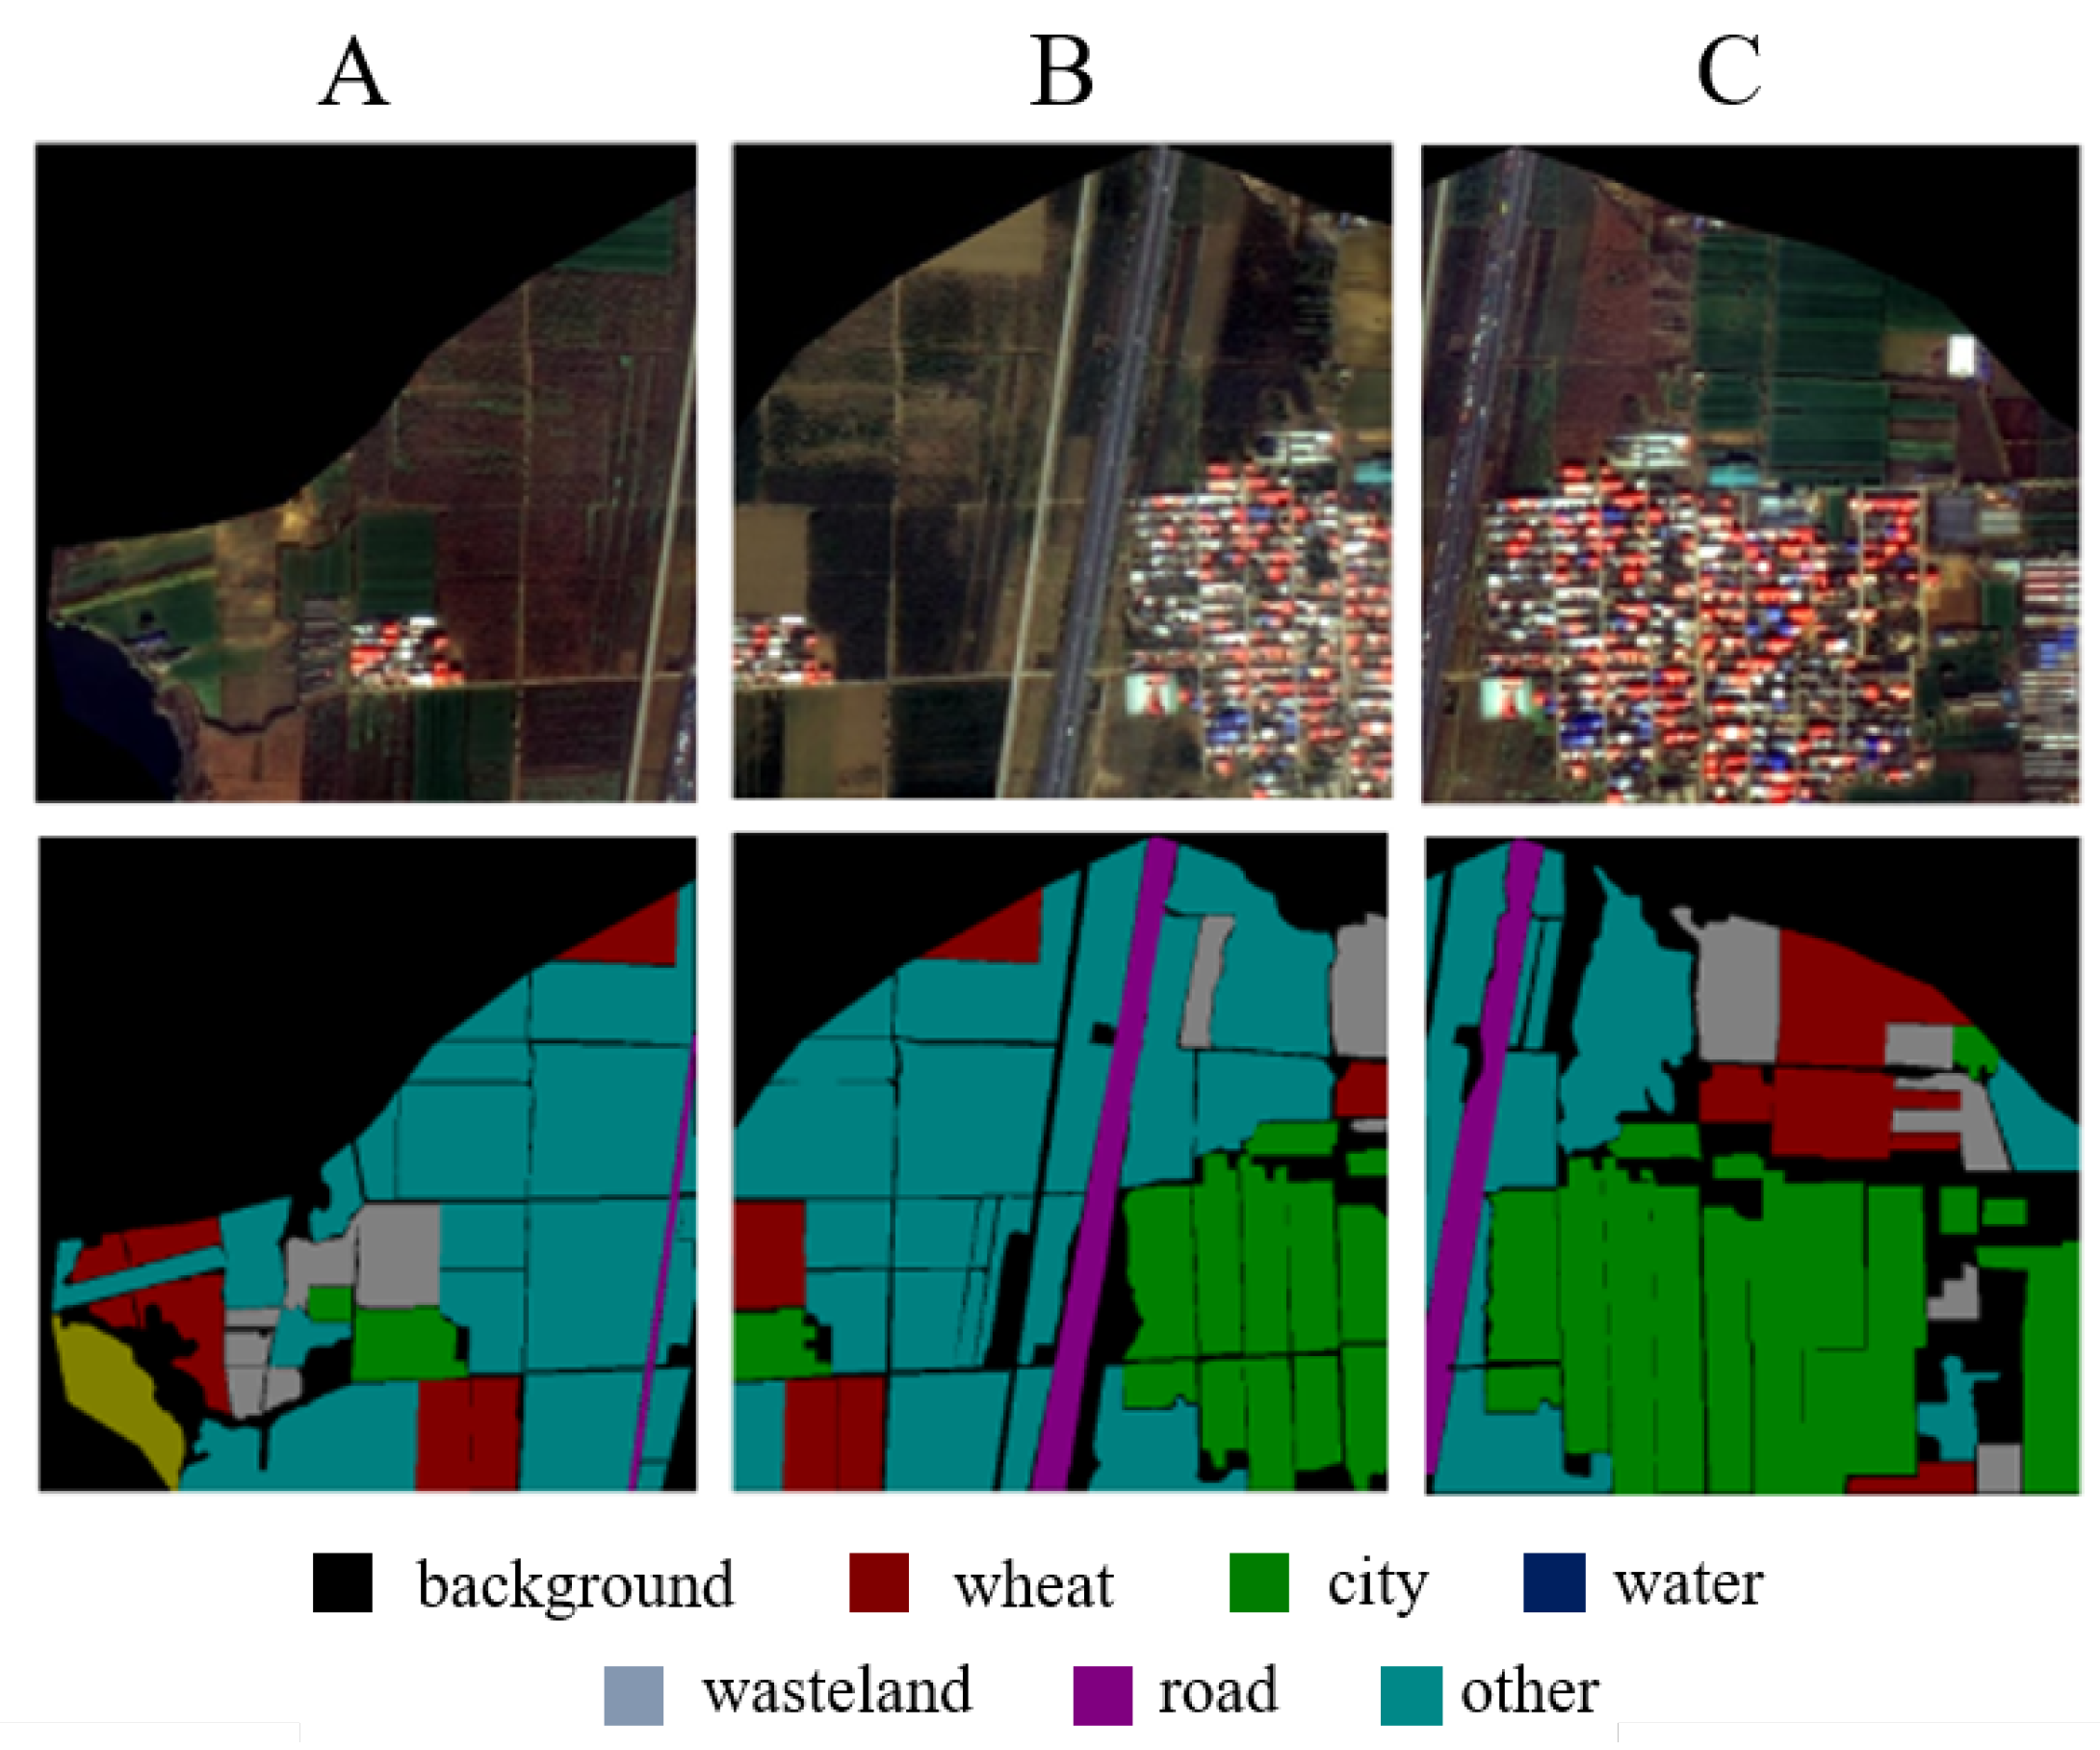
To validate the generalization capability of RRMSA-Net, we applied it to the ACGF agricultural dataset, focusing on the extraction of winter wheat distribution. Figure 6A demonstrates the significant advantage of RRMSA-Net in extracting winter wheat, particularly in terms of boundary segmentation. The boundaries of the winter wheat are more distinct and retain finer details, avoiding excessive smoothing of edges. Figure 6B highlights the model’s exceptional performance in extracting other crops, with smoother and more precise edge processing. The model accurately identifies the corners of crop fields, showing notable precision. Moreover, the extraction of urban roads is comprehensive, showcasing the model’s capability to achieve high segmentation accuracy. Figure 6C illustrates precise urban area extraction, accurately segmenting different sections of the city and clearly delineating the boundaries between roads and their surroundings. This underscores RRMSA-Net’s proficiency in recognizing and segmenting edge features in complex urban scenes, further affirming its effectiveness in precise object recognition.
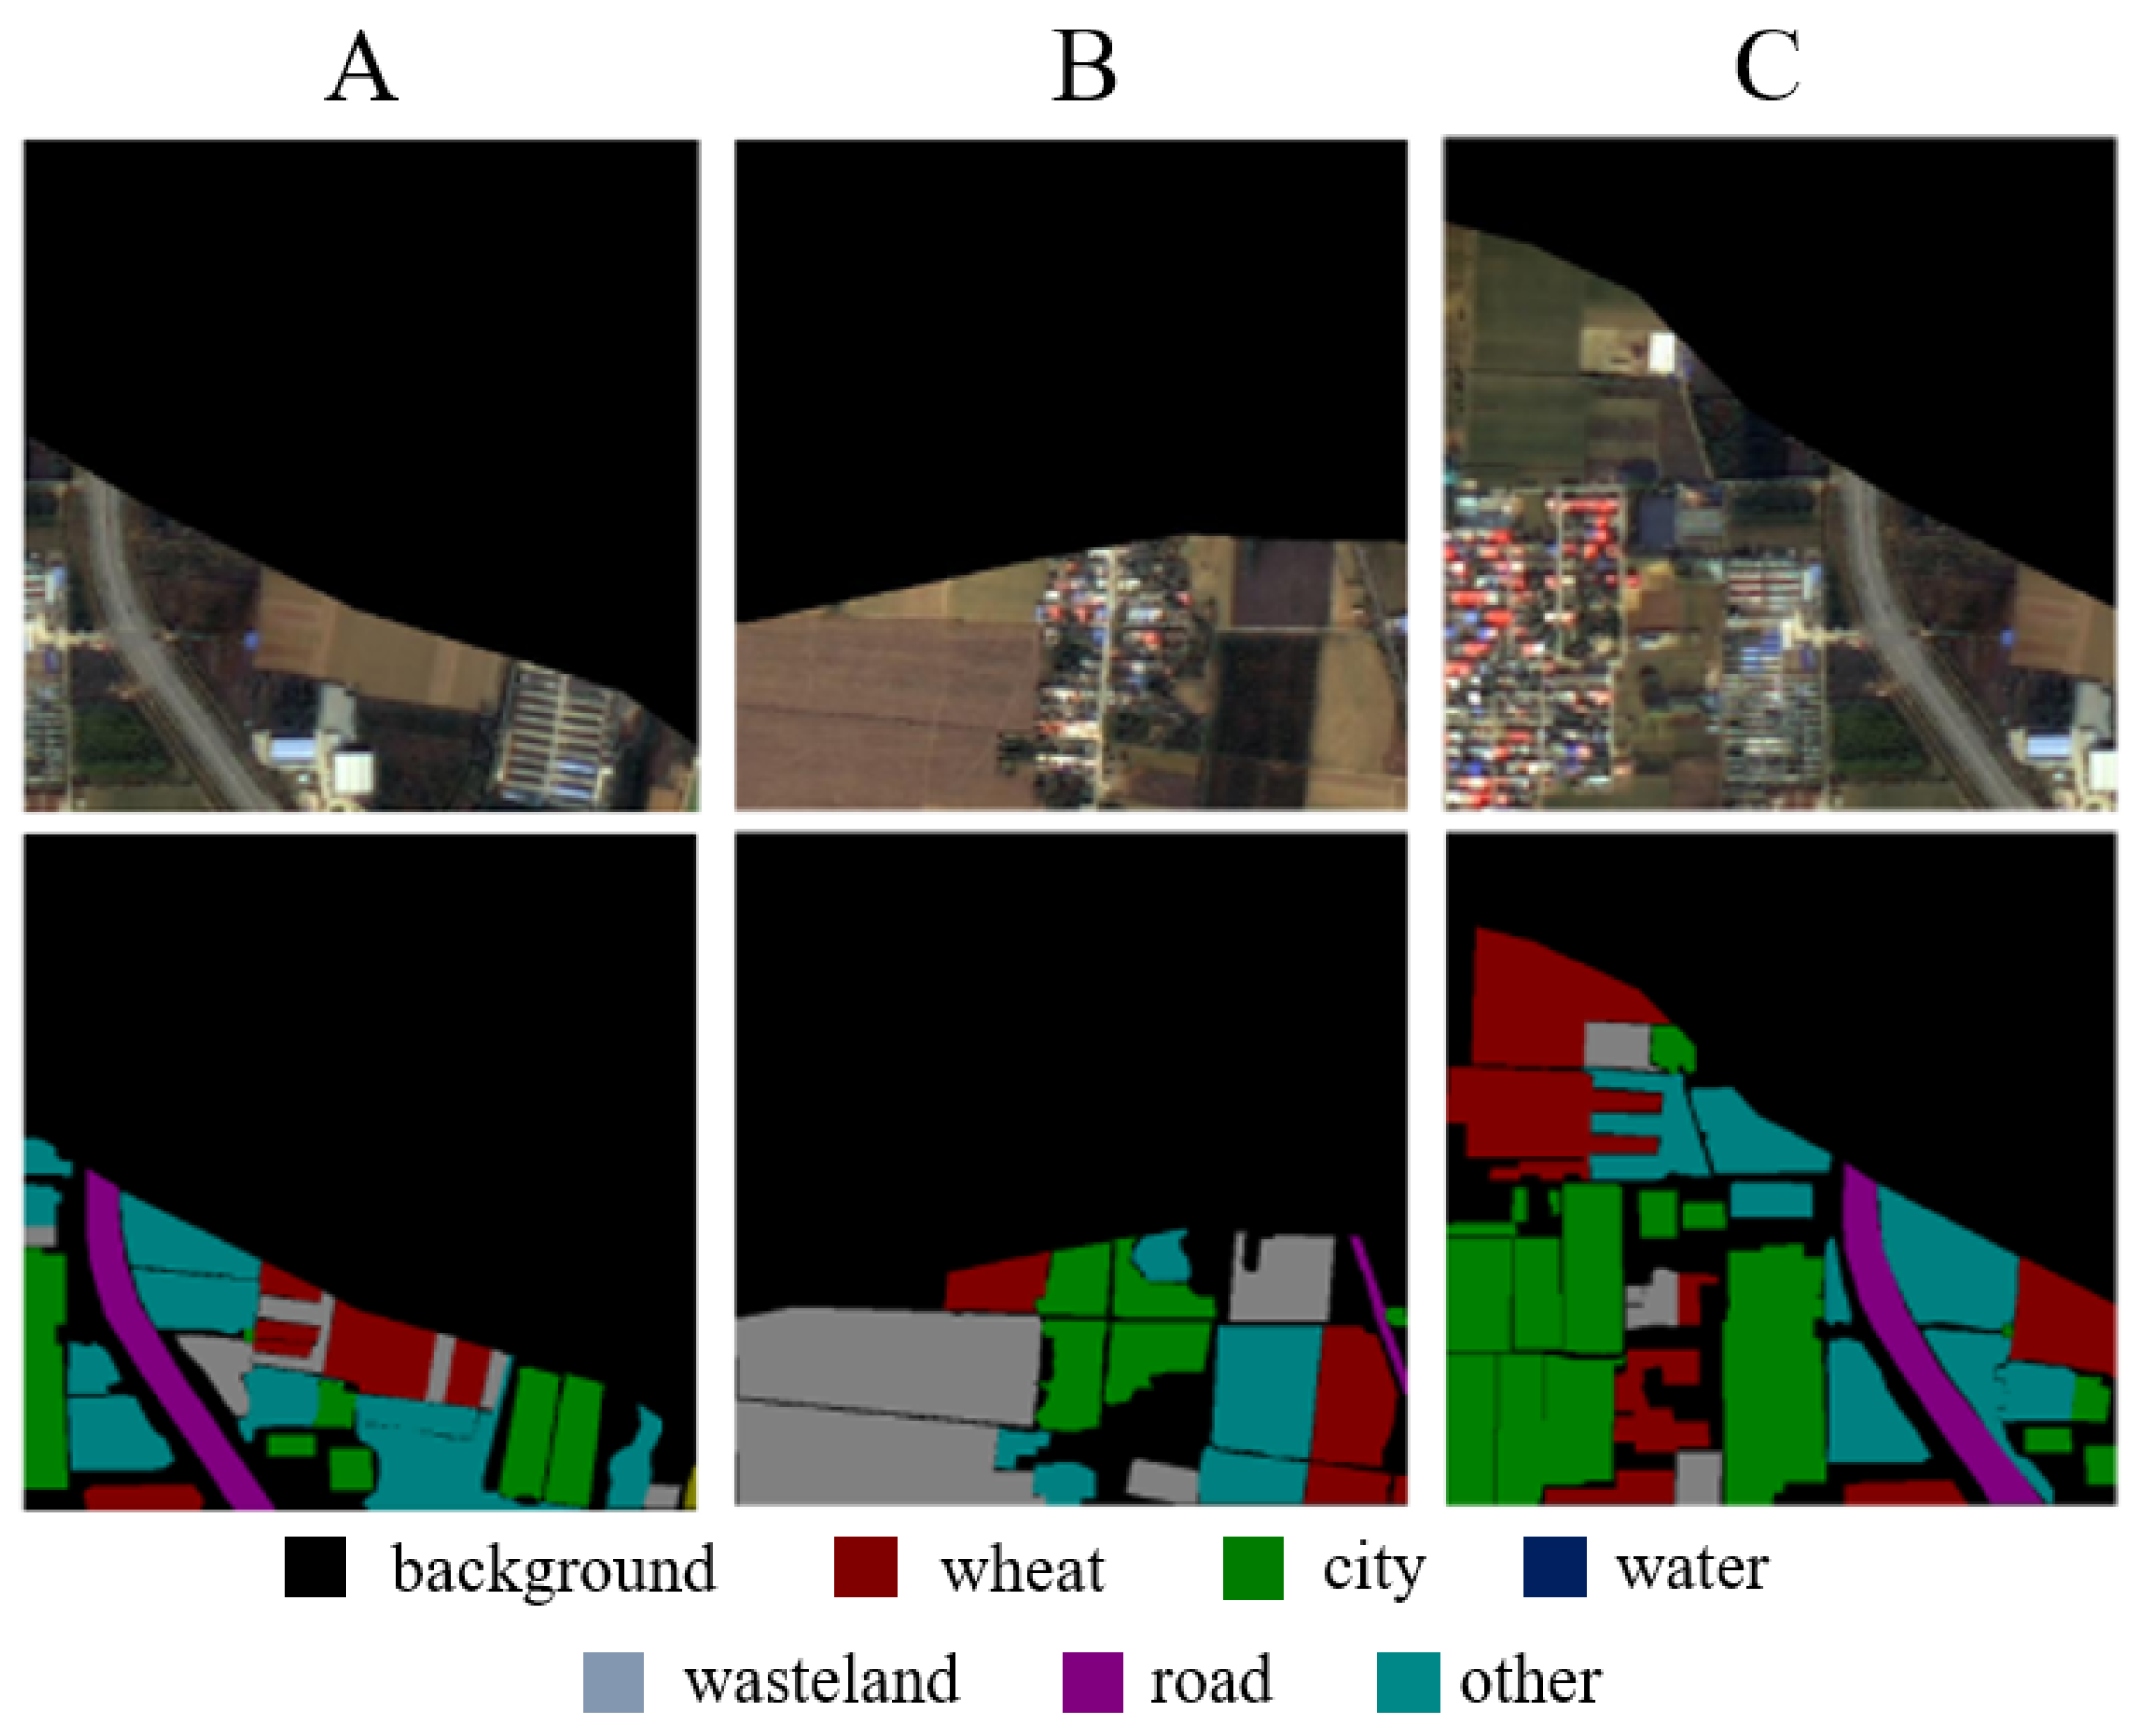
In Figure 7A, RRMSA-Net successfully differentiates between other crops and winter wheat, achieving pronounced clarity in boundary delineation. It skillfully identifies urban and barren landscapes amidst winter wheat, accurately outlining their contours and perimeters. This demonstrates its ability to discern and distinguish between different terrain features. In Figure 7B, the model adeptly navigates transitions between roads, urban spaces, and wheat fields, showcasing its precision in road delineation and maintaining segmentation accuracy across natural terrains. Figure 7C introduces urban topographical segmentation, where RRMSA-Net precisely demarcates city areas with smoother boundaries. The consistency in edge detection across roads and various crops underscores the model’s ability to accurately capture category-specific information for distinct types of land.

4. Conclusions

In this study, we comprehensively detailed the two pivotal modules of the semantic segmentation network for RS imagery and elucidated their respective roles. The Rapid Redundant Feature-Generation module, integrating lightweight convolutional strategies and feature selection techniques, significantly diminishes computational complexity during feature extraction. This methodology not only curtails the parameter count of the network, but also sustains the integrity of feature extraction. Concurrently, the multi-level spatial aggregation strategy module, through the amalgamation of feature maps across diverse hierarchical levels, adeptly captures the foundational semantic attributes of targets within RS imagery. For instance, it adeptly handles both high-resolution terrestrial details and expansive features at lower resolutions, thereby facilitating a holistic interpretation of multiscale data inherent in RS imagery. This nuanced approach to feature integration empowers the network to more precisely discern and categorize a variety of terrestrial phenomena within RS images, thereby augmenting the overall efficacy of semantic segmentation in this domain. Empirical evidence from our experiments demonstrates that our approach surpasses contemporary advanced methodologies, including Thinet, NISP, Versatile filters, and Sparse Structure Selection (SSS), particularly for the PASCAL VOC dataset, marking a pinnacle in performance.
Looking ahead, we aim to investigate the applicability of these modules in handling an expansive array of RS data types. Moreover, their operational viability in scenarios characterized by real-time constraints and limited resources will be a focal point of our future research endeavors, thereby propelling the progress in the field of RS semantic segmentation.

Author Contributions

Conceptualization, R.L. and L.X.; software, R.L.; validation, R.L. and Y.C.; investigation, R.L. and L.S.; methodology, X.M.; formal analysis, R.L. and S.X.; resources, R.L. All authors have read and agreed to the published version of the manuscript.

Funding

1. National Natural Science Foundation of China, Grant No. 32372239; 2. Henan Province Major Science and Technology Project, Grant No. 221100110700.

Data Availability Statement

Conflicts of Interest

The authors declare no conflicts of interest.

References

  1. Surový, P.; Ribeiro, N.A.; Panagiotidis, D. Estimation of positions and heights from UAV-sensed imagery in tree plantations in agrosilvopastoral systems. Int. J. Remote Sens. 2018, 39, 4786–4800. [Google Scholar] [CrossRef]
  2. Long, J.; Shelhamer, E.; Darrell, T. Fully Convolutional Networks for Semantic Segmentation. arXiv 2015, arXiv:1411.4038. [Google Scholar]
  3. Zhao, H.; Shi, J.; Qi, X.; Wang, X.; Jia, J. Pyramid scene parsing network. In Proceedings of the 30th IEEE Conference on Computer Vision and Pattern Recognition, CVPR 2017, Honolulu, HI, USA, 21–26 July 2017; pp. 6230–6239. [Google Scholar]
  4. Chen, L.-C.; Zhu, Y.; Papandreou, G.; Schroff, F.; Adam, H. Encoder-decoder with atrous separable convolution for semantic image segmentation. In Proceedings of the European Conference on Computer Vision (ECCV), Munich, Germany, 8–14 September 2018. [Google Scholar]
  5. Bahdanau, D.; Cho, K.; Bengio, Y. Neural machine translation by jointly learning to align and translate. arXiv 2014, arXiv:1409.0473. [Google Scholar]
  6. Sandler, M.; Howard, A.; Zhu, M.; Zhmoginov, A.; Chen, L.-C. Mobilenetv2: Inverted residuals and linear bottlenecks. In Proceedings of the IEEE Conference on Computer Vision and Pattern Recognition, Salt Lake City, UT, USA, 18–23 June 2018. [Google Scholar]
  7. Howard, A.; Sandler, M.; Chu, G.; Chen, L.C.; Chen, B.; Tan, M.; Wang, W.; Zhu, Y.; Pang, R.; Vasudevan, V.; et al. Searching for mobilenetv3. In Proceedings of the IEEE/CVF International Conference on Computer Vision, Seoul, Republic of Korea, 27 October–2 November 2019. [Google Scholar]
  8. Hu, J.; Shen, L.; Sun, G. Squeeze-and-excitation networks. In Proceedings of the IEEE Conference on Computer Vision and Pattern Recognition, Salt Lake City, UT, USA, 18–23 June 2018. [Google Scholar]
  9. Zhang, X.; Zhou, X.; Lin, M.; Sun, J. Shufflenet: An extremely efficient convolutional neural network for mobile devices. In Proceedings of the IEEE Conference on Computer Vision and Pattern Recognition, Salt Lake City, UT, USA, 18–23 June 2018. [Google Scholar]
  10. Wang, R.J.; Li, X.; Ling, C.X. Pelee: A real-time object detection system on mobile devices. Adv. Neural Inf. Process. Syst. 2018, 31, 1963–1972. [Google Scholar]
  11. Howard, A.G.; Zhu, M.; Chen, B.; Kalenichenko, D.; Wang, W.; Weyand, T.; Andreetto, M.; Adam, H. Mobilenets: Efficient convolutional neural networks for mobile vision applications. arXiv 2017, arXiv:170404861. [Google Scholar]
  12. Xia, T.; He, Z.; Cai, Z.; Wang, C.; Wang, W.; Wang, J.; Hu, Q.; Song, Q. Exploring the potential of Chinese GF-6 images for crop mapping in regions with complex agricultural landscapes. Int. J. Appl. Earth Obs. Geoinf. 2022, 107, 102702. [Google Scholar] [CrossRef]
  13. Wang, J. LoveDA: A Remote Sensing Land-Cover Dataset for Domain Adaptive Semantic Segmentation. arXiv 2021, arXiv:2110.08733. [Google Scholar]
  14. Alemohammad, H.; Booth, K. LandCoverNet: A global benchmark land cover classification training dataset. arXiv 2020, arXiv:2012.03111. [Google Scholar]
  15. Parmar, V.; Bhatia, N.; Negi, S.; Suri, M. Exploration of optimized semantic segmentation architectures for edge-deployment on drones. arXiv 2020, arXiv:200702839. [Google Scholar]
  16. Noh, H.; Hong, S.; Han, B. Learning deconvolution network for semantic segmentation. In Proceedings of the IEEE International Conference on Computer Vision, Santiago, Chile, 7–13 December 2015; pp. 1520–1528. [Google Scholar]
  17. Fan, M.; Lai, S.; Huang, J.; Wei, X.; Chai, Z.; Luo, J.; Wei, X. Rethinking bisenet for real-time semantic segmentation. In Proceedings of the IEEE/CVF Conference on Computer Vision and Pattern Recognition, Nashville, TN, USA, 20–25 June 2021. [Google Scholar]
  18. Kampffmeyer, M.; Salberg, A.-B.; Jenssen, R. Semantic segmentation of small objects and modeling of uncertainty in urban remote sensing images using deep convolutional neural networks. In Proceedings of the IEEE Conference on Computer Vision and Pattern Recognition Workshops, Las Vegas, NV, USA, 26 June–1 July 2016. [Google Scholar]
  19. Luo, J.H.; Wu, J.; Lin, W. Thinet: A filter level pruning method for deep neural network compression. In Proceedings of the IEEE International Conference on Computer Vision, Venice, Italy, 22–29 October 2017; pp. 5058–5066. [Google Scholar]
  20. Yu, R.; Li, A.; Chen, C.F.; Lai, J.H.; Morariu, V.I.; Han, X.; Gao, M.; Lin, C.Y.; Davis, L.S. Nisp: Pruning networks using neuron importance score propagation. In Proceedings of the IEEE Conference on Computer Vision and Pattern Recognition, Salt Lake City, UT, USA, 18–23 June 2018; pp. 9194–9203. [Google Scholar]
  21. Wang, Y.; Xu, C.; Xu, C.; Xu, C.; Tao, D. Learning versatile filters for efficient convolutional neural networks. Adv. Neural Inf. Process. Syst. 2018, 31, 1608–1618. [Google Scholar]
  22. Huang, Z.; Wang, N. Data-driven sparse structure selection for deep neural networks. In Proceedings of the European Conference on Computer Vision (ECCV), Munich, Germany, 8–14 September 2018; pp. 304–320. [Google Scholar]
  23. Wu, H.; Liang, C.; Liu, M.; Wen, Z. Optimized HRNet for image semantic segmentation. Expert Syst. Appl. 2021, 174, 114532. [Google Scholar] [CrossRef]
  24. Lin, G.; Milan, A.; Shen, C.; Reid, I. Refinenet: Multi-path refinement networks for high-resolution semantic segmentation. In Proceedings of the IEEE Conference on Computer Vision and Pattern Recognition, Honolulu, HI, USA, 21–26 July 2017; pp. 1925–1934. [Google Scholar]
  25. Liang, X.; Hu, Z.; Zhang, H.; Lin, L.; Xing, E.P. Symbolic graph reasoning meets convolutions. Adv. Neural Inf. Process. Syst. 2018, 31, 1853–1863. [Google Scholar]
  26. Ding, X.; Guo, Y.; Ding, G.; Han, J. Acnet: Strengthening the kernel skeletons for powerful cnn via asymmetric convolution blocks. In Proceedings of the IEEE/CVF International Conference on Computer Vision, Seoul, Republic of Korea, 27 October–2 November 2019; pp. 1911–1920. [Google Scholar]
  27. Nosofsky, R.M. Attention, similarity, and the identification–categorization relationship. J. Exp. Psychol. Gen. 1986, 115, 39. [Google Scholar] [CrossRef] [PubMed]
  28. Ruan, T.; Liu, T.; Huang, Z.; Wei, Y.; Wei, S.; Zhao, Y. Devil in the details: Towards accurate single and multiple human parsing. Proc. AAAI Conf. Artif. Intell. 2019, 33, 4814–4821. [Google Scholar] [CrossRef]
  29. Wang, W.; Zhou, T.; Qi, S.; Shen, J.; Zhu, S.-C. Hierarchical human semantic parsing with comprehensive part-relation modeling. IEEE Trans. Pattern Anal. Mach. Intell. 2021, 44, 3508–3522. [Google Scholar] [CrossRef]
  30. Siddique, N.; Paheding, S.; Elkin, C.P.; Devabhaktuni, V. U-net and its variants for medical image segmentation: A review of theory and applications. IEEE Access 2021, 9, 82031–82057. [Google Scholar] [CrossRef]
  31. Badrinarayanan, V.; Kendall, A.; Cipolla, R. Segnet: A deep convolutional encoder-decoder architecture for image segmentation. IEEE Trans. Pattern Anal. Mach. Intell. 2017, 39, 2481–2495. [Google Scholar] [CrossRef]
Figure 1. The RRMSA-Net model consists of two phases: encoding and decoding. In the encoding phase, RRG serves as the backbone network, rapidly generating features and expanding dimensions through the Efficient Squeeze-and-Excitation Feature Optimization (ESFO) strategy, while integrating the Bilateral Dual-Attention Mechanism (BDAM) to enhance feature representation and improve semantic segmentation accuracy. In the decoding phase, MSAS employs multi-scale pyramid pooling, object context pooling, and sparse self-attention mechanisms to increase the channel dimensionality and depth of expression in feature maps, thereby enhancing the semantic segmentation analysis capability in complex scenarios.
Algorithms 17 00151 g001
Figure 2. The details of Position Attention Module.
Algorithms 17 00151 g002
Figure 3. The details of channel attention module.
Algorithms 17 00151 g003
Figure 4. The original feature maps are dimensionally reduced through 1 × 1 convolution, and then concatenated with the output feature maps of the encoding layer, forming the input for the multi-level spatial feature aggregation module (MSAS). MSAS further reduces the dimensionality of feature maps using 3 × 3 convolution and implements multi-scale pyramid pooling on this basis, capturing cross-level spatial information through an object context pooling (OCP) strategy. Additionally, a sparse self-attention mechanism is introduced to perform a weighted summation of the feature maps, thereby enhancing the model’s focus on key features. The processed feature maps are then concatenated with new feature maps whose number of channels has been increased (expanded from 512 channels to 2048 channels). This step not only significantly enhances the channel dimensionality of the feature maps, but also enriches the depth and detail of feature representation, providing more precise and detailed feature information for the model’s final output, thereby enhancing the model’s analytical capability and depth of semantic understanding in complex scenarios.
Algorithms 17 00151 g004
Figure 5. Visualization of some feature maps generated by the first residual group in RRG, where three similar feature map pair examples are annotated with boxes of the same color. One feature map in the pair can be approximately obtained by transforming the other one through inexpensive operations.
Algorithms 17 00151 g005
Figure 6. Visualization of partial segmentation results from the RRMSA-Net model.
Algorithms 17 00151 g006
Figure 7. The visualization application of RRMSA-Net’s segmentation results.
Algorithms 17 00151 g007
Table 1. Effects of each component of RRMSA-Net on ACGF dataset.
With RRG?With MSAS?MIoU
××82.9%
🗸×85.4%
×🗸86.2%
🗸🗸91.3%
Table 2. Comparison between MSE error and different kernel sizes.
MSE ( 10 3 )d = 1d = 3d = 5d = 7
Blue pair5.04.24.34.5
Yellow pair35.036.534.233.7
Green pair22.021.121.020.9
Table 3. Influence of P h and P w , the order of global relation and local relation within the interlaced sparse self-attention on LOveDA.
Method P h P w Pixel Acc (%)MIoU (%)
Dilated MSAS--96.0875.30
+MSAS-OC4496.3078.97
4896.3278.94
8496.3379.20
8897.8280.62
81696.1979.01
16896.3278.02
161696.3179.40
+MSAS-OC8896.2679.10
Table 4. Comparison of state-of-the-art methods for compressing RRG on PASCAL VOC dataset.
ModelWeights (m)FLOPs (b)MIoU (%)Acc (%)
ResNet-5023.74.175.392.2
Thinet-ResNet-5015.42.672.190.3
NISP-ResNet-50-B14.22.2-90.8
Versatile-ResNet-5011.13.174.591.7
SSS-ResNet-50-2.974.291.8
MSAS-ResNet-50 (s = 2)12.92.475.092.3
Shift-ResNet-506.2-70.690.1
Taylor-FO-BN-ResNet-507.81.471.7-
Slimmable-ResNet-50 0.5×6.51.272.1-
MetaPruning-ResNet-50-1.173.4-
RRG-ResNet-50 (s = 4)6.21.074.192.3
Table 5. Comparison with state-of-the-art methods on LoveDA.
MethodBackboneMIoU (%)
PSPNetMobileNet78.4
SeNetMobileNet81.2
HRNetRRG81.6
RRMSA-Net (w/MSAS)RRG83.5
Table 6. Comparison with state-of-the-art methods on LandCoverNet.
MethodBackboneMIoU (%)
RefineNetResNet-10140.20
SGRResNet-10144.30
ACNetResNet-10145.06
RRMSA-Net (w/MSAS)RRG45.21
Table 7. Comparison with state-of-the-art methods on DroneDeploy.
MethodBackboneMIoU (%)
Attention + SSLRRG44.73
CE2PRRG53.10
CNIFRRG56.90
RRMSA-Net (w/MSAS)RRG57.39
Table 8. Comparison with state-of-the-art methods on PASCAL VOC.
MethodBackboneMIoU (%)
FCNRRG73.25
U-NetRRG76.35
SegNetRRG80.10
RRMSA-Net (w/MSAS)RRG86.35
Disclaimer/Publisher’s Note: The statements, opinions and data contained in all publications are solely those of the individual author(s) and contributor(s) and not of MDPI and/or the editor(s). MDPI and/or the editor(s) disclaim responsibility for any injury to people or property resulting from any ideas, methods, instructions or products referred to in the content.

